
7
Implementing a Risk-Based Strategy for Investments in Federal Facilities’ Maintenance and Repair
The implementation of a more strategic, risk-based approach to investments in maintenance and repair will require changes in procedures and mindsets. It may also require a substantial investment of staff time and expertise up-front. Each agency will need to determine the most effective way to move to a risk-based investment strategy, depending on the information that it has available and its processes, resources, and culture. Once the key elements are established, however, a risk-based approach should provide for a much more effective and transparent process for decision-making about the allocation of resources for maintenance and repair activities. As the new procedures are repeated, they will become ingrained in the organizational culture and in the workforce and will require less time and effort to execute.
This chapter shows how some of the committee’s recommendations could be put into action by federal facilities program managers. Topics include measures of outcomes, linking maintenance and repair investments and outcomes to a mission, guidelines for developing an annual funding request, predicting outcomes of a given level of investment in maintenance and repair, and methods for identifying risks related to deteriorating facilities.
Because missions, programs, culture, and practices vary widely among federal agencies, each agency will need to adapt the committee’s guidance and examples to its own situation. It may be wise to begin with pilot projects to work through the approach before applying it to an entire organization. In addition, collaboration among agencies on pilot projects could help to identify and resolve issues more quickly and thereby help to implement risk-based approaches in all federal agencies.
Outcomes of individual projects (project goals) are identified during the project planning and definition phase and can range from maintaining a heating, ventilation, and air-conditioning (HVAC) system to operate at the manufacturer’s specified (or original) level of efficiency, or repairing or replacing a roof, to repairing or replacing groups of systems to achieve a higher level of efficiency (over that originally specified). Whether the project is being accomplished to conserve energy, to ensure mission capability or productivity, to lower operating costs, to improve the condition of military housing, or for any other reason, an individual project, if approached correctly, will have a defined set of outcomes. The outcomes of day-to-day activities (not on a project scale)—such as service calls, preventive maintenance (for example, lubrication and filter changes), and minor equipment replacements—are equally important because of the potential cumulative effect of neglecting them.
Identifying outcomes and the decision-making that leads to them occurs at two levels: portfolio-based (strategic) and project (tactical). Some of the outcomes identified (such as operating costs, energy use, and reliability) are more easily quantified at the portfolio level and others are more easily applied at the project level. Some (depending on the specific measure used for a given outcome) have meaning at only one of the two levels.
Regardless of how an agency goes about defining the outcomes to be achieved through its maintenance and repair program, appropriate measures are needed for planning and programming, budget development, and identifying the results of investments.
In Chapter 2, the committee identified an array of beneficial outcomes that can result from investments in maintenance and repair. All of them can be measured by using available data, technologies, and tools. Most of the measurements will be based on information that is developed after the fact (lagging measures). However, some outcomes, such as reliability and physical condition can be predicted (leading measures), that is, the outcomes of investments can be estimated before an investment is made, or before it is decided not to make the investment (the do-nothing case).
Governmentwide measures have been developed for operating costs, building condition (in the form of an index modeled on financial measures), energy use, water use, and space utilization. Deferred maintenance and repairs is also being reported, although the methods for estimating deferred maintenance and repairs vary. Government-wide measures to track greenhouse gas emissions are being developed.
In Chapter 3, the committee identified engineering-research-based indexes and models that can be used to measure the physical condition of buildings, building components, and some types of infrastructure. Risk assessment and consequence are embedded into the indexes. The indexes can also be used to predict the future physical condition of components and their remaining service lives. In
doing so, they can help to identify the best time to invest in maintenance and repair so that service lives are optimized and so that systems and components can be replaced before they fail. Condition-index values can be rolled up to determine the physical condition of systems, buildings, groups of buildings or entire portfolios of buildings and infrastructure. An index to measure outcomes related to building functionality was also identified.
In this chapter, the committee identifies data sources and methods for developing measures related to reliability, accidents and injuries, building-related illnesses, claims and lawsuits, efficient operations, life-cycle costs, customer satisfaction, and public image. Because those outcomes are not now typically measured by federal agencies, they present an opportunity to collaborate to develop government-wide measures based on evidence-based empirical information. Ideally, such measures would quantify the relationships between the amount of resources invested in maintenance and repair and different levels of outcomes and risk. Such measures may require the development of models and more empirical evidence than is now available.
Table 7.1 replicates the beneficial outcomes identified in Chapter 2 and identifes related performance measures. The data, tools, and technologies that can be used to develop outcome-related measures are described in greater detail in the following section. The committee cautions that agencies should, to the extent possible, ensure that performance measures are aligned to achieve complementary objectives. Conflicts in performance measures should occur only when tradeoffs are indicated.
Measures of Mission-Related Outcomes
Reliability. Reliability of individual systems and components can be quantifed as a percentage of time that they were operating in support of an agency’s mission or programs. It can also be tracked as the percentage and cost of unplanned outages. Unplanned outages would need to be consistently defined but could include such events as loss of power because of faulty electrical systems, time lost when all or parts of a facility must be evacuated because of flooding from deteriorated water lines or as a result of faulty alarm systems, and the like. The number and type of unplanned outages can be measured by using data collected by computerized maintenance management systems (CMMS), building automation systems (BAS), or another asset management systems. The percentage can be measured as a ratio of hours of unplanned downtime (X hours, X days) to hours of required operating time (X hours per year, X days per year). The cost of unplanned outages could be estimated by applying an average hourly labor rate to the number of people affected and multiplying by the number of hours of downtime (this calculation could also be used to track loss of productivity). If an outage resulted in damage to equipment, research, artifacts or other property, these costs could also be quantified and added to the cost of bringing all systems back online.
TABLE 7.1 Beneficial Outcomes That Can Result from Investments in Maintenance and Repair and Outcome-Related Measures
|
|
|||
| Objectives | Outcomes | Measures | |
|
|
|||
| Mission-related | Improved reliability |
Percentage of downtime Cost of downtime Cost of damage Service life or remaining service life |
|
| Improved productivity |
Output measures |
||
| Functionality |
Building functionality index |
||
| Efficient space utilization |
Space utilization as specified by Federal Real Property Council Cost per person (General Services Administration model) |
||
| Compliance-related | Fewer accidents and injuries |
Recordable incident rate Lost time incident rate Number and cost of worker compensation claims |
|
| Fewer building-related illnesses |
Number and cost of worker compensation claims |
||
| Fewer insurance claims, lawsuits, and regulatory violations |
Number and cost of worker compensation claims Number and cost of citations or violations of regulations (such as regulations of the Occupational Safety and Health Administration) |
||
| Condition-related | Improved condition |
Facility condition index (financial) |
|
|
Building condition indexes (physical) and other engineering-based condition indexes identified in Chapter 3 |
|||
| Reduced backlog of deferred maintenance and repairs |
Total cost of deferred maintenance and repairs as reported to Federal Accounting Standards Advisory Board |
||
| Efficient operations | Less reactive or unplanned maintenance |
Ratio of planned maintenance to reactiv maintenance |
|
| Lower operating costs |
Operating costs |
||
| Lower life-cycle costs | Return on investment Net present value Service life extension (years) |
||
| Cost avoidance |
Net present value of maintenance and repair |
||
| Reduced energy use |
Total energy use in British thermal units (Btu) |
||
|
Energy intensity (Btu/sq. ft); kilowatt hours; oil equivalents (gallons) |
|||
| Reduced water use |
Total gallons used |
||
|
Cost per gallon |
|||
| Reduced greenhouse gas emissions |
Measure under development |
||
| Stakeholder-driven | Customer satisfaction |
Surveys Customer service calls |
|
| Improved public image |
Surveys |
||
|
|
|||
This is an instance in which agencies could collaborate to define various categories of outages more specifically and “mine” their CMMS and other systems to develop empirical credible data to make the case for timely investments in maintenance and repair.
Tools and technologies to predict the reliability of equipment and systems have been developed. Reliability-centered-maintenance (RCM), which is used by private-sector organizations and by the National Aeronautics and Space Administration (NASA) and the Smithsonian Institution, takes into account the service lives of equipment and components, the probability of failure, and results. With an RCM approach, it is possible to predict the reliability of some types of equipment and components on the basis of the probability of their failure.
Reliability of building systems and components and some types of infrastructure can also be predicted from the probability of failure by using the physical condition indexes and models of service life and remaining service life described in Chapter 3.
Productivity. Loss of productivity of administrative, Office, or similar types of facilities can be measured as downtime or unplanned outages, as discussed above. Predictive measures of productivity could be developed for manufacturing, some test facilities, or some operations facilities on the basis of the amount of output that can be expected if systems are 100 percent reliable. Loss of productivity could be measured as ratios of output to time and cost.
Functionality. As noted in Chapter 3, an index of the functionality of buildings and building functional areas (such as those for administration, laboratory, storage, and production) that can be used for measuring 14 categories of functionality has been developed. Some of the categories—for example, environmental life-safety, comfort, efficiency, and obsolescence—are directly related to maintenance and repair activities and investments.
Space Utilization. Most agencies are tracking space utilization but the methods for defining and calculating utilization vary. A tool that could be used to track space utilization is the cost-per-person-model (CPPM) developed by the General Services Administration (GSA). The CPPM is an Excel-based tool designed to enable users to benchmark and compute the cost per person for workspace, information technology, telecommunications, telework and other alternative work environments. It can also calculate potential cost savings for different workspace scenarios, such as those which would support telework. Additional information is available at http://www.gsa.gov/portal/content/105134.
Measures of Compliance-Related Outcomes
Accidents and Injuries. In accordance with the Occupational Safety and Health Act of 1970 as amended, and Executive Order 12196 Occupational Safety and Health Programs for Federal Employees, signed on February 26, 1980,
federal agencies are required to track workplace accidents and submit an annual report to the Department of Labor. Federal facilities program managers in concert with the safety Office could request access to this information to be able to review accident causes (such as slips, trips, and falls) and determine which ones could be prevented through maintenance and repair investments. They could then track the outcomes of maintenance and repair investments through such measures as recordable incident rate, lost-time incident rate, or by the number of related worker compensation claims or lawsuits.
The costs of accidents and injuries could be quantified by gathering data from worker compensation claims and lawsuits, if allowed by law, or by the number and cost of citations or violations of regulations (for example, violations of Occupational Safety and Health Administration standards).
Through a collaborative multiyear effort, federal agencies could potentially develop empirical information that compares the cost of maintenance activities required to prevent accidents and injuries with liability and other costs associated with accidents and injuries. Data on the costs of slips, trips, falls, and other accidents may be available from the insurance industry or from research conducted by such federal agencies as the National Institute for Occupational Safety and Health or the National Institutes of Health or from disciplines other than facilities management.
Building-Related Illnesses. Although building-related illnesses are substantially preventable through appropriate operation of building systems and components, including timely maintenance and repair activities, tracking and measuring such illnesses directly is difficult, except for major incidents, such as outbreaks of Legionnaires’ disease. The costs of building-related illnesses could potentially be measured by gathering data from worker compensation claims and lawsuits, if that is allowed by law.
Building-related illnesses are closely related to indoor environmental quality (for example, temperature, humidity, ventilation rates, air particles, and water quality). Data related to those factors can be collected through building automation and energy management systems. Facilities managers should be able to cut down on building-related illnesses by gathering and carefully tracking temperature and other indoor environmental attributes to ensure that they stay within acceptable ranges according to scientific studies or state-of-the-art industry standards and through preventive maintenance activities like those identified in Chapter 2.
One indicator of potential problems related to indoor environmental quality is the type of customer service calls received. Typically, customer service calls are tracked with a CMMS. Calls related to temperature (too hot or too cold), humidity levels, moisture intrusion, air quality (odors), lack of ventilation, or water quality (tastes bad) could indicate that systems are not operating properly and require maintenance, repair, or replacement.
Measures of Condition-Related Outcomes
Most federal agencies already measure condition by using a facilities condition index (FCI) or a Condition Index (CI) as recommended by the Federal Real Property Council (FRPC). Both are lagging measures and they are based on financial data, not on the physical condition of facilities. Agencies also track total backlog of deferred maintenance and repairs and report it to the Federal Accounting Standards Advisory Board, although they use different methods for quantifying backlog.
An array of engineering-based empirically derived condition indexes for specific types of facilities and infrastructure have been developed (see Chapter 3). They can be used not only to quantify physical condition but to predict the probability of failure of building and infrastructure components on the basis of service life and remaining service life.
Measures of Outcomes Related to Efficient Operations
Measures of operating costs, energy use, and water use are already being tracked by most federal agencies as recommended by the FRPC and in accord with other federal directives. A governmentwide method for measuring greenhouse gas emissions is being developed.
Life-Cycle Cost. Life-Cycle Cost (LCC) analyses are generally not used for routine day-to-day maintenance and repair activities. However, most agency-wide maintenance and repair programs also include nonroutine large projects of which LCC analyses could be used to determine return on investment. Circular A-94 of the Office of Management and Budget, Guidelines and Discount Rates for Benefit-Cost Analysis of Federal Programs provides a method that could be adapted for this purpose.
Cost Avoidance. Cost avoidance results from making an investment in the near term that avoids the need for a larger investment later. One method of quantifying cost avoidance would be to analyze project scopes and develop estimates of the cost to an organization if the project is not implemented. Alternatively, failure probability analyses based on models of service life and remaining service life can be conducted. The costs of the probable failure and the costs of immediate investment can be compared on the basis of net present value.
Ratio of Planned Maintenance to Reactive Maintenance. One measure of efficient operations is the ratio of planned or programmed maintenance to reactive (unscheduled) maintenance and repair (such as emergency service calls). The ratio can be an indication of whether a facilities management organization is running smoothly through logically scheduled allocations of manpower and resources or is reacting to unexpected crisis after crisis and wasting resources through inefficient work efforts. The Association of Higher Education Facilities Officers-APPA has suggested that an appropriate ratio of planned maintenance to reactive maintenance is 75 percent or more to 25 percent or less (Rose, 2007), but there is no industry-accepted standard for the appropriate breakdowns of work. Nonetheless,
in the present committee’s opinion, it is safe to say that an organization that is performing more than 50 percent of its maintenance and repair on a reactive basis is not operating efficiently.
CMMS data can be used to track this measure. Comparing rates over time and by season can add definition to the measure through comparisons of similar times and weather conditions. High rates of unscheduled work could also be an indicator of deteriorating condition (which would lead to a higher rate of service calls), although they could also indicate poor workmanship, poor maintenance and repair planning, or other factors.
Measures of Stakeholder-Driven Outcomes
Customer Satisfaction. Customer satisfaction data can be tracked through online surveys which are conducted by many facilities management organizations. The number and type of customer service calls could also be tracked through a CMMS.
Public Image. Similar to customer satisfaction, data related to public image can be tracked through surveys of visitors to federal facilities.
LINKING MAINTENANCE AND REPAIR INVESTMENTS AND OUTCOMES TO MISSION
As noted in Chapter 1, most federal agencies have developed asset management plans that are intended to “help agencies take a more strategic approach to real property management by indicating how real property moves the agency’s mission forward, outlining the agency’s capital management plans, and describing how the agency plans to operate its facilities and dispose of unneeded real property, including listing current and future disposal plans” (GAO, 2011b, pp. 6-7).
The committee recommends that each agency also develop a longer-term plan for maintenance and repair investment. A longer-range plan can be used to link maintenance and repair investment clearly to organizational mission and can make maintenance and repair investment a more visible and integral component of portfolio-based facilities management. Ideally, such a plan will be developed in conjunction with and will be approved by the agency’s senior executives so that there is “buy-in” from all levels of the organization. The Bureau of Overseas Buildings Operations of the U.S. Department of State has developed a longer-term (5- to 10-year) maintenance plan for its facilities portfolio that provides one example of how this could be done.
A well-developed longer-range maintenance and repair plan should provide for the following:
• Outcomes of maintenance and repair activities and investments that are aligned with the organization’s mission and programs.
• A basis of communication and planning throughout the organization and
with oversight groups, including OMB and Congress.
• A framework for developing annual funding requests and budget submissions.
• Continuity in direction through organizational change and leadership turnover.
The committee recognizes that differences in agencies’ missions, programs, facilities, and resources will lead to differences in the format and content of longer-range strategic maintenance plans. However, a longer-range plan should include the following basic elements:
• A clear statement of the organization’s maintenance and repair investment objectives.
• An agreed-on set of outcomes related to each objective.
• Priority-setting or weighting of those outcomes.
• Identification of the types of facilities that are mission-critical or mission-supportive.
• Identification of critical types of systems and components.
• Performance goals, performance indicators, and a baseline for each outcome.
• Methods to be used for implementing maintenance and repair investments (such as preventive maintenance, recurring maintenance, and third-party financing).
• Identification of the types of risks posed by lack of timely investment.
Table 7.2 provides a hypothetical example of the items to be included in a longer-range maintenance and repair strategic plan. Guidance for developing the basic elements of a plan follows.
Step 1. Establish investment objectives and outcomes related to each objective. Five broad objectives for maintenance and repair investments were identified in Chapter 1 (shown in column 1 of Table 7.1). An array of beneficial outcomes that can be achieved and measured have also been identified (Chapters 2 and 7). Individual agencies should not expect to achieve all the identified outcomes. Rather, each agency should choose a set of outcomes that are most closely related to its investment objectives. In some cases, an agency may want to add investment objectives or categories of outcomes that are more closely related to its mission.
The emphasis should be on appropriate outcomes that are agreed to at all levels of the organization and that can be predicted, measured, defended, and verified by audit. An agency should always consider the credibility, accuracy, and value of data for developing and evaluating funding requests and for communicating with others in the agency when determining which data to collect and
TABLE 7.2 Hypothetical Example of Elements to be Included in a Longer-Range Strategic Plan for Maintenance and Repair Activities
| Investment Objectives | Outcomes Related to Each Objective | Importance of Outcomes (Priority or Weighting Factor) | Mission Critical Facilities (Type or Specific Facility); Mission Supportive Facilities (Type) | Critical Systems and Components | Performance Goals, Baselines for Outcomes, and Performance Measures | Methods for Delivering Maintenance and Repair Activities | Types of Risks Posed by Lack of Investment |
| Enable mission | Reliability of critical systems | X percent | To be determined (TBD) by agency | Electrical systems | X percent reliability on an annual basis; to be measured by hours of unplanned outages. | Preventive maintenance | Loss of power during essential operations |
| Provide safe, healthy and secure workplaces | Fewer accidents and injuries | X percent | TBD by agency | ||||
| Support fiscal soundness | Lower operating costs | X percent | TBD by agency | ||||
| Operate efficiently | Improved condition Less unscheduled work | X percent X percent | TBD by agency TBD by agency | ||||
| Support public policy goals | Reduced energy use | X percent | TBD by agency | Lighting systems | Reduce energy use by 30 percent by 2015 | Third-party financing, ESPCs, and programmed major maintenance |
how best to collect them. Other considerations should include the time, effort, and cost of gathering data.
Step 2. Set priorities among the outcomes to be achieved. Each agency will need to determine which outcomes are most important to achieve and set priorities among them accordingly. One method for setting priorities is to assign weights that can be expressed as percentages. Some outcomes will be related to more than one objective and can produce multiple benefits. For example, reducing energy use may also reduce operating costs. Such relationships should be considered in the weighting process.
Final weights should not be uniformly applied without knowledge of the available resources and the demand for them. For example, a 32 percent weight for activity X may make perfect sense for a budget of $100 million. But if the budget were suddenly cut to $50 million, a 32 percent investment in activity X might produce only two-thirds of a mission-critical building. Likewise, if the budget were increased to $150 million, 32 percent might be too high, and some resources could be allocated to other projects. If weights are established in the longer-range maintenance plan, the assumptions related to the level of available resources should be clearly documented.
Step 3. Identify types of facilities or specific buildings that are mission-critical and mission-supportive. To optimize investments, agencies will need to identify the types of facilities (such as piers, museums, and hospitals) or specific buildings (such as the Pentagon) that are mission-critical or mission-supportive. Many agencies have already done that through their critical infrastructure plans, through other documents, or through the use of the mission dependency index (MDI). Such a classification will help to establish where maintenance and repair investments should be targeted to ensure that funds are being used effectively. If agencies are still targeting maintenance and repair investments to facilities that are excess, obsolete, underutilized, or slated for disposition or demolition, they should clearly indicate where and why.
Step 4. Identify critical systems and components that are most important for achieving outcomes. Agencies will need to identify the types of systems and components that are critical for achieving desired outcomes or that pose the greatest risks. As noted in Chapter 4, best-practice organizations aggregate their maintenance and repair requests by types of systems and components to create a more transparent linkage to specific building performance. Aggregating requests that way also allows decision-makers to understand more easily the relative importance of systems and components for various investment outcomes. Agencies that use the MDI can extrapolate critical systems and components from it. The Army’s Engineering Research and Development Center-Construction Engineering
Research Laboratory has also created a research-based Component Importance Index that can be used to identify critical components (Uzarski et al, 2007).
Critical systems and components would likely include the following:
• Enclosures—façades, windows, and doors,
• Roofs,
• Heating, ventilation, and air-conditioning (HVAC),
• Lighting,
• Electrical distribution,
• Fire protection systems,
• Security systems,
• Plumbing and water fixtures,
• Roadways, parking, and paving,
• Industrial type systems—cranes, conveyors, and the like.
Step 5. Establish performance goals, baselines for outcomes, and performance measures. Establishing performance goals, baselines for outcomes, and performance measures is essential for tracking the effectiveness of maintenance and repair investments, for providing feedback on progress, and for indicating where investment objectives, outcomes, or procedures require adjustment. “Buy-in” at all levels of the organization is needed if sustained progress is to be achieved.
Step 6. Identify the primary methods to be used for delivering maintenance and repair activities. Maintenance and repair activities can be delivered through programs for preventive maintenance, programmed major maintenance, replacement, or in some cases, public-private partnerships or third-party financing (such as through energy savings performance contracts). Identification of the methods of delivery will help agencies to determine the level of resources that should be allocated to each type of maintenance activity and to repair projects and to determine when repair projects can be funded through methods other than direct appropriations.
Step 7. Identify the types of risks posed by lack of timely investment. Identifying the types of risks posed by not investing in deteriorating facilities, systems, and components is important for providing more transparency in the decision-making process and for communicating with staff at all organizational levels. For a longer-range maintenance plan, a general description of the types of risks, as opposed to the level or quantifcation of risks, will be appropriate because risks may change every year or more often. In all cases, the description of risks should be credible. Methods for identifying risks related to deteriorating facilities, systems, and components are described later in this chapter.
GUIDELINES FOR DEVELOPING AN ANNUAL RISK-BASED FUNDING REQUEST
In any given year, the number of required maintenance activities and repair projects will exceed available funding. A longer-range maintenance and repair strategic plan can provide the framework for determining the types of activities and projects that are the most critical to fund for a sustained period. Determining the level of funding for maintenance activities and identifying specifc repair projects that should be funded in a given budget year require a more detailed analysis—one that still recognizes that budget requests are generally developed 2 years in advance of funding.
Table 7.3 lists the types of elements that should be identified in annual funding requests. A standard template could be developed and then used by facilities managers at the field level and rolled up to headquarters. The headquarters staff can use the same template to reset priorities among projects across an agency to align with organizational objectives and to present a unified request to decision-makers in the agency.
Using the same template at all levels of the organization will help to embed new processes, provide for more consistent communication and messages, and provide transparency about how budget submissions are being developed.
Step 1: Categorize identified maintenance activities and repair projects in an organizational framework for investment. Facilities program managers at the field level or at headquarters should group all their identified maintenance activities and repair projects by categories of critical systems and components and by whether they are mission-critical or mission-supportive facilities as identified in longer-range maintenance plan (if available). At the field level, it should be possible to identify the specific facility or groups of facilities where the maintenance activities and repair projects will be implemented.
Step 2. Determine the cost of the maintenance activities and repair projects and identify the method of delivery. The costs of maintenance activities and repair projects can be verified through parametric estimates, estimates by agency experts, collection of estimates from subordinate organizations, knowledge-based condition assessments, or any other method that facilities program managers might use that has credibility in the organization. The methods to be used for executing maintenance activities or repair projects (such as programmed major maintenance or third-party financing) should also be identified.
Step 3. Identify the outcomes to be achieved. This can be done in two phases. First, list the outcomes specifically identified in the longer-range maintenance plan that have highest priority in the organization. Second, identify other credible outcomes for a specific project that could also have an organizational benefit that is not called out in the longer-range maintenance plan. That can take the form of
TABLE 7.3 Hypothetical Template for Setting Priorities Among Maintenance and Repair Activities to Be Included in an Annual Funding Request
| Projects Classified by Critical Systems and Components | Mission-Critical Facilities | Mission-Supportive Facilities | Costs of Projects | Method of Delivery | Outcomes to Be Achieved | Other Potential Benefits | Type and Level of Potential Risks If Not Funded | Risk Ratings |
| By category established in longer-range maintenance strategic plan | By category established in longer-range maintenance strategic plan | By category established by longer-range maintenance strategic plan | Determined at time of funding request (conduct knowledge-based condition assessments where appropriate) | Preventive maintenance programmed major maintenance; energy savings performance contract; public-private partnership | All the outcomes that apply as established in longer-range maintenance strategic plan | Additional information required for well-informed decision making | Narrative with supporting quantitative data | As calculated using CRR or other process (see below) |
a narrative with backup evidence-based information that can be verified. The process should ensure that critical, credible information is available for well-informed decision-making on behalf of the entire organization.
Step 4. Identify the type and level of risks incurred if the maintenance activities and repair projects are not funded in the relevant fiscal year. This step is intended to ensure that the most critical requirements rise to the top of the funding requests and that senior decision-makers understand the implications of not funding maintenance activities or particular repair projects in the relevant fiscal year. It is also intended to provide greater transparency, credibility, and accountability in budget formulation and execution.
Step 5. Setting priorities among projects. A variety of methods are available for ranking all the proposed repair projects and setting priorities among maintenance and repair activities. They include the Analytic Hierarchy Method and the Delphi Method.
The Analytic Hierarchy Method (ASTM 1765-07e1) allows consideration of multiple decision-making criteria in the priority-setting process. The multiple ranking criteria are weighted through pairwise comparisons, and the relative importance of each criterion becomes established. Through this process, the various decision-making criteria are weighted to provide an objective measure of the priority of a specific activity or project.
The Delphi Method (Linstone and Turoff, 1975) is another approach whereby a multiple-stage protocol is used to obtain a consensus expert opinion. Experts are asked to respond to questions, and after each stage a facilitator summarizes the results. Eventually, with revision of responses, the range of responses decreases and the group as a whole converges toward a consensus. Typically, the process has guidelines about what constitutes a consensus and about the number of rounds. The method can be applied with face-to-face meetings or questionnaires.
Whatever process is used, it should be documented and used consistently by the various field Offices to ensure that when a request is sent to headquarters, it is credible and easily communicated.
PREDICTING OUTCOMES OF A GIVEN LEVEL OF INVESTMENT IN MAINTENANCE AND REPAIR
Depending on the outcomes selected in Step 3, one or more applicable prediction models (see Chapter 3) should be used to create projects and develop priorities for programs at the field level. Additionally, a consequence (what-if) analysis should be made that considers different possible investment levels (such as likely, lower limit, and upper limit).
After the field-level requests have been submitted to the facilities management Office at headquarters, the headquarters staff will need to reset priorities
among the requests to meet overall organizational objectives. They should also roll up the predicted outcomes of maintenance activities and repair projects to quantify the expected results on a portfolio-wide basis to the extent possible (for example, total energy reductions across all facilities). Once the overall funding request is prepared, the headquarters staff can use a funding “cutoff” line (such as $3 million or $5 million) to show which activities and projects can be funded at a given level of investment and which ones cannot. Performing a consequence analysis through the use of applicable prediction models can change the project mix to maximize desired outcomes. A funding request in this type of format will provide greater transparency about the repair projects that are considered to have highest priority, their costs, and the benefits that the organization can expect. It will also make clear the risks posed by not funding projects.
METHODS FOR IDENTIFYING RISKS RELATED TO DETERIORATING FACILITIES
The risk-analysis literature offers multiple entry points into answering the following questions:
1. What can go wrong?
2. What are the chances that something with serious consequences will go wrong?
3. What are the consequences if something does go wrong?
4. What can be done and what options are available? How can the consequences be prevented or reduced?
5. What are the associated tradeoffs in costs, benefits, and risks? How can recovery be enhanced if the scenario occurs?
6. What are the effects of current management decisions on future options? How can key local officials, expert staff, and the public be informed to reduce concern and increase trust and confidence?
Some entry points are entirely quantitative and others mix quantitative and qualitative data. Given the reality that federal agencies have Offices and properties around the world, a risk-based approach to investment is most logically implemented in two phases: screening to set priorities among the maintenance activities and repair projects and then detailed analyses from among those chosen as having high priority. The information developed during the overall screening process can be used to identify types of risks and can be used in the longer-range maintenance plan. More detailed analyses will be more appropriate for the development of annual funding requests.
It is essential first to identify the vulnerabilities of federal facilities, systems and components, and then evaluate the vulnerabilities in the context of importance to mission fulfillment. The mission dependency index and the USACE’s
asset management strategy (see Chapter 4) incorporate risk-based screening processes to determine which facilities and components are the most critical for an agency’s mission and the failure of which poses the greatest risks to operations and mission achievement.
Two additional examples identified by the committee clearly illustrate the screening process and are based on a combination of science, engineering, and legibility. Both examples deal with vulnerability to terrorism but the principles of how to set priorities are transferable to building and infrastructure failures.
Apostolakis and Lemon (2005) developed a screening model to identify vulnerabilities of a university-centered community on a single campus. The authors rated asset vulnerability on a continuum that began with red (most vulnerable) and proceeded through orange, yellow, blue, to green (least vulnerable). Then they studied how the elements of the infrastructure—such as natural gas, water, and electricity—were interconnected. Next, they developed a “value tree” that reflected the values and perceptions of the decision-makers and other important stakeholders about each asset. The value categories included health, safety and environmental effects; economic effects on property, academic-institution operations; stakeholder effects; and effects on public image.
The values were then weighted. The greatest weights were assigned to effects on people, followed by effects on the environment, university programs, and so on. The vulnerability and value data were then connected to produce a priority list of campus projects that the university could act on. Those projects ranged from welding manhole covers to building independent infrastructure supply lines to adding backup components.
Leung, Lambert, and Mosenthal (2004) built a screening tool to set priorities for investments to protect bridges in Virginia. Their analysis was more complex than the first one in that it considered multiple major assets in different unconnected locations as well as specific singular assets, but the logic was the same. Scenarios that could degrade the system were identified, ranked according to their potential adverse events, and then compared with the system’s existing resilience, robustness, and redundancy. At every step, analysts integrated historical data and expert judgment. After completing the initial risk assessment, they gathered information on the cost, on engineering feasibility, and on policy options. The security, economic, and safety implications of options were then studied at the national, regional, and local levels. Simple decision trees were built to aid decision-makers in understanding the options before priorities were set.
Although the first method was applied to a single area and the second was applied at regional and national levels, both followed risk-analysis principles, including identifying critical assets, examining their vulnerability, and setting priorities for their protection.
For individual facilities, systems, and components, traditional engineering approaches can be applied to priority projects. It requires setting numerical performance measures in a risk-related framework (see Ellingwood, 1994). In civil or
structural engineering, reliability is defined with a “reliability index” or a “safety index” (see Ang and Cornell, 1974), which is related explicitly to an underlying probability of performance. For example, in designing a building, structural engineers often apply numerical “factors of safety” or “load and resistance factors” to ensure the safety of the building against external loads, including earthquakes or windstorms. That design procedure can be integrated with estimates of probability of failure. Indeed, engineering standards for the design of buildings and bridges are now widely based on this approach (see ASCE, 2005; and ASCE/ANSI, 2006).
Inspection and repair intervals may be optimized or nearly optimized by decision-makers in order to maintain reliability of function. Engineered components and systems deteriorate with time and use. To maintain a given level of reliability (probability of performance), inspection and repair of the critical components at prescribed time intervals are necessary. For example, to maintain the performance of a bridge component against fatigue failure, the interval of inspection and repair can be altered to ensure that a specified reliability (probability of nonfailure) is maintained (see discussion of knowledge-based condition assessments in Chapter 3).
An important but sometimes overlooked aspect of risk analysis is that of probability of occurrence. For example, the consequences (such as lives lost, dollar value, or mission interruption) of an adverse event may be very high, but if the probability of the event is extremely small, the risk will be minimal. (See Appendix C for further discussion.)
At the individual asset level, a critical complication is uncertainty and how it affects performance (Ang and Tang, 2007; Frangopol et al., 2001). It may be that a critical component should perform fawlessly for 5 years. However, some perform beyond expectations and others fail far more rapidly than expected. Consequently, it is essential that facilities program managers use knowledge-based inspection practices and set inspection, maintenance and repair schedules that recognize the reality that some critical components of important assets will fail before they are expected to.
The committee recognizes that many federal agencies will not have the resources to undertake detailed engineering-based analyses for the majority of maintenance activities and repair projects that they must evaluate annually. One method of analysis and priority-setting that could potentially be used by agencies involves the use of risk-rating charts developed for reliability-centered maintenance (RCM) processes. The process is relatively simple and does not require the collection of large amounts of data, but it does require knowledgeable, experienced facilities management professionals.
In this type of process, risk ratings are established for specific types of components (for example, roofs, HVAC systems, and some equipment) and for sub-categories of them. Each risk rating for a specific component includes two primary elements of risk: probability of failure (POF), and failure consequence (FC). The component risk rating (CRR) is the product of POF and FC, or CRR = POF × FC (Figure 7.1).
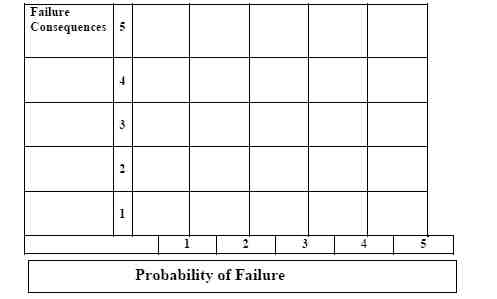
FIGURE 7.1 Component risk rating chart.
Some organizations have standard facility categories.1 In addition, each agency might have several mission-specific categories of components. For example, runways, air traffic control towers, and airplane hangars are mission-specific for the Air Force, piers and cargo loading cranes are mission-specific for the Navy, and museums are mission-specific for the Smithsonian Institution.
Assigning Probability of Failure Ratings. Typical POF ratings are shown below:
• 5—The probability of a failure in the given fiscal year is high.
• 3—The probability of a failure in the given fiscal year is moderate.
• 1—The probability of a failure in the given fiscal year is low.
• 2 and 4—Variances between the other three ratings as determined by expert opinion.
![]()
1Standard facility asset or component groupings for an agency can follow the ASTM Uniformat II classification approach (ASTM E-1557) or any other standardized approach recognized or used by the agency. Uniformat II recognizes 17 building systems. The Department of Defense and other agencies have methodologies for grouping facilities by importance (mission-specific) or use (category codes). It is not the intent of the present committee to suggest that agencies “reinvent” groupings, rather they should use a logical, reasonably comprehensive approach that is compatible with their facilities management approach and regulations.
The literature includes many ways of quantifying risk that are based on how people describe it. See, for example, Reagan et al., 1989.
Assigning Failure Consequence Ratings. Examples of typical FC ratings are shown below:
• 5—Serious consequences, such as death, injury, illness, extended shutdown of an agency’s mission, substantial costs, substantial environmental effects, or noncompliance with regulations.
• 3—Moderate consequences, such as reduced comfort, increase in long-term ownership costs, or delay in mission-completion date by some number of days or weeks.
• 1—Minimal consequences.
• 2 and 4—Variances between the other three ratings as determined by expert opinion.
Example 1: With HVAC as a component category, the subcategories (defined as a type of facilities that have similar risk characteristics) are defined and a risk rating is assigned:
• Warehouse ventilation where multiple air-supply units supply air to the same large space. Failure of a single unit will have a small effect on mission-related operations and the FC rating would be 1.
• Laboratory air supply in which air cleanliness and temperature and humidity are critical for accurate results. Laboratories are usually of such a size that only one HVAC unit supplies a specific laboratory and the FC rating for this subcategory of components might be 4 or 5.
Example 2: With roofs as a component category, a specific agency might identify the subcategories and assign a risk rating as follows:
• Roofs on aircraft hangars. If a serious leak occurs in the roof of an aircraft hanger, it may have a small effect on the assets within (airplanes and related components), because such assets are designed to withstand the elements. The FC rating might be 1.
• Roofs on central data centers. Roof leaks on data centers could shut down an agency’s operations for an extended period and the FC rating might be 5.
Once the POF and FC ratings are established for each component category and for the subcategories, the component risk rating (CRR) can be calculated.
In the committee’s experience, an agency would typically have no more than 20 categories of critical components and perhaps 10 subcategories of facility types with an average of about two risk ratings each. That would mean establishing
about 60 CRRs per agency. Once the CRRs ratings have been established by the facility management program, they should be reviewed by senior-decision-makers to ensure “buy-in” at all levels of the organization.
The CRRs can now be used for all facility components and types. Although the task of establishing the CRRs will require an investment of time and effort upfront, established CRRs can be used in future years with little additional effort.


