
The U.S. federal government has a substantial and ongoing investment in its facilities, which include some 429,000 buildings and an additional 482,000 structures and infrastructure (GSA, 2010). The purpose of these facilities is to enable the achievement of federal agencies’ missions, which include national defense; homeland security; international diplomacy; protecting the public’s health, safety, and welfare; space exploration; fostering commerce; recreation; collecting and preserving historical and cultural artifacts and the arts; and scientific research. The facilities that enable those missions include military installations; embassy compounds; office and administrative space; satellite, communication, and data centers; hospitals; museums; laboratories; roads and bridges; dams and levees; inland waterways; power plants; and many other types of buildings, structures, and infrastructure.
The estimated replacement value of all federal government facilities (buildings, structures, and infrastructure) ranges from $1.26 trillion (GSA, 2006) to $1.7 trillion (GAO, 2008). Every year, the federal government spends as much as $47 billion to operate and maintain its facilities (GAO, 2008). Operating costs include energy costs, which fluctuate with the market but are always substantial. In fiscal year (FY) 2007, the latest year on which data are available, federal buildings used 392 trillion British thermal units (Btu) of energy at a cost of $6.5 billion (FEMP, 2010).
Despite the magnitude of the investment, many federal facilities are deteriorating because of decades of inadequate funding for their maintenance and repair, their age, and other factors. Deteriorating facilities, in turn, pose an array of risks to the achievement of federal agencies’ missions, the achievement of public policy goals, and the federal government’s fiscal soundness.
All indications are that funding for many federal agencies’ programs will decrease in the near term because of current fiscal conditions and the rising national debt. This operating environment provides an impetus to reexamine the practices that have resulted in deteriorating, excess, and under utilized federal facilities and an opportunity to go forward in a more sustainable direction.
Because this report is intended for multiple audiences that have different backgrounds and interests, several key terms used in the report are explained here. If the committee has used a definition from another source, the source is cited (Box 1.1).
BOX 1.1
Terms Used in This Report
Customers as defined in this report are the users of federal facilities, including tenants and visitors.
Excess facilities are those which are no longer needed to support a federal agency’s current or future missions.
Facilities refers to buildings (such as hospitals, barracks, embassies, and offices), other types of structures (such as parking, storage, and industrial), and infrastructure (such as power plants, water and sewer systems, railroads, roads, and bridges).
Federal facilities program managers are federal employees who are directly responsible for federal facilities programs; their responsibilities may include oversight of activities related to facilities design, construction, programming, budgeting, operations, maintenance, and evaluation.
Knowledge-based condition assessments use knowledge (quantifiable information) about a facility’s systems and components to select the appropriate inspection type and schedule throughout its life cycle. Inspections are planned and executed on the basis of knowledge, not merely the calendar (Uzarski et al., 2007).
An outcome is something that follows as a result or consequence (Webster’s New Collegiate Dictionary, 1976).
CHARACTERISTICS OF THE PORTFOLIO OF FEDERAL FACILITIES
The federal government owns about 429,000 buildings of many types (Figure 1.1) which have a total square footage (footprint) of 3.3 billion square feet (Table 1.1).
About 83 percent of the total square footage of federal buildings in the 50 states is owned space, 13 percent is leased, and 4 percent is managed otherwise (GSA, 2010).
In addition to buildings, the government owns 482,000 structures including utility systems, roads and bridges, parking, recreational and storage structures, and miscellaneous military facilities (Figure 1.2 and Table 1.2).
Portfolio-based facilities asset management is a systematic process of maintaining, upgrading, and operating physical assets cost effectively. It combines engineering principles with sound business practices and economic theory, and provides tools to facilitate a more organized, logical approach to decision-making. A facilities asset management approach allows for both program or network-level management and project-level management, and thereby supports both executive-level and field-level decision-making (NRC, 2004a, p. 32).
Public-private partnerships are contractual agreements between public and private-sector organizations in which the private sector, in exchange for compensation, agrees to deliver services, or even facilities, that could be provided by the public sector (Keston Institute, 2011).
Risk is a measure of the probability and severity of adverse events (Lowrance, 1976, p. 1).
Stakeholders in maintenance and repair of federal facilities include federal departments and agencies; facilities program managers; customers; oversight organizations such as the Office of Management and Budget; Congress; the administration; and the general public.
Total cost of ownership is the total of all expenditures an owner organization will make over the life cycle of a facility, that is, all expenditures related to planning, design, construction, operations and maintenance, renewal, revitalization, and disposal (NRC, 2008).
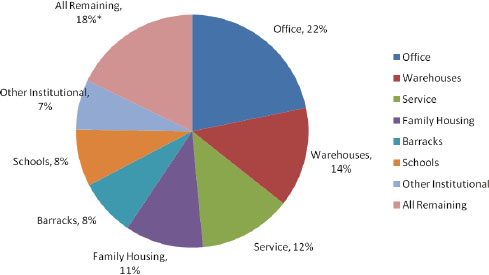
FIGURE 1.1 Federal buildings by predominant use in square feet as reported for FY 2009.
NOTE: All remaining uses include prisons and detention centers, hospitals, laboratories, industrial, communication systems, museums, and post offices. SOURCE: GSA, 2010.
TABLE 1.1 Federal Buildings by Predominant Use and Square Footage as Reported for FY 2009
|
|
|
| Predominant Use | Square Feet in Millions |
|
|
|
| Office | 740.8 |
| Warehouses | 460.4 |
| Services | 416.2 |
| Family housing | 364.9 |
| Barracks | 271.2 |
| Schools | 251.7 |
| Other institutional uses | 221.4 |
| All remaining uses | 612.8 |
| Total square feet | 3339.4 |
|
|
|
SOURCE: GSA, 2010.
Federal facilities (buildings and structures combined) are owned and managed by more than 30 departments and agencies. The Army, Navy, Air Force, Department of Veterans Affairs (VA), and the General Services Administration (GSA) manage the greatest numbers of buildings and structures and the greatest amounts of building space as measured by square footage (Table 1.3).
Much of the current federal facilities portfolio “reflects an infrastructure based on the business model and technological environment of the 1950s” and “many of
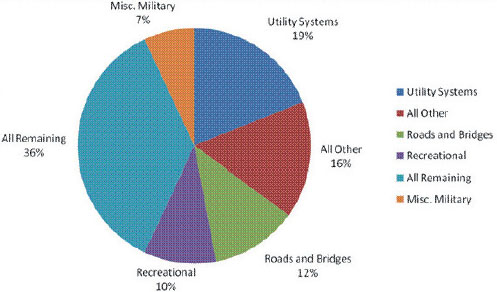
FIGURE 1.2 Predominant use of structures by number of assets as reported for FY 2008. SOURCE: GSA, 2009.
TABLE 1.2 Predominant Use by Number of Structures as Reported in FY 2008
|
|
|
| Predominant Use | Number of Structures |
|
|
|
| Utility systems | 91.000 |
| Roads and bridges | 58,000 |
| Recreational (other than buildings) | 49,000 |
| Parking structures | 39,000 |
| Miscellaneous military facilities | 35,000 |
| Storage (other than buildings) | 30,000 |
| Navigation and traffic aids (other than buildings) | 26,000 |
| Reclamation and irrigation | 16,000 |
| Communication systems | 14,000 |
| All other- | 79,000 |
| All remaining uses'* | 45,000 |
| Total number of structures | 482,000 |
|
|
|
aAll other uses include those that are not captured in the predominant use categories.
bAll remaining uses include airfield pavements, food control and navigation, harbors and ports, industrial (other than buildings), monuments and memorials, museums, power development and distribution, railroads, research and development (other than laboratories), service (other than buildings), space exploration structures, and weapons ranges.
SOURCE: GSA, 2009.
TABLE 1.3 The Seven Agencies Managing the Greatest Amounts of Total Building Square Footage
|
|
||
| Agency | Total Number of Buildings and Structures | Total Building Square Footage |
|
|
||
| U.S. Army | 251.676 | 932,367,000 |
| U.S. Air Force | 134,788 | 606,191,000 |
| U.S. Navy | 150,576 | 578.305,000 |
| GSA | 9,213 | 407,941,000 |
| VA | 9,220 | 156.344,000 |
| Department of Energy | 18354 | 129.239,000 |
| Department of Stale | 15.743 | 72,668,000 |
| Total | 589,570 | 2,883,055,000 |
|
|
||
SOURCE: GSA, 2010.
the assets are no longer effectively aligned with, or responsive to, agencies’ changing missions. . . .” (GAO, 2003, p. 1). In FY 2008, federal agencies disposed1 of about 25,000 facilities that were identified as excess with regard to current missions or as underutilized; they had annual operating costs of $119 million. In FY 2009, an additional 19,500 facilities with operating costs of $149 million were disposed of (GSA, 2010). Nonetheless, as of FY 2009, federal agencies reported that they still managed more than 45,000 facilities that are excess to their current missions or underutilized, and that they were spending more than $1.66 billion to operate them (GAO, 2011b).
The accumulation of excess and underutilized properties is a result of 200 years of acquiring facilities to support changing missions and new federal programs, and of the difficulty of disposing of facilities once they are acquired. Obstacles hindering sale, transfer of title, demolition or other methods of disposition include myriad regulations for transferring title to nonfederal entities, disincentives created by the federal budget structure, security issues related to the location of some excess facilities, and the condition of some facilities (NRC, 1998). Additional issues include the “numerous stakeholders that have an interest in how the federal government carries out its real property acquisition, management, and disposal practices” and a “complex legal environment that has a significant impact on real property decision making and may not lead to economically rational outcomes” (GAO, 2011b, p. 5).
LONG-STANDING INVESTMENT AND MANAGEMENT ISSUES
Excess and underutilized facilities are only one of several long-standing issues related to investment in and management of federal facilities. In 1990,
![]()
1Disposition methods include demolition, federal transfer, sale, public benefit conveyance, and others (GSA, 2010).
the National Research Council Committee on Advanced Maintenance Concepts for Buildings was asked to undertake a broad review of maintenance and repair activities of government agencies and to recommend how these activities might be improved (NRC, 1990). The committee found that, “credible analyses indicate that we are systematically neglecting the maintenance of public facilities at all levels of government. We are spending our assets and wasting our inheritance” (NRC, 1990, p. ix). One of its recommendations, which became a standard for public facilities management, was the following (NRC, 1990, p. xii):
An appropriate budget allocation for routine M & R [maintenance and repair] for a substantial inventory of facilities will typically be in the range of 2 to 4 percent of the aggregate replacement value of those facilities (excluding land and major associated infrastructure). In the absence of specific information upon which to base the M & R budget, this funding level should be used as an absolute minimum value. Where neglect of maintenance has caused a backlog of needed repairs to accumulate, spending must exceed this minimum level until the backlog has been eliminated.
Some federal agencies have used, and continue to use, the 2 to 4 percent guideline for developing and justifying budget requests for maintenance and repair activities. However, no agency has reported actually investing in maintenance and repair activities at a level as high as 2 percent of the current replacement value of its portfolio of facilities and underinvestment remains an issue (FFC, 1996; committee briefings, 2009 and 2010).
In 2003, the U.S. Government Accountability Office (GAO) designated federal real property as a “high-risk”2 topic because of long-standing problems with excess and underutilized facilities, deteriorating facilities, lack of reliable governmentwide data for strategic asset management, the high costs of leased space, and the costs and challenges of securing property against potential threat of terrorism. In its report GAO stated that “many assets are in an alarming state of deterioration; agencies have estimated restoration and repair needs to be in the tens of billions of dollars” (GAO, 2003, p. 1). Furthermore, current trends “have multibillion dollar cost implications and can seriously jeopardize mission accomplishment” (GAO, 2003, p. 1). For example, the Department of Defense (DOD) reported that many of its facilities were not adequate to meet the warfighting and operational concepts of the 21st century and that commanders rated two-thirds of their infrastructure to be in such poor condition as to affect mission accomplishment and morale substantially (GAO, 2003). In a similar vein, GSA noted that some of its buildings had electrical systems that were not capable of handling 21st century technologies, “which is critical to tenant
![]()
2The GAO’s high-risk update is provided at the start of each new Congress. The high-risk reports are intended to help the new Congress “focus its attention on the most important issues and challenges facing the federal government” (GAO, 2003, p. 1).
agencies’ accomplishing their missions” (GAO, 2003, p. 23). The GAO (2003, p. 1) concluded that:
Resolving these problems will require high-level attention and effective leadership by both Congress and the administration. Also, because of the breadth and complexity of the issues, the long-standing nature of the problems, and the intense debate that will likely ensue, current structures and processes may not be adequate to address the problems. Thus, there is a need for a comprehensive, integrated transformation strategy for real property.
In 2004, Executive Order 13327, Federal Real Property Asset Management,3 provided direction for meeting some of those issues and established the Federal Real Property Council (FRPC). The FRPC is an interagency council composed of representatives of the 24 largest land-holding agencies and chaired by the Office of Management and Budget (OMB). From 2004 to the end of 2010, the FRPC issued guidance focused on improving the strategic management of federal buildings and structures, improving the management of the condition of facilities, developing asset management plans, implementing controls to improve the reliability of facilities-related data, and developing a set of government-wide performance measures related to the management of portfolios of facilities (GAO, 2011a).
Nonetheless, backlogs of deferred maintenance and repair projects continue to grow. The 2008 GAO report, Federal Real Property: Government’s Fiscal Exposure from Repair and Maintenance Backlogs is Unclear, found important differences in how agencies plan, estimate, and fund maintenance and repair activities. At that time, GAO recommended that OMB, in conjunction with the FRPC and in consultation with the Federal Accounting Standards Advisory Board (FASAB)4 explore the potential for developing a uniform reporting requirement that would capture the government’s fiscal exposure from maintenance and repair backlogs, because “this exposure may have a significant effect on future budget resources and our nation’s long-term fiscal sustainability” (GAO, 2008, p. 4). As of the date of release of the present report, a uniform reporting requirement has not yet been approved for use by federal agencies.
As of January 2011, federal real property remained on GAO’s “high-risk” list because of continuing issues related to leasing practices, excess properties, and physical security (GAO, 2011b).
Additional long-standing issues that pose obstacles for effective investment in and management of federal facilities have been identified in two previous National Research Council studies. Among them are the following:
![]()
3The full text of the executive order is available at http://edocket.access.gpo.gov/2004/pdf/04-2773.pdf.
4The mission of the FASAB is to develop accounting standards after considering the fnancial and budgetary needs of congressional oversight groups, executive agencies, and the needs of other users of federal financial information.
• The focus on the first (design and construction) costs of facilities in the budget process as opposed to their life-cycle (long-term operations and maintenance) costs (NRC, 1998).
• Budgeting and accounting processes that create disincentives for cost-effective investments in maintenance and repair (NRC, 1998).
• The distributed nature of decision making about federal facilities investments and the short-term outlook of decision-makers, which result in a lack of accountability for stewardship (NRC, 1998; 2004a).
Two additional long-standing issues affect federal facilities management and investment. One is the variation in definitions related to maintenance and repair used by federal government agencies. For example, in briefings to the committee, the Department of Energy (DOE) and the National Oceanic and Atmos pheric Administration (NOAA) reported that they define maintenance and repair together as
Day to day work that is required to sustain property in a condition suitable for it to be used for its designated purposes, including preventive, predictive and corrective maintenance.
The Bureau of Overseas Buildings Operations of the Department of State defines maintenance and repair as
Services and/or materials used for items of a recurring nature to prevent damage which would be more costly to restore than to prevent. Examples include painting, weather stripping and the preventive maintenance of building systems. A second category of M & R [maintenance and repair] services includes services and/or materials used for items of a minor nature such as repairs of broken pipes. A third category consists of bulk M & R supplies for use in Government-owned and long-term leased properties such as paint, lumber, plumbing supplies, and electrical wire.
And the U.S. Coast Guard defines maintenance, repair, and in-kind replacements (M), as
Activities needed to keep a building or infrastructure operational, specifically focusing on physical continuity. These activities are required to achieve the full economic life of real property assets, components, assemblies, and systems. Also included are in-kind replacements of components and systems at the end of their economic life, such as a chiller for a chiller, or a roof for a roof. Energy retrofits motivated by economic considerations also fall into this category. Additional “M” work includes survey, inspection, and assessment work used to identify, scope, and schedule “M” activities.
Those definitions and the definitions used by other agencies are tailored to the methods of operating and the organizational culture of individual agencies, so, it is difficult to compare levels of maintenance and repair investment among federal
agencies, to quantify those investments for the federal government as a whole, or to benchmark investments with non-federal organizations.
A second issue is the variation in budgeting, priority setting, and execution related to maintenance and repair investments. Agencies prepare their budget requests for maintenance and repair funding (and all other programs) 2 years in advance of the fiscal year in which the funding will be appropriated. Typically the identification of maintenance and repair projects that require funding begins at the field level. Methods for developing a total funding request vary. Some agencies take past budgets and increase them by some percentage to cover inflation, new program requirements, or a backlog of deferred maintenance projects. Others use a guideline such as the NRC’s 2 to 4 percent of current replacement value, and still others a facilities sustainment model (FSM) developed for the DOD.
Project priority setting takes place at the organization level typically associated with approval authority, although ranking may also occur at different points as the lists of requirements work their way up the chain of command. Priorities for specific maintenance and repair projects that will cost less than some dollar amount (by statute or regulation) may be set at the local level, whereas priorities for more expensive projects may be set at the headquarters level. The process used to set priorities for projects may range from the discretion of an individual to a committee discussion and may encompass a subjective ad hoc approach, stakeholder requests, a very structured objective approach that uses matrices or algorithms to rank projects, or combinations thereof.
The lack of standardization or comparability in developing funding requests makes it difficult for individual agencies and the government as a whole to identify the beneficial outcomes or the adverse consequences of different investment strategies, to share lessons learned, and to improve the outcomes of maintenance and repair investments governmentwide.
IMPETUS FOR AND FOUNDATION OF MORE SUSTAINABLE PRACTICES
Historically, obtaining funds to maintain the federal government’s buildings and infrastructure has been a challenge (DOD, 2001; GAO, 2008). Senior executives and Congress are inundated with requests to support mandates and discretionary programs, each accompanied with compelling messages and evidence.
In 2011, the challenge to find support for federal facilities investment is probably greater than any time in the recent past because of the increasing national debt. The report Choosing the Nation’s Fiscal Future (NAPA and NRC, 2010) shows that the federal government has been spending much more than it has been collecting in revenues and will do so for the foreseeable future if current policies are continued (Figure 1.3).
Because of the projected growth in federal spending for Medicare, Medicaid, and Social Security, the report concludes that any efforts to rein in future defi-
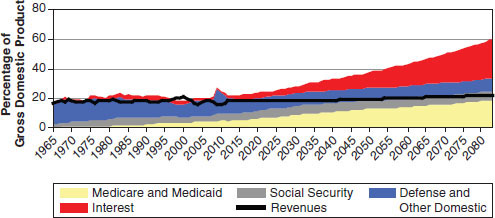
FIGURE 1.3 The long-term budget outlook. SOURCE: NAPA and NRC, 2010.
cits must entail either large increases in taxes to support these programs, major restraints on their growth, or some combination of the two (NAPA and NRC, 2010). It states that if the “choice is to keep the federal government’s share of the economy close to the level of the past several decades, the government would have to scale back what it does, and extremely difficult choices would have to be made about what social goals to pursue less vigorously and what programs to end” (NAPA and NRC, 2010, p. 2). A January 2011 report by GAO reaches similar conclusions, noting that in the absence of policy changes, “the federal government faces a rapid and unsustainable growth in debt. . . . Addressing the long-term fiscal challenge . . . will likely require difficult decisions affecting both federal spending and revenue” (GAO, 2011c, p. 8).
The current fiscal situation provides the impetus for reexamining practices for federal facilities management, maintenance, and repair, and an opportunity to propose practices that will be more sustainable in the long term. The foundation of more sustainable practices is provided by portfolio-based facilities management, information tools and technologies, and recognition of the role of facilities in achieving public policy goals of energy independence and environmental sustainability.
Portfolio-Based Facilities Management
Recognition of the costs of facilities, of the role of facilities in enabling organization missions, of facilities’ effects on occupants’ health, safety, and security, and of facilities’ effects on the environment, has been the impetus for more strategic management approaches by both private-sector and government organizations. One important change has been the shift from tactical concerns, tasks, and practices oriented to the operation of individual buildings and structures
to a focus on the entire portfolio of facilities and integrated resource management (NRC, 2004a). Portfolio-based facilities management has been defined (NRC, 2004a, p. 32) as a
systematic process of maintaining, upgrading, and operating physical assets cost effectively. It combines engineering principles with sound business practices and economic theory, and provides tools to facilitate a more organized, logical approach to decision making. A facilities asset management approach allows for both program or network-level management and project-level management and thereby supports both executive-level and field-level decision making.
A portfolio-based facilities management approach “allows organizations to integrate facilities considerations into corporate decision-making and strategic planning processes” (NRC, 2004a, p. 32). Thus, facilities are treated as valuable assets that contribute to the overall effectiveness of an organization.
Within the last 7 years, federal agencies have developed asset management plans. These plans are updated annually and are intended to “help agencies take a more strategic approach to real property [facilities and land] management by indicating how real property moves the agency’s mission forward, outlining the agency’s capital management plans, and describing how the agency plans to operate its facilities and dispose of unneeded real property, including listing current and future disposal plans” (GAO, 2011b, pp. 6, 7).
Federal agencies have been implementing portfolio-based management processes, but the level of sophistication varies. With a few exceptions, agencies have not yet adopted more strategic, portfolio-based practices for linking maintenance and repair investments to their organization’s overarching mission.
Information Tools and Technologies
Many factors are driving a more strategic approach to facilities management and investment, and information tools and technologies are enabling it. Information tools and technologies are now available for monitoring facilities’ condition, energy use, and other performance dimensions; for collecting data in “real time” to support strategic decision-making; for eliminating human error and bias; and for increasing operational efficiencies.
Because organizations can operate around the clock by having business units networked through the Internet and other technologies, the concept of workplace also is changing. Alternative work arrangements, such as telework enabled by technology, allow people to conduct work from home, airports, or other locations. The trend is changing the demand for centralized office space while also making the uninterrupted supply of power for telecommunications, cooling, and ventilation ever more critical. All those factors both enable and require changes in how federal facilities are managed, maintained, and repaired.
The Role of Facilities in Public Policy Issues
While federal agencies have been implementing new management practices, additional facilities-related goals have been established through legislation, executive orders, and presidential memorandums. The genesis of many of those goals is the ever-growing knowledge about the relationships between facilities and the natural environment; between indoor environments and the health, safety, and productivity of the people who use them; and about the magnitude of the costs and resources required to operate and maintain facilities. The amount of resources used by facilities and the costs of facilities have been noted previously. With respect to the health, safety, and productivity of building occupants, cause-effect relationships have been scientifically documented between waterborne pathogens in water systems and Legionnaire’s disease and Pontiac fever; between microorganisms growing in contaminated ventilation and humidification systems and hyper sensitivity pneumonitis and humidifier fever; between the release of carbon monoxide and carbon monoxide poisoning; between the presence of radon, second hand smoke, and asbestos in buildings and lung cancer; and in connection with nonspecific symptoms—including eye, nose, and throat irritations— sometimes referred to as “sick-building syndrome” (FFC, 2005).
As the managers of the largest portfolio of facilities in the United States, federal agencies have been challenged to lead by example in operating their buildings and structures more sustainably over their life cycles. Laws have been enacted and other directives have been issued that establish goals of reducing the use of water, energy, and fossil fuels; improving indoor environmental quality; and reducing greenhouse gas emissions.
The Energy Independence and Security Act (EISA) of 2007, for example, defined the attributes of high-performance green buildings and established a set of goals and baselines for the reduction of energy, water, and fossil fuel use in federal buildings. The EISA standards address new construction, major renovations of existing structures, replacement of installed equipment, renovation, rehabilitation, expansion, and remodeling of existing space. More specifically, the EISA defined a high-performance green building as one that, during its life-cycle, as compared with similar buildings (as measured by Commercial Buildings Energy Consumption Survey data from the Energy Information Agency),
(A) Reduces energy, water, and material resource use.
(B) Improves indoor environmental quality, including reducing indoor pollution, improving thermal comfort, and improving lighting and acoustic environments that affect occupant health and productivity.
(C) Reduces negative impacts on the environment throughout the life-cycle of the building, including air and water pollution and waste generation.
(D) Increases the use of environmentally preferable products, including bio-based, recycled content, and nontoxic products with lower life-cycle impacts.
(E) Increases reuse and recycling opportunities.
(F) Integrates systems in the building.
(G) Reduces the environmental and energy impacts of transportation through building location and site design that support a full range of transportation choices for users of the building.
(H) Considers indoor and outdoor effects of the building on human health and the environment, including improvements in worker productivity, the life-cycle impacts of building materials and operations, and other factors considered to be appropriate.
Among other provisions, EISA requires that federal agencies reduce their total energy consumption by 30 percent by 2015, relative to 2003 consumption.
Executive Order 13423, Strengthening Federal Environmental, Energy, and Transportation Management, also issued in 2007, requires federal agencies to reduce their water intensity (gallons per square foot) by 2 percent each year through FY 2015 for a total of 16 percent relative to water consumption in FY 2007. It also requires federal agencies to ensure that 15 percent of the existing federal capital asset building inventory of each agency incorporate the sustainable practices outlined in the “Guiding Principles for Federal Leadership in High Performance and Sustainable Buildings” (hereinafter the Guiding Principles) by the end of FY 2015.5
The overall goals and objectives of the Guiding Principles are to reduce the total ownership cost of facilities; to improve energy efficiency and water conservation; to provide safe, healthy, and productive built environments; and to promote sustainable environmental stewardship. With respect to indoor environmental quality, the Guiding Principles recommend that agencies meet industry standards for ventilation, humidity, and temperature, and that they establish and implement a moisture control strategy to prevent building damage and mold contamination—actions that are related primarily to the efficient operation and maintenance of buildings.
Executive Order 13514, Federal Leadership in Environmental, Energy, and Economic Performance, issued in 2009, challenges federal agencies to lead by example in creating a clean energy economy and establishes more than 20 facilities-related goals for doing so. For the most part, agencies have not received additional funding to fulfill these mandates; instead, they must shift funding away from other programs and activities.
Because most facilities that federal agencies will be using for the next 20 to 30 years exist today, the primary methods for meeting those goals will be through efficient operations, maintenance, repair and retrofitting of existing facilities, and
![]()
5The Guiding Principles are the following: (1) Employ integrated design principles; (2) optimize energy performance; (3) protect and conserve water; (4) enhance indoor environmental quality; and (5) reduce environmental impact of materials. Available at http://www.energystar.gov/ia/business/Guiding_Principles.pdf.
the consolidation of the overall federal facilities footprint, not new construction (NRC, 2011).
Transforming the portfolio of federal facilities into one that is more economically, physically, and environmentally sustainable at the same time as budgets are being cut is daunting. To help provide direction in doing it, the Federal Facilities Council (FFC)6 asked the National Research Council for its advice and assistance.
In October 2009, the National Research Council appointed an ad hoc committee of experts to develop methods, strategies, and procedures to predict outcomes anticipated from investments in federal facilities’ maintenance and repair. The committee was also asked to address the following questions:
• Are there ways to predict or quantify the outcomes that can be expected from a given level of investment in maintenance and repair of federal facilities or facilities’ systems?
• What risks do deteriorating facilities, deteriorating building systems (such as mechanical and electrical), or deteriorating components (such as roofs and foundations) pose to the achievement of a federal agency’s mission or to other organizational outcomes (for example, physical security, operating costs, worker recruitment and retention, and health care costs)?
• Do such risks vary by facility type (such as offices, hospitals, industrial, and laboratories), by system, or by function (such as research and administrative)? Can the risks be quantified?
• What strategies, measures, and data should be in place to determine the outcomes of facilities maintenance and repair investments? How can those strategies, measures, and data be used to improve the outcomes of investments?
• Are there effective communication strategies that federal facilities program managers can use to inform decision-makers better about the cost-effectiveness of levels of investment in facilities’ maintenance and repair?
The committee members had expertise in facilities management, engineering, budgeting and finance, information technologies and data collection, the development of facilities-related models and performance measures, and risk identification, analysis, mitigation, and communication. The members have worked in
![]()
6The FFC is a cooperative association of more than 20 federal departments and agencies operating under the auspices of the National Research Council. The FFC’s mission is to identify and advance technologies, processes, and management practices that improve the performance of federal facilities over their entire life cycle, from planning to disposal.
federal agencies, local governments, industry, and academia (see Appendix A for biosketches of committee members).
The committee began its work in December 2009 with a review of previous NRC reports on federal facilities management. Those reports included Committing to the Cost of Ownership: Maintenance and Repair of Public Buildings (NRC, 1990) and Stewardship of Federal Facilities: A Proactive Strategy for Protecting the Nation’s Public Assets (NRC, 1998), both of which focused on the fiduciary responsibility of maintaining the nation’s public assets. Investments in Federal Facilities: Asset Management Strategies for the 21st Century (NRC, 2004a) introduced strategies for investing in federal facilities from planning through disposal that were based on an analysis of best practices in private-sector and public-sector organizations. Core Competencies for Federal Facilities Asset Management Through 2020 (NRC, 2008) projected the skills and knowledge necessary to manage federal facilities now and into the future.
During its first three meetings, the committee focused on gathering additional information from representatives of federal, private-sector, and professional organizations. The committee was briefed by the chair of the FFC, which sponsored this report. The committee also requested presentations from representatives of IBM, General Motors, General Dynamics, and the Association of Higher Education Facilities Officers-APPA and by three major providers of facility assessment consulting services: Parsons, Whitestone Research, and VFA Inc. (formerly VanderWeil Facility Advisors). Those organizations were contacted because the committee members on the basis of their experience with and knowledge of the facilities management profession believed them to be industry leaders in effective maintenance and repair-related practices. The committee also gathered information from the following federal agencies:
• U.S. Army Corps of Engineers
• U.S. Army Engineer and Research Development Center, Construction Engineering Research Laboratory
• Naval Facilities Engineering Command
• Naval Facilities Engineering Service Center
• NOAA
• DOE, including the Office of Science, the National Nuclear Security Administration, and the Office of Engineering and Construction Management
• U.S. Air Force
• Bureau of Overseas Buildings Operations of the U.S. Department of State
• U.S. Coast Guard
• National Aeronautics and Space Administration
• Smithsonian Institution
• Architect of the Capitol
• OMB
• GAO
• FASAB
The committee acknowledges that the various organizations that provided information do not represent a scientific or random sampling of organizations. Nor were the various organizations asked to comment on each other’s processes and practices or to be involved in any way in the formulation of the committee’s findings and recommendations.
In addition to the briefings, individual committee members researched the literature on international best practices for facilities management and finance, on risk and probability analysis models, and on tools and technologies for facilities management-related applications. The committee debated the issues and developed draft findings, then reviewed and integrated information to arrive at its final findings and recommendations. The resulting report represents a consensus of the committee that is based on a synthesis of the committee’s data gathering and research, and on the individual members’ expertise and experience. Statements based solely on the committee’s collective opinions are so identified.
This report proposes new approaches to making decisions about allocating limited resources to achieve multiple benefits from investments in maintenance and repair of federal facilities and about managing the risks associated with deteriorating systems and components. It is addressed to several different audiences: federal facilities program managers, operating groups and their contractors; decision-makers in the administration and Congress; federal departments, agencies, and their advisors; and program and budget analysts throughout the federal government. Decision-makers, facilities program managers, and program and budget analysts in state and local governments and in other organizations may also find value in the report inasmuch as they face many of the same issues as their federal counterparts. Because this report addresses multiple audiences, different readers will find different chapters to be of greatest interest.
The Summary describes issues that are driving the need for a new approach to investments in maintenance and repair of federal facilities, identifies the basis of change, and contains the report’s findings and recommendations. A more extensive discussion of the findings and recommendations is in Chapter 6.
Chapter 1, “Introduction,” contains statistical information about the portfolio of federal facilities, long-standing facilities investment and management issues, the impetus for and foundation of more sustainable maintenance and repair practices, the committee’s statement of task, and the committee’s approach to fulfilling its task.
Chapter 2, “Outcomes and Risks Associated with Investments in Maintenance and Repair,” briefly describes the processes used by federal agencies for identifying maintenance and repair requirements and for developing funding
requests, the beneficial outcomes that can be expected from maintenance and repair investment, and the risks posed by deteriorating buildings, infrastructure, systems, and components.
Chapter 3, “Data, Tools, and Technologies to Support Investments in Maintenance and Repair,” identifies an array of available and emerging technologies for data acquisition and tracking, indexes and models for measuring outcomes of investments in maintenance and repair, and predictive models for risk-based decision support.
Chapter 4, “Effective Practices for Investments in Maintenance and Repair,” describes strategic practices used by public-sector and private-sector organizations that would improve the outcomes of investments in maintenance and repair of federal facilities.
Chapter 5, “Communicating Outcomes and Risk,” focuses on strategies that federal facilities program managers can use to communicate more effectively with other decision-makers about the outcomes and risks associated with a given level of investment in facilities maintenance and repair.
Chapter 6, “Findings and Recommendations,” presents detailed information about the committee’s findings and restates its recommendations.
Chapter 7, “Implementing a Risk-Based Strategy for Investments in Federal Facilities’ Maintenance and Repair,” is intended to show how federal facilities program managers can put some of the report’s recommendations into action. It suggests ways to quantify the beneficial outcomes, and offers guidelines for developing a longer-range strategic plan, guidelines for developing an annual budget submission, and methods for identifying risks related to deteriorating facilities’ systems and components.
Appendixes A and B contain background information about the committee members and a list of committee meetings and briefings, respectively.
Appendix C is more technical than other sections of the report and is intended primarily for federal facilities managers. It provides some fundamentals of a risk-based approach, including basic principles of probability analysis, and examples of quantifying outcomes of maintenance and repair investments.


