
5
Assessing the Impact of Marketing and Industry
Key Points Noted in Presentations
• Children and adolescents are exposed to a large number of televised food and beverage advertisements each day—by one measure, 12 per day for the youngest children, 21 for 8- to 12-year-olds, and 17 for teenagers. All age groups receive dramatically less exposure to public service announcements about fitness or nutrition.
• There is an array of data, both commercial and public, on foods and beverages sold in the United States, where they can be purchased, and their nutritional characteristics. Researchers can gain the clearest picture of the food supply by integrating different types of data, but gaps remain.
• Assessing the impact of large-scale communication and social marketing campaigns is challenging because they have varying goals and strategies, and because the circumstances in which they operate, as well as the behaviors of people, are constantly evolving. Nonetheless, a number of designs other than randomized controlled trials can be used for evaluating the effects of such campaigns.
The available research suggests many ways in which marketing and industry may influence both what and how much people eat and the
amount of physical activity in which they engage. Food and beverage companies and marketers also are a source of valuable information about what is consumed. Victoria Rideout, president and founder of VJR Consulting, described research on children’s exposure to media and advertising and how it relates to obesity. Shu Wen Ng, research assistant professor at the University of North Carolina at Chapel Hill, Gillings School of Global Public Health, discussed available data sources on the food supply in the United States. Robert Hornik, Wilbur Schramm professor of communication and health policy at the University of Pennsylvania Annenberg School for Communication, discussed the evaluation of large-scale public health communication and social marketing programs.
CHILDREN, MEDIA, AND ADVERTISING
Presenter: Victoria Rideout
Two recent studies conducted by the Kaiser Family Foundation1explored media influences on obesity in children, Rideout explained. One, Generation M2: Media in the Lives of 8 to 18 Year-Olds, focused on the amount of time children spend with media (Rideout et al., 2010). Time spent with media has been linked to obesity because (1) media use is a largely sedentary activity, (2) it exposes children to food marketing, and (3) snacking during media use can contribute to weight gain. The other study, Food for Thought: Television Food Advertising to Children in the United States, explores children’s exposure to food and beverage advertising on television (Gantz et al., 2007). For both studies, the researchers used a randomly selected, nationally representative sample of school-aged children and adolescents.
There is a great deal of debate about the best way to measure media use, Rideout noted. The media study cited above (Rideout et al., 2010) did not draw on commercial data sources, although the Nielsen television ratings and other commercial sources can supply valuable information. Commercial data sources are expensive to use, Rideout noted, and some firms that collect data are unwilling to share with academic and public health researchers the data they make available to industry groups. Because commercial data collection focuses on television viewing and website traffic,
________________
1The Kaiser Family Foundation is a nonprofit foundation focused on health policy and communications that conducts its own research. For more information, see http://www.kff.org/ (accessed August 2011).
these data would also be incomplete for research including the use of other types of media. For this study, Rideout explained, rather than asking respondents how much time they spend in a typical day doing various activities, the researchers asked respondents to focus on television watching and other media activities in which they had engaged the previous day. The study was conducted over a 10-year period in three waves, each with a different sample, to track changes over time. Figures 5-1 through 5-4 show some of the findings.
Figure 5-1 shows the amount of time young people aged 8 to 18 spent with each medium in a typical day, on average. For the average youngster, Rideout observed, the total media exposure—or combined total time spent with each medium—was 10 hours, 45 minutes in 2009. Figure 5-2 shows how that total has increased since the study began, in 1999.
Figure 5-1 also illustrates how important television remains, Rideout noted, despite declines in live television viewing, although several changes are important to note. Total consumption has increased in part because of the “proliferation of media platforms in the home and in the bedroom,” Rideout observed. “There are so many new ways to multitask [but] mobile media is really the biggest change—it has opened up parts of the day” for media uses that were not possible before, such as on the school bus. The
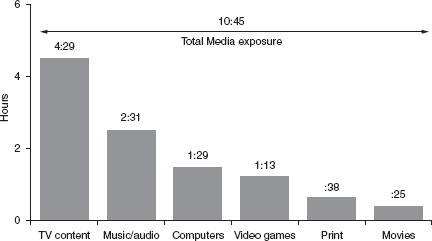
FIGURE 5-1 Amount of time 8- to 18-year-olds spent with various media in a typical day in 2009.
SOURCE: Rideout et al., 2010.
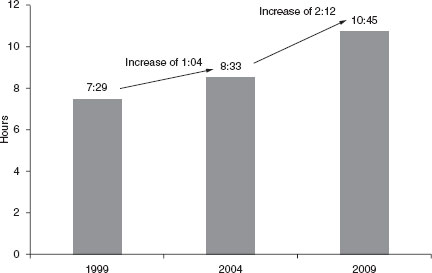
FIGURE 5-2 Increases over time in the total amount of media exposure for 8- to 18-year-olds in a typical day, 1999 to 2009.
SOURCE: Rideout et al., 2010.
study results suggest that 29 percent of the total media exposure in 2009 (10 hours, 45 minutes) was spent multitasking, meaning that the actual time spent using media each day was 7 hours, 38 minutes.
Figures 5-3 and 5-4 show how the exposure totals vary by age and ethnicity, respectively. There is “a big jump when kids hit the tween and teen years,” Rideout commented. She suggested that this is an important point to consider because voluntary policies that govern food and beverage advertising focus on children aged 12 and under. Black and Hispanic children also have significantly higher media use and exposure than their white peers, an observation that is important both because of exposure to advertising and because of the time spent in sedentary activities.
Discerning how the levels of media use relate to physical activity is difficult, Rideout explained, because the media-use measures fail to capture the other activities in which children and adolescents may be engaged at the same time that they are using media. For example, some video games engage the user in physical activity, and young people may be listening to music while working out or have the television on in the background while performing low-level physical activities at home. Because of widespread concern that a great deal of media use is primarily sedentary and is displacing physical activity, the researchers also collected data on physical activity.
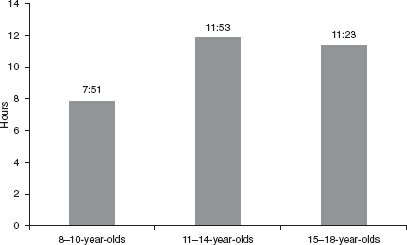
FIGURE 5-3 Total amount of media exposure in a typical day for various age groups, 2009.
SOURCE: Adapted by the author from “Report: Generation M2: Media in the Lives of 8- to 18-Year-Olds,” (#8010), The Henry J. Kaiser Family Foundation, January 2010.
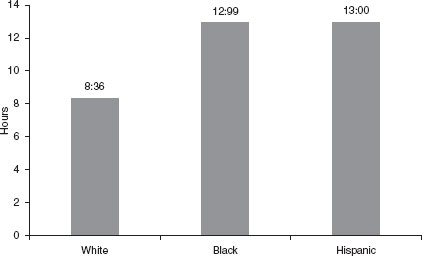
FIGURE 5-4 Total amount of media exposure for 8- to 18-year-olds in a typical day, by race/ethnicity.
SOURCE: Adapted by the author from “Report: Generation M2: Media in the Lives of 8- to 18-Year-Olds,” (#8010), The Henry J. Kaiser Family Foundation, January 2010.
They compared these data with media use, separating respondents into three groups corresponding to low, moderate, and heavy media use. They found no variation among the groups in the amount of physical activity in which they engaged on a typical day. Rideout noted that in the five large studies of media use she has conducted, she has never found a relationship between time spent using media and time spent in physical activity. This finding has been “surprising, but consistent,” she noted, although she added that the measures of physical activity were not very precise: respondents reported how much time they had spent the previous day on such activities as exercise, sports, and dancing, and it is possible that lower-level physical activities differ between heavy and light media users.
For the study of food advertising on television (Gantz et al., 2007), the researchers decided not to use commercial data. In this case, Rideout noted, commercial data can provide raw information, such as the number of advertisements in a certain category that ran in a particular time period. At the time this study was conducted, however, these commercial services did not allow the researchers to view the ads and code their content. Many other studies, she added, have taken a sample of children’s television programming and counted the number of food advertisements that are aired during that programming. For the Kaiser study, she explained, the researchers performed a content analysis of all the programming and advertisements (not just children’s programming) seen by young people in three age groups and compared those data with information about viewing habits. This approach enabled them to determine how much of the viewing time was spent on children’s programming and how much on other programming (as well as how much on noncommercial programming), and thus to obtain a more detailed picture of the children’s advertising exposure. Some of the study results are shown in Table 5-1. In response to a question, Rideout noted that product placement and story lines that address obesity-related issues add to the messaging received by children and adolescents. However, this issue has not yet been systematically studied.
In response to a request from committee members for an analysis of children’s exposure to advertising for sedentary activities, Rideout noted that the largest category of advertising for all age groups was television promotions (advertisements for future broadcasts), which, she suggested, are essentially ads for a sedentary activity. Another major category was advertising for other media products.
In addition, children and adolescents are exposed to a substantial amount of food and beverage advertising each day. At the time these results were collected (2005), Rideout explained, these data translated into 12 food
TABLE 5-1 Annual Exposure to Advertisements, Public Service Announcements (PSAs) and Television Promotions by Age Group 2005
| Age Group | |||
| 2-to 7-Year-Olds | 8-to 12-Year-Olds | 13- to 17-Year-Olds | |
| Television promotions | 5,765 | 8,407 | 6,977 |
| Food advertising | 4,427 | 7,609 | 6,098 |
| Media ads | 2,280 | 5,046 | 4,866 |
| Communications | 456 | 1,462 | 1,676 |
| Toys | 597 | 620 | 196 |
| Fitness ads | 61 | 163 | 174 |
| PSAs on fitness or nutrition | 164 | 158 | 47 |
SOURCE: Gantz et al., 2007.
and beverage ads per day for the youngest children, 21 for 8- to 12-year-olds, and 17 for teenagers. The study also documented children’s exposure to public service announcements (PSAs) on fitness or nutrition. Over the course of a year, adolescents, on average, saw 25 minutes of public health messages on either fitness or nutrition and 40 hours of food and beverage advertising. Children aged 8 to 12 were exposed to 1 hour, 15 minutes of PSAs on fitness or nutrition, compared with 50 hours of food and beverage advertising. Rideout also noted that the number of PSAs likely is lower now because the data were collected while a major public health campaign was under way.
Several workshop participants agreed that this amount of media use and exposure to advertising clearly has a considerable influence on children and adolescents. As one committee member observed, researchers have as yet been unable to tackle the problem of understanding “the full impact of the integrated whole—from billboards to TV to ‘advergames’ to modeling of consumption by parents—but it is likely to be much greater than the sum of its parts.”
Presenter: Shu Wen Ng
Discussion of the food environment in Chapter 3 suggests the important role of the food industry in determining the kinds of food and beverages available around the country. Ng focused in greater detail on the data available on the food supply. First, she noted that foods and beverages fall into three broad categories: unpackaged raw and perishable foods; packaged processed foods; and prepared, completed dishes or meals. These
TABLE 5-2 Locations for Purchase and Consumption of Food and Beverages
| Categories of Foods and Beverages | |||
| Raw and Perishable | Packaged and Processed | Prepared | |
| Locations of Purchase | Grocery, supermarket, tienda, farmer’s market, cafeteria | Grocery, supermarket, tienda, convenience store, vending machine | Quick-service restaurant, full-service restaurant, grocery, cafeteria (school, work) |
| Locations of Consumption | Home, cafeteria | Grocery, cafeteria, on the go, school, workplace, home | Quick-service restaurant, full-service restaurant, grocery, cafeteria (school, work), on the go, home |
SOURCE: Ng, 2011.
products are purchased and consumed in different places, as shown in Table 5-2. This basic structure is important for understanding what is captured by the various sources of data available, Ng noted.
There is an array of public data on these three food categories, Ng explained. One is the National Health and Nutrition Examination Survey (NHANES),2 which collects information on the foods people report consuming. The U.S. Department of Agriculture (USDA) has developed 7,500 unique food codes that are used to classify this information; Ng noted that only about 5,700 of the categories were reported in NHANES 2007-2008. For each of these food codes, USDA has calculated the content for more than 60 nutrients per 100 grams of the food, so, Ng observed, “in theory we can figure out a lot about what nutrients we are getting.”
There are also sources of commercial data, Ng explained, that focus on food sales. The universal product codes (UPCs) that are scanned at the cash register in most places that sell packaged foods provide considerable data. There are 600,000 unique UPCs, but Ng noted that many are for multiple packaging options for the same product; in reality, then, there are approximately 200,000 uniquely formulated food and beverage items. For these items, nutritional information is limited to what is included on the nutrition facts label and the ingredients list. Ng mentioned that price lookup codes (PLUs) (numerical codes for produce that are used to streamline checkout and inventory) can be matched to USDA’s nutrition data if the produce
________________
2For more information on NHANES, see http://www.cdc.gov/nchs/nhanes.htm (accessed August 2011).
was purchased at a supermarket, but that products purchased at farmer’s markets, for example, are not captured.
Disconnects exist between the public and commercial data, Ng explained. Meshing USDA’s 7,500 food codes with the 200,000 unique formulations poses a challenge, and the public data provide significantly more detailed nutrition information. If one considers a specific set of foods—even something as simple as a peanut butter sandwich—the challenge is evident. The NHANES data have generic codes for whole wheat bread and for peanut butter, whereas the commercial codes identify specific brands and types (e.g., reduced-fat, creamy peanut butter), which may vary significantly in their nutritional content. Moreover, manufacturers and retailers continually make changes to products, so the UPCs or the existing nutritional information for a particular UPC may quickly become outdated.
Researchers are likely to need both public and commercial data, Ng explained, in part because of the limitations of publically available data. Sample sizes for these data are sometimes too small to support conclusions, and sample designs are sometimes limited. Moreover, these data often are based on self-reported dietary recall for the past 1 or 2 days, which may be inaccurate because of recall bias or underreporting, and they usually are subject to a considerable lag time—approximately 2 years for NHANES data. Many academic economists and researchers at marketing and business schools, food research programs, and USDA have begun using commercial data to supplement the public data, Ng noted. However, commercial data are not retained indefinitely, so researchers need to be sure how long they will be available to work with, Ng added.
Compared with public data, commercial data tend to have larger subpopulation sample sizes and to better represent usual intake, Ng explained. In many cases, such data provide greater detail in terms of the units of observation (which include individuals, households, stores, markets, and the nation); geographic areas (which include counties, states, markets, and the nation); and time (data are often available on a weekly, 4-weekly, quarterly, and annual basis).
There are several sources of commercial data, Ng explained, obtained mainly through UPC scans. Three frequently used food purchase data sets based on UPC data in the United States are the Nielsen Scantrack, SymphonyIRI Total Store Advantage, and the Nielsen Homescan. These data sets provide information such as
• point-of-sale data, which indicate sales (in total volume and dollars) for food and beverage products by week and year at different sorts of establishments, and can also show how sales fluctuate in response to product promotions, changes to in-store displays, or price changes (Nielsen Scantrack and SymphonylRI); and
• household panel scanner data, which indicate household purchases of food and beverage products for each shopping occasion, including information about promotions and prices (Nielsen Homescan).
Other commercial sources, such as the Gladson Nutrient Database and the Mintel Global New Product Database, may provide nutrition data for packaged food, that is, label information associated with the UPC, including the nutrition facts panel and ingredients list.
Nonetheless, commercial data have limitations, Ng explained. One limitation is that the data generally do not cover sales at major food outlets, such as big-box and discount club or warehouse stores, or sales from vending machines or food-service locations such as cafeterias and restaurants. Furthermore, the data sets are not always updated comprehensively, and values (such as those on the nutrition facts panel) are typically rounded—both of which can affect the accuracy of the information. Prior data often are overwritten when new data become available, and so may not be accessible to researchers. Obtaining access to commercial data generally is more expensive than obtaining access to public data, and researchers cannot always gain access to the data or to full information regarding the sampling frame used to collect them.
Making optimal use of both public and commercial data requires care, Ng explained. For example, she and her colleagues are developing a bridge between UPCs and USDA food codes so they can compare changes in calories sold and purchased with reports of calories consumed over time and use commercial nutrition data to update the USDA food composition data. Their goal is to weight the data by portion of sales so that USDA food composition data will be more representative of the changing food supply. For this approach to be useful, Ng added, the data will be updated regularly and must be cross-validated using trend analyses to determine whether the findings are consistent.
In Ng’s view, drawing on commercial data and integrating them with public data where possible is important for several reasons. First, as noted by others, she believes that “what gets measured, gets changed” (Chriqui et al., 2011). She also believes that such data integration can promote a clearer understanding of the food supply and thus also promote self-regulation by food manufacturers, retailers, and food service companies. Integration also may encourage marketing companies to collect data that may be useful for public health research.
Even with integrated data, however, researchers lack information about foods without UPCs and those eaten in restaurants and cafeterias or obtained from concessions and vending machines. Ng noted in answer to a question that a few sources of data about foods eaten away from home rely on surveys and purchase receipts, but it is not easy to obtain a comprehensive
picture of this category of consumption. Moreover, researchers do not control—and do not always have information about—the sampling frames used in commercial data collection. Nevertheless, in Ng’s view it is necessary to draw on both public and commercial data to obtain the clearest picture of the food supply.3
EVALUATING LARGE-SCALE COMMUNICATION AND SOCIAL MARKETING PROGRAMS
Presenter: Robert C. Hornik
Advocates and researchers are interested in how media can be used to inform the public about health issues and influence people to make healthier choices. They recognize the importance of evaluating interventions that make use of media messages to understand their relative effectiveness. Many view randomized controlled trials as the optimal way to conduct such evaluations, Hornik explained, but in his view these trials are not always the gold standard for evaluating large-scale communication and social marketing programs.
To explain, Hornik began with an overview of the three primary ways social marketing programs work. Some are designed to influence individuals to change their views and behaviors using some sort of persuasive content. To evaluate these programs, it would be necessary to compare individuals who were or were not exposed to the content (or had more or less exposure). Other programs operate through a social path, with the expectation that people who are directly exposed to the intervention will share that experience in some way with others, who in turn will make changes. To assess such an effect it is necessary to compare social networks that have and have not been exposed to the intervention. A third path of effect is through institutions—where, for example, communication interventions convince school officials to change vending machine policies or manufacturers to change the formulations of food products that influence consumer behavior. When this is the intended path of effect, it is necessary to compare communities.
Given these complex paths through which interventions may operate, evaluators face a difficult practical task, Hornik explained. A great deal of information about food and nutrition and physical activity is being transmitted through both public health messages and regular media cover
________________
3Ng mentioned several resources for those interested in commercial food and beverage data: the National Collaborative on Childhood Obesity Research (NCCOR) Catalogue of Surveillance Systems (described in Chapter 4), the University of Chicago Kilts Center for Marketing, and the USDA Economic Research Service.
age. Individuals, groups, and institutions are exposed, and because effects from any of these messages may operate at all three levels, evaluation that often focuses on comparing change in individuals may miss important effects. Another complication for randomized controlled trials is that changes resulting from public health messages generally are expected to occur slowly: it may take years for a significant change to be evident, and the changes in a single year are likely to be very small, Hornik added. For example, the single most successful public health effort in the United States has been the campaign against smoking. Over time this campaign led to major changes in behavior. However, noted Hornik, if these changes were examined year to year—when they were on the order of 1-2 percent per year—using samples powered only to find large changes, the success of the campaign would not have been evident. In Hornik’s view, randomized controlled trials are better suited to detect large, quick changes, but small, slow changes can be important as well.
Another issue is that social marketing campaigns are not fixed in the same way as drug or vaccine trials. “What we are really talking about here is a process for evolving an intervention,” Hornik observed. Those responsible for the intervention are constantly monitoring the way people are responding to it, and they adapt the message accordingly. It is difficult to conduct a randomized trial under these conditions, noted Hornik. In many cases, moreover, it is politically unacceptable to attempt a pure randomized controlled trial. For example, Hornik participated in the evaluation of the U.S. national anti-drug campaign, a case in which having some areas purposely not receiving the anti-drug messages was not acceptable to those responsible for conducting the campaign.
The central problem, in Hornik’s view, is that randomized controlled trials “risk getting a very good answer to the wrong question.” If the study design requires controlling for many sources of variation, it may limit the natural diffusion of the message. For example, to ensure that some communities are not exposed to a particular message, “we may not allow Oprah to talk about the issue. Or allow the national media to work as it normally does in picking up messages and distributing them broadly.” So, in effect, one would intentionally have to do a poor job of social marketing in order to be able to control diffusion of the message.
Hornik described alternatives to randomized controlled trials. One such design is a long-term cohort study, which was used for the National Youth Anti-Drug Media Campaign. To evaluate this program, researchers followed a cohort of youth over an approximately 4-year period and used evidence of their degree of early or ongoing exposure to the campaign to try to predict whether they showed change on selected outcomes (Hornik et al., 2008). The outcomes included attitudes and beliefs about drugs and intentions to use drugs. A similar design was used to analyze the effects
of the VERB™ physical activity campaign, where researchers also tried to determine whether early exposure to an intervention predicted change over time (Huhman et al., 2007). In both cases, it was necessary to have large sample cohorts, Hornik noted, which made the studies expensive to conduct. Thus, he observed, this design may be most suitable for case in which the social marketing program has well-defined and stable expected outcomes and the resources necessary to follow representative samples over a period of years.
Another option is geographic cross-community comparisons, which have been used to evaluate a number of anti-smoking campaigns. Researchers using this approach try to identify planned or naturally occurring variation in exposure to particular messages to see whether it predicts varied outcomes. For example, Wakefield and colleagues (2008) conducted several studies comparing media markets that had high volumes of anti-smoking commercials with other markets that had lower volumes to see whether there was a relationship with rates of smoking. In another study, Farrelly and colleagues (2009) used the same approach to examine the effects of positive images of smoking in the media; they compared gross ratings points (GRPs)4 purchased for the truth® campaign by media market and found an association between GRPs purchased and less smoking among youth at the media market level. This sort of design, Hornik noted, is appropriate when roughly comparable media markets are likely to have received different levels of exposure to a message, so one can make a case that the differential exposure is the only difference between them that can reasonably account for different outcomes.
Interrupted time series studies are another option, Hornik noted. In this type of study, observations are collected at multiple points before and after a campaign (the “interruption”) is introduced, and researchers look for evidence of a marked change in the rate of a particular behavioral outcome associated with the campaign. The data are used to establish that there is no other likely explanation for the change, Hornik explained. Such studies are useful when the timing of a campaign is precise, and it is designed to cause a sharp change. Examples include evaluations of an anti-drug campaign in Kentucky (Palmgreen et al., 2002), the Click It or Ticket seatbelt use campaign in North Carolina (Williams et al., 2002), and a vasectomy promotion campaign in Brazil (Kincaid et al., 2002).
Associated time series studies, a similar approach, can be used to evaluate campaigns with less discrete time frames. In this variation, Hornik
________________
4GRPs is a term used in advertising to measure the size of an audience reached by a specific media vehicle or schedule. GRPs are calculated by multiplying the percentage of the target audience reached by an advertisement by the number of times the target audience sees the advertisement during a given campaign.
explained, researchers document changes in behavior that coincide with “the accumulating presence of the intervention.” They try to determine whether other possible explanations for behavioral changes are viable by comparing regions that have and have not been exposed to the intervention. Such studies are useful for evaluating longer-term interventions for which good-quality data about outcomes exist when there are few plausible alternative explanations for observed effects, Hornik noted.
One example is a study of the National High Blood Pressure Education Program (Roccella, 2002). This program encompassed many different efforts (as opposed to a more discrete campaign that would be suitable for an interrupted time series) focused over an extended time (the 1970s and 1980s) designed to encourage people to have their blood pressure checked and ensure that physicians were giving the right medications. Another example is a study of the California Tobacco Control Program (Pierce et al., 2002). In this study, researchers looked at rates of smoking and sales and purchases of tobacco over a period that included a range of anti-smoking efforts, and compared California data with data for other states that did not receive the interventions.
Researchers also use small-scale quasi-experiments to compare a small number of treatment and control areas over time to see whether their change trajectories were the same, Hornik noted. There is a substantial risk that the treatment and control areas will not be sufficiently comparable to support strong claims, he cautioned, so such studies are most useful when there is little risk that differences unrelated to the intervention will affect outcomes. In one such study, of the Stanford Five City Project, researchers compared two treatment communities with two nontreatment communities (Farquhar et al., 1990). In another study, researchers compared communities that had a school anti-smoking program with communities that had that program plus a media campaign (Worden and Flynn, 2002).
In Hornik’s view, each of these methods offers a reasonable alternative to randomized controlled trials in some contexts (although he noted that quasi-experiments may be less useful than the other approaches). “When you move to these sorts of designs,” he concluded, “you have to tolerate a useful, if imperfect, answer, but at least the answer is to the right question.”
Hornik’s presentation prompted discussion of several issues. He was asked to summarize the primary methodological barriers to an effective evaluation of a large-scale communication and social marketing program. A primary barrier, he responded, is the challenge of obtaining accurate estimates of people’s exposure to an intervention, as well as of outcomes. Smoking, for example, is “a pretty discrete behavior,” he commented, but “a lot of different behaviors go into it (e.g., initiation, moving from trial use to addicted use, quitting attempts, quitting with various forms of personal and pharmacological assistance) and you may have to look at each of those
separately when constructing a persuasive campaign.” Thus, to measure outcomes, it is necessary to consider carefully which behavior one wants to change. In the case of obesity, it is much easier to change—and to measure changes in—food companies’ actions than people’s behaviors with regard to food. “We are kind of a long way from being able to link changes in exposure to changes in diet,” a presenter commented.
Rideout agreed, noting that “you have to be very precise about what you want to accomplish.” In her view, the suitable goal for a social marketing campaign is to raise awareness of risks and other information that can support behavioral changes. “It’s the first step,” she argued. Hornik responded that raising awareness should not be the only goal for a social marketing campaign. He suggested, that, although institutional and other communication interventions may need to occur together, “there’s a fair amount of evidence for behavioral effects of media campaigns.”
Is it then necessary to “invent a whole new system to measure both the exposure and the outcome”? another participant wondered. Hornik acknowledged that, for example, having a national cohort sample would make it easier to assess the effectiveness of strategies. He believes, however, that by combining the kinds of exposure data discussed by Rideout with data on changes such as those discussed by Ng, the approaches he described should make it possible to make some valuable claims.
Chriqui, J. F., J. C. O’Connor, and F. J. Chaloupka. 2011. What gets measured, gets changed: Evaluating law and policy for maximum impact. Journal of Law, Medicine and Ethics 39(Suppl. 1):21-26.
Farquhar, J. W., S. P. Fortmann, J. A. Flora, C. B. Taylor, W. L. Haskell, P. T. Williams, N. Maccoby, and P. D. Wood. 1990. Effects of communitywide education on cardiovascular disease risk factors. The Stanford Five-City Project. Journal of the American Medical Association 264(3):359-365.
Farrelly, M. C., J. Nonnemaker, K. C. Davis, and A. Hussin. 2009. The influence of the national truth® campaign on smoking initiation. American Journal of Preventive Medicine 36(5):379-384.
Gantz, W., N. Schwartz, J. R. Angelini, and V. Rideout. 2007. Food for thought: Television food advertising to children in the United States. Menlo Park, CA: Kaiser Family Foundation.
Hornik, R., L. Jacobsohn, R. Orwin, A. Piesse, and G. Kalton. 2008. Effects of the National Youth Anti-Drug Media Campaign on youths. American Journal of Public Health 98(12):2229-2236.
Huhman, M. E., L. D. Potter, J. C. Duke, D. R. Judkins, C. D. Heitzler, and F. L. Wong. 2007. Evaluation of a national physical activity intervention for children. VERB™ campaign, 2002-2004. American Journal of Preventive Medicine 32(1):38-43.
Kincaid, D. L., A. P. Merritt, L. Nickerson, S. de Castro Buffington, M. P. P. de Castro, and B. M. de Castro. 2002. Impact of a mass media vasectomy promotion campaign in Brazil. In Public health communication: Evidence for behavior change, edited by R. Hornik. Mahwah, NJ: Lawrence Erlbaum Associates. Pp. 179-196.
Ng, S. 2011. Can commercial data help in measuring and accelerating obesity prevention efforts? Presented at the Institute of Medicine Workshop on Measurement Strategies for Accelerating Progress in Obesity Prevention, March 23, Irvine, CA.
Palmgreen, P., L. Donohew, E. P. Lorch, R. H. Hoyle, and M. T. Stephenson. 2002. Television campaigns and sensation seeking targeting of adolescent marijuana use: A controlled time series approach. In Public health communication: Evidence for behavior change, edited by R. Hornik. Mahwah, NJ: Lawrence Erlbaum Associates. Pp. 35-56.
Pierce, J. P., S. Emery, and E. Gilpin. 2002. The California tobacco control program: A long-term health communication project. In Public health communication: Evidence for behavior change, edited by R. Hornik. Mahwah, NJ: Lawrence Erlbaum Associates. Pp. 97-114.
Rideout, V., U. G. Foehr, and D. F. Roberts. 2010. Generation M2: Media in the lives of 8-18 year-olds. Washington, DC: Kaiser Family Foundation.
Roccella, E. 2002. The contributions of public health education toward the reduction of cardiovascular disease mortality: Experiences from the National High Blood Pressure Education Program. In Public health communication: Evidence for behavior change, edited by R. Hornik. Mahwah, NJ: Lawrence Erlbaum Associates. Pp. 73-83.
Wakefield, M. A., S. Durkin, M. J. Spittal, M. Siahpush, M. Scollo, J. A. Simpson, S. Chapman, V. White, and D. Hill. 2008. Impact of tobacco control policies and mass media campaigns on monthly adult smoking prevalence. American Journal of Public Health 98(8):1443-1450.
Williams, A. F., J. K. Wells, and D. W. Reinfurt. 2002. Increasing seat belt use in North Carolina. In Public health communication: Evidence for behavior change, edited by R. Hornik. Mahwah, NJ: Lawrence Erlbaum Associates. Pp. 85-96.
Worden, J. K., and B. S. Flynn. 2002. Using mass media to prevent cigarette smoking. In Public health communication: Evidence for behavior change, edited by R. Hornik. Mahwah, NJ: Lawrence Erlbaum Associates. Pp. 23-34.


