
Whether water reuse makes sense for a region depends, in part, on its cost compared with the costs of other feasible water management alternatives (e.g., new supplies, expanded conservation efforts) and the cost of not pursuing any water management changes. If a community chooses not to augment its water supply, it avoids those associated costs but also misses or postpones the benefits of doing so. Because new water supply options are likely to cost more than the existing supplies (assuming no more of the existing water supply is available), the costs of water reuse need to be compared to the cost of other new-supply options.
In this chapter, the concepts of financial and economic analysis are introduced, and the costs of reuse are categorized. As described in Chapters 4 and 5, a wide variety of treatment processes can be incorporated into a reuse system to meet specific water quality goals for intended uses and to address local site-specific constraints. Thus, it is difficult to make general statements about the cost of water reuse. The committee, instead, presents example costs from potable and nonpotable reuse facilities that responded to a committee questionnaire, and where feasible, compares the costs of water reuse against other alternative water supplies.
When assessing the economic viability of a water supply project, it is important to understand the difference between economic costs and benefits and financial accounting of costs and benefits, which are rarely, if ever, the same (NRC, 2008b). Financial costs involve how much the utility has to pay to construct and operate the project, including interest costs. Economic costs account for all of the costs to whomever they may accrue. These include the financial costs of carrying out the project, as well as costs that take the form of impositions on or losses to anyone who is affected by the project. Examples of broadly experienced costs are odors, loss of open space, or additional greenhouse gas emissions. Examples of broadly experienced benefits are reduced nutrient discharge to surface waters and economic benefits provided by a reliable water supply.
The concept of economic cost has been captured in the idea of the “triple bottom line,” which encompasses the financial, social, and environmental impacts of a project. With a triple-bottom-line approach, the project sponsor is considered to have an obligation to examine environmental and social impacts, not just profitability. The analyses undertaken in environmental impact reviews are consistent with triple-bottom-line thinking, although environmental review as an obligation ends with project certification. In contrast, triple-bottom-line approaches call for ongoing review and analyses of financial, social, and environmental costs of a project, which are often summarized in annual reports. Triple-bottom-line accounting runs into the same challenges faced by economic valuation: the difficulty of valuing environmental and social impacts (Norman and MacDonald, 2004). This difficulty means that triple-bottom-line processes offer more guidance than quantitative comparative analysis, although the concept does alert business and public agency leaders that the public is aware of difficult-to-monetize im-
pacts of their practices and the importance of striving for full accountability for one’s impacts on society and the environment.
Both financial and economic perspectives are needed when assessing water supply. If a region’s water authority cannot afford a project, even one with net benefits to society, it will not get built. Subsidies are sometimes provided by local, state, or federal agencies to offset the financial costs for demonstration of new technologies or for projects with broad economic benefits that cannot be captured in an individual utility’s rate structure. For example, the Metropolitan Water District of Southern California has offered a $250 per acre-foot subsidy ($767 per million gallons; $200 per thousand m3) for up to 25 years for local water development to reduce the region’s dependence on imported Colorado River water. The Bureau of Reclamation’s Title XVI has also been a source of subsidies for water reuse projects since 1992 (see Box 9-1). Traditional water supplies may also receive subsidies.
FACTORS AFFECTING THE FINANCIAL COSTS OF WATER REUSE PROJECTS
Whether reclaimed water is used for nonpotable or potable uses, there are several factors that affect the costs of a water reuse program. These include the location of a reclaimed water source (i.e., the wastewater treatment facility), treatment infrastructure, plant influent water quality, customer use requirements, transmission and pumping, timing and storage needs, energy requirements, concentrate disposal, permitting, and financing costs.
Size and Location
In most cases, reclaimed water systems originate at a municipal wastewater treatment plant. Wastewater treatment plants are typically constructed at lower elevations and within close proximity to a point of discharge such as a river, lake, or ocean. As a result, there are pumping costs to bring reclaimed water to the customers or to the water treatment plant, which is typically sited at higher elevations. In U.S. cities, wastewater treatment plants have evolved into large-scale facilities serving extensive areas. This has provided economies of scale and equitable service, minimized impacts on nearby land uses, and centralized technical management.
BOX 9-1
Federal Subsidies for Water Reuse Through the Title XVI Program
The Title XVI program was originally launched in 1992 in the Reclamation Projects Authorization and Adjustment Act (Public Law 102-575). The act directed the Secretary of Interior “to undertake a program to investigate and identify opportunities for reclamation and reuse of municipal, industrial, domestic, and agricultural wastewater, and naturally impaired ground and surface waters” and to support, “the design and construction of demonstration and permanent facilities to reclaim and reuse wastewater.” The act also directed the Secretary “to conduct research, including desalting, for the reclamation of wastewater and naturally impaired ground and surface waters.” The original act authorized cost sharing for three feasibility studies and for the construction of five reuse projects, including three in Southern California, and the act has since been amended to authorize additional projects. Title XVI has been administered through the Bureau of Reclamation.
As of November 2010, approximately $531 million has been appropriated for Title XVI projects, mostly in California, including $135 million from the American Recovery and Reinvestment Act of 2009. Unless specified by Congress, federal funding support is limited to projects in the 17 western continental states. The program has generally provided cost sharing for up to 25 percent of the total project costs, with a project maximum of $20 million. These funds historically have helped reuse projects move forward more quickly than they might have otherwise. Of the 53 authorized projects, 42 have received some funding and 16 have either been completed or have reached the maximum cost-shared funding limit. Three additional projects have received at least 80 percent of their authorized funding. As of the end of 2010, the program had a $630 million backlog for projects that have been authorized and are awaiting appropriations, a significant increase from the $354 million backlog in 2006 (Cody and Carter, 2010). Considering this growing backlog, the recent Congressional Research Service report by Cody and Carter (2010) examined program priorities and the federal role in supporting reuse.
Centralized treatment facilities have been preferred throughout history, but the analysis of benefits changes when one thinks of a wastewater treatment system as a source of water instead of a location for disposal of water. Multiple smaller, decentralized plants could provide several advantages as reuse systems because the location
of water treatment is closer to the customers, reducing the cost of transmission and distribution infrastructure. Multiple treatment facilities could also improve system redundancy, and therefore reliability, through the interconnection of more than one source of reclaimed water. Several smaller plants may also be able to accommodate fluctuations in demand more effectively than one large centralized plant. Retrofitting centralized treatment facilities to provide redundancy can be costly if new infrastructure (e.g., transmission pipelines, pumping stations, and storage facilities) is required for the sole purpose of interconnecting more than one system or service area (Gikas and Tchobanoglous, 2009).
Treatment Infrastructure
In most cases, nonpotable uses of reclaimed water (e.g., irrigation, industrial) require a quality of water that is not much different than what a typical secondary or advanced wastewater treatment plant would produce. For the most part, turbidity, biochemical oxygen demand, and coliform standards are similar between nonpotable reuse applications and secondary treatment permit requirements, although there may be some variations in effluent quality requirements. Thus, the startup of a nonpotable reclaimed water program typically does not require a large investment in additional treatment facilities. Some facilities may need to incorporate improvements to existing infrastructure, such as improved filtration, additional chlorination for maintaining a residual, and more efficient technologies to meet regulatory requirements.
Some customers, however, may have specific water quality requirements that will necessitate a higher level of treatment. Irrigation customers, golf courses in particular, and industrial customers may impose quality restrictions that may considerably increase the capital and operating costs of a reuse program. Water reclamation treatment processes can be designed to treat or remove constituents that negatively affect the quality of the effluent or that are limited by contractual commitments with the users. In arid states, total dissolved solids (TDS) of the reclaimed water can be a concern. For example, at El Paso Water Utilities, potable water must sometimes be used to dilute the reclaimed water produced to reduce TDS to acceptable levels. This dilution step becomes costly to the utility, considering that reclaimed water rates are typically less than potable rates. In Scottsdale, Arizona, additional treatment to lower the TDS in product water has been incorporated with use of reverse osmosis systems on a portion of the effluent prior to distribution. The cost of operation of a reverse osmosis facility depends on many factors, including quality of the source water (inflow), quality of the effluent, the cost of energy, and the cost of concentrate disposal (see also Chapter 4). As an alternative, individual industrial reclaimed water users that have specific pollutants of concern (e.g., silica for industrial cooling water) can implement point-of-use treatment systems to address these constituents, rather than requiring treatment at the water reclamation plant, thereby reducing a facility’s treatment costs.
Potable reuse projects require substantially more treatment and barriers within the treatment train, and therefore require larger investments in treatment infrastructure than nonpotable projects, although the costs can vary with the treatment components selected (see Figure 4-1). Enhanced treatments steps, such as those used at the Orange County Water District (see Box 2-11), have been key to gaining public acceptance of major potable reuse projects. However, such extensive treatment is also costly and energy intensive and may not be viable in all potable reuse applications.
Influent Water Quality
Incoming water quality is a crucial factor in the production costs of reclaimed water. Typically, the source of water to a reclamation facility is the effluent of a wastewater treatment plant. Several factors can affect its quality, affecting overall treatment costs.
• Consumer water softening. The increased use of self-regenerating water softeners by customers has posed water quality challenges on wastewater treatment plants producing reclaimed water. High levels of salts in reclaimed water may impair its use unless additional pre- and/or post-treatment is implemented, which increases the cost of producing reclaimed water. Flow diversion programs have been developed in cities such as Las Vegas, where conductivity meters (used to measure TDS) trigger automatic valves to divert high-conductivity wastewater effluent around satellite water reclamation facilities (Crook, 2007).
• Water conservation. As indoor water conservation programs become more effective, the volume of wastewater discharges diminish, but the pollutant mass often remains unaffected. As a result, the concentration of constituents in wastewater increases, requiring additional treatment and therefore additional costs at the wastewater or reclaimed water facility on a volume basis.
• Industrial pretreatment. Implementation of a pretreatment program can limit the discharge of constituents that would negatively affect the treatment process and/or the quality of the effluent. In nearly all U.S. states, pretreatment programs are required, and certainly for those plants with a capacity greater than 5 million gallons per day (MGD; or 19,000 m3/d). The intent of these programs is to detect and address the existence of constituents that would affect the quality of the product, compliance with regulatory entities, or contractual requirements with users, which thereby reduces reclaimed water production costs (see also Box 10-1 for a discussion of the National Pretreatment Program).
Transmission and Pumping
Delivery of reclaimed water to consumers may add a substantial capital cost to a water reuse project based on the location of the treatment facility and the distance to the service area(s). Extensive piping costs can be required when separate transmission and distribution lines need to be installed for nonpotable reclaimed water. Operating costs could also vary substantially for a system in a varied topography, where the source (the wastewater treatment plant) is typically located at lower elevations and the customers are in the higher elevations, requiring the delineation of multilayered pressure (service) zones for delivery of adequate system pressures. Additional costs include service connections to the customers and an integrated billing system.
The delivery of reclaimed water to individual customers through a dedicated network of pipes, reservoirs, and pumping stations adds considerable economic burden. Construction of piping (transmission and distribution systems), pumping, and storage facilities is comparable to the cost of the same infrastructure for a drinking water system, although specific design requirements must be observed. In the United States, purple color coding is standardized for all reclaimed water pipes. In some states, reclaimed water pipelines must be constructed with a minimum separation from the potable water systems. For example, in Texas (30 TAC § 210), the regulatory agency for reclaimed water requires a minimum separation distance from a newly installed reclaimed water pipeline to a potable water line of 9 ft (2.7 m) horizontally and 2 ft (0.6 m) vertically (Texas Commission on Environmental Quality, 1997).
The Southwest Florida Water Management District (SWFWMD, 2006) estimated that transmission and distribution costs for reuse ranged from $5 per inch diameter/linear foot in rural areas to $9 per inch diameter/linear foot in urban areas (in 2006 dollars). In 2008, the SWFWMD estimated per lot residential distribution capital costs from $1,090 to $1,440 including the meter and related appurtenances, based on recent reuse project data. The SWFWMD estimated that these costs could be reduced by 50 percent in new subdivisions (SWFWMD, 2008). By treating water to drinking water standards, potable reuse projects alleviate the need for costly separate water transmission, distribution, and storage systems.
Existing stream channels can also be used to convey reclaimed water from a wastewater treatment plant to a downstream water treatment plant intake, assuming water rights laws allow for such conveyance. The El Paso Water Utility and the Trinity River Authority discharge treated wastewater into streams while maintaining rights to withdraw that water downstream for reuse under the Texas “Bed and Banks” statute (Texas Water Code § 11.042). This statute allows reclaimed water to be transferred substantial distances without the associated infrastructure costs required by Texas’ legal definition of “direct reuse,” where all reclaimed water must be transferred by constructed water infrastructure. Reuse of this water allows the utilities to get the most out of their existing water rights. See also Chapter 10 for more detailed discussions of water rights and water reuse.
In some cases, regional collaborative initiatives have been developed to enhance reuse while taking advantage of natural conveyance systems. For example, the Upper Trinity Regional Water District (See Box 2-3) discharges reclaimed water to the Trinity River which is then used as a water source for downstream municipal
customers. The quantity of water available to municipal customers is based in part on those utilities’ returned wastewater flows. Numerous agreements involving state and regional water agencies were needed in this collaborative initiative. Similarly, the City of Las Vegas earns gallon-for-gallon return-flow credits for advanced-treated water returned to Lake Mead.
Timing and Storage Needs
In a typical drinking water system, the distribution and storage system is designed to convey water to the customer to meet peak customer demand, which reflects an aggregate of residential, industrial, and irrigation uses. In nonpotable reclaimed water systems, the distribution and storage system is typically designed to meet a more specific customer demand, which can create challenges for the system design. For example, facilities that primarily produce reclaimed water for irrigation purposes face the dilemma of extra production during winter months when irrigation is at its lowest (Figure 9-1). Alternatives to mitigate this problem include increased discharge into surface waterways or subsurface injection to reduce seawater intrusion. At Laguna de Santa Rosa, California, low irrigation demands are offset by additional supply for industrial purposes at the Geysers Project, a geothermal power station (Crook, 2007). Agencies also take steps to limit peak demand for reclaimed water. Dunedin, Florida, imposes a fee on customers that use more than the allotted summer demand. This is an incentive to keep peak demands as low as possible and reduce the need to provide additional storage to meet these demands. Widely variable seasonal demand can add to the overall costs of the water reuse project; thus, advanced planning to minimize the unused capacity in nonpotable reuse systems is essential to optimizing the cost-effectiveness of a nonpotable reuse project.
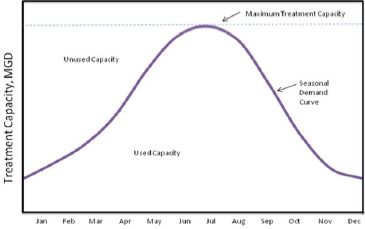
FIGURE 9-1 Seasonal demand curve for a hypothetical non-potable reuse system, showing large unused supplies in winter months.
SOURCE: CSDWD (2006).
Decreases in reclaimed water demand create another challenge: lower water quality due to primary productivity (e.g., algal growth) and the release of taste and odor compounds during the longer storage time. Some storage facilities incorporate a recirculation system to allow for continuous mixing of the water and in some cases have provisions for addition of chemicals such as sodium hypochlorite to prevent growth of organisms. Some systems include equipment that can allow pipelines to drain any water that does not meet the required quality controls back to the plant for treatment via sanitary sewer systems. These extra treatment costs are part of the overall cost of reclaimed water.
Nonpotable reuse customers also have different diurnal demand patterns. Industrial customers may also impose specific time-of-day requirements on the supply. Diurnal peak demands are typically met through a series of storage reservoirs throughout the system, which adds to a system’s overall costs. However, by moving irrigation needs out of potable water systems to a separate nonpotable reuse systems, peak demands on the potable system will be reduced. Industrial customers may also impose specific time-of-day requirements on the potable supply.
Energy Requirements
Energy is needed in many phases of the reclaimed water production cycle, including wastewater treatment, transmission to the water reclamation plant, advanced treatment, distribution, and possible subsurface injection and removal costs. Many of the wastewater treatment costs would be incurred anyway to meet wastewater discharge requirements. Therefore, this section focuses on only the additional energy costs incurred by water reuse projects beyond that required for wastewater discharge.
The energy costs in reuse projects are widely variable and site specific. Variables that affect energy
costs include the distance of the reclamation facility from the wastewater treatment plant, the treatment technologies applied, the size of the facility (see Figure 9-2), the product water quality objectives, the extent of dual distribution systems, the topography of the service area (related to the energy required for pumping), and pumping requirements for reclaimed water injection and withdrawal in any underground storage components. Overall energy costs are also influenced by the price of energy. Understanding water reuse’s energy-use profile therefore requires a comparative approach: How much energy does water reuse require in a given location compared with the feasible water supply alternatives? Generalizations on the energy cost of water supply are less useful than individual analyses of specific regions.
The amount of energy needed for water supply matters because it is a surprisingly large portion of energy use in some regions. In California, water-related energy uses consume roughly 19 percent of all electricity used in the state and 32 percent of natural gas (CEC, 2005; GEI Consutants/Navigant Consulting, 2010). Large proportions of this consumption go to conveyance costs and summer groundwater pumping. California has one of the most extensive water conveyance systems in the world, linking high-precipitation regions in the north and east with high-population regions in the south and west, and mid-state agriculture. According to CEC (2005), wastewater treatment uses 1 percent of the state’s electricity. Energy requirements of reclaimed water treatment and conveyance beyond that required for wastewater discharge ranged from 0.4 to 1.2 kWh/kilogallon (kgal) (or 0.38 to 1.1 megajoule [MJ]/m3), compared to as low as 0.1 kWh/kgal (0.095 MJ/m3) for traditional raw water treatment.1 GEI Consutants/Navigant Consulting (2010) estimated the energy requirements of seawater desalination at 12.2 kWh/kgal and inland brackish water desalination at 4.0-5.5 kWh/kgal. See Table 9-1 for estimates of water-reuse-related energy consumption for several Southern California utilities (Table 9-1).
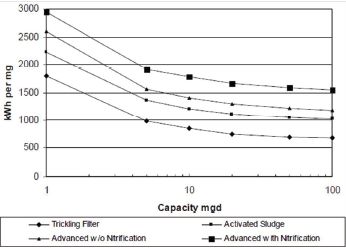
FIGURE 9-2 Variations in electricity consumption with size and wastewater treatment processes.
NOTE For this analysis, advanced treatment “is similar to the activated sludge process, but includes additional treatment in the form of filtration prior to discharge.”
SOURCE: EPRI (2002).
Several local comparisons of energy requirements have been published for water reuse scenarios in California. The Equinox Center (2010) estimates that potable and nonpotable reuse in San Diego requires substantially less energy than seawater desalination and water importation, and nonpotable reuse has energy requirements similar those for local surface and groundwater use (Figure 9-3). Some reuse applications also require the installation of a unique distribution system dedicated to reclaimed water, as is the case for West Basin Municipal Water District in Southern California, which supplies highly treated reclaimed water to chemical refineries. There is also a one-time energy cost incurred with the building of the needed infrastructure. Stokes and Horvath (2009) calculated comparative total energy use, considering life-cycle costs, for a hypothetical Southern California facility, and found that reclaimed water was comparable to water importation, but significantly lower than desalination (see Box 9-2).
From a policy perspective, this level of consumption of energy for water supply is insignificant from a residential consumer’s point of view, because the energy cost of delivered water to a home is only a few cents per month. But in the aggregate, it influences important regional and national energy policy questions, including whether and how to expand power grids, build new power generation facilities, and meet greenhouse gas reduction targets.
_________
1 Adding the energy required for wastewater treatment increases the total energy use for wastewater reclamation to a range of 1.5 to 5.8 kWh/kgal (1.4 to 5.5 MJ/m3).
TABLE 9-1 Estimates of Energy Intensity of Water Reclamation and Reuse at Three Southern California Utilities Compared with Seawater Desalination
| Project Description | Energy Intensity of Water Reuse Project | Estimated Energy Cost (assuming $0.25/kWh) | |
| Inland Empire Utilities Agency | Nonpotable reuse; distribution of advanced-treated (Title 22) wastewater | 1.02 kWh/kgal (0.97 MJ/m3) distribution only | $0.25/kgal ($0.07/m3) |
| San Diego | Nonpotable reuse; additional treatment necessary above current primary and/or secondary discharge standards, and distribution | 3.53 kWh/kgal (3.36 MJ/m3) treatment and distribution | $0.88/kgal ($0.23/m3) |
| Los Angeles | Nonpotable reuse; additional treatment necessary above current secondary discharge standards, and distribution | 1.84 kWh/kgal (1.75 MJ/m3) treatment and distribution | $0.46/kgal ($0.12/m3) |
| Seawater desalination | Conservative estimate for seawater desalination and distribution | 12 kWh/kgal (11.4 MJ/m3) treatment and distribution | $3.10/kgal ($0.82/m3) |
NOTES: Energy requirements associated with wastewater treatment required for discharge are not included in these totals. Thus, the entry for Inland Empire Utilities Agency, which is required to treat all wastewater to California’s Title 22 standards, only includes energy costs associated with distribution.
SOURCE: California Sustainability Alliance (2008).
Concentrate Disposal Costs
Some reuse projects need to remove TDS to meet end-use requirements, and membrane treatment is the most commonly used method to accomplish this goal. Membrane treatment, such as reverse osmosis, requires that facilities manage the resultant concentrate, which represents between 15 and 50 percent of the feedwater (Asano et al., 2007). Because the salinity of membrane concentrate from wastewater reclamation is much lower than the salinity of concentrate from seawater desalination, little concern is associated with its coastal discharge (see NRC [2008b] for detailed discussions of the environmental impacts of brackish and seawater desalination concentrate disposal alternatives). Currently, inland brackish desalination facilities dispose of concentrate through deep-well injection, discharge to a wastewater treatment facility via sanitary sewer systems, discharge to surface water bodies, or evaporation ponds with burial in place or disposal via landfilling (TWDB, 2009). With water reuse systems, the most common and lowest cost alternative for inland concentrate disposal—blending and diluting the concentrate with wastewater effluent prior to surface water discharge so that it meets local water quality standards—may not be available because the wastewater effluent is being reused. Costs of concentrate disposal operations vary widely based on local factors, such as land costs, hydrogeological conditions, energy cost, and concentrate quality. For inland desalination systems, concentrate disposal costs have been reported as high as twice that of the desalination process cost (NRC, 2008b).
Technologies are being studied that reduce the volume of concentrate produced during desalination activities. Use of pretreatment additives to decrease concentrate production (i.e., increase water recovery) may reduce the concentrate volume destined for disposal. Increasing feedwater temperatures to lower water viscosity and increase flux may also increase water recovery, although sometimes at the expense of water quality (i.e., allowing more salt to pass through the membrane). However, the energy required to increase inflow temperature may be costly and typically will exceed the savings unless a lower-cost energy source is proved to offset capital investment (Tarquin, 2009).
Permitting and Environmental Review
Nearly all water supply augmentation projects require permitting and environmental review. A reuse project differs from ocean and brackish desalination in that it also requires public health review. The permitting and review process poses direct costs to the utility, but another cost frequently noted by water utility representatives is the cost of delay due to public opposition to a proposed project. Costs of delay include additional months or years of not enjoying the full benefit of the
BOX 9-2
Life-Cycle Assessments of Energy and Environmental Effects
The results of full “life-cycle” cost analysis of water reuse will be highly site specific, but there are a few case studies in the literature that assess some of the life-cycle environmental and energy impacts of utility operations and expansion plans, including water reuse (Lundie et al., 2004; Stokes and Horvath, 2006, 2009). These illustrate the importance of taking a holistic approach to understanding how water supply investments affect economic, financial, and environmental outcomes. A systems or life-cycle approach emphasizes two especially attractive features of water reuse alternatives. First, water reuse typically reduces the quantities of bulk water supply that a utility must obtain from external raw water sources (e.g., rivers, groundwater). Second, the amount of treated wastewater discharged to aquatic ecosystems is reduced. These environmental benefits of lower raw water abstractions and reduced wastewater discharges are highly site specific, but in a particular location can be quite important.
Lundie et al. (2004) used a life-cycle assessment approach to model water supply planning options for the water and wastewater utility in Sydney, Australia (“Sydney Water”). One investment option they examined was increasing the level of treatment at wastewater treatment plants along the coast from primary to advanced. Lundie et al. (2004) concluded that this would increase total energy use and greenhouse gas emissions without any significant environmental benefits in terms of improved quality of the receiving water body. Their life-cycle assessment showed that this option of moving toward increased wastewater treatment would not be justified unless “additional environmental benefits can be generated by offsetting the demand for potable water through water recycling.”
Stokes and Horvath (2006) used a hybrid life-cycle cost assessment approach to evaluate the energy use of three different water supply alternatives for two utilities—importation, nonpotable reuse, and desalination (seawater desalination for the Marin Municipal Water District [MMWD] in Northern California and brackish groundwater desalination for the Oceanside Water Department [OWD] in San Diego County, California). Their analyses showed that the “global warming potential” of nonpotable reuse was substantially less than desalination, but larger than water importation, largely due to the distribution system pumping requirements (Figure below).
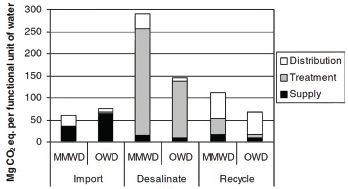
Carbon dioxide (in megagrams) produced per unit of water supplied for three water supply alternatives in Northern California (Marin Municipal Water District [MMWD]) and Southern California (Oceanside Water Department [OWD]). The analysis considered seawater desalination at MMWD, brackish groundwater desalination at OWD, and nonpotable reuse for both locations.
SOURCE: Stokes and Horvath (2006).
Stokes and Horvath (2009) conducted a similar analysis focused on the energy use, air emissions, and greenhouse gas effects from different water supply alternatives in a hypothetical Southern California case study. No other environmental effects or nonmonetized benefits were included in the analysis. The authors concluded that nonpotable reuse was comparable, if slightly lower, than the imported water case scenario in energy use and greenhouse gas emissions, and was much lower in these factors than brackish water or seawater desalination (see table below).
Life-Cycle Assessment Results Comparing Air Emissions from Five Water Supply Alternatives
| Water Source | Energy (MJ/m3) | GHG (g CO2 equiv/m3) | NOx (g/m3) | PM (g/m3) | SOx (g/m3) |
| Imported water | 18 | 1093 | 1.9 | 0.40 | 2.9 |
| Desalinated ocean water, conventional pretreatment | 42 | 2465 | 3.4 | 0.77 | 6.9 |
| Desalinated ocean water, membrane pretreatment | 41 | 2395 | 2.9 | 0.71 | 9.4 |
| Desalination brackish groundwater | 27 | 1628 | 2.0 | 0.41 | 4.2 |
| Reclaimed water | 17 | 1023 | 1.0 | 0.48 | 2.9 |
SOURCE: Stokes and Horvath (2009).
completed project and possible cost increases over time in construction, as well as possible additional interest expenses. The cost of personnel, consultants, and legal counsel may significantly add to the cost of a project, especially when the permitting process and environmental review are prolonged. Typically, assuming a project is not categorically excluded from the National Environmental Policy Act process, it takes a minimum of 1 year to complete an environmental assessment and may take significantly longer if there is strong opposition. Public review of proposed projects is a right that the committee does not dispute, but it is important to evaluate the efficiency of the review process.
Reclamation System Financing
A water agency will use its existing financial resources (i.e., savings and revenue flows), its preferred bond status (if such status exists), and its access to state and federal grants and loans to finance water reuse projects. Medium- to large-sized water customers committing to long-term agreements helps secure the bonds by securing the revenue sources. Reclamation facilities typically cannot cover their costs in their early years while expanding their customer base. Bond financing and other agency revenues cover the cost difference during this period. Provision of state and federal subsidies shortens this time period.
The choice to invest in water reclamation draws down an agency’s financial ability to make other capital investments. The processes of planning, financing, and building a facility are themselves costly. Launching a water reuse program requires a review of the agency’s overall investment priorities to confirm that reuse is the top investment priority at the time (Asano and Mills, 1998). An otherwise desirable reuse project may be beyond the means of a water agency if certain cost categories, such as separate piping for nonpotable use, are too high. In addition to reviewing investment priorities, an agency should realistically assess the market for nonpotable reclaimed water and what it can expect in terms of revenues from water sales (Asano and Mills, 1998).
Forms of financing themselves impose differential costs on an agency. The lowest cost financing is a “pay as you go” approach, because no interest fees or investment placement and management fees are required. This approach is beyond the reach of most agencies given the high capital costs of water treatment systems. Agencies can draw down existing investment pools, identify and pursue interest and capital subsidies (e.g., state revolving funds), raise water rates, and enter the short- and long-term capital markets in an effort to minimize the cost of a system without exposing the agency to excessive financial risk.
NONMONETIZED COSTS AND BENEFITS OF REUSE
The impacts of water reuse projects are both positive and negative, with amounts varying project by project, but many of the benefits and some of the costs are difficult to monetize. Some of the economic, environmental, and social considerations that are frequently not monetized, which may or may not apply to a particular reuse project, are listed in Table 9-2. Although factors such as improved reliability are frequently not monetized, methods exist to develop estimates of its value (e.g., see Kidson et al., 2009). Also, scientists have used life-cycle assessment approaches to evaluate the relative environmental impacts, including greenhouse gas emissions, from various water supply alternatives (see Box 9-2).
Greenhouse Gas Emissions
An environmental impact of growing interest is the carbon footprint, or greenhouse-gas emissions, resulting from water reuse. The impacts of greenhouse gases are largely not monetized in the United States, although several other countries have established or are developing carbon taxes (e.g., India, Australia) or emissions trading schemes (e.g., the European Union, China). In the absence of a system to monetize greenhouse gas emissions, the energy requirements of various water supply alternatives, discussed earlier in this chapter, can serve as an analog for comparing the carbon footprint of water supply alternatives, assuming that all facilities are powered by traditional sources of electricity. Like energy costs, greenhouse gas emissions from the complete life cycle of water reuse projects will be widely variable and site specific, based on factors such as the level of treatment (see Figure 9-2), pumping requirements, and new pipeline required. Thus, no
TABLE 9-2 Possible Nonmonetized Costs and Benefits of Reuse
| Nonmonetized Benefits and Costs of Reuse | Description |
| Nonmonetized Benefits | |
| Improved reliability | Wastewater reuse provides a reliable, local supply of water during regional shortages. By diversifying a utility’s water supply portfolio, a community is better able to meet the needs of its water users and the environment in both wet and dry periods and under other stresses. |
| Enhanced self-sufficiency | By reducing dependence on water imports and providing a local water supply, water reuse can increase a community’s self-sufficiency (see Rygaard et al., 2011). |
| Enhanced reputation for environmental stewardship | By embracing water reuse, communities can gain positive recognition for their environmental stewardship. |
| Enhanced regional economic vitality | By meeting increased water demands with new sources, communities may enhance local economic growth. |
| Increased water for the environment | If some existing surface or groundwater supplies are replaced by water reuse, more water can be made available to meet environmental needs (e.g., instream flows for environmental restoration, reducing withdrawals of overtapped aquifers). |
| Improved surface water quality | By diverting discharge of nutrient-laden waters from sensitive surface waters or estuaries to landscape or agricultural irrigation, the net discharge of nutrients to surface water can be reduced. Irrigation with reclaimed water may also reduce the need for additional fertilizers. |
| Nonmonetized Costs | |
| Effects on the overall carbon footprint of water supplies | Unless offset by low-carbon energy sources, some water reuse approaches may increase the overall carbon footprint of a water supply compared to existing supplies. |
| Public health effects | Poor cross-connection control (see Box 6-4) or inadequate protections against equipment failures (see Chapter 5) could expose the public to pathogens causing acute gastrointestinal illness or low levels of hazardous chemicals. |
| Public perception of reduced quality | Public concern over the perceived lower quality of the drinking water supply could lead to increased stress among some individuals and increased expenditures on bottled water. See also Chapter 10. |
| Effects on downstream flows | If reclaimed water is used for irrigation or other consumptive uses, water reuse will reduce downstream flows, with potential adverse ecological effects (such as in surface water or estuarine ecosystems) and reduced supply to downstream water users. Where “return flow credits” are offered, as in the Colorado River, water reuse can reduce these credits. |
| Water quality impacts Effects on soils and plants | If reclaimed water irrigation rates exceed the capacity for the plants to take up the nutrients, groundwater and surface water can become nutrient-enriched, which can lead to human health effects and environmental impacts, such as eutrophication and algal blooms. See also Chapter 3. Multiple cycles of nonconsumptive water reuse can increase the salinity and contaminant load in the water unless treatment is designed to remove it. Excess salinity can be detrimental to plant growth and high levels of sodium can adversely impact soil structure. |
SOURCES: Asano et al. (2007); EPA (2008b).
universal conclusion can be made about the relative greenhouse gas emissions of water reuse versus other water supply sources, although some generalizations are possible. From the comparative energy analyses noted in this chapter (see Tables 9-1. Figures 9-3, and the figure and table in Box 9-2), the energy use and resulting greenhouse gas emissions from potable and nonpotable water reuse can be significantly less than from desalination. In studies of Southern California, greenhouse gas emissions for nonpotable reuse were comparable or greater than for water importation when considering life-cycle costs (see figure and table in Box 9-2; Stokes and Horvath, 2006, 2009).
Understanding greenhouse gas emissions also requires an examination of the energy sources used in the region (e.g., fossil fuels, nuclear) and the costs and availability of low-carbon energy supplies. Some water utilities, such as Santa Cruz, California, are building solar energy systems in advance of expansion of water treatment facilities to offset or mitigate increases in carbon emissions. In Perth, Australia, a major seawater desalination facility is powered by wind energy to address concerns about the greenhouse gas implications of this energy-intensive water supply.
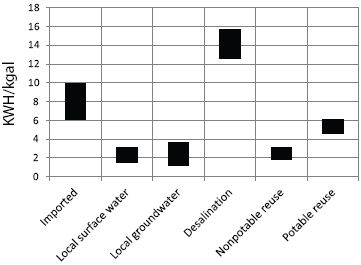
FIGURE 9-3 Power consumption for water supply alternatives for San Diego County.
SOURCE: Data from Equinox Center (2010).
Because of the dearth of information in the literature on the costs of water reuse facilities, the committee chose to address its task question (see Box S-1) on reuse costs by requesting this information from utilities directly. National Research Council (NRC) staff sent a questionnaire (see Appendix C) to 20 water utilities known to supply reclaimed water, reflecting both large and small utilities and potable or nonpotable applications (or both). This questionnaire was not developed to achieve a statistically defensible estimate of reuse costs but to identify an approximate range of cost across a variety of different treatment processes. Fourteen utilities responded and cost data for nine utilities were complete enough for general comparison purposes, representing seven nonpotable reuse operations and six potable reuse operations (see Tables 9-3 and 9-4).
Among those who responded to the questionnaire, projects dated back as far as 1962, although most reclaimed water projects described were implemented after the year 2000. Reported capital costs were converted to 2009 dollars based on the Consumer Price Index. These inflation adjustments were based on the midpoint of the construction period provided for a particular phase or project. The committee recognizes that this is an assumption that may introduce some error into the final capital cost data. It should also be noted that the committee was not able to audit the data reported by the individual utilities, although Tables 9-3 and 9-4 were sent to each of the utilities for fact checking.
Wastewater treatment is required before effluent can be discharged, and the discharge requirements can vary widely depending on the sensitivity of local surface water ecosystems and state and local regulations. Therefore, the committee designed the cost questionnaire to separate the capital and operating costs associated with (or required for) effluent discharge into the environment from the costs of additional treatment or distribution lines associated with nonpotable or potable reuse projects. Treatment costs required for wastewater discharge into the environment are not included in the costs reported here because these costs would be incurred regardless of whether reuse projects were implemented.
Capital Costs
Reported capital costs for potable and nonpotable facilities include the design and construction of treatment plants, distribution pipelines, well fields, and engineered natural systems as well as related administrative costs. All costs are reported as dollars per kilogram capacity per year in 2009 dollars (Tables 9-3 and 9-4). Hypothetical annual costs amortized at 6 percent interest over 20 years are also presented to allow comparison with O&M costs.
Nonpotable Reuse
Reported capital costs for nonpotable reuse vary widely, from $1.14 to $18.75/kgal capacity per year. Despite this wide variability, several conclusions about cost can be made. For example, the specific nonpotable applications affect the degree of additional treatment costs. Of the six facilities listed in Table 9-3 that provided detailed capital costs, two reported capital costs associated with additional treatment beyond that required for wastewater discharge. For example, Denver provides additional treatment for cooling applications (see Box 2-5), and West Basin provides a range of treatment levels to meet several end uses, including irrigation and industrial cooling. Four facilities reported
TABLE 9-3 Financial Costs from Nonpotable Reuse Facilities
| Durango Hills Las Vegas, NV | Desert Breeze Las Vegas, NV | Trinity River Authority, TX | Denver, CO | West Basin, CA | Tucson, AZ | Inland Empire, CA | ||||||||
| Capacity (MGD) | 10 | 5 | 16.4 | 30 | 40 | 30 | 40 | |||||||
| Average output (MGD) | 3.0 | 2.9 | 1 | 6 | 18 | 15.2 | 15.2 | |||||||
| Reclaimed water uses | Landscape irrigation | Landscape irrigation | Landscape irrigation, amenity reservoirs | Landscape irrigation, industrial cooling, zoo | Irrigation; cooling and boilers with additional treatment | Landscape irrigation, toilet flushing | Irrigation, industrial cooling, laundry, paper processing | |||||||
| Treatment | Activated sludge secondary treatment, automatic backwash filters, ultraviolet disinfection | Activated sludge secondary treatment, automatic backwash filters, ultraviolet disinfection | Advanced activated sludge treatment. | Biologically aerated filters, flocculation, sedimentation, mono-media filtration, disinfection | Coagulation, flocculation, sedimentation, mono-media filtration, disinfection | Filtration or activated sludge treatment via membrane bioreactor, chlorine disinfection | Activated sludge secondary treatment with biological nutrient removal, filtration, chlorine disinfection | |||||||
| Year constructed | 1999-2004 | 2001-2004 | 1987 | 2000-present | 1995-2006 | 1982+ | 2001-2010 | |||||||
| O&M costs ($/kgal) in 2009 dollars | ||||||||||||||
| Personnel | 0.07 | 0.05 | 0.01 | 0.54 | 0.20 | 0.13 | 1.00 | |||||||
| Energy | 0.36 | 0.21 | 0.01 | 0.19 | 0.22 | 0.25 | 0.18 | |||||||
| Other | 0.25 | 0.09 | 0.03 | 0.33 | 0.60 | 0.12 | 0.00 | |||||||
| Total O&M ($/kgal) | 0.68 | 0.35 | 0.05 | 1.06 | 1.02 | 0.50 | 1.18 | |||||||
| Capital Costs ($/kgal capacity/yr) in 2009 dollars | ||||||||||||||
| Treatment facility | 0.00 | 0.00 | 0.00 | 8.12 | 9.62 | Not reported | 0.00 | |||||||
| Pipelines | 4.23 | 5.73 | 1.14 | 3.58 | 9.14 | Not reported | 9.77 | |||||||
| Other | 1.88 | |||||||||||||
| Total capital costs in 2009 dollars (S/kgal per year) | 4.23 | 5.73 | 1.14 | 13.57 | 18.75 | Unable to correct for inflation | 9.77 | |||||||
| Annualized capital cost in $/kgala | 0.37a | 0.50a | 0.10a | 1.18a | 1.63a | Unable to calculate | 0.85a | |||||||
| Total Annual Costs (Annualized Capital + O&M) in $/kgal in 2009 dollars (also shown in $/m3) | ||||||||||||||
| Total Annual cost in $/kgala ($/m3) | 1.05 (0.28) | 0.85 (0.22) | 0.15 (0.04) | 2.24 (0.59) | 2.65 (0.70) | Unable to calculate | 2.35 (0.62) | |||||||
NOTE: The capital costs are reported prior to any subsidies received.
aAssumes amortization at 6 percent over 20 years. Facilities each have different interest rates, but for the sake of comparison, a common interest rate was applied.
TABLE 9-4 Financial Costs from Potable Reuse Facilities
| Orange Co. GWRS, California | El Paso, Texas | Casey WRF/ Huie Wetlands Clayton Co., GA | Shoal Creek/Panhandle Clayton Co., GA | West Basin, CA | Inland Empire, CA | |||||||
| Capacity (MGD) | 70 | 10 | 24 | 4.4 | 12.5 | 20 | ||||||
| Average output (MGD) | Not reported | 5.5 | 17.4 | Not reported | 9 | 7.1 | ||||||
| Treatment | Enhanced primary treatment, activated sludge and trickling (liter secondary treatment, microfiltration, reverse osmosis, advanced oxidation (ultraviolet light and hydrogen peroxide) | Activated sludge secondary treatment with denitrification, anaerobic digestion, lime treatment, sand filtration, ozonation, biologically active granular activated carbon filtration, final disinfection | Activated sludge secondary treatment with biological nutrient removal, sodium hypochlorite disinfection; treatment wetlands | Activated sludge secondary treatment with biological nutrient removal ultraviolet disinfection; treatment wetlands | Microfiltration, reverse osmosis, advanced oxidation (ultraviolet light and hydrogen peroxide), corrosion control | Activated sludge secondary treatment with biological nutrient removal, filtration, chlorine disinfection, soil aquifer treatment | ||||||
| Year(s) constructed | 2004-2008 | 1984 | 2004-2010 | 2002-2003 | 1995-2006 | 2001-2010 | ||||||
| O&M Costs ($/kgaI) in 2009 Dollars | ||||||||||||
| Personnel | 0.14 | 0.13 | 0.16 | 0.14 | 0.70 | 1.00 | ||||||
| Energy | 0.57 | 0.06 | 0.08 | 0.08 | 0.41 | 0.18 | ||||||
| Other | 0.45 | 0.14 | 0.11 | 0.09 | 1.27 | 0.00 | ||||||
| Total O&M (J/kgal) | 1.16 | 0.33 | 0.35 | 0.31 | 2.38 | 1.18 | ||||||
| Capital Costs ($/kgaI capacity/yr in 2009 Dollars | ||||||||||||
| Treatment | 12.42 | Not reported | 3.92a | 5.53a | 28.98 | 1.49 | ||||||
| Pipelines | 2.63 | Not reported | Not reported | Not reported | 1.74 | 9.77 | ||||||
| Other costs | 4.95 | |||||||||||
| Total Capital costs in 2009 dollars ($/kgal/yr) | 20.00 | 23.46 | 3.92a | 5.53a | 30.72 | 11.26 | ||||||
| Annualized capital cost ($/kgal)b | 1.74b | 2.05b | 0.34b | 0.48b | 2.68b | 0.98b | ||||||
| Total Annual Costs (Annualized Capital + O&M) in $/kgal in 2009 dollars ($/m3) | ||||||||||||
| Total annual cost in $/kgalb ($/m3) | 2.90 (0.77) | 2.38 (0.63) | 0.69 (0.18) | 0.79 (0.21) | 5.06 (1.34) | 2.16 (0.57) | ||||||
NOTE: The capital costs are reported prior to any subsidies received.
aIncludes engineered wetlands, and cost per thousand gallons for UV disinfection at drinking water plant.
bAssumes amortization at 6 percent over 20 years. Facilities each have different interest rates, but for the sake of comparison, a common interest rate was applied.
that they incur no additional treatment costs for their nonpotable applications beyond that required for effluent discharge. Distribution lines make up a sizeable extent of the capital costs of nonpotable reuse facilities, making up between 26 and 100 percent of the capital costs for the seven facilities. Projects where the effluent is used at or near the treatment plant are much less costly than systems with many miles of pipeline.
Potable Reuse
Capital costs for potable reuse projects are also widely ranging, from $3.90 to $31/kgal capacity per year in 2009 dollars (Table 9-4). The dataset demonstrates the variability in capacity and technologies that characterize water reuse today. Water reuse is a rapidly growing and technologically changing endeavor, and the evolution is reflected in the widely varying capital costs. The varying cost data suggest that future projects also will vary widely in cost, depending on the many factors raised in this chapter.
O&M Costs
Reported operation and maintenance costs also contain substantial variability. Total O&M costs for nonpotable reuse facilities range from $0.05/kgal to $1.18/kgal (Table 9-3), with an average of $0.69/kgal. Reported O&M costs for potable reuse facilities ranged from $0.31/kgal to $2.38/kgal (Table 9-4), with an average of $0.95/kgal. For nonpotable facilities, personnel costs account for about 40 percent, energy for about 30 percent, and all other costs at 30 percent of the total O&M budget. These percentages are quite similar to the percentages for reported potable reuse O&M costs (40 percent personnel, 24 percent energy, 36 percent other). Energy costs are affected by the extent of treatment required and the degree of pumping required to transmit the reclaimed water to the end user. Facilities using reverse osmosis reported much higher O&M costs than the other potable reuse facilities, although it should be noted that the dataset is too small to draw firm conclusions.
Subsidies
Six of the nine utilities reported capital subsidies in the form of grants from federal, state, and local entities. These subsidies ranged from $7.5 million to $344.6 million. The Bureau of Reclamation’s Title XVI program (see Box 9-1) contributed grant funding to the six projects, ranging from $7.5 million to $50 million, but those facilities with large subsidies relied on mul-
BOX 9-3
West Basin Municipal Water District Reuse Costs
West Basin Water Recycling Program provides reclaimed water for nonpotable and potable reuse applications. The program was developed in three phases. The first phase was completed in 1995, the second in 1997, and the last major phase was completed in 2006. West Basin’s recycled water estimated annual production capacity is 27 MGD (100,000 m3/d), of which 18 MGD (68,000 m3/d) are for nonpotable uses that include irrigation and industrial applications and 9 MGD (34,000 m3/d) for potable water uses, such as groundwater recharge.
Treatment processes for nonpotable uses include coagulation, flocculation, sedimentation, monomedia filtration, and disinfection. The potable reuse component of the program includes treatment of secondary effluent plus additional treatments that include microfiltration, reverse osmosis, disinfection with ultraviolet radiation and hydrogen peroxide, and corrosion control.
West Basin has received subsidies to support its reuse program from the Bureau of Reclamation (Title XVI; $50M), California Department of Water Resources ($9.4M), U.S. Army Corps of Engineers ($23.5M), Los Angeles Department of Water and Power ($2.7M), and the Metropolitan Water District ($91M), totaling approximately $177 million. In addition, it received over $168 million from the Uniform Standby Charge, a tax on undeveloped land parcels.
Capital cost and operating costs are shown in Tables 9-3 and 9-4. Approximately 5 percent of the total cost is attributed to concentrate management. Brine is disposed of through an existing 5-mile outfall that is owned and operated by the City of Los Angeles.
Reclaimed water is billed at $1.34/kgal for irrigation customers inside the West Basin Service Area. This represents the highest tier of a declining tiered rate structure that encourages users to purchase more reclaimed water. Potable reclaimed water for the barrier project is billed at $1.41/kgal. These are approximately two-third the cost of traditional potable water, which is billed at $2.11/kgal.
SOURCE: Mary-Ann Rexroad, Budget and Finance Officer, West Basin Municipal District.
tiple sources of funding to help offset the project costs, including state and local funds (see Box 9-3). The three Southern California utilities receive annual subsidies from the Metropolitan Water District of Southern California based on the volume of water produced. The costs reported in Tables 9-3 and 9-4 do not consider subsidies received by the utilities.
COMPARATIVE COSTS OF SUPPLY ALTERNATIVES
Because site conditions vary significantly, the costs of reuse can best be assessed by comparing these projects against the costs of local water supply and conservation alternatives. Most of the utilities who responded to the committee’s questionnaire, however, did not provide costs of alternative water supplies considered. Cost was cited by approximately one-third of the responding utilities as an advantage, but it was rarely the deciding factor in these reuse projects. Other factors reported by utilities as key factors that led to the decision to implement reuse included
• providing a means to diversify water supplies,
• creating a drought-resistant water supply,
• public support,
• quality of the water, and
• limited alternative sources.
Among those who did provide comparative costs, El Paso Water Utility reported that the costs of reclaimed water were slightly higher than inland desalination. Reclaimed water was much more expensive than traditional (but limited) groundwater and surface water sources but less expensive than imported water (see text and figure in Box 9-4). The extent of the distribution and concentrate disposal costs had a major impact on the overall cost of reclaimed water relative to desalination. Denver Water provided comparative costs (see Box 9-5; Table 9-5), which costs show that nonpotable reuse costs in the Denver region would be more expensive than potable reuse, considering the need to expand the service area with costly dual distribution systems, either to residential areas or major industries.
Orange County Water District also provided comparative costs. They reported that the total cost of reclaimed water to the utility ($1.80/kgal after subsidies and contributions from Orange County Sanitation District were applied; $3.16/kgal not counting these offsets) was similar to that of imported water—$1.84/kgal. This cost was substantially lower than the cost of seawater desalination ($3.68/kgal in 2010 dollars) (Shivaji Deshmukh, Orange County Water District, personal communication, 2010).
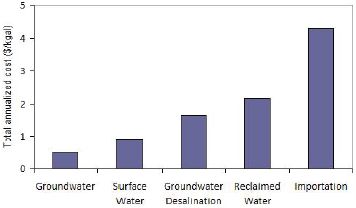
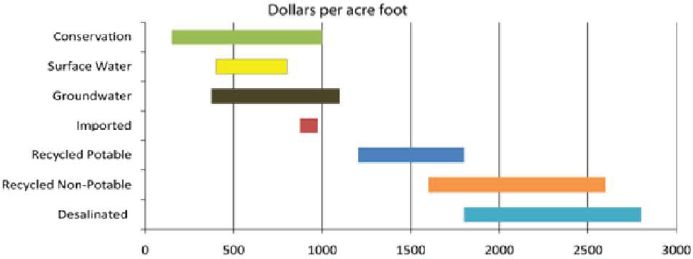
Given the limited comparative cost data obtained from the committee’s questionnaire, the committee also researched other comparative cost information available. California’s Legislative Analyst’s Office (CA LAO, 2008) published a comparison of water supply alternatives for the state of California. Among the eight options considered, water reuse had the second-lowest median costs, above urban water use efficiency (Figure 9-4). A similar analysis by the Los Angeles County Economic Development Corporation (Freeman et al., 2008) to assess Southern California’s water strategies reported that potable water reuse (based on OCWD GWRS data) is less costly than seawater desalination, comparable to brackish groundwater desalination and surface storage, and more costly than urban water conservation, groundwater storage (Freeman et al., 2008; see Table 9-6). Comparative costs for the City of San Diego are shown in Box 9-6.
In this chapter, the many factors affecting the total cost of producing and delivering reclaimed water have been described. Reclaimed water rates can offset these costs, but because the cost of treatment and distribution is generally higher for reclaimed water than for conventional water sources, reclaimed water rates are frequently set at a level that does not cover the full cost of treatment. Nonpotable reclaimed water rates are frequently set lower than conventional drinking water rates to encourage its use, even though drinking water rates in many cases do not cover the full cost of conventional water treatment, delivery, and infrastructure maintenance (EPA, 2002). According to a 2007 American Water Works Association survey of approximately 30 reuse facilities, more than one-third of reuse facilities stated that they recovered less than one-quarter of their operating costs from reclaimed water rates, while approximately 25 percent of utilities reported that they recovered 100 percent of their op-
BOX 9-4
El Paso Water Utilities’ Fred Hervey Water Reclamation Facility
El Paso’s Fred Hervey Water Reclamation plant was built in 1984, along with a series of 10 injection wells for recharge in the Hueco Bolson. The 10-MGD (38,000-m3/d) capacity plant provides water for four main uses: maintenance of wetlands of ecological interest, irrigation of parks and a golf course, aquifer recharge (infiltration basins and injection wells), and industrial uses (e.g., cooling tower makeup water). Treatment processes for wastewater treatment include primary clarification, flow equalization, two-stage activated sludge with denitrification, anaerobic digestion, and biosolids dewatering/disposal. In addition, wastewater is treated to achieve potable water standards through lime treatment, sand filtration, ozonation, biologically active GAC filtration, and final disinfection. The final effluent (potable water quality) is made available for irrigation and industrial uses through the transmission system that also recharges the aquifer.
Capital and O&M costs are provided in Tables 9-3 and 9-4. All reclaimed water, regardless of intended use, distance from source, or quality of water, is billed at $1.24/kgal. This is substantially lower than the potable water tiered rate that ranges from $1.93 to $6.49/kgal.
El Paso currently reclaims a combined 10 percent of all treated wastewater from its four wastewater facilities with a goal to increase reclaimed water supply to 15 percent of all wastewater treated. The reclamation plant is undergoing a major expansion to incorporate a third treatment train that would provide redundancy to the treatment process and increase the plant’s capacity by approximately 2.5 MGD (9,500 m3/d). Other water supply alternatives were considered; however, the decisive factor for implementation of this program was based on cost and need to conserve the water. Comparative costs of water supply alternative are shown in the figure below.
Comparative costs for alternative water supplies for El Paso Water Utilities, from 2010. This figure includes relatively low costs for desalination concentrate disposal (via deep-well injection) for the brackish groundwater desalination system.
SOURCE: Irazema Solis Rojas, P.E., EPWU Water Reclamation Engineer.
erating costs (Figure 9-5). However, annualized capital costs may be equal to or greater than operating costs. The state of Florida reports that 72 of its 176 utilities (41 percent) provide reclaimed water to users free of charge (FDEP, 2010).
Of the nine utilities who provided data to the committee on their nonpotable reuse rates, on average, the reclaimed water rates represented 39 percent of the rates for traditional potable sources (with ratios ranging from 11 to 75 percent).2 While most of the potable reuse facilities combined their water supplies such that no separate charge was applied, two utilities charged separate rates to potable reclaimed water customers. Like the nonpotable reuse rates, these potable reclaimed water rates represented only a fraction (17 and 67 percent) of the traditional potable supply rates. Given the small size of this dataset, these data are not presumed to be representative of reuse rates across the United States. Because the driving motivation for water reuse is shifting from environmentally sound wastewater disposal to water supply for water-limited regions, reclaimed water rates are likely to climb so that reclaimed water resources are used as efficiently as the potable water supplies they are designed to augment.
_________
2 When utilities reported tiered water rates, the committee considered the third tiered potable rate for comparison, considering that most nonpotable reuse customers are large volume irrigators.
BOX 9-5
Denver Water Reuse Costs
Denver’s 30-MGD (110,000-m3/d) recycling plant was built between 2000 and 2004 and obtains secondary effluent from the adjacent Denver Metro Wastewater Reclamation District’s treatment plant (see Box 2-5 for specific treatment approaches). Although it is still operating at less than its design capacity, currently delivering approximately 6 MGD (23,000 m3/d) for nonpotable reuse applications, expansion to 45 MGD (170,000 m3/d) has been planned for 2012. Water reuse in Denver is limited by water rights law to the amount of water imported from outside the basin. The customer base and distribution system are continuously expanding. Nonpotable reuse applications include irrigation of parks, schools, and golf courses; industrial cooling at the Xcel Energy power plant (see Box 2-5); and irrigation for the Denver Zoo. The Denver Museum of Nature and Science is planning to use reclaimed water in a new geothermal heating and cooling system. The Denver International Airport was constructed with dual plumbing, but the transmission lines to convey reclaimed water to the airport have not yet been constructed.
Capital and O&M costs are provided in Tables 9-3 and 9-4. Customers within the Denver area pay $0.89/kgal of reclaimed water, while customers outside the Denver Water’s combined service area pay $0.91/kgal. This is a significant difference from the average potable water rate of $2.97/kgal (2009 figures). A recent analysis of comparative costs of future water supplies in Denver showed that potable reuse was estimated to cost approximately half of the costs of an expanded nonpotable reuse system (see Table 9-5).
SOURCE: Brian Good, Denver Water, personal communication, 2010.
Other revenue options can be considered when establishing reclaimed water rates, including standby fees, property taxes, monthly minimum fees, and utility subsidies from water and wastewater fees. Organizations that provide both water and sewer services have the ability to spread some of the cost of the reuse program to wastewater treatment and/or drinking water programs, which sometimes have associated decreases in treatment and distribution costs with increased water reuse. By sharing the costs, utilities can set a reclaimed water rate that is competitive with potable water and attractive enough to prospective customers to encourage them to invest in the infrastructure to connect to the nonpotable distribution system. In some instances, even though a price may be significantly lower than potable water supplies, it still may not be attractive enough if upfront costs such as installation fees, backflow prevention, and thermal expansion units are more than
TABLE 9-5 Example Range of Unit Costs for Water Supply and Conservation Options in Denver, Colorado
| Water Supply Alternative | Net Present Value ($/kgal/yr) |
| Reuse Expand existing nonpotable system Indirect potable Direct potable Greywater |
$250 to 300 $90 to 150 $90 to 150 $30 to 150 |
| Conservation Advanced metering Plumbing fixture changes Landscape changes |
$90 to 900 $6 to 60 $90 to 770 |
| New supply Storage projects Pumping projects |
$9 to 300 $90 to 600 |
NOTE: Estimated net present value of capital, operations, and maintenance costs over 40 years divided by the annual water yield of project. Customer costs are included in conservation costs. These data are preliminary.
SOURCE: Marc Waage, Denver Water, August 2011.
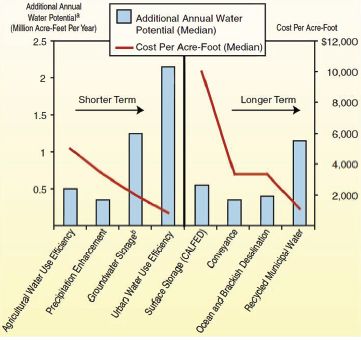
FIGURE 9-4 Costs of various water supply alternatives in the state of California. Cost estimates calculated by the California Department of Water Resources.
aReflects the midrange of estimates of water supply development potential of particular solutions identified in the California Water Plan 2005.
bIncludes integrated management of groundwater and surface water.
SOURCE: CA LAO (2008).
TABLE 9-6 Estimates of Costs of Southern California Water Supply Alternatives
| Water Supply Alternatives | Initial Capital Costs (million $) | Annual O&M Costs (million $) | Annualized Costs Over 30 Years ($/kgal) |
|
Urban water conservation |
0 | 0.5 | 0.64 |
|
Local stormwater capture |
40-63 | 1-3.5 | 1.10 |
|
Potable reuse |
480 | 30 | 3.10 |
|
Ocean desalination |
300 | 37 | 3.10+ |
|
Brackish groundwater desalination |
24 | 0.7 | 2.30-3.68 |
|
Transfers: agriculture to urban |
na | na | 2.10+ |
|
Groundwater storage |
68-135 | 13 | 1.80 |
|
Surface storage |
2,500 | 7.5-15.5 | 2.30-4.30 |
SOURCE: Freeman et al. (2008).
customers are willing to spend. In these cases, utilities must balance the need to attract customers with the costs of further subsidizing reclaimed water.
Special negotiated rates may also be considered for large customers who provide a guaranteed steady demand over an extended period of time (e.g., large industries). These customers offer an advantage of constant demand throughout the year and practically guaranteed demand for reclaimed water from one year to the next. However, customers that require a reliable supply of reclaimed water at all times may lead to increased costs for the utility if additional infrastructure must be installed to provide uninterrupted service (e.g., a redundant distribution system or provision of an alternate water supply) (Holliman, 2009).
CONCLUSIONS AND RECOMMENDATIONS
Financial costs of water reuse are widely variable because they are dependent on site-specific factors. Financial costs are influenced by size, location, incoming water quality, expectations, and/or regulatory requirements for product water quality, treatment train, method of concentrate disposal, extent of transmission lines and pumping requirements, timing and storage requirements, costs of energy, interest rates, subsidies, and the complexity of the permitting and approval process. Capital costs in particular are site specific and can vary markedly from one community to another. The lowest cost water reuse systems supply nonpotable reclaimed water to irrigation or industrial cooling operations located in close proximity to the wastewater treatment plant. Data on reuse costs are limited in the published literature, although the chapter provides reported capital and O&M costs for nine utilities (representing 13 facilities) that responded to a committee questionnaire.
Distribution system costs can be the most significant component of costs for nonpotable reuse systems. Projects that minimize those costs and use effluent from existing wastewater treatment plants are frequently cost-effective because of the minimal additional treatment needed for most nonpotable applications beyond typical wastewater disposal requirements. When large nonpotable reuse customers are located far from the water reclamation plant, the total costs of nonpotable projects can be significantly greater than potable reuse projects, which do not require separate distribution lines.
Although each project’s costs are site specific, comparative cost analyses suggest that reuse projects tend to be more expensive than most water conservation options and less expensive than seawater desalination. The costs of reuse can be higher or lower than brackish water desalination, depending on concentrate disposal and distribution costs. Water reuse costs are typically much higher than those for existing water sources. The comparative costs of new water storage alternatives, including groundwater storage, are widely variable but can be less than those for reuse.
To determine the most socially, environmentally, and economically feasible alternative, water managers and planners should consider nonmonetized costs and benefits of reuse projects in their comparative cost analyses of water supply alternatives. Water reuse projects offer numerous benefits that are frequently not monetized in the assessment of project costs. For example, water reuse systems used in conjunction with a water conservation program can be effective in reducing seasonal peak demands on the potable system, which reduces capital and operating costs and prolongs existing drinking water resources. Water reuse projects can also offer improved reliability, especially in drought, and can reduce dependence on imported water supplies. Depending on the specific designs and pumping requirements, reuse projects may have a larger or smaller carbon footprint than existing supply alternatives. They
BOX 9-6
San Diego Reclaimed Water Project
The City of San Diego’s recycling water program dates back to the 1980s when three small pilot plants (0.025 to 1 MGD [95 to 3,800 m3/d]) were built for irrigation and research purposes. Two larger wastewater reclamation plants (WRPs) were built in 1997 and 2000 (North City WRP and South Bay WRP respectively) committed to delivering 30 MGD (110,000 m3/d) total of nonpotable reclaimed water to large customers. The construction of these facilities was primarily driven by wastewater management issues and later to fulfill a Settlement Agreement with environmental stakeholders. In 1993, the city and the San Diego Water Authority proposed an 18 MGD (68,000 m3/d) potable reuse project with advance treatment and blending with imported water in a local surface water reservoir. The project was cancelled 7 years later because of public opposition. After the potable reuse project was canceled, the City of San Diego restructured its efforts to maximize the use of reclaimed water through nonpotable use. By 2006, its customer base included over 360 connections to the reclaimed water system using 11.6 MGD (44,000 m3/d) of the 24 MGD (91,000 m3/d) North City WRP’s production capacity and 1.25 of the South Bay WRP’s 13.5 MGD (4,700 of 51,000 m3/d) capacity.
With an anticipated 50 percent population increase from 2005 to 2030, the city of San Diego estimated the water supply would need to be increased about 25 percent (approximately 50 MGD [190,000 m3/d]) combined with aggressive conservation efforts. As of 2005, about 90 percent of the city’s water needs were met through water importation from the Colorado River and California State Water Project. Thus, San Diego needed to expand its water supply portfolio. In 2004, San Diego City Council issued a directive for the evaluation of options to increase the beneficial use of the city’s reclaimed water program to meet current and future water demands. The city released a study documenting various reuse alternatives (CSDWD, 2006) and is currently conducting a demonstration project to determine if potable reuse with reservoir augmentation is a feasible alternative for San Diego. The demonstration project is estimated to be completed by 2013.a
Comparative cost data considering O&M costs and annualized capital costs for San Diego’s water supply alternatives show that nonpotable reclaimed water is comparable to the cost of seawater desalination, largely due to the high cost of the distribution system. Estimated potable reuse costs are lower than nonpotable reuse and desalination but substantially larger than conservation and the current costs of imported water. However, the cost of importing water is anticipated to rise faster than the other supplies, such that by 2030, the cost of potable reuse is anticipated to be comparable to imported water (Equinox Center, 2010).
ahttp://www.sandiego.gov/water/waterreuse/demo.
Estimated marginal costs for water in 2010 (in dollars per acre-feet) in the County of San Diego.
SOURCE: Equinox Center (2010).

FIGURE 9-5 Percentage of annual operating costs recovered from reclaimed water rates.
SOURCE: AWWA (2008).
can also reduce water flows to downstream users and ecosystems.
Current reclaimed water rates do not typically return the full cost of treating and delivering reclaimed water to customers. Nonpotable water reuse customers are often required to pay for the connection to the reclaimed water lines; therefore, some cost incentive is needed to attract customers for a product that is perceived to be of lower quality based on its origin. Frequently, other revenue streams, including fees, drinking water programs, and subsidies, are used to offset the low rates. As the need for new water supplies in water-limited regions becomes the driving motivation for water reuse, reclaimed water rates are likely to climb so that reclaimed water resources are used as efficiently as the potable water supplies they are designed to augment.


