
This chapter provides the background needed to understand the role of water reuse in the nation’s water supply. After presenting a brief overview of how sewage collection and treatment developed during the 19th and 20th centuries, the chapter describes the ways in which reclaimed water has been used for industrial applications, agriculture, landscaping, habitat restoration, and water supply. Through descriptions of current practices and case studies of important water reclamation projects, the chapter provides a means of understanding the potential for expansion of different types of water reuse and identifies factors that could limit future applications.
To understand the potential role of water reuse in the nation’s water supply, it is important to consider the infrastructure that has been developed to enable the collection, treatment, and disposal of municipal wastewater because these systems serve as the source of reclaimed water. By understanding the ways in which wastewater collection and treatment systems developed and are currently operated, it is possible to gain insight into many of the technical issues discussed in later sections of the report. In particular, this section describes the practice of unplanned, or de facto, water reuse (see Box 1-1), which is an important but underappreciated part of our current water supply, as well as the different types of systems that have been developed as part of planned water reclamation projects.
Historical Perspectives on Sewage and Municipal Wastewater Treatment
Prior to the installation of piped water supplies, most cities did not have sewers or centralized systems for disposing of liquid waste. Feces and urine were collected in privy vaults or cesspools (Billings, 1885). When the vaults were filled, wastes were removed and applied to agricultural fields, dumped in watercourses outside of the city, or the vault was abandoned (Tarr et al., 1984). Other liquid wastes, from cooking or clothes washing, were discharged to gutters or unlined dry wells. Sewers were only employed to a limited extent in densely populated areas to prevent flooding by conveying runoff to nearby rivers. In many cities, it was illegal to discharge human wastes to sewers (Billings, 1885).
Emergence of Sewer Collection Systems
With the advent of pressurized potable water, per capita urban water use increased from approximately 5 gal/d (20 L/d) to over 105 gal/d (400 L/d; Tarr et al., 1984). When ample freshwater supplies became available, the popularity of the flush toilet grew and the resulting large volumes of liquid waste overwhelmed the capacity of privy vaults, cesspools, and gutters. The public health and aesthetic problems associated with the liquid wastes led to the widespread construction of sewer systems in populated areas. During the initial phase of sewer system construction, in the late 1800s, most cities in the United States built combined sewers to convey sewage and stormwater runoff from the city
to nearby waterways (Tarr, 1979). Separate sanitary sewers (that conveyed mainly waste from homes and businesses) were built in several dozen cities because they were less expensive and the concentrated wastes could be used as fertilizers (Tarr, 1979). By 1890, approximately 70 percent of the urban population lived in areas that were served by one of the two types of sewer systems (Figure 2-1).
Throughout this period, the wastes conveyed by combined sewer systems were usually discharged to surface waters without any treatment because the available treatment methods (e.g., chemical precipitation) were considered to be too expensive (Billings, 1885). As a result of the rapid growth of cities and the relatively large volumes of water discharged by sewers, drinking water supplies of cities employing sewers and their downstream neighbors were compromised by waterborne pathogens, resulting in increased mortality due to waterborne diseases (Tarr et al., 1984). For example, severe outbreaks of typhoid fever in Lowell and Lawrence, Massachusetts, in 1890 and 1891, in which over 200 people died, were traced back to the discharge of sewage by communities located approximately 12 miles (20 km) upstream of Lawrence (Sedgwick, 1914).
In cities with separate sanitary sewers, treatment was more common because of the smaller volumes and
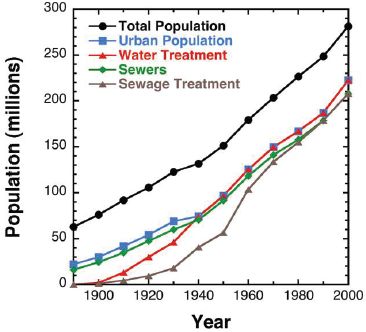
FIGURE 2-1 Comparison of total U.S. population with urban population, population served by sewers, population served by water treatment plants, and population served by wastewater treatment plants.
SOURCES: Tarr et al. (1984), (EPA, 2008b).
consistent quality of the waste. In some communities, sewage was applied directly to orchards or farms (in a practice known as sewage farming (Anonymous, 1893; see Box 2-1). Sewage farming led to high crop yields, especially in locations where water was limited. The nutrients in the sewage made sewage farming attractive to farmers, but the practice eventually died out in the 1920s as public health officials expressed concerns about exposure to pathogens in fruits and vegetables grown on sewage farms.
As downstream communities became aware of the impact that upstream communities were having on their water supplies, there were debates about the obligations of communities to remove contaminants from sewage prior to discharge. Leading engineers, such as Allen Hazen, advocated for downstream cities to install drinking water treatment systems (Hazen, 1909) while public health scientists, like William Sedgwick (1914), advocated a requirement for cities to treat sewage. Many sanitary engineers supported their assertion that wastewater treatment was unnecessary by a belief that flowing water undergoes a process of self-purification. They asserted that as long as a water supply was located at a sufficient distance downstream of the sewage discharge, the water would be safe to drink. In fact, this concept was instrumental in the state of Massachusetts’ policy of allowing sewage discharges to rivers if the outfall was located more than 20 miles (32 km) from a drinking water intake (Hazen, 1909; Sedgwick, 1914; Tarr, 1979). As a result of these debates, downstream communities often took the responsibility for ensuring the safety of their own water supply by building drinking water treatment plants or relocating their water supplies to protected watersheds.
Emergence of Wastewater Treatment
In 1900, less than 5 percent of the municipal wastewater in the United States was treated in any way prior to discharge (Figure 2-1). However, increases in population density, especially in cities, coupled with the growth of the progressive movement, which created a greater awareness of natural resources, led to increased construction of wastewater treatment systems (Burian et al., 2000). Coincident with these trends was the development of more cost-effective methods of biological wastewater treatment, such as activated
BOX 2-1
Sewage Farming
Throughout history, farmers have recognized the potential benefits of applying human wastes to agricultural land. With the widespread popularity of the water closet (i.e., the flush toilet) in the latter part of the 19th century, the water content of wastes increased and the traditional system for transporting waste to agricultural fields became impractical. To obtain the benefits of land application of wastes, scientists in Europe began evaluating the potential for using pipelines to transport sewage to farms where the water and nutrients could be used to grow plants. Eventually, large sewage farms were built and operated in Edinburgh, Paris, and Berlin where they produced fodder for cattle, fruits, and vegetables (Hamlin, 1980). At the turn of the century, the majority of the sewage produced in Paris was being treated on sewage farms (Reid, 1991).
In the United States, sewage farming was especially popular in arid western states because water supplies were limited (see figure below). For example, in California the practice of irrigating food crops with raw sewage reached a peak in 1923 with 70 municipalities applying their sewage to food crops (Reinke, 1934). In some locations, chemical treatment followed by settling was used prior to irrigation (Tarr, 1979). Eventually sewage farming became less prevalent as cities expanded, fertilizers became less expensive, and modern wastewater treatment plants provided an alternative means of sewage disposal. Sewage farming continued in France and Germany until the second half of the 20th century. Despite the public health risks associated with potential exposure to pathogens in raw sewage, almost all of the wastewater produced in Mexico City is sent to sewage farms (Jiménez and Chavez, 2004).
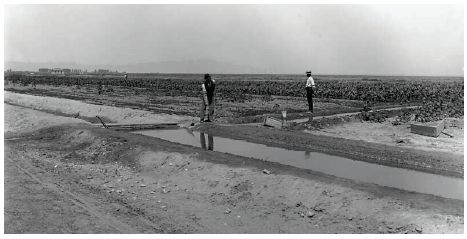
A sewer farm near Salt Lake City, Utah.
SOURCE: Utah Historical Society, circa 1908.
sludge. By 1940, 55 percent of the urban population of the United States was served by wastewater treatment plants (EPA, 2008b). Concerns associated with raw sewage discharges increased during the postwar period, with the passage of the Water Pollution Control Acts of 1948 and 1956, which provided federal funding for wastewater treatment plant construction (Everts and Dahl, 1957; Melosi, 2000). By 1968, 96.5 percent of the urban population of the United States lived in areas where wastewater was treated prior to discharge (EPA, 2008b), but the extent of treatment varied considerably, with many plants only removing suspended solids through primary treatment.
Concerns associated with sewage pollution grew during the 1960s and culminated with the allocation of $24.6 billion in construction and research grants for wastewater treatment plants as part of the Clean Water Act of 1972 (Burian et al., 2000). Most of the municipal wastewater treatment plants built in the United States during the late 1960s and early 1970s were equipped with primary and secondary treatment (see Box 2-2 and Chapter 4), which are capable of removing from wastewater over 90 percent of the total suspended solids and both oxygen-demanding organic wastes (i.e., biochemical oxygen demand [BOD] and chemical oxygen demand [COD]). By 2004, only 40 of more than 16,000 publicly owned wastewater treatment plants in the United States reported less than secondary treatment (see Table 2-1; EPA, 2008b).
The increased number of wastewater treatment
BOX 2-2
Stages of Wastewater Treatment
| Primary | Removal of a portion of the suspended solids and organic matter form the wastewater. |
| Secondary | Biological treatment to remove biodegradable organic matter and suspended solids. Disinfection is typically, but not universally, included in secondary treatment. |
| Advanced treatment | Nutrient removal, filtration, disinfection, further removal of biodegradable organics and suspended solids, removal of dissolved solids and/or trace constituents as required for specific water reuse applications. |
SOURCE: Adapted from Asano et al. (2007).
plants built during the postwar period had immediate and readily apparent impacts on the aesthetics of surface waters and the integrity of aquatic ecosystems. However, effluent from wastewater treatment plants sometimes caused problems. In locations where effluent was insufficiently diluted with water from other sources, ammonia concentrations often reached levels that were toxic to aquatic organisms. In other locations, wastewater effluent discharges caused excessive growth of algae and aquatic macrophytes due to the elevated concentrations of nutrients (i.e., nitrogen and phosphorus) in the effluent. To address these issues, treatment plants were often retrofitted or new treatment plants were built with technologies for removing nutrients (see Chapter 4 for detailed descriptions). These nutrient removal processes, which are sometimes referred to as tertiary treatment processes, became increasingly popular in the 1970s.
To protect downstream recreational users, wastewater effluent is often disinfected before discharge. The most common means of disinfection in the United States is effluent chlorination, a process in which a small amount of dissolved chlorine gas or hypochlorite (i.e., bleach) is added to the effluent prior to discharge. However, concerns about potential hazards associated with handling of chlorine coupled with the need to minimize the formation of disinfection byproducts that are toxic to humans and aquatic organisms have caused some utilities to switch to other means of effluent disinfection (Sedlak and von Gunten, 2011). In particular, disinfection with ultraviolet light has become more common as the technology has become less expensive. Ozone also is being used for effluent disinfection in some locations because it also oxidizes trace organic
TABLE 2-1 Treatment Provided at U.S. Publicly Owned Wastewater Treatment Plants
| Treatment Facilities in operation in 2004a | |||||
| Level of Treatment | Number of Facilities | Existing flow (MGD) | Present Design Capacity | Number of People Served | Percent of U.S. Population |
| Less than Secondaryb | 40 | 441 | 570 | 3,306,921 | 1.1 |
| Secondary | 9,221 | 14,622 | 19,894 | 96,469,710 | 32.4 |
| Greater than Secondary | 4,916 | 16,522 | 23,046 | 108,506,467 | 36.5 |
| No Dischargec | 2,188 | 1,565 | 2,296 | 14,557,817 | 4.9 |
| Partial Treatmentd | 218 | 507 | 632 | — | — |
| Totale | 16,583 | 33,657 | 46,438 | 222,840,915 | 74.9 |
aAlaska, American Samoa, Guam, the Northern Mariana Islands and the Virgin Islands did not participate in the CWNS 2004. Arizona, California, Georgia, Massachusetts, Michigan, Minnesota, North Dakota, and South Dakota did not have the resources to complete the updating of their data. All other states, the District of Columbia, and Puerto Rico completed more than 97 percent of the data entry or had fewer than 10 facilities that were not updated.
bLess-than-secondary facilities include facilities granted or pending section 301(h) waivers from secondary treatment for discharges to marine waters.
cNo-discharge facilities do not discharge treated wastewater to the Nation’s waterways. These facilities dispose of wastewater via methods such as industrial reuse, irrigation, or evaporation.
dThese facilities provide some treatment to wastewater and discharge their effluents to other wastewater facilities for further treatment and discharge. The population associated with these facilities is omitted from this table to avoid double accounting.
eTotals include best available information from states and territories that did not have the resources to complete the updating of the data or did not participate in the CWNS 2004 in order to maintain continuity with previous reports to Congress. Forty operational and 43 projected treatment plants were excluded from this table because the data related to population, flow, and effluent levels were not complete.
SOURCE: EPA (2008b).
contaminants (see Chapter 4 for details). It is worth noting that effluent disinfection is not practiced at all wastewater treatment plants because of variations in local regulations.
Increasing Importance of De Facto Water Reuse
Irrespective of the treatment process employed, municipal wastewater effluent that is not directly reused is discharged to the aquatic environment where it reenters the hydrological cycle. As a result, almost every municipal wastewater treatment plant, with the exception of coastal facilities, practices a form of water reuse, because the discharged treated wastewater is made available for reuse by downstream users. In many cases, effluent-impacted surface water is employed for nonpotable applications, such as irrigation. However, there are numerous locations where wastewater effluent accounts for a substantial fraction of a potable water supply (Swayne et al., 1980). This form of reuse, which is also referred to as de facto reuse (Asano et al., 2007), is important to the evaluation of water reuse projects and may be a useful source of data on potential public health risks. In many cases, the degree of treatment that this municipal wastewater receives prior to entering the potable water supply is less than that applied in planned reuse projects.
Rivers and lakes that receive wastewater effluent discharges are sometimes referred to as effluent-impacted waters.1 Box 2-3 describes an example of a watershed where wastewater effluent accounts for about half of the water in a drinking water reservoir. The concentration of wastewater-derived contaminants in a drinking water treatment plant water intake from an effluent-impacted source water depends upon the wastewater treatment plant, the extent of dilution, residence time in the surface water, and the characteristics of the surface water (including depth and temperature, which affect the rates of natural contaminant attenuation processes). Although it is currently difficult to estimate the total contribution of de facto reuse to the nation’s potable water supply, monitoring efforts (e.g., the U.S. Geological Survey [USGS] Toxic Substances Hydrology Program) have documented the presence of wastewater-derived contaminants in watersheds throughout the country (Kolpin et al., 2002). In a recent study of drinking water supplies, one or more prescription drugs was detected in approximately 25 percent of samples collected at the intakes of drinking water treatment plants in 25 states and Puerto Rico (Focazio et al., 2008).
Although detection of wastewater-derived organic compounds demonstrates the occurrence of de facto reuse, making precise estimates of the contribution of effluent to a water supply is more challenging. Aside from anecdotal reports from watersheds such as the Trinity River (Box 2-3), it is challenging to find good estimates of effluent contributions to water supplies. Attempts to quantify the fraction of the overall flow of a river that was derived from wastewater effluent require detailed information about the hydrology of the watershed and the quantity of effluent discharged. In 1980, EPA conducted a scoping study to characterize the contribution of wastewater effluent to drinking water supplies (see Box 2-4). Results indicated that more than 24 major water utilities used rivers from which effluent accounted for over 50 percent of the flow under low-flow conditions (Swayne et al., 1980).
Since that time, the urban population of the United States has increased by over 35 percent (U.S. Census, 2010c, 2011), with much of the growth occurring in the southeastern and western regions. As a result, it is likely that the contribution of wastewater effluent to water supplies has increased since the 1980 EPA scoping study. In 1991, data from EPA indicated that 23 percent of all permitted wastewater discharges were made into surface waters that consisted of at least 10 percent wastewater effluent under base-flow conditions. More recently, Brooks et al. (2006) estimated that 60 percent of the surface waters that received effluent discharges in EPA Region 6 (i.e., Arkansas, Louisiana, New Mexico, Oklahoma, and Texas) consisted of at least 10 percent wastewater effluent under low-flow conditions.2
_____________
1 Effluent-impacted surface waters can also discharge to groundwater. As a result, groundwater wells located proximate to effluent-impacted surface waters can be a route for de facto potable water reuse. The number of people who acquire their drinking water from wells under the influence of effluent-dominated waters that are not intentionally operated as potable water reuse systems is unknown.
2 The committee recognizes that temporal variations in dilution flows will affect surface water quality, but it was beyond the committee’s charge to assess specific flow criteria (e.g., average flow, 7Q10 [average low-flow over 7 consecutive days with a 10-year return frequency]) that should be used to evaluate the extent and
BOX 2-3
De Facto Reuse in the Trinity River Basin
The Trinity River in Texas is an example of an effluent-dominated surface water system where de facto potable water reuse occurs. The section of the river south of Dallas/Forth Worth consists almost entirely of wastewater effluent under base flow conditions (Fono et al., 2006; TRA, 2010). In response to concerns about nutrients, the wastewater treatment plants in Dallas/Fort Worth that collectively discharge about 500 million gallons per day (MGD; 2 million m3/d) of effluent employ nutrient removal processes (Fono et al., 2006). Little dilution of the effluent-dominated waters occurs as the water travels from Dallas/Fort Worth to Lake Livingston, which is one of the main drinking water reservoirs for Houston (see figure below). Once the water reaches Lake Livingston, it is subjected to conventional drinking water treatment prior to delivery to consumers in Houston.
Results from hydrological models and contaminant monitoring indicate that contaminant attenuation takes place in the river and reservoir. During the estimated 2-week travel time between Dallas/Fort Worth and Lake Livingston, many of the trace organic contaminants undergo transformation by microbial and photochemical processes (Fono et al., 2006). Additional contaminant attenuation and pathogen inactivation also may occur during the water’s residence time in the reservoir. On an annual basis, about half of the water flowing into Lake Livingston is derived from precipitation. Therefore, water entering the drinking water treatment plant consists of approximately 50 percent wastewater effluent that has spent approximately 2 weeks in the Trinity River and up to a year in the reservoir before it becomes a potable water supply. The potable water from the Trinity River meets all of the Environmental Protection Agency’s water quality regulations and this de facto potable reuse system is an important element in the region’s water resource planning.
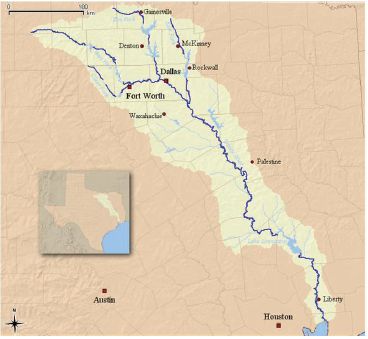
Trinity River Basin, showing Dallas/Fort Worth in the headwaters of the water supply for the city of Houston.
SOURCE: http://wapedia.mobi/en/File:Trinity_Watershed.png.
Improved integration of hydrological data and better watershed models make it possible to estimate the fraction of wastewater effluent in surface waters under a range of conditions. For example, Andrew Johnson and Richard Williams (Centre for Ecology and Hydrology, personal communication, 2009) used readily available data on river flows and volumes of wastewater effluent discharged by individual treatment plants to develop a hydrological model that predicts the fraction of wastewater effluent in different surface waters in and around Cambridge, UK, under base-flow conditions (Figure 2-2). Such hydrological data are available in
__________________________________
significance of de facto reuse. The existing regulatory structure for drinking water addresses this issue through requirements for periodic monitoring. For chemicals where the risk is based on lifetime exposure, average concentrations of contaminants are used. For pathogens and chemicals where risks are based on shorter exposures, low-flow measures might be appropriate, although it is beyond the committee’s charge to evaluate.
BOX 2-4
The Presence of Wastewater in Drinking Water Supplies Circa 1980
A survey of wastewater discharges upstream of drinking water intakes was conducted on behalf of EPA, reflecting water systems that collectively served 76 million persons (Swayne, et al., 1980). Data are shown in the below figure for average flow conditions and low flow (i.e., 7-day, 10-year low flow) conditions. Utilities serving 32 million people (of the 76 million total reflected in the survey) reported that no wastewater was discharged upstream of the water intakes. However, of the remaining 44 million people served by the utilities surveyed, more than 20 million relied upon source water with a wastewater content of 1 percent or more under average flow conditions, and a similar number relied on source water with a wastewater content of 10 percent or more during low-flow conditions. No comparable more recent data are available, but these percentages have likely increased significantly since the EPA data were collected, given the population growth and increasing water use over the last 30 years. Although some of the supplies represented by the data on the right side of the figure below are controversial, most of these urban water supplies are considered safe, conventional water supplies by the public.
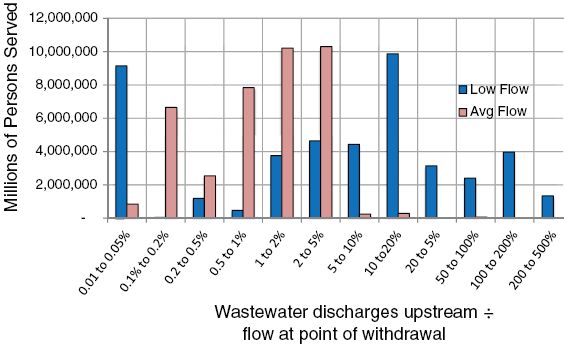
Persons served by a water supply with wastewater content according to EPA’s 1980 survey of wastewater discharged upstream of drinking water intakes.
SOURCE: Data from Swayne et al. (1980).
the United States through the EPA’s Better Assessment Science Integrating Point and Nonpoint Sources (BASINS) system3 and have been adapted by scientists working for the pharmaceutical industry to make such calculations for 11 watersheds serving as drinking water supplies for 14 percent of the U.S. population (Anderson et al., 2004). Maps that show the contribution of wastewater under current and future scenarios could be extremely useful to water resource planners and public health experts as part of efforts to manage the nation’s water resources in a safe and reliable manner.
USGS maintains stream gauging stations and has an active research and monitoring program for wastewater-derived contaminants. EPA has considerable experience in the development and application of surface water quality models. Through a collaborative effort drawing upon the expertise of both agencies, agency scientists could provide water resource planners with a better understanding of the extent of de facto reuse in their catchment and provide data useful to estimating contaminant attenuation between effluent discharge and potable water intakes (e.g., residence time, water quality, depth).
_____________
3 See http://water.epa.gov/scitech/datait/models/basins/index.cfm.
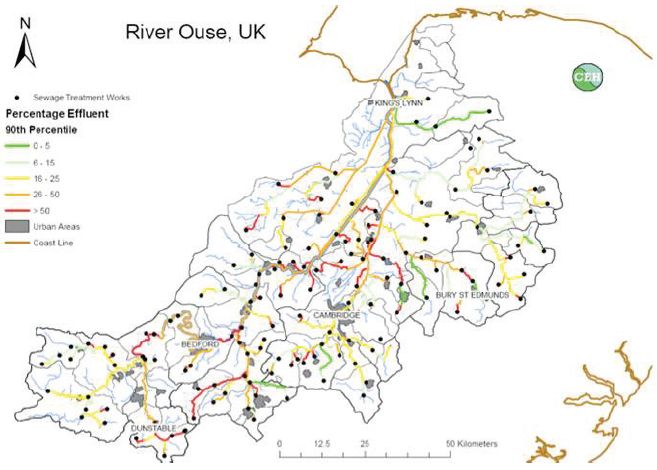
FIGURE 2-2 Estimated Contribution of wastewater effluent to overall river flow in the River Ouse (UK).
SOURCE: Andrew Johnson and Richard J. Williams, CEH, personal communication, 2009.
PLANNED NONPOTABLE WATER REUSE APPLICATIONS
As an alternative to releasing wastewater effluent into the environment, reclaimed wastewater can be reused for a variety of purposes (Table 2-2). Currently, most reclaimed water is used for nonpotable applications, such as agricultural and landscape irrigation. (Data on the extent of various reuse applications in several states is presented toward the end of this chapter.) The following section discusses a variety of nonpotable reuse applications and associated technical and water quality considerations. Economics, the regulatory framework, and public acceptance also influence planning decisions about nonpotable reuse, and these factors are examined in Chapters 9 and 10.
Urban Reuse Applications
A wide array of uses for nonpotable reclaimed water have been identified in urban areas. Urban water reuse systems currently provide reclaimed water for landscape irrigation, decorative water features, toilet and urinal flushing, fire protection, cooling water for air conditioners, commercial uses (e.g., car washes, laundries), dust suppression, and street washing, among others. For example, in Florida, urban nonpotable applications (i.e., industrial uses, public access irrigation) represented at least 68 percent of total reclaimed water use by flow volume in 2010 (FDEP, 2011). Industrial and landscape irrigation reuse applications are discussed in more detail below, along with dual distribution systems that enable these applications.
Landscape Irrigation
Landscape irrigation is the most widely used application of reclaimed water in urban environments and typically involves the spray irrigation of golf courses, parks, cemeteries, school grounds, freeway medians, residential lawns, and similar areas. Because public contact with the applied water presents potential health
TABLE 2-2 Uses of Reclaimed Water
| Category of Use | Specific Types of Use | Limitations |
| Landscape irrigation | Parks, playgrounds, cemeteries, golf courses, roadway rights-of-way, school grounds, greenbelts, residential and other lawns | • Dual distribution system costs • Uneven seasonal demand • High–total dissolved solids (TDS) reclaimed water can adversely affect plant health |
| Agricultural irrigation | Food crops, fodder crops, fiber crops, seed crops, nurseries, sod farms, silviculture, frost protection | • Use and source are often some distance apart • Dual distribution system costs • Uneven seasonal demand • High-TDS reclaimed water can adversely affect plant health |
| Nonpotable urban uses (other than irrigation) | Toilet and urinal flushing, fire protection, air conditioner chiller water, commercial laundries, vehicle washing, street cleaning, decorative fountains and other water features | • Dual distribution system costs • Building-level dual plumbing may be required • Greater burden on cross-connection control |
| Industrial uses | Cooling, boiler feed, stack scrubbing, process water | • Dual distribution system cost to industrial sites varies based on proximity • Treatment required depends on end use |
| Impoundments | Ornamental, recreational (including full-body contact) | • Dual distribution system costs • Nutrient removal required to prevent algal growth • Potential ecological impacts depending on reclaimed water quality and sensitivity of species |
| Environmental uses | Stream augmentation, marshes, wetlands | • Nutrient and ammonia removal may be required. • Potential ecological impacts depending on reclaimed water quality and sensitivity of species |
| Groundwater recharge | Aquifer storage and recovery, seawater intrusion control, ground subsidence control | • Appropriate hydrogeological conditions needed • High level of treatment may be required • Potential for water quality degradation in subsurface |
| Potable water supply augmentation | Water supply treatment | • Very high level of treatment required • Requires post-treatment storage • Can be energy intensive |
| Miscellaneous | Aquaculture, snow making, soil compaction, dust control, equipment washdown, livestock watering | |
SOURCE: Adapted from Washington State Department of Health (2007).
risks if microbial pathogens are present in the water, reclaimed water typically is subjected to high doses of disinfectants. Chemical contaminants usually are not a major concern in landscape irrigation projects. When used for landscape irrigation, reclaimed water usually does not have adverse impacts on plants, although in some cases high levels of salts or constituents such as boron can adversely affect vegetation (see Chapter 8). Furthermore, the potential for ingestion of irrigation water is limited.
Depending on the area being irrigated, its location relative to populated areas, and the extent of public access or use of the grounds, the microbiological requirements and operational controls placed on the system may differ. Irrigation of areas not subject to public access (e.g., highway medians) have limited potential for creating public health problems, whereas microbiological requirements become more restrictive as the expected level of human contact with reclaimed water increases (e.g., parks, golf courses, schoolyards). Operational considerations include limiting aerosol formation and dispersal, managing application rates to avoid ponding and runoff, and maintaining proper disinfection (EPA, 2004).
Landscape irrigation with reclaimed water is well accepted and widely practiced in the United States. For example, in 2005 there were more than 200 water reclamation facilities that provided reclaimed water to more than 1,600 individual park, playground, or schoolyard sites for irrigation (Crook, 2005b). The majority of the sites were in California and Florida. Irrigation of golf courses is one of the most common uses of reclaimed water, and 525 golf courses in Florida alone used reclaimed water for irrigation in 2010 (FDEP, 2011).
Industrial Applications
Effluent from conventional wastewater treatment plants is of adequate quality for many industrial applications. Major industrial uses of reclaimed water include cooling, process water, stack scrubbing, boiler feed, washing, transport of material, and as an ingredient in industrial products (MCES, 2007). When used for these applications, reclaimed water has the important advantage of being a reliable supply. This is particularly advantageous for industries located near populated areas that generate large volumes of wastewater effluent.
Cooling Water. The predominant application of reclaimed water by industry is for cooling water. There are more than 40 power plants in the United States that use municipal wastewater as plant makeup water (Veil, 2007). Examples of a steam electric generating plant and a nuclear plant that use reclaimed water for cooling are provided in Boxes 2-5 and 2-6. In general, the major problems experienced by power plants employing reclaimed water for cooling are scale formation, biological growth, and corrosion.
Power plants often use disinfected secondary effluent for cooling, but in recirculating cooling systems, additional treatment, such as filtration, chemical precipitation, ion exchange or reverse osmosis, is often necessary. In some cases, only additional chemical treatment is necessary (e.g., antifoaming agents, polyphosphates to control corrosion, polyacrylates to disperse suspended solids, chlorine to control of biological growth; see EPA, 2004).
Boiler Feedwater. When used as feedwater in boilers, reclaimed water requires extensive treatment with quality requirements that increase with the operating pressure of the boiler. Typically, both potable and reclaimed water need to be treated to remove inorganic constituents that can damage the boilers (EPA, 2004). For example, calcium, magnesium, silica, and aluminum contribute to scale formation in boilers, while excessive alkalinity and high concentrations of potassium and sodium can cause foaming (WPCF, 1989). Bicarbonate alkalinity can lead to the release of carbon dioxide, which can increase the acidity in the steam and corrode the equipment. Because of the relatively small quantities of makeup water and extensive treatment required, reclaimed water is typically a poor candidate for boiler feed. However, reclaimed water is used at a few facilities that provide additional treatment (e.g., reverse osmosis).
Process Water. The acceptability of reclaimed water for industrial process water depends on the specific application. Whereas secondary treatment effluent may be acceptable for some applications (e.g., concrete manufacturing), advanced treatment is needed for applications such as carpet dyeing because water used in textile manufacturing must be nonstaining and the iron, manganese, and organic matter in secondary effluent could compromise the quality of the final product. Divalent metal cations cause problems in some of the dyeing processes that use soap, and nitrates and nitrites may also cause problems (WPCF, 1989). Exceptionally high-quality water is required for some other industrial process uses (e.g., water used to wash circuit boards in the electronics industry often requires reverse osmosis treatment to remove salts).
Reclaimed water is used in the paper and pulp industry, although higher quality paper products are more sensitive to water quality. Certain metal ions, such as iron and manganese, can cause discoloration of the paper, microorganisms can affect its texture and uniformity, and suspended solids may affect its brightness (Rommelmann et al., 2004). The use of reclaimed water in the manufacture of paper products used as food wrap or beverage containers is prohibited in some states (e.g., Florida) to prevent the possibility of contaminants that pose health risks leaching into consumable products.
In the chemical industry, water requirements vary widely depending on the processes involved. In general, water that is in the neutral pH range (6.2 to 8.3), moderately soft (i.e., low calcium and magnesium), and relatively low in silica, suspended solids, and color is required (WPCF, 1989). Total dissolved solids and chloride content generally are not critical.
Dual Distribution and Distributed Systems for Urban Water Reuse
Increasing use of reclaimed water in urban areas has resulted in the development of large dual-water systems in several communities that distribute two
BOX 2-5
Xcel Energy Cherokee Station, Denver, Colorado
The Xcel Energy Cherokee Station (pictured below) is a coal-fired, steam electric generating station with four operating units that can produce 717 MW of electricity. The plant, located just north of downtown Denver, Colorado, also is capable of burning natural gas as fuel. The power plant uses 7.1-9.0 MGD (27,000 to 34,000 m3/d) of water for cooling towers. Historically, all cooling tower feedwater originated from ditch systems that provided raw water to the plant. The Xcel Energy Cherokee Station began using reclaimed water from Denver’s Water Recycling Plant as one of its sources of cooling water in 2004 to reduce the plant’s freshwater consumption. The Cherokee Station is the largest customer of Denver Water’s Recycling Plant, using up to 4.7 MGD (18,000 m3/d) of reclaimed water. Raw water and reclaimed water are brought to the site and mixed in a large reservoir before feeding the cooling towers. The blend of reclaimed and raw water is also used onsite for ash silo washdown and fire protection. The major benefit of reclaimed water to the power plant is the availability of a new water source and an overall increased water supply to ensure that Xcel Energy will be able to obtain needed water even in dry or drought years.
Denver Water’s Recycling Plant, which currently has a treatment capacity of 30 MGD (110,000 m3/d) and is designed for expansion to 45 MGD (170,000 m3/d), receives secondary effluent from the Metro Wastewater Treatment Plant. Treatment at the Water Recycling Plant, which is located in close proximity to the Cherokee Station, includes the following
• Nitrification with biologically aerated filters
• Coagulation with aluminum sulfate for phosphorus reduction
• Flocculation and high rate sedimentation
• Filtration with deep-bed anthracite filters
• Chlorine disinfection with free chlorine or chloramines depending on season and need
The cooling towers typically run four to five cycles, and sodium hypochlorite is used as a biocide. Blowdown from the cooling towers is treated with lime and ferric chloride to ensure discharge permit compliance before it is discharged into the South Platte River.
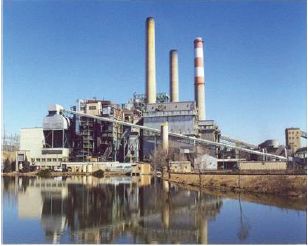
The Xcel Energy Cherokee Station.
SOURCE: Photo courtesy of Xcel Energy (www.XcelEnergy.com)
grades of water to the same service area: potable water and nonpotable reclaimed water. The nonpotable reclaimed water can be used for residential irrigation, toilet flushing, and fire protection, among other applications (see Table 2-2). To minimize microbial health risks associated with inadvertent contact or ingestion of reclaimed water (see also Chapter 6), dual-water systems generally provide filtered, disinfected effluent where significant portions of the population could be exposed to the reclaimed water.
Dual-water distribution systems vary considerably in aerial extent, reclaimed water uses, volumes, and complexity of the systems. Infrastructure requirements vary but often include storage facilities, pumping facilities, transmission and distribution pipelines, valves and meters, and cross-connection control devices. There
BOX 2-6
Palo Verde Nuclear Generating Station
The Palo Verde Nuclear Generating Station (pictured below) is the largest nuclear power plant in the nation. The plant is located in the desert, approximately 55 miles (89 km) west of Phoenix, Arizona. The facility uses reclaimed water for cooling purposes and has zero discharge. The sources of the cooling water are two secondary wastewater treatment plants, located in Phoenix and Tolleson, Arizona. The plant used 22 billion gallons (83 million m3) of reclaimed water in 2008, which is about 61 MGD (230,000 m3/d) as an average. It has a capacity to treat and use 90 MGD (340,000 m3/d) of reclaimed water, which receives additional treatment by trickling filters to reduce ammonia, lime/soda ash softening to reduce scale- and corrosion-causing constituents, and filtration to reduce suspended solids. The filtered water is stored in two water storage reservoirs to supply cooling to the steam turbines. Water is routed through condensers and cooling towers an average of 25 cycles until the TDS approaches 30,000 mg/L. About 200 million pounds (91 megagrams) of TDS are sent to the evaporation ponds. Currently, three evaporation ponds that total 650 acres (263 hectares) are used to evaporate liquid waste from blowdown. New evaporation ponds are constructed as needed, and the residual in the ponds will not be sent offsite for disposal until the plant is decommissioned.
SOURCE: Day and Conway (2009).
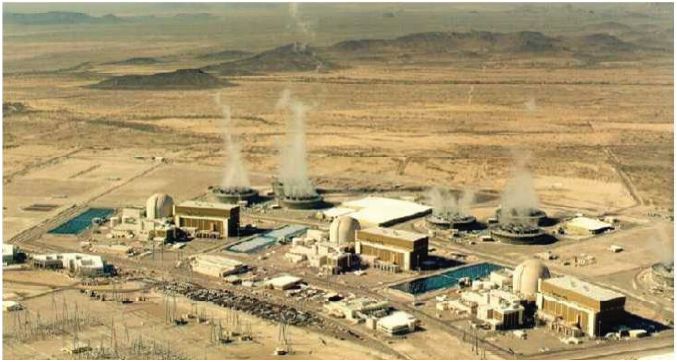
Palo Verde Nuclear Generating Station.
SOURCE: Photo courtesy of Henry Day.
Operation and management of a dual-water system is similar to that for a potable water system. However, because the distributed water is nonpotable reclaimed water, special attention needs to be given to public health protection. This includes using color-coded (e.g., purple) pipe for reclaimed water lines, conducting routine water quality monitoring, and periodically testing the system to protect against inadvertent cross-connections with the potable water system (see Box 6-4).
The oldest dual-water system in the United States is located in Grand Canyon Village, Arizona, where less than 1 MGD (3,800 m3/d) of disinfected ad-
vanced effluent is used for landscape irrigation, toilet flushing, cooling water makeup, vehicle washing, and construction uses when needed (Fleming, 1990; Okun, 1996). The original system began operation in 1926. In contrast, in the late 1970s, large systems were implemented in St. Petersburg, Florida (see Box 2-7) and at the Irvine Ranch Water District in Orange County, California, that provided large volumes of reclaimed water for multiple uses within those communities. These pioneering communities helped develop many of the practices that are necessary to ensure the safe and efficient operation of dual distribution systems as documented in a recent manual published by the American Water Works Association (AWWA, 2009). In areas where local governments have imposed sewer moratoriums or sewer-capacity restrictions, onsite wastewater reclamation and reuse systems have been used successfully in schools and office buildings. More than 30 individual onsite wastewater treatment systems in the United States provide reclaimed water for outside irrigation or for toilet and urinal flushing in office buildings, schools, shopping centers, and manufacturing plants. Because the committee was specifically charged to address municipal wastewater effluent, this report does not discuss onsite reuse systems in detail.
Agricultural
In many parts of the United States, the demand for irrigation water is nearing or exceeds the supply of fresh water. Reclaimed water provides a constant and reliable source of water, even during drought conditions. Agricultural irrigation currently represents the largest use of reclaimed water both in the United States and worldwide (Jiménez and Asano, 2008). Crops irrigated vary from grazing pastures to food crops eaten raw, although irrigation of produce and other food crops eaten raw is prohibited in some states (see also Chapter 10 for state regulation of water reuse). Because agricultural irrigation with reclaimed water has a long history, the technology and suitability of the practice are relatively well understood and do not need to be repeated here. The chemical composition of reclaimed water that has received secondary or higher levels of treatment normally meets existing guidelines for irrigation water (NRC, 1998). Regulatory controls directed at ensuring an adequate level of health protection address reclaimed water treatment and quality, method of irrigation, type of crops to be irrigated, and operation and management of the distribution system and use area and are described in detail in the EPA Guidelines for Water Reuse (EPA, 2004).
Nitrogen, phosphorus, and potassium in reclaimed waters contribute valuable nutrients to plants and reduce the need for fertilizers, which can result in considerable cost savings; however, excessive nitrogen stimulates vegetative growth in most crops and may also delay maturity and reduce crop quality and quantity. Excessive nitrate in forages can cause an imbalance of nitrogen, potassium, and magnesium in grazing animals if forage is used as a primary feed source for livestock (EPA, 2004). The cost of reclaimed water is often less than the real cost of subsidized agricultural irrigation water or the cost of potable water used for irrigation.
There are numerous examples of agricultural irrigation water reuse projects in the United States. For example, Bakersfield, California, has used its effluent for irrigation since 1912 (Crook and Okun, 1993). During the early years, first raw sewage and then primary effluent were used for irrigation. Today, secondary wastewater effluent from Bakersfield is used to irrigate corn, alfalfa, cotton, barley, and sugar beets. Secondary effluent from the city of Lubbock, Texas, has been used to irrigate cotton, grain sorghum, and wheat on a local farm since 1938 (Crook, 1999). In Orange County, Florida, a project known as Water CONSERV II has been supplying reclaimed water for citrus irrigation since 1986. After disinfection and advanced treatment, reclaimed water has been used to irrigate produce and other food crops eaten raw in Monterey County, California, since 1998 following extensive research conducted to demonstrate its safety (see Box 2-8).
Seawater Intrusion Barrier
In aquifers in which groundwater withdrawals exceed rates of recharge, seawater migrates inland. This process, often referred to as seawater intrusion, can result in high concentrations of salts (mainly sodium and chloride) that prevent use of the groundwater for potable, industrial, and agricultural water supply applications. The only long-term solution is to bring supply and demand in balance, but seawater intrusion can be
BOX 2-7
Dual Distribution in St. Petersburg, Florida
The city of St. Petersburg, Florida, with a population of about 255,000, is a residential community located on the west coast of Florida. In the early 1970s, the city relied upon municipal wells to satisfy a growing population, but St. Petersburg needed additional water. At roughly the same time, the Florida Legislature passed a bill to address water quality issues in Tampa Bay, which required all surrounding communities to stop discharging wastewater to Tampa Bay or to remove nutrients via advanced wastewater treatment prior to discharge. The city of St. Petersburg subsequently decided to upgrade its wastewater treatment plants to secondary treatment and eliminate wastewater discharge to surface waters by implementing a water reuse and deep-well injection program.
Reclaimed water was initially provided to sites with large irrigation requirements, such as golf courses, parks, schools, and large commercial areas, beginning in 1977. A few years later, the reclaimed water distribution system was expanded to include irrigation of residential property.
In FY 2009, the total average flow from the four water reclamation plants was about 33 MGD (125,000 m3/d), of which an average of 17 MGD (64,000 m3/d) was used for nonpotable reuse applications. Excess reclaimed water and treated wastewater that does not meet reuse water quality requirements is disposed of via deep well injection. The reclaimed water satisfies about 40 percent of the city’s total water demand. The dual-water system serves more than 10,500 customers, including about 10,250 residential customers for landscape irrigation. Reclaimed water also is used for irrigation at 96 parks, 62 schools, 6 golf courses, and about 343 commercial sites (see figure below). The water also is used for fire protection via reclaimed water hydrants throughout the system and for cooling water at 13 sites.
Prior to distribution, reclaimed water is pumped to covered storage tanks at all four reclamation plants. The transmission mains from the four treatment plants are interconnected so that water flow and pressure can be maintained to all customers if one plant needs to be taken out of service. In all areas where dual-distribution lines provide reclaimed water, the potable water supplies are protected with cross-connection control backflow assembly devices, including double check-valve assemblies at residences that use reclaimed water for irrigation.
St. Petersburg residents that want to be connected to the nonpotable distribution system are required to pay the connection costs, which typically ranges from $500 to $1,200 per customer. Reclaimed water costs $15.62/month for the first acre (0.40 hectares) to be irrigated and $8.95/month for each additional acre or portion thereof. The flat-fee rate structure does not encourage water conservation, and most residents use more reclaimed water than is necessary for proper irrigation. The reclaimed water rate for commercial customers who have metered service is $0.45/1,000 gallons ($0.45/3.785 m3). The current annual operating cost is $5.3 million. System revenue is $2.6 million; the remaining $2.7 million is subsidized by the city’s water and wastewater utilities, each of which pays half of that cost. For additional discussion on the costs of water reuse, see Chapter 9.
SOURCE: Crook, 2005a, Bowen, E., St. Petersburg Water Resources Department, personal communication, 2010.
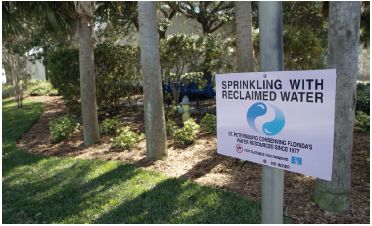
Landscape irrigation with reclaimed water in St. Petersburg.
SOURCE: Dennis MacDonald/World of Stock.
slowed or reversed by injection of water between the supply wells and the ocean. In densely populated areas, seawater intrusion barriers typically consist of a network of wells arrayed parallel to the shoreline to form a hydrostatic barrier to seawater intrusion (Figure 2-3). In several cases, including four seawater intrusion barriers in Southern California (Figure 2-4), reclaimed water has been used to create the groundwater barrier. In 2007, a similar project was built near Barcelona, Spain (Mujeriego et al., 2008), as a means of protect-
BOX 2-8
Monterey County Water Reuse Project, California
As far back as 1975, the Monterey Regional Water Pollution Agency identified the potential for using reclaimed water to stem seawater intrusion from Monterey Bay, caused by overdrafting of underlying aquifers. A demonstration study began in 1976, with the goal of determining the safety of reclaimed water use on edible crops, including those eaten raw. The study tested traditional well water versus two treatment trains of reclaimed water, reclaimed water with advanced treatment that included chemical coagulation and clarification processes and reclaimed water with advanced treatment using direct filtration. Study results indicted that advanced treatment using direct filtration was acceptable for irrigation of food crops eaten raw (Engineering-Science, 1987).
Design of the treatment plant facilities, collectively named the Salinas Valley Reclamation Project, was completed in 1994 along with design of the distribution system, known as the Castroville Seawater Intrusion Project. The 30-MGD (110,000-m3/d) Salinas Valley Reclamation Project began distributing 20 MGD (76,000 m3/d) of irrigation water in 1998 to local farmers, covering 222 parcels of farmland in the 12,000-acre (4,900-ha) service area (see figure below). Reclaimed water is used to irrigate various crops, including lettuce, celery, broccoli, cauliflower, artichokes, and strawberries. The system has experienced only minor problems including flushing of construction debris from the system, excessive sand in the extracted water of some wells, and a few pipeline breaks.
The Recycled Water Food Safety Study was conducted prior to startup to determine if any viable pathogenic organisms of concern to food safety were present in reclaimed water (Jaques et al., 1999). Sampling began in 1997 and continues to the present. No Escherichia coli 0157:H7, Salmonella, helminth ova, Shigella, Legionella, or culturable natural (in situ) viruses were detected in any of the samples. An extremely low number of Cyclospora (one instance), Giardia with internal structure (one instance), and Cryptosporidia (in seven instances) were detected in the reclaimed water. The use of reclaimed water for agricultural irrigation in this region is expected to reduce the volume of seawater intrusion by 40 to 50 percent (Crook, 2004).
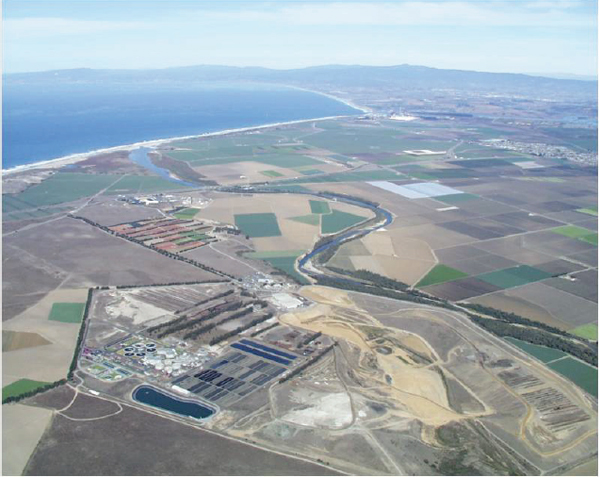
The Salinas Valley Reclamation Project in Monterey, California, which provides reclaimed water to area farms, thereby reducing seawater intrusion caused by overpumping the region’s aquifers.
SOURCE: Monterey Regional Water Pollution Control Agency.
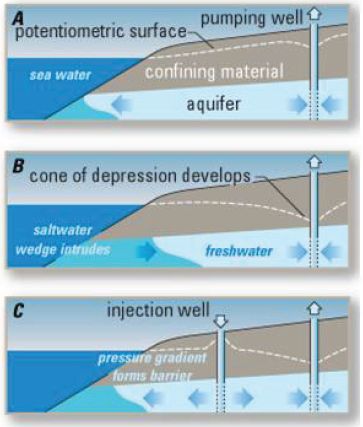
FIGURE 2-3 Effects of groundwater withdrawal on saltwater intrusion and the role of a seawater intrusion barrier. Image A depicts a normal coastal aquifer with a water table high enough to resist seawater intrusion. Image B depicts an aquifer that is being overpumped and is beginning to experience seawater intrusion. Image C shows the same aquifer after the installation of an injection well to form a hydrostatic barrier, protecting the aquifer.
SOURCE: Modified from Johnson (2007).
ing an aquifer that is important for urban water supply and agricultural production. In cases where some of the reclaimed water from the seawater barrier reaches wells used for drinking water supply, the practice is considered potable water reuse.
Impoundments
Reclaimed water impoundments, which are often used for system or seasonal storage, fall into two categories—aesthetic or recreational. Fishing, boating, or any other activity that may involve human contact with the reclaimed water is not allowed in aesthetic impoundments, which are also called landscape impoundments. Recreational impoundments can be subdivided into either non–body contact or body contact impoundments (or restricted and nonrestricted recreational impoundments, respectively). Non–body contact includes activities such as boating and fishing where there is only incidental contact with the reclaimed water, while body contact impoundments allow swimming. There are several recreational impoundments in the United States that allow fishing and boating, and one of the first of which was the Santee Recreational Lakes in San Diego County, California (see Box 2-9). At present there are no reclaimed water recreational impoundments in the United States that are used for full-body-contact activities, although such use is allowed in some states.
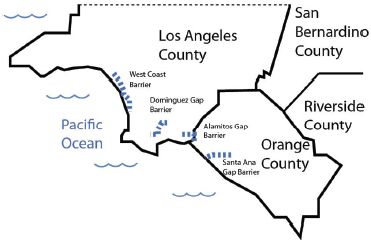
FIGURE 2-4 Locations of the four major Southern California seawater barriers employing reclaimed water. These barriers range in length from 2 miles (Alamitos Gap) to 9 miles (West Coast Barrier).
Regulatory guidelines for recreational impoundments are predicated on the assumption that the water should not contain chemical substances that are toxic following ingestion or irritating to the eyes or skin, and should be safe from a microbiological standpoint. Other concerns are temperature, pH, chemical composition, algal growth, and clarity. Clarity is important for several reasons, including safety, visual appeal, and recreational enjoyment. Recreational lakes composed entirely of reclaimed water are prone to eutrophication. The nutrients in the wastewater can cause excessive growth of algae, and nutrient removal may be necessary prior to reclaimed water discharge. Phosphorus is generally the limiting nutrient and can serve as a means of controlling algae in freshwater impoundments. Before fish, shellfish, or plants are harvested for human consumption from recreational impoundments containing reclaimed water, regulatory guidelines presume that both the microbiological and chemical quality of the
BOX 2-9
Santee Recreational Lakes
Reclaimed water has been used as a source of supply to recreational lakes in Santee, California, since 1961 (see figure below). The activities were limited initially to picnicking and boating, and progressed to a “fish for fun” program, and finally to a normal fishing program. In the early 1970s, a 3.8-MGD (14,000-m3/d) activated sludge treatment plant replaced a pond system. The water was percolated through 400 ft (120 m) of sand and gravel and disinfected prior to discharge to the lake system. Because of the high nutrient levels in the reclaimed water, there was considerable algal growth in the lakes, which average 1,000 ft (300 m) in length and 2–10 ft (0.6-3 m) in depth. Algae control in the lakes via chemicals and mechanical harvesting was practiced. Flow has increased through the years and now includes a advanced treatment system consisting of a 1.9-MGD (7,200-m3/d) Bardenpho (multistage biological treatment) plant followed by coagulation and flocculation using alum, a lamella settler for turbidity and excess phosphorus removal, a denitrification filter, and chlorine disinfection. The reclaimed water is dechlorinated prior to discharge to the lake system, which consists of seven lakes, which have a total surface area of about 60 acres (24 ha). The lakes are part of an extensive recreational area widely used by the local populace (Asano et al., 2007).
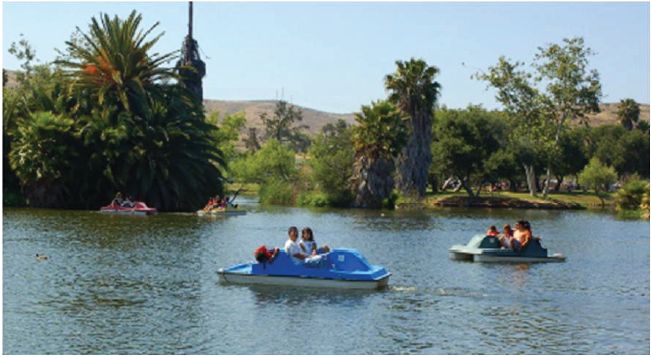
Santee Recreational Lakes.
SOURCE: http://Santeelakes.com.
source water will be thoroughly assessed for possible bioaccumulation of toxic contaminants through the food chain.
Habitat Restoration
In locations where surface water has been diverted for agriculture, industrial, or urban uses, decreases in water availability have had adverse impacts on aquatic habitat (NRC, 2004). The discharge of wastewater effluent can restore, and in some cases, create aquatic habitat. Most documented projects in which water reclamation has resulted in the restoration or creation of aquatic habitat originally were designed either for the disposal of wastewater effluent or as an inexpensive means of improving water quality prior to surface water discharge. Nevertheless, the use of wastewater effluent for habitat restoration or creation is a potentially important application of reclaimed water, especially in rapidly growing regions with limited availability of surface water.
The most common restoration projects are engineered treatment wetlands, which often are built adjacent to wastewater treatment plants as a means of
removing nitrate or phosphate (Kadlec and Knight, 1996). Engineered wetlands are typically not used for removal of ammonium—the other main form of nitrogen present in wastewater effluent—because ammonium is toxic to fish, which are important to the control of mosquitoes and other vectors. The wetlands typically consist of emergent vegetation (e.g., cattails) and shallow ponds that provide excellent habitat for waterfowl, birds, and species of fish that are adapted to shallow water. Although some treatment wetlands have been designed to receive secondary effluent (EPA, 1993a), good aquatic habitat is difficult to establish if the effluent contains ammonia, which is toxic to most aquatic organisms. Therefore, to provide acceptable habitat, wetlands are usually supplied with wastewater effluent that has been subjected to additional treatment to remove ammonia (see Chapter 4). Examples of engineered wetlands that provide wildlife habitat and associated recreational benefits (e.g., wildlife viewing, hunting) include the Easterly Wetlands in Orlando, Florida (see Box 2-10); the Prado Wetlands in Riverside County, California; Tres Rios Wetlands in Phoenix, Arizona; and the Tarrant Regional Wetlands near Dallas, Texas.
It is also possible to use reclaimed water to enhance surface water habitats, especially in arid regions where the original sources of water have been diverted for other uses. For example, San Luis Obispo Creek, which is located in California’s Central Coast region, lost a considerable fraction of its overall flow when the nearby wastewater treatment plant began using its effluent for landscape irrigation. To maintain aquatic habitat in the creek, the utility discharges approximately 1.1 MGD (4,200 m3/d) of reclaimed water directly to the creek (Asano et al., 2007). To ensure that the water quality is cold enough for native species, the reclaimed water is passed through a cooling tower prior to discharge. The reclaimed water accounts for the majority of the flow during the dry summer season.
Wastewater effluent also has been used to create or restore habitat in coastal marshes (Day et al., 2004) and woodlands (Rohnke and Yahner, 2008). Although such systems are less common than treatment wetlands, there is evidence that the nutrients and added water supplied by the reclaimed water can create or restore a variety of habitat types.
Although wetlands and terrestrial systems that depend on wastewater effluent often support rich ecological communities, it is important to recognize that the restored or created systems may not be similar to those that were present prior to development. For example, a surface water wetland fed with wastewater effluent will not result in the same ecosystem as the nutrient-poor ephemeral stream that was present prior to development. Therefore, decisions about the type of treatment needed prior to using reclaimed water for habitat restoration need to be made in recognition of the needs of the specific type of ecosystem. These and other issues related to environmental applications of reclaimed water are discussed in more detail in Chapter 8.
Potable reuse projects have been operated in the United States for almost 50 years. During this period, the treatment technologies employed in the advanced treatment systems have evolved considerably, with a gradual shift from reliance on physical processes, such as lime clarification and adsorption of contaminants on activated carbon (Table 2-3), to membrane filtration and advanced oxidation (see Chapter 4 for descriptions of treatment technologies). In 2010, approximately 355 MGD (1,350 m3/d) of reclaimed water was used for planned potable reuse projects in the United States. Although this accounts for only about 0.1 percent of the municipal wastewater undergoing treatment, reclaimed water can account for the majority of the drinking water supply in some areas.
The use of reclaimed water for drinking water supplies has historically been divided into two categories: indirect potable reuse (IPR) and direct potable reuse. Both employ a sequence of treatment processes after conventional wastewater treatment (detailed in Chapter 4). However, IPR projects were distinguished from direct potable reuse projects by the presence of an environmental buffer between the wastewater effluent and the potable water supply. An environmental buffer is a water body or aquifer, perceived by the public as natural, which serves to sever the connection between the water and its history. The buffer may also (a) decrease the concentration of contaminants through various attenuation processes, (b) provide an opportunity to blend or dilute the reclaimed water, and (c) increase the amount of time between when the reclaimed water
BOX 2-10
The Easterly Wetlands Project
The Easterly Wetlands Project (see figure below) was constructed approximately 30 miles (48 km) east of Orlando, Florida, in 1993. The 1,650-acre (670-ha) wetland was built by constructing 18 miles (29 km) of berms and importing wetland plants to create a series of wetland cells on a property that had been used as a cattle ranch after the natural wetland had been drained in the 1850s. Between approximately 20 and 35 MGD (76,000 to 130,000 m3/d) of wastewater effluent flows through the wetland before being discharged to the St. Johns River.
The wetland system reduces the concentrations of nutrients discharged to the sensitive St. Johns River. Phosphate is mainly removed by settling and plant uptake while much of the nitrogen is denitrified (i.e., released from the wetlands as nitrogen gas). Data collected over the first 3 years of the project indicated reductions of total phosphorus and total nitrogen of over 97 percent and over 90 percent, respectively (Mark Sees, Orlando Easterly Wetlands, personal communication, 2009).
The Easterly Wetlands also acts as a habitat for birds, such as the locally endangered Everglades snail kite, and various species of mammals, amphibians, and reptiles. The wetland facility has an educational center that regularly attracts visitors from local schools and bird watchers.
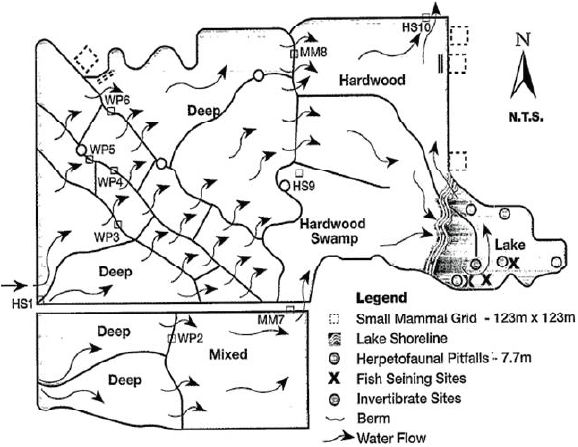
Schematic representation of the Easterly Wetlands System.
SOURCE: EPA (1993b).
is produced and when it is introduced into the water supply. Although the latter three functions of environmental buffers have potentially important implications for public health, performance standards for buffers have never been defined. The committee is unaware of any situation in which the time delay provided by a buffer has been used to respond to an unforeseen upset, and the residence time of reclaimed water in some environmental buffers (e.g., rivers, small lakes, and reservoirs) is short (e.g., hours or days) relative to the time needed to detect and respond to all but the most obvious system failures.
It was largely the passage of water through a natural system and its role in increasing public acceptance of the subsequent use of the water in potable supplies that led to the perception that environmental buffers
TABLE 2-3 Examples of Potable Reuse Schemes and Employed Treatment Technologies in the United States
| Project Location | Type of Reuse | Project Size MGD (m3/d) | First Installation Year |
| Montebello Forebay, County Sanitation Districts of Los Angeles County, CA | Groundwater recharge via soil-aquifer treatment | 44 (165) | 1962 |
| Water Factory 21, Orange County, CA | Groundwater recharge via seawater barrier | 16 (60) | 1976 |
| Upper Occoquan Service Authority, VA | Surface water augmentation | 54 (204) | 1978 |
| Hueco Bolson Recharge Project, El Paso Water Utilities, TX | Groundwater recharge via direct injection | 10 (38) | 1985 |
| Clayton County Water Authority, GA | Surface water augmentation | 18 (66) | 1985 |
| West Basin Water Recycling Plant, CA | Groundwater recharge via direct injection | 12.5 (47) | 1993 |
| Gwinnett County, GA | Surface water augmentation | 60 (227) | 1999 |
| Scottsdale Water Campus, AZ | Groundwater recharge via direct injection | 14 (53) | 1999 |
| Los Alimitos Barrier Water Replenishment District of So. CA | Groundwater recharge via direct injection | 2.7 (10) | 2005 |
| Chino Basin Groundwater Recharge Project, Inland Empire Utility Agency, Chico, CA | Groundwater recharge via soil-aquifer treatment | 18 (69) | 2007 |
| Groundwater Replenishment System, Orange County, CA | Groundwater recharge via direct injection and spreading basins | 70 (265) | 2008 |
| Arapahoe County/Cottonwood, CO | Groundwater recharge via spreading operation | 9 (34) | 2009 |
| Cloudcroft, NM | Spring water augmentation | 0.1 (0.38) | 2009 |
| Prairie Waters Project, Aurora, CO | Groundwater recharge via riverbank filtration | 50 (190) | 2010 |
| Permian Basin, Colorado River Municipal Water District, TX | Surface water augmentation | 2.5 (9.4) | 2012 |
| Dominguez Gap Barrier, City of Los Angeles | Groundwater recharge via direct injection | 2.5 | 2012 |
SOURCE: Adapted from Drewes and Khan (2010)
were essential to potable water reuse projects. For the community, environmental buffers have been crucial to acceptance because they break the perceived historical connection between the ultimate water source (i.e., sewage) and the reclaimed water supply. The notion that potable water suppliers should avoid the use of effluent-impacted source waters was supported by outbreaks of waterborne disease that were common prior to the widespread installation of drinking water and wastewater treatment plants during the twentieth century, when consumers were exposed to untreated water supplies that were subjected to discharges of raw sewage. Given the improvements in treatment, such outbreaks are much less likely in systems where treated wastewater and drinking water undergo disinfection. However, the public’s notion that water sources should be separated from waste discharges is a well-established precedent.
The committee recognizes that community acceptance is important to potable reuse projects (see Chapter 10) and this factor alone may motivate utilities to include buffers in potable reuse projects. However,
| Treatment Technologies | |||||
| Current Status | Suspended Solids | Organic Compounds | Residual Nutrients | Residual Salts | Pathogens |
| Ongoing | Media filtration | Soil-aquifer treatment | Soil-aquifer treatment | None | Chlorination, soil-aquifer treatment |
| Terminated 2004 | Lime clarification | GAC filtration; Reverse osmosis; UV/AOP | Air stripping; reverse osmosis | Reverse osmosis | Lime clarification, chlorination, UV |
| Ongoing | Lime clarification, media filtration | GAC filtration | Ion exchange (optional) | None | Chlorination |
| Ongoing | Lime clarification, media filtration | Ozonation, GAC filtration | PAC augmented activated sludge system | None | Ozonation, chlorination |
| Ongoing | Land application system and wetlands | Land application system; wetlands | Land application system; wetlands | None | Chlorination, UV |
| Ongoing | Microfiltration | Reverse osmosis; UV/ AOP | Reverse osmosis | Reverse osmosis | Microfiltration chloramination, UV |
| Ongoing | Ultrafiltration | Pozonation; GAC filtration | Chem. P-removal | None | Ultrafiltration, Ozone |
| Ongoing | Media filtration, microfiltration | Reverse osmosis | Reverse osmosis | Reverse osmosis | Microfiltration, Chlorination |
| Ongoing | Microfiltration | Reverse osmosis, UV | Reverse osmosis | Reverse osmosis | Microfiltration, UV |
| Ongoing | Media filtration | Soil-aquifer treatment | Soil-aquifer treatment | None | Chlorination |
| Ongoing | Microfiltration | Reverse osmosis, UV/ AOP | Reverse osmosis | Reverse osmosis | Microfiltration; UV |
| Ongoing | Media filtration | Reverse osmosis, UV/ AOP | Reverse osmosis | Reverse osmosis | Chlorination |
| Ongoing | Microfiltration; ultrafiltration | Reverse osmosis, UV/ AOP | Reverse osmosis | Reverse osmosis | Chlorination |
| Ongoing | Riverbank filtration | Riverbank filtration, UV/ AOP, BAC, GAC | Riverbank filtration; artificial recharge and recovery | Precipitative softening | Riverbank filtration, UV, chlorination |
| Under construction | Ultrafiltration | Reverse osmosis, UV-AOP | Reverse osmosis | Reverse osmosis | Chlorination |
| Ongoing | Microfiltration | Reverse osmosis | Reverse osmosis | Reverse osmosis | Microfiltration |
the role of the environmental buffer in providing public health protection under the conditions encountered in planned potable reuse systems has not always been well documented. This is particularly important because each environmental buffer will have different attributes that affect the removal of contaminants, the amount of dilution, or the residence time (see also Chapter 4). For example, greater removal of contaminants by photochemical processes will occur in shallow, clear streams than in deep lakes or turbid rivers (Fono et al. 2006). As a result, it would be inappropriate to assume that contaminant attenuation by photochemical processes occurs at the same rates in these two types of systems. Without good data on site-specific characteristics, there will be considerable uncertainty about the ability of environmental buffers to remove contaminants. Because of the limited and variable data on the performance of environmental buffers (see Chapter 4), the committee has chosen in this report to emphasize the key processes and attributes necessary for potable reuse, rather than specific design elements implied by the terms direct or indirect potable reuse. Thus, these
terms are mainly used in this report in the context of historical or planned reuse projects, in recognition of the widespread practice of classifying potable reuse projects as direct or indirect, but these distinctions are deemphasized in the remainder of the report.
The overview of potable reuse projects in the following section is intended to provide representative examples of potable reuse projects, to illustrate the role of environmental buffers, and to describe current trends in potable water reuse. The performance of environmental buffers is discussed in detail in Chapter 4, and public perception is discussed in Chapter 10.
Surface Water Augmentation
Approximately two-thirds of the potable water delivered by public water systems in the United States comes from surface water sources, including rivers, lakes, and reservoirs (Hutson et al., 2000). In some cases, the entire surface water source is located in a protected watershed. Such systems usually provide water of high quality that can be delivered to consumers after disinfection (NRC, 2000). However, most surface water supplies are at least partially located in unprotected watersheds, where they may receive contaminants from upstream sources including agricultural and urban runoff, industrial process water, and municipal wastewater effluent. For example, wastewater effluent accounts for approximately half of the water entering one of the main water supply reservoirs for Houston (see Box 2-3). In recognition of the potential contributions of these sources of contamination, drinking water treatment plants that handle water from unprotected water sources often employ more sophisticated treatment technologies (see also Chapter 4).
Augmentation of surface waters with reclaimed water represents the addition of another source of water to the system. Surface water augmentation involves discharge of reclaimed water directly to a water supply reservoir, a lake, or a short stretch of river followed by capture in a reservoir or to a wetland adjacent to a river. Most reservoir systems receive a considerable fraction of their overall flow from other sources and as a result, reclaimed water undergoes substantial dilution. Furthermore, the relatively long hydraulic retention time in large reservoirs affords considerable opportunities for contaminant attenuation, although if nutrients are not removed prior to discharge, the reclaimed water can result in excessive algal growth and water quality degradation.
As discussed in Chapter 3, the concentration of contaminants in reclaimed water depends on the source of the sewage and the treatment processes used. For example, wastewater reclamation plants using advanced treatment produce reclaimed water that contains lower concentrations of contaminants than what is commonly observed in surface waters subject to upstream discharges of typical wastewater effluent, urban runoff, and agricultural drainage. Thus, surface water augmentation may contribute better quality water to a drinking water treatment plant than other sources in the watershed. Assessments of surface water augmentation projects should therefore be viewed in the broader context of the water quality that already exists in the water body. Assessments of the public health risks associated with potable reuse projects also need to consider the potential for attenuation of contaminants to occur between the location where the reclaimed water enters the system and the consumer’s tap (for a detailed discussion of risk, see Chapters 6 and 7).
The first permanent4 surface water augmentation project in the United States was installed in Fairfax County, Virginia, in 1978. As part of the augmentation project, the Upper Occoquan Service Authority (UOSA) discharges approximately 54 MGD (204,000 m3/day) of effluent from an advanced treatment plant into a water supply reservoir. In a typical year, the wastewater effluent accounts for less than 10 percent of the water flowing into the reservoir. However, during a drought in the early 1980s, reclaimed water accounted for more than 80 percent of the water entering the reservoir (AWWA/WEF, 1998). Using data on the size of the reservoir and the contribution of reclaimed water, the hydraulic retention time of the reclaimed water in the reservoir is estimated to vary from a few days to more than 6 months.
In 1982, a water utility near Atlanta, Georgia, began augmenting one of its reservoirs by using sprinklers to apply effluent from a conventional wastewater treatment plant to forestland adjacent to a water supply
_____________
4 A reservoir supplying water for the City of Chanute, Kansas, was augmented with secondary wastewater effluent between 1956 and 1957 (Metzler et al., 1958).
reservoir. After passing through the soil, the reclaimed water flowed into the reservoir. As the water needs of the Clayton County Water Authority expanded, the land application system was replaced by a series of constructed wetlands that do not require as much land. The first set of engineered wetlands was installed in 2003 and was expanded to cover over 500 acres (202 ha) in subsequent years. Available estimates suggest that during droughts, wastewater effluent may contribute up to 50 percent of the flow into the reservoir (Guy Pihera, Water Production Manager, Clayton County Water Authority, personal communication, 2010).
Recent developments related to surface water augmentation in the Trinity River watershed of Texas (see Box 2-3) are noteworthy with respect to their design and water rights issues. As part of the region’s integrative water planning efforts in anticipation of projected rapid population growth in the Dallas/Forth Worth area, regional water utilities have acknowledged the principle that wastewater effluent is a resource rather than a disposal problem. The first of several planned indirect potable water reuse projects in the watershed was initiated in 2002, when water from an effluent-dominated section of the Trinity River was diverted into a series of engineered treatment wetlands located approximately 50 miles (80 km) south of Dallas. The river water passes through the wetlands over a period of approximately 8 days prior to being discharged into a water supply reservoir. The Tarrant Regional Water District is currently permitted to discharge an average of 56 MGD (210,000 m3/d) of Trinity River water into the Richland Chambers Reservoir. The Trinity River water accounts for up to approximately 30 percent of the water entering the reservoir (D. Andrews, Tarrant Regional Water District, personal communication, 2010). A similar project is planned for the Cedar Creek Reservoir, which is located approximately the same distance downstream of Dallas on the other side of the river starting in 2018.
Two additional surface water augmentation projects under development in the Trinity River Basin will send reclaimed water directly into water supply reservoirs. By trading reclaimed water produced in different parts of the watershed, utilities in the basin can minimize capital costs for construction of pipelines as well as the costs associated with pumping water to different elevations. For example, the North Texas Metropolitan Water Authority is planning to discharge 30 MGD (110,000 m3/d) of reclaimed water into the City of Dallas’s Lake Lewisville Reservoir in exchange for Dallas discharging the same volume of reclaimed water into North Dallas’s Ray Hubbard Reservoir (Glenn Clingenpeel, Trinity River Authority, personal communication, 2010). Trades involving reclaimed water, or trades in which the discharge of reclaimed water to a river is used to offset the use of surface water from another location are useful to water resource planners and may lead to more surface water augmentation projects in the future.
Groundwater Recharge
Approximately one-third of the potable water provided by public water supplies in the United States is from groundwater sources (Hutson et al., 2000). In locations with high water demand and low precipitation, groundwater oversubscription can result in seawater intrusion, land subsidence, and exhaustion of wells (NRC, 2008c). The depletion of aquifers can be exacerbated in urbanized areas, where impervious surfaces (e.g., pavement) reduce groundwater recharge. Groundwater also is an important means of water storage, especially in areas where the construction of new surface water reservoirs is difficult due to the lack of available land or concerns about the environmental damage caused by reservoirs. In response to concerns about groundwater overdrafts, reclaimed water can be used to recharge aquifers.
The most common ways reclaimed water is introduced into groundwater are surface spreading basins and direct injection (UNEP, 2005). Riverbank filtration with effluent-dominated surface waters also has been used as a means of augmenting groundwater supplies. Each of these approaches has different requirements with respect to pretreatment. As a result, the concentrations of contaminants in recharged waters and the extent of attenuation occurring in the subsurface will vary among the different approaches. When an aquifer is used as the environmental buffer in a potable water reuse project, the extent of contaminant attenuation will be dictated by the pretreatment process, the degree of contact with surface soils (e.g., infiltration versus injection), the hydrogeology of the aquifer, and the
amount of time that the water remains in the subsurface prior to abstraction.
The composition of reclaimed water and geology of the aquifer are important considerations in groundwater recharge projects. Highly treated reclaimed water is often depleted with respect to calcium, magnesium, and other common ions. As a result, minerals in the aquifer may dissolve as the reclaimed water is recharged. Alternatively, elevated concentrations of certain ions could lead to the formation of new mineral phases in aquifers. Over time, these processes can alter the permeability of the aquifer or result in the release of toxic trace elements, such as arsenic and chromium. To prevent such changes, post-treatment processes are frequently employed before introducing reclaimed water into an aquifer. However, the long-term responses of an aquifer to reclaimed water are not always completely understood when a project is initiated.
Surface Spreading Via Recharge Basins. Surface spreading is a method of groundwater recharge in which reclaimed water moves from the land surface to the aquifer, usually through unsaturated surface soils. Generally, surface spreading is accomplished in large bermed basins with sand or permeable soil above an unconfined aquifer where reclaimed water can percolate into the subsurface (see Figure 2-5). This practice is also called soil aquifer treatment or rapid infiltration.
In terms of water quality and contaminant attenuation, the process of infiltration provides opportunities for removal of particle-associated contaminants (e.g., pathogens, mineral particles). In addition, contaminants may be transformed by microbes as they undergo infiltration. Recharge basins are attractive to water utilities because they are relatively inexpensive to build and do not require extensive maintenance (EPA, 2004). However, compared to other means of introducing water into the subsurface (e.g., direct injection, vadose wells) recharge basins take up more space. As a result, they are often impractical in dense urban settings. Furthermore, spreading basins cannot be used in locations with shallow water tables or where local geological conditions (e.g., impermeable zones close to the land surface) limit rates of water infiltration.
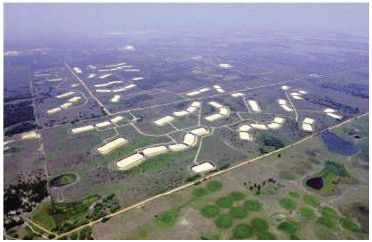
FIGURE 2-5 Rapid infiltration basins at the Water CONSERV II facility in Orlando, Florida, which recharged 31 MGD (120,000 m3/d) of reclaimed water in 2006.
SOURCE: Alley et al. (1999).
In the United States, many of the pioneering efforts associated with aquifer recharge with reclaimed water have occurred in Southern California. The first major recharge project was conducted by the County Sanitation Districts of Los Angeles County and the Water Replenishment District of Southern California when they established a spreading basin in Whittier, California, in 1962. The 570-acre (220-ha) complex of spreading basins recharges a mix of reclaimed water, local stormwater runoff, and imported water to an aquifer that serves as a potable water supply for residents located as close as approximately 65 ft (20 m) downgradient of the spreading basins. On an annual basis, reclaimed water accounts for approximately 60 percent of the water recharged at this site.
Surface spreading basins also are used to recharge water from an effluent-dominated river into a potable aquifer in a community located south of Los Angeles. Since 1933, the Orange County Water District has diverted water from the nearby Santa Ana River into a series of spreading basins in the city of Anaheim. At this location, Santa Ana River water typically consists of over 90 percent wastewater effluent from the upstream communities of the Inland Empire Region during the dry season (i.e., April through October). Prior to reaching the location where the water is diverted, about half of the flow of the river passes through an engineered treatment wetland that has a hydraulic residence time of approximately 3 days (Lin et al., 2003). The remaining half of the dry season, Santa Ana River flow travels from the upstream advanced-treated wastewater effluent outfalls to the infiltration basins, in some cases with slightly less than 1-day transport time.
After percolating through the soil, the water enters an aquifer that is used as the potable supply for a well field located downgradient of the infiltration basins.
Subsurface Injection. Reclaimed water can also be directly injected into the subsurface to replenish an aquifer. Direct injection usually requires more treatment of wastewater effluent than is required for surface spreading because the injected water is pumped directly into the aquifer without the benefit of soil aquifer treatment. A high level of treatment also is needed to reduce the potential for aquifer clogging. Direct injection can occur via direct-injection wells, deep vadose zone wells that discharge water into the unsaturated zone, or aquifer storage and recovery wells, which are designed for both injection and withdrawal.
The first project in the United States that employed direct injection of reclaimed water into a potable aquifer started in Orange County, south of Los Angeles, in 1976. The Orange County Water District’s Water Factory 21 facility employed a state-of-the-art treatment system for water reclamation prior to injection into a seawater intrusion barrier. Water Factory 21 injected two-thirds reclaimed water and one-third groundwater, obtained from a deep aquifer, into the barrier. The seawater barrier was a potable water reuse project because the water in the seawater intrusion barrier also flowed toward nearby potable water supply wells. For example, water supply wells located approximately 0.3 mile (500 m) from a seawater intrusion barrier in Orange County, California, exhibit chloride concentrations equal to those of the water injected into the barrier (Fujita et al., 1996), indicating that most of the water delivered by these wells originated in the injection well. Subsequent to the success of Water Factory 21, the Orange County Water District developed the new Groundwater Replenishment System, which expanded the utility’s potable reuse capacity from 16 MGD (61,000 m3/d) to 70 MGD (260,000 m3/d) in 2008 (see Box 2-11).
Other projects that use a combination of advanced treatment processes similar to those practiced at Orange County’s Groundwater Replenishment System have been built in Southern California and Arizona. The West Basin Water District’s Recycling Plant was built near Los Angeles Airport in 1993. The project initially used deep wells to inject a mixture of equal volumes of reclaimed water and water imported from
BOX 2-11
Orange County Water District, California
Groundwater withdrawals make up about 70 percent of the water supply in the Orange County Water District’s service area, with the remaining demand being met by imported water from the Colorado River and Northern California. Historically, imported water from the Colorado River and Northern California and water from the Santa Ana River have been the source waters for groundwater recharge in Orange County. Seawater intrusion has been a problem since the 1930s as a consequence of groundwater basin overdraft. Injection of reclaimed water from an advanced wastewater treatment facility (Water Factory 21) to form a seawater intrusion barrier in the Talbert Gap area of the groundwater basin began in 1976. The project served the dual purpose of seawater intrusion barrier and potable supply augmentation. Agency leaders acknowledged both of these purposes and did not encounter public opposition to the potable augmentation.
A recharge project called the Groundwater Replenishment (GWR) System was conceived in the 1990s to replace Water Factory 21 and provide additional water to recharge the Orange County Groundwater Basin. The GWR System consists of three major components: the Advanced Water Purification Facility (AWPF); the Talbert Gap Seawater Intrusion Barrier; and the Miller and Kraemer spreading basins. The AWPF began producing reclaimed water in January 2008 for injection at the Talbert Gap and spreading at Kraemer and Miller basins.
The source water for the 70-MGD (260,000-m3/d) advanced treatment facility is secondary effluent from the adjacent Orange County Sanitation District Plant No. 1. The AWPF provides further treatment by microfiltration, reverse osmosis, and advanced oxidation. The treated water is stabilized by decarbonation and lime addition to raise the pH and add hardness and alkalinity to make the water less corrosive and more stable.
In 2009, production of reclaimed water averaged 54 MGD (200,000 m3/d). Plans are under way to increase the capacity of the GWR System in phases, with an ultimate capacity of 130 MGD (490,000 m3/d). Half of the water produced by the advanced treatment plant is injected into the Talbert Gap Seawater Intrusion Barrier and half is pumped approximately 13 miles (21 km) to the Kraemer and Miller basins in Anaheim, which are deep spreading basins in the Orange County Forebay area. The nearest downgradient extraction well is more than 5,200 ft (1,580 m) from the percolation basins, and the retention time underground prior to extraction in excess of 6 months.
SOURCES: Crook (2007); Alan Plummer Associates (2010).
the Colorado River into the West Coast Barrier (see Figure 2-4). Projects in Scottsdale, Arizona, Los Angeles, and Denver were initiated in 1999, 2005, and 2009, respectively. The Scottsdale and Los Angeles projects employ reverse osmosis prior to groundwater injection whereas the Denver project applies reverse osmosis to the abstracted groundwater.
In light of the trend to employ reverse osmosis prior to groundwater injection, it is noteworthy that the groundwater recharge project operated by El Paso Water Utilities since 1985 employs activated carbon and ozonation as barriers against waterborne pathogens and chemical contaminants in a potable reuse project. By avoiding the use of reverse osmosis, the El Paso facility does not produce a brine waste that requires disposal. The reclaimed water produced by the advanced treatment plant is injected into the aquifer, where it spends approximately 6 years underground before abstraction. According to estimates from the operators of the system, reclaimed water accounts for approximately 1 percent of the water abstracted in the nearest downgradient wells (Ed Archuleta, El Paso Water Utilities Public Service Board, personal communication, 2010).
Given the rapid growth in population in communities that do not have access to ocean outfalls for brine disposal, projects such as the system in El Paso may become more common in the near future. For example, the 190-MGD (720,000-m3/d) potable reuse project initiated in Aurora, Colorado, near Denver (see Table 2-3) in 2010 employs advanced treatment after groundwater recharge and extraction, without reverse osmosis. In situations where salt removal is not required, similar projects may offer distinct advantages over reverse osmosis followed by direct injection.
Riverbank Filtration
Riverbank filtration is a process that has been used to treat surface waters that have been subject to contamination from upstream sources. During riverbank filtration, aquifer sediments act as a natural filter removing contaminants as river water recharges groundwater. The hydraulic gradient driving the flow of water through the riverbank is often induced by pumping nearby water supply wells (Hiscock and Grischek, 2002; Kim and Corpcioglu, 2002). Because water follows different flow paths as it moves into extraction wells, the peak concentrations of contaminants sometimes encountered in water supplied from rivers or lakes are moderated. In addition, physical and biological processes in the subsurface result in decreases in the concentrations of many contaminants as water flows toward the extraction wells (Sontheimer and Nissing, 1977; Sontheimer, 1980; Sontheimer, 1991; Kühn and Müller, 2000; Wang et al., 2002; Schmidt et al., 2004; Hoppe-Jones et al., 2010).
Riverbank filtration has been used for public and industrial water supply in Europe (Kühn and Müller, 2000; Grischek et al., 2002; Ray et al., 2002a,b) for more than a century. Riverbank filtration has been practiced to a lesser extent in the United States for more than 50 years in communities along the Ohio, Wabash, and Missouri Rivers (Weiss et al., 2002). In Europe, it provides 50 percent of potable supplies in the Slovak Republic, 45 percent in Hungary, 16 percent in Germany, and 5 percent in The Netherlands (Hiscock and Grischek, 2002). For example, Berlin obtains approximately 75 percent of its drinking water supply from riverbank filtration of effluent-dominated rivers. Düsseldorf has been using riverbank filtration of an effluent-impacted section of the Rhine River water as a potable water supply since 1870.
Site-specific factors can affect the performance of riverbank filtration systems (see Chapter 4 for additional discussion of treatment performance). As a result, riverbank filtration is mainly practiced in locations with the appropriate geological characteristics (e.g., high-permeability sediments located adjacent to a river). In addition, riverbed characteristics and operational conditions (e.g., well type, pumping rates, travel time in the subsurface) are important factors affecting water yields and water quality. Although some of these factors can be influenced by engineering design, others depend on the individual site and local hydrogeological conditions.
In the context of water reclamation, riverbank filtration offers a means of improving the quality of effluent-dominated surface waters (e.g., systems in which de facto reuse is practiced). The process also has the potential to serve as a means of attenuating contaminants in planned potable reclamation systems. However, additional research is needed to develop a better understanding of factors affecting the performance of riverbank filtration systems.
Recent Trends with Respect to Environmental Buffers
As discussed previously, environmental buffers were important features of potable water reuse projects constructed in the United States between 1960 and 2009. Over the five decades, treatment technologies have improved and their costs have decreased. In addition, the continued success of an environmental-buffer-free potable reuse project in Windhoek Namibia (see Box 2-12) has provided evidence that environmental buffers are not always necessary in potable reuse projects. As utilities have become more confident in their ability to meet potable water standards and guidelines, potable reuse projects have been proposed, designed, and in several cases built in the United States without environmental buffers.
The increasing interest of utilities in operating potable reuse projects without environmental buffers is driven by a number of factors, including water rights, lack of suitable buffers near the locations where reclaimed water is produced, potential for contamination of the reclaimed water when it is released into the environmental buffer, and costs associated with maintenance, operation, and monitoring of environmental buffers. For example, recent controversies about water rights in Lake Lanier, Georgia, could jeopardize the Gwinett County Water Authority’s rights to the reclaimed water that it currently discharges to the lake. As a result, it is considering the possibility of piping the reclaimed water directly to a blending pond that is not connected to the reservoir, thereby allowing them to maintain ownership of the water. Because the blending pond would be a manmade structure that does not receive water from other sources, this potable reuse project would not include an environmental buffer.
Another example of this trend is the potable reuse project being built by the Colorado River Municipal Water District in Texas in which a series of water reclamation plants will return reclaimed water directly to its drinking water reservoir (Sloan et al., 2010). The first of these projects, which is scheduled to begin operating in 2012, will deliver 2.5 MGD (9,500 m3/d) of reclaimed water to its surface water reservoir through a transmission canal. In addition to decreasing the water district’s reliance on the Colorado River, the reuse of water avoids the need to pump water up to the reservoir from water sources lower in the watershed. As a result, after including energy used by the advanced treatment plant, energy consumption for the reclamation project is approximately equal to that of other available water sources.
While the surface water reservoir employed by the Colorado River Water District or the blending pond used by the Gwinett County Water Authority have characteristics of environmental buffers, a recently built project in the community of Cloudcroft, New Mexico, in which 0.1 MGD (380 m3/d) of reclaimed water is blended with local spring water in a covered reservoir does not have many attributes normally associated with environmental buffers (see Box 2-13). This project was approved by the local community and underwent review without a requirement for an environmental buffer.
The characteristics of an environmental buffer affect the impacts on public acceptance and contaminant attenuation. For example, a wetland populated with healthy plants, birds, and fish is likely to be more acceptable to the public than a sandy-bottomed river with steeply sloped concrete flood control levees. Likewise, percolation of reclaimed water through 16 ft (5 meters) of soil followed by mixing with local groundwater and a year in the subsurface is more likely to result in contaminant attenuation than direct injection with no dilution followed by days or weeks in an aquifer consisting of fractured bedrock. Environmental buffers used in IPR projects fall along a continuum and each should be judged within the context of the entire water system. Manufactured water storage structures, such as blending ponds or artificial aquifers, employed in direct potable water reuse systems, can provide many of the same benefits as natural environmental buffers, both in terms of public perception and contaminant attenuation.
The direct connection of an advanced water reclamation plant to a water distribution plant, without an intermediate water storage structure for blending with water from other sources, would provide none of the aforementioned benefits related to public acceptance or contaminant attenuation. As a result, such structures are unlikely to be built in the near term. After the nation has more experience with potable reuse systems that employ blending structures, decisions can be made about the merits of direct “pipe-to-pipe” potable reuse systems (see also Chapter 5 discussions on quality assurance).
BOX 2-12
Windhoek, Namibia, Potable Reuse System
The Windhoek, Namibia, advanced wastewater treatment plant returns reclaimed water directly to the city’s drinking water system. The average rainfall is 14.4 inches (37 cm) while the annual evaporation is 136 inches (345 cm), and this city of 250,000 people relies on three surface reservoirs for 70 percent of its water supply. First implemented in 1968 with an initial flow of 1.3 MGD (4,900 m3/d; Haarhof and Van der Merwe, 1996), the Goreangab water reclamation plant, which receives secondary effluent from the Gammans wastewater treatment plant, has been upgraded through the years to its current capacity of 5.5 MGD (21,000 m3/d). Industrial and potentially toxic wastewater is diverted from the wastewater entering the plant. There have been four distinct treatment process configurations since 1968. The current treatment train was placed in operation in 2002 and includes the following processes:
• Primary sedimentation
• Activated sludge secondary treatment with nutrient removal
• Maturation ponds (4 days)
• Powdered activated carbon, acid, polymers (used when required)
• Preozonation
• Coagulation/flocculation with ferric chloride (FeCl3)
• Dissolved air flotation
• Rapid sand/anthracite filtration preceded by potassium permanganate (KMnO4) and sodium hydroxide (NaOH) addition
• Ozonation preceded by hydrogen peroxide (H2O2) addition
• Biological and granular activated carbon
• Ultrafiltration (0.035-micrometer [μm] pore size)
• Chlorination
• Stabilization with NaOH
• Blending prior to distribution
Blending occurs at two locations. The first blending takes place at the Goreangab water treatment plant, where reclaimed water is blended with conventionally treated surface water. This mixture is then blended with treated water from other sources prior to pumping to the distribution system.
Prior to recent upgrades in 1991 the percentage of reclaimed water in the drinking water averaged 4 percent (Odendaal et al., 1998). Following the plant upgrades, reclaimed water represents up to 35 percent of the drinking water supply during normal periods, and as much as 50 percent when water supplies are limited (Lahnsteiner and Lempert, 2005; du Pisani, 2005). Extensive microbial and chemical monitoring is performed on the product water, with continuous monitoring of several constituents.
Both in vitro and in vivo toxicological testing has been conducted on product water from the Goreangab treatment plant (such as Ames test, urease enzyme activity, bacterial growth inhibition, water flea lethality, and fish biomonitoring). An epidemiological study (1976 to 1983) was also conducted, which found no relationships between cases of diarrheal diseases, jaundice, or deaths to drinking water source (Isaacson and Sayed, 1988; Odendaal et al., 1998; Law, 2003). However, a prior NRC committee concluded that because of limitations in the Windhoek epidemiological studies and its “unique environment and demographics, these results cannot be extrapolated to other populations in industrialized countries” (NRC, 1998). There was some initial public opposition to the Windhoek project, but over time, opposition has faded, and no public opposition to the project has emerged in recent years.
The current extent of reuse is summarized in the following section, focusing on the United States, with additional information on other countries with large reuse initiatives. Available reuse data, however, are sparse, and most of the figures cited below should be considered estimates.
United States
Statistics on the extent of water reuse in the United States remain somewhat limited. Every 5 years, the USGS releases data on U.S. water use, and for 1995, the last year for which reclaimed water use data were included, 1,057 MGD (4 million m3/d) of wastewater was reused. This amount represented approximately
BOX 2-13
Potable Reuse in Cloudcroft, New Mexico
The village of Cloudcroft, New Mexico, is a mountain community at 8,600-ft (220-m) elevation with a permanent population of 750. As a winter resort community, population can increase during holidays and weekends to more than 2,000 with a peak demand of 0.36 MGD (1,400 m3/d). Recent drought conditions had resulted in a reduction of spring flows and groundwater tables. Because of limited local supplies and Cloudcroft’s elevation, which limit use of water sources from outside the community, the village decided to reuse their local wastewater to augment their drinking water supply. In 2009, an advanced water treatment plant with a capacity of 0.10 MGD (380 m3/d) was established to treat the community’s wastewater and blend it with natural spring and well water (up to 50 percent wastewater) prior to consumption.
The wastewater generated in the community is treated by a membrane bioreactor. After disinfection using chloramination, the filtered effluent is treated by reverse osmosis followed by advanced oxidation (ultraviolet radiation/hydrogen peroxide). The ultrafiltration and reverse osmosis units are located away from the membrane bioreactor at a lower elevation, allowing gravity feed to the reverse osmosis units. The plant effluent is subsequently blended with other source water from local springs and wells in a covered reservoir that provides a retention time of 40 to 60 days. The blended water is then treated by ultrafiltration followed by ultraviolet radiation and granular activated carbon prior to final disinfection. The reverse osmosis concentrate with a TDS concentration of approximately 2,000 mg/L is currently blended with membrane bioreactor filtrate and held in storage ponds for use in snow making, irrigation of the ski area, and dust control. The operations and maintenance cost for the production of this water was $2.40/kgal ($0.63/m3) during its first year of operation.
The community provided input through public meetings, and the state regulator has approved the project.
SOURCE: Livingston (2008).
2 percent of wastewater discharged and less than 0.3 percent of total water use in 1995 (Solley et al., 1998).5 In the 2004 EPA Guidelines for Water Reuse (EPA, 2004), total water reuse in the United States was estimated at 1,690 MGD (6.4 million m3/d), and they estimated that water reuse was growing at a rate of 15 percent per year.
As of 2002, EPA estimated that Florida reused the largest quantities of reclaimed water, followed by California, Texas, and Arizona. At that time, these four states accounted for the majority of the nation’s water reuse, although EPA reported that at least 27 states had water reclamation facilities as of 2004, with growing programs in Nevada, Colorado, Washington, Virginia, and Georgia (EPA, 2004). Three of the four states with the largest reclaimed water use are located in the arid southwest where population growth and climate variability have created recent water supply challenges. Water reuse in these states has become commonplace as a means to expand the water supply portfolio and provide an additional drought-resistant supply. Florida originally launched its water reuse program to address nutrient pollution concerns in its streams, lakes, and estuaries, but increasingly, new projects are being considered for their water supply benefits as well.
The end uses of reclaimed water are not well documented on a national scale. The WateReuse Foundation is working on a national database of reuse facilities that could help address this data gap, although as of early 2011, the database was still being refined. Some states have additional inventory data, described below, that reflect the varied uses of reclaimed water across different states.
Florida
The state of Florida conducts a comprehensive inventory of water reuse each year and reports that approximately 659 MGD (2.5 million m3/day) of wastewater was reused for beneficial purposes in 2010 (FDEP, 2011). Over half of Florida’s reclaimed water is used for public access irrigation, with additional uses in agricultural irrigation, groundwater recharge, and industrial applications (Figure 2-6). In Florida, groundwater recharge consists largely of rapid infiltration basins and absorption field systems that are not specifically designated as indirect potable reuse projects. In several Florida counties, nonpotable reuse accounts for 30–60 percent of the freshwater supplied for public water supply, industry, agriculture, and power generation (FDEP, 2006; Marella, 2009).
_____________
5 Solley et al. (1998) reported that in the United States, 155 × 106 m3/d of treated water were discharged in 1995, and total water use was approximately 1.5 × 10⁹ m3/d.
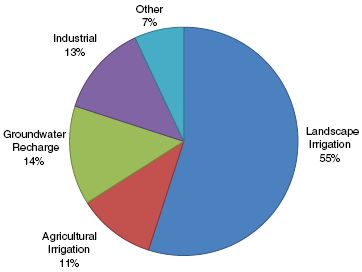
FIGURE 2-6 Water reuse in the state of Florida as of 2010, by flow volume and by application.
SOURCE: Data from FDEP (2011).
California
The California State Water Resources Control Board reported 646 MGD (2.44 million m3/day) of water reuse in California in 2009.6 California’s end uses, depicted in Figure 2-7, appear more diverse than Florida’s, including recreational impoundments and geothermal energy. In general, agricultural irrigation makes up a larger percentage of water reuse in California compared with Florida, while landscape irrigation and industrial reuse represent smaller portions of the overall portfolio. Both states have comparable extents of reuse in the area of groundwater recharge (including seawater intrusion barriers in California). Nevertheless, the California data include a large percentage (20 percent) of unclassified (“other”) reuse applications that may affect these comparisons.
Texas
A recent report for the Texas Water Development Board estimated 320 MGD (1.2 million m3/day) of water reuse in Texas in 2010 (Alan Plummer Associates, 2010). No additional details are provided on how this reclaimed water is used.
International Reuse
Crook et al. (2005) and Jiménez and Asano (2008) recently reviewed international reuse practices. According to their findings, major water reuse facilities are in place in at least 43 countries around the world, including Egypt, Spain, Syria, Israel, and Singapore. Based on the statistics given by Jiménez and Asano, approximately 13 BGD (50 million m3/d) of wastewater are reused worldwide. The authors identified 47 countries that engaged in reuse. Of these, 12 engaged in reuse of untreated municipal effluent, 7 engaged in the reuse of both treated and untreated effluent, and 34 reuse wastewater only after treatment. Of the total volume, 7.7 BGD (29 million m3/d) or 58 percent was untreated (raw) sewage used for irrigation, mostly in China and Mexico (see Figure 2-8).
Jiménez and Asano (2008) reported that 5.5 BGD (21 million m3/d) of treated municipal wastewater was reused globally in 43 countries. The United States was first among them in total volume of water reused (see Figure 2-9). Although the United States reused the largest volume of treated wastewater, per capita water
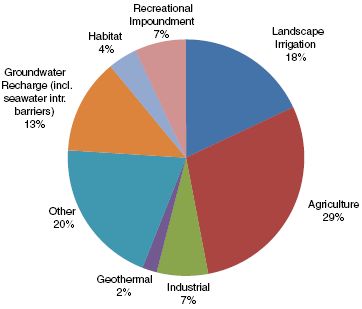
FIGURE 2-7 Water reuse in the state of California as of 2009, by flow volume and application.
SOURCE: Data from California Environmental Protection Agency http://www.waterboards.ca.gov/water_issues/programs/grants_loans/water_recycling/munirec.shtml.
_____________
6 See http://www.waterboards.ca.gov/water_issues/programs/grants_loans/water_recycling/munirec.shtml.
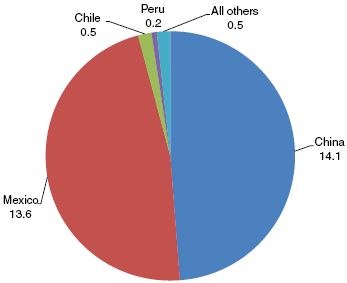
FIGURE 2-8 Countries with the most reuse of untreated wastewater in millions of cubic meters per day.
SOURCE: Data from Jiménez and Asano (2008).
reuse in the United States ranked 13th globally. In at least five countries—Kuwait, Israel, Qatar, Singapore, and Cyprus—water reuse represented more than 10 percent of the nation’s total water extraction (Jiménez and Asano, 2008).
Although statistics on international reuse practice provide insight into global trends, it should be recognized that local history, geography, and cultural influences have played an important role in the types of reuse practices pursued in different countries. To illustrate these differences, Israel, Australia, and Singapore are considered here—three leading practitioners of reuse where differences in climate, population density, water resources, and history have led to different outcomes with respect to water reuse. Reuse practices in other developed countries follow similar patterns. However, the acute need for water in these three countries has led them to embrace innovative water resource management approaches that are particularly relevant to the consideration of reuse in the United States.
Israel
Since the time of its founding in 1948, Israel has relied upon agricultural water reuse as part of its water supply portfolio. Initially, wastewater from urban areas was used directly for irrigation. In recognition of potential health risks associated with this practice, Israel’s
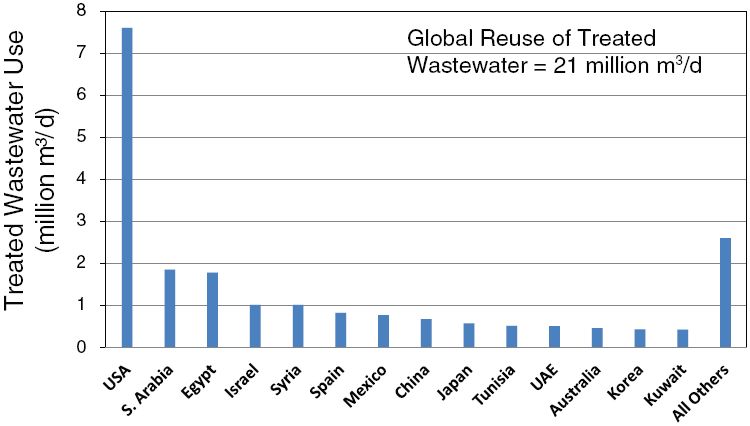
FIGURE 2-9 Countries with the greatest volume of water reuse using treated wastewater.
SOURCE: Data from Jiménez and Asano (2008).
nonpotable reuse practices were upgraded through the construction of wastewater treatment plants and groundwater recharge basins near agricultural areas. Today, approximately 75 percent of Israel’s wastewater is reused, with almost all of it going for agricultural irrigation. This outcome was likely affected by several factors. First, Israel’s arid climate and sparse water resources have made the public aware of the need to use water efficiently. Second, the relatively high population density and proximity of the country’s cities to its farms makes it efficient to reuse municipal wastewater for agricultural irrigation. Finally, Israel’s concerns about food security and uncertainty associated with its water resources have made agricultural reuse a national priority (Shaviv, 2009).
Australia
Like Israelis, Australians are highly aware of their nation’s limited water resources. However, Australia’s population density is much lower, and much of its agricultural activity occurs far from urban centers (e.g., most of the farming in the Murray-Darling Basin takes place hundreds of miles from coastal cities). As a result, agricultural reuse has not played a major role in the country’s water reuse planning process. In contrast, nonpotable reuse projects, such as landscape irrigation and industrial reuse, are quite popular, as epitomized by Sydney’s high-profile reuse project at the facility built as part of the Olympic Park for the games in 2000. Currently, approximately 10 percent of the water used in Australia’s mainland capital cities is reused, mainly for landscaping and industrial applications. Until recently, potable water reuse was not considered a viable option by most water managers in Australia, but the extreme drought that lasted from 2003 to 2009 coupled with high rates of urban population growth forced several of Australia’s biggest cities to reconsider (Radcliffe, 2010). At the height of the drought, Brisbane (C. Rodriguez et al., 2009), Canberra (Radcliffe, 2008), and Perth (C. Rodriguez et al., 2009) were all considering potable water reuse projects. A distinctive aspect of the planned water reuse projects in Brisbane and Canberra was blending of reclaimed water directly in drinking water reservoirs—a practice that deviated from the established soil aquifer treatment and groundwater injection projects that had been pioneered in the southwestern United States. After the drought ended, the projects in Brisbane and Canberra were put on hold.
Singapore
The high population density, near absence of agricultural water demand, and heavy reliance on water imported from a neighboring country has led to a different outcome for water reuse in Singapore. In particular, early recognition that the country’s population growth would soon outstrip its local water resources led Singapore to pursue an approach that they refer to as the “four taps”: (1) local runoff, (2) imported water from Malaysia, (3) desalinated seawater, and (4) reclaimed water. As a result of its frequent rain and high population density, there is little irrigation water demand for reclaimed water. Instead, the country’s water reuse program has focused on industrial and potable reuse. Given Singapore’s access to seawater for cooling purposes and its growing high-tech industry, the Public Utilities Board recognized the need for high-quality reclaimed water. The resulting advanced water treatment system (see Box 2-14) delivers reclaimed water to industrial users and local reservoirs. As was the case in Brisbane and Canberra, groundwater recharge or aquifer storage and recovery were not viable options because of Singapore’s local geology and geography.
CONCLUSIONS AND RECOMMENDATIONS
Water reuse is a common practice in the United States with numerous approaches available for reusing wastewater effluent to provide water for industry, agriculture, and potable supplies. However, there are considerable differences among the approaches employed for water reuse with respect to costs, public acceptance, and potential for meeting the nation’s future water needs.
Water reclamation for nonpotable applications is well established, with system designs and treatment technologies that are generally accepted by communities, practitioners, and regulatory authorities. Nonpotable reuse currently accounts for a small part of the nation’s total water use, but in a few communities (e.g., several Florida cities), nonpotable water reuse accounts for a substantial portion of total water use. New developments and growing communities provide op-
BOX 2-14
Singapore Public Utilities Board NEWater Project, Republic of Singapore
The Republic of Singapore has a population of about 5 million people. Although rainfall averages 98 inches (250 cm) per year, Singapore has limited natural water resources because of its small size of approximately 270 square miles (700 km2). Reclaimed water (referred to by the local utility as NEWater; see figure below) is an important element of Singapore’s water supply portfolio.
Currently, there are five NEWater treatment plants in operation, all of which include nearly identical treatment processes. Feedwater to the treatment plants is activated sludge secondary effluent. The advanced water treatment processes included microscreening (0.3-mm screens), microfiltration (0.2-mm nominal pore size) or ultrafiltration, reverse osmosis, and ultraviolet disinfection. Chlorine is added before and after microfiltration to control membrane biofouling. The reclaimed water is either supplied directly to industry for nonpotable uses or discharged to surface water reservoirs, where the water is blended with captured rainwater and imported raw water. The blended water is subsequently treated in a conventional water treatment plant of coagulation, flocculation, sand filters, ozonation, and disinfection prior to distribution as potable water.
The NEWater factories all produce high-quality product water with turbidity less than 0.5 nephelometric turbidity units; TDS less than 50 mg/L; and total organic carbon less than 0.5 mg/L. The water meets all Environmental Protection Agency and World Health Organization drinking water standards and guidelines. Additional constituents monitored include many organic compounds, pesticides, herbicides, endocrine-disrupting compounds, pharmaceuticals, and unregulated compounds. None of these constituents have been found in the treated water at health-significant levels.
The NEWater facilities at the Bedok and Kranji went into service in 2003 and have since been expanded to their current capacities of 18 MGD and 17 MGD (68,000 and 64,000 m3/d), respectively. A third NEWater factory at the Seletar Water Reclamation Plant was placed in service in 2004 and has a capacity of 5 MGD (19,000 m3/d). The fourth NEWwater factory (Ulu Pandan) has a capacity of 32 MGD (121,000 m3/d) and went into operation in 2007. A fifth facility, the Changi NEWater Factory, is being commissioned in two stages: the first 15 MGD (57,000 m3/d) phase was commissioned in 2009, with an additional 35 MGD (130,000 m3/d) phase to be commissioned in 2010. Once completed, these five plants will have a combined capacity of 122 MGD (462,000 m3/d).
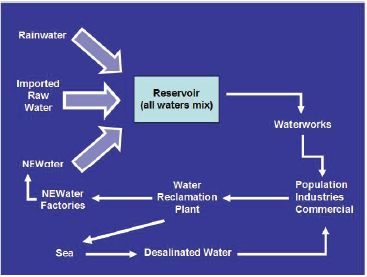
Schematic of the Singapore NEWater system.
SOURCE: Ong and Seah, 2003.
Most of the reclaimed water from the NEWater Factories is supplied directly to industries. These industries include wafer fabrication, electronics and power generation for process use, as well as commercial and institutional complexes for air-conditioning cooling purposes. Less than 10 MGD (38,000 m3/d) of NEWater currently is used for potable reuse via discharge to raw water reservoirs, accounting for slightly more than 2 percent of the total raw water supply in the reservoirs. However, the contribution of NEWater to the potable water supply is expected to increase in the coming decades.
The capital costs for all of the NEWater factories averaged about $6.03/kgal per year capacity (or $1.59/m3 per year). Annual operation and maintenance costs for the water are about $0.98/kgal ($0.26/m3) produced. The Public Utilities Board charges industries and others $2.68/kgal ($0.71/m3) for NEWater on a full cost recovery approach. This includes the capital cost, production cost, and transmission and distribution cost.
SOURCE: A. Conroy, Singapore Public Utilities Board, personal communication, 2010.
portunities to expand nonpotable water reuse because it is more cost-effective to install separate nonpotable water distribution systems at the same time the primary drinking water distribution system is installed. In existing communities nonpotable water reuse is often restricted by the high costs associated with constructing the distribution system and retrofitting existing plumbing (see also Chapter 9).
The use of reclaimed water to augment potable water supplies has significant potential for helping to meet the nation’s future needs, but potable water reuse projects only account for a relatively small fraction of the volume of water currently being reused. However, potable reuse becomes more significant to the nation’s current water supply portfolio if de facto or unplanned water reuse is included. The de facto reuse of wastewater effluent as a water supply is common in many of the nation’s water systems, with some drinking water treatment plants using waters from which a large fraction originated as wastewater effluent from upstream communities, especially under low-flow conditions.
An analysis of the extent of de facto potable water reuse should be conducted to quantify the number of people currently exposed to wastewater contaminants and their likely concentrations. Despite the growing importance of de facto reuse, a systematic analysis of the extent of effluent contributions to potable water supplies has not been made in the United States for over 30 years. Available tools and data sources maintained by federal agencies would enable this to be done with better precision, and such an analysis would help water resource planners and public health agencies understand the extent and importance of de facto water reuse. Furthermore, an analysis of de facto potable reuse may spur the additional development of contaminant prediction tools and improved site-specific monitoring programs for the betterment of public health. USGS and EPA have the necessary data and expertise to conduct this analysis on large watersheds that serve as water supplies for multiple states. For smaller watersheds or watersheds with existing monitoring networks, state and local agencies may have additional data to contribute to these analyses.
Environmental buffers can play an important role in improving water quality and ensuring public acceptance of potable water reuse projects, but the historical distinction between direct and indirect water reuse is not meaningful to the assessment of the quality of water delivered to consumers. Potable reuse projects built in the United States between 1960 and 2010 employed environmental buffers in response to concerns about public health risks and the possibility of adverse public reaction to potable water reuse. In the last few years, a potable reuse project was built and another is being built without environmental buffers, and the trend toward operating potable reuse projects without buffers is likely to continue in the future. An environmental buffer should be considered as one of several design features that can be used to ensure safe and reliable operation of potable reuse systems. As a result, they need to be designed, evaluated, and monitored like other elements of the water treatment and delivery system. See Chapters 4 and 5 for additional details on the treatment effectiveness of environmental buffers and their role in quality assurance.


