
Chapter 3
Review of Environmental Workgroup Reports
The District divided its analysis of potential ecological effects of surface water withdrawals among seven workgroups, each of which addressed a major ecosystem component: wetlands (emphasizing vegetation), biogeochemistry, plankton, littoral zone—submerged aquatic vegetation (or SAV), benthic macroinvertebrates, fish, and wetland wildlife. The last workgroup originally was part of the wetlands workgroup but became a separate group when the analysis of potential effects on wildlife began in earnest in late 2010. The analyses conducted by all these workgroups were heavily dependent on the output from the hydrology and hydrodynamics (H&H) workgroup. Each workgroup produced reports over the last two years describing their approach, results, and conclusions related to their area of interest. The Committee based its review on the most recent of these reports (produced during the summer of 2011), as well as on presentations given to the Committee during its meetings. Although each workgroup used different sampling and analytical methods appropriate for their ecosystem component, the District established a common framework for the workgroups to facilitate synthesis of results across workgroups into an integrated assessment. This chapter discusses the products of each workgroup separately in the order listed above, but to facilitate an understanding of the design elements of the overall study that were common among the workgroups, it first describes these elements.
Because a wide variety of environmental conditions occur across the St. Johns River basin, the District divided the river into nine segments (Figure 3-1), within which conditions are relatively uniform conditions. Such factors as geomorphology, soils, hydrology, wetland types, and water chemistry were used to delineate the segments. Workgroups focused their activities in segments they considered relevant for their ecosystem component, and thus not all studies were conducted in every segment. Information on the basis for selection of segments for analysis is given in the sections on the individual workgroups.
The workgroups conducted their analyses using a common set of water withdrawal scenarios (see Chapter 2 for details). A long-term record of water flows and levels at various locations along the river for each withdrawal scenario was derived by the H&H workgroup, as described in Chapter 2, and each of the ecological workgroups used information relevant to their segments from this common hydrologic database. As noted earlier, some activities within the drainage basin, such as the Upper Basin projects, produced model output with water flows and levels greater than those in the baseline case. The workgroups prioritized withdrawal scenarios by deviation from base conditions, and the scenario with the largest deviations generally was
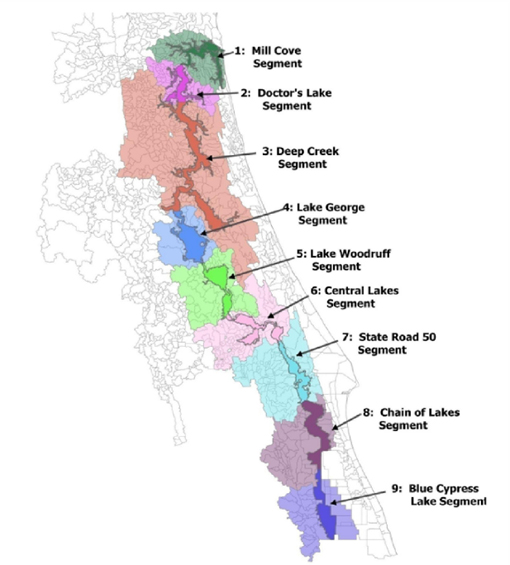
FIGURE 3-1 The St. Johns River was divided into nine segments for the purposes of the ecological analyses.
SOURCE: Kinser et al. (2011).
analyzed first. Analyses of other scenarios were continued down to the scenario(s) with minor to negligible effects.
To help focus the studies on potential withdrawal effects, each workgroup, following a recommendation from this Committee, developed a conceptual model during Phase 2 of the WSIS. Most of these models were modified by the workgroups as their studies proceeded and they gained information about their system components. The conceptual models—basically box and arrow diagrams—were intended to show plausible cause-effect relationships between key environmental drivers and changes in some ecosystem attribute relevant to the ecosystem component of interest (e.g., phytoplankton, benthos, fish). In turn, the models also showed how
changes in an ecosystem attribute might be a driver for change in attributes of other ecosystem components, and development of an understanding of the linkages among the workgroups was an important reason for constructing the conceptual models. Where possible, each workgroup included what the District called a “hydroecological model” in the conceptual model. The former model was an equation (or set of equations) that the workgroup used to quantify the effects of changes in the driver variables on the ecosystem attribute. In most cases, the hydroecological model was an empirically derived relationship. In some cases, the workgroup was unable to find or develop a quantitative model, and a more qualitative or subjective approach was used to assess the effects. Examples of the District’s conceptual and hydroecological models are included in discussions of the workgroup reports in subsequent sections of this chapter, and Figure 3-2 is a flow diagram that illustrates the general approach the District used in conducting its analyses.
The workgroups were given a mandate to characterize potential environmental effects of water withdrawals using three criteria: persistence, strength, and diversity. Persistence was defined in terms of recovery time relative to the return interval for conditions causing a given effect; strength was defined in terms of both the intensity and scale (geographic area affected); and diversity was defined in terms of the range of environmental attributes showing effects. In some cases quantitative numeric values were used to define these criteria, but in most cases the delineation was ordinal or categorical. Based on the three criteria, the District developed five categories of effects ranging from negligible to extreme: (1) Negligible—no appreciable change in any ecosystem component; (2) Minor—ephemeral and weak; no significant change in any ecosystem component; (3) Moderate—ephemeral and weak; no significant change in natural resource values; (4) Major—persistent and strong, but not diverse; significant change in natural resource values; and (5) Extreme—persistent, strong, and diverse; significant change in natural
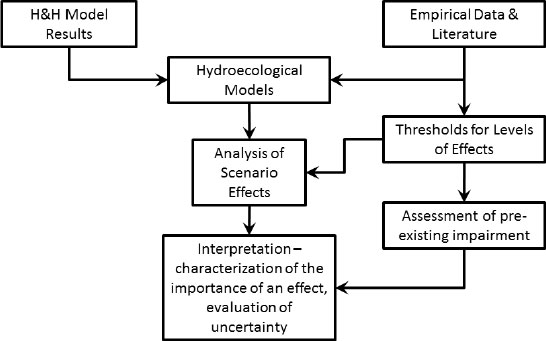
FIGURE 3-2 General flow pattern for the WSIS analysis.
SOURCE: Lowe (2011).
resource values. These categories were defined in an effort to obtain consistency among the workgroups in their assessments of effects, but the non-quantitative, categorical nature of the criteria inevitably led to some subjectivity and differences in interpretation among the groups.
The managers of the WSIS also provided guidelines to the workgroups in an effort to obtain consistency relative to the assessment of uncertainty in the analyses. Five levels of uncertainty, ranging from very low to very high (Table 3-1) were defined with reference to three criteria: availability of a predictive model, supporting evidence, and understanding of the mechanism for an effect.
Subsequent sections of this chapter describing the individual workgroup reports generally follow a common outline. The conceptual model developed by the workgroup is presented first, along with any hypotheses or key questions that drove their analyses. The geographic context of the workgroup’s effort (i.e., the river segments they studied) is described next, along with the basis for the workgroup’s decisions to focus on those segments. The methods used by the workgroup are described next. Included in this discussion is a summary of the types of data/information the workgroup used, the extent to which they relied on H&H data, field sampling and experimental data (where relevant), analytical protocols to extract information from the data, and a description of how the workgroup assessed uncertainty. Results obtained by the workgroup and their conclusions with regard to the effects of water withdrawal on ecosystem attributes relevant to their area of interest are summarized, along with a discussion of the levels of uncertainty in their results and conclusions. The sections next provide a critical analysis of the work, including the correctness of the approach, critical data gaps, uncertainties in the conclusions, and the extent to which the workgroup responded to previous recommendations of this Committee. Finally, where appropriate, the sections include a brief discussion of recommendations for use of adaptive management concepts and follow-up assessment programs.
TABLE 3-1 Categories of uncertainty used in the WSIS and criteria on which they were based.
| Uncertainty | Criteria |
| Very low | Very strong quantitative evidence—strong predictive model (PM), strong supporting evidence (SE), good understanding of mechanism (UM) |
| Low | Strong quantitative evidence—strong PM and either SE or UM |
| Medium | Moderate quantitative evidence or strong qualitative evidence—PM or both SE and UM |
| High | Weak quantitative evidence or moderate qualitative evidence—no PM but either SE or UM |
| Very high | Weak qualitative evidence—no PM. weak SE and UM—weak in all three areas |
The wetlands workgroup was tasked with assessing the potential effects of surface water withdrawals on floodplain wetlands, specifically changes to vegetation communities that might result from altered hydrology and/or changing salinity regimes. To accomplish this they used a multistep process that included:
1. Developing a screening-level assessment to identify river segments that have the highest likelihood of change and that became the focus of subsequent analyses;
2. Completing an assessment of existing MFL transect data on the distribution of wetland plant community types across the elevational/hydrological gradient of the floodplain, from river to upland, and determining how those might change;
3. Acquiring LiDAR data for areas of the watershed, where available (portions of river segments 5, 6, 7 and 8), and compiling a digital elevation model (DEM); and
4. Conducting a GIS analysis to predict hydroperiod changes in wetlands on the floodplain of river segment 8, where impacts to river stage were predicted to be greatest, and salinity changes in segment 2, where changes in the salinity regime were predicted to be highest.
The goals were to determine whether water withdrawals have the potential to (1) alter the species composition of floodplain wetland communities, (2) alter the extent of wetlands or various wetland communities found there, and/or (3) lead to a shift in the location of boundaries between wetland types.
Conceptual Model
A conceptual model illustrating the effects of water withdrawals on wetland plant communities was developed to investigate possible responses to alterations in wetland hydroperiod and salinity (Figure 3-3). Decreases in water levels were predicted to lead to a decline both in the duration of inundation of some wetlands (expressed by stage exceedence curves, or stage-frequency relationships) and an increase in salinity in wetlands in the lower stretches of the river that could lead to a shift in wetland plant community composition or changing boundaries between freshwater and salt-tolerant wetland community types. Ecological response models in the conceptual model indicate potential relationships between these variables, and predicted changes in community boundaries and wetland extent are illustrated using a GISbased “Hydroperiod Tool” to model changes in floodplain inundation. Inputs to the conceptual model include results of the H&H modeling, as well as information on soil characteristics from the biogeochemistry workgroup, which was supposed to provide empirical data on soil accretion rates on the floodplains. Changes in soil surface elevation have the potential to exacerbate or ameliorate the effects of predicted changes in river stage. Outputs of the wetlands workgroup were provided to the benthos, fish, littoral zone, plankton, and wetlands wildlife workgroups to aid in their analyses.
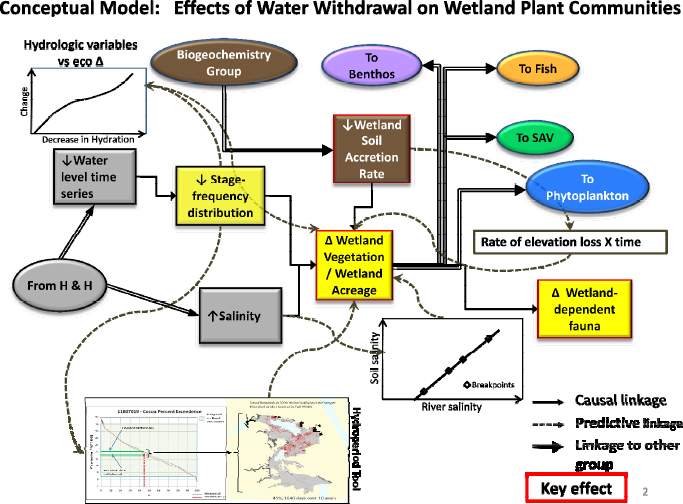
FIGURE 3-3 Conceptual model of the wetlands workgroup.
SOURCE: Kinser et al. (2011).
The wetlands workgroup generated four hypotheses from the conceptual model and identified specific hydrological criteria to test each:
• H1: Changes in inundation depth and duration, relative to baseline, will lead to changes in the extent of wetlands in the landscape. (This hypothesis would be accepted if the average annual hydroperiod moves outside a range of 10 to 90 percent exceedence.)
• H2: Changes in inundation depth and duration, relative to baseline, will change the extent of wetland community types in the landscape. This would be accepted if average depth and hydroperiod changes sufficiently to alter the relative areas of the hydrologic zones associated with each community types, resulting in a shift in proportionality.
• H3: Changes in the seasonal pattern of water depths will affect the structure of the wetland communities. This would be accepted if hydrologic seasonality is altered sufficiently to change community characteristics such as species composition, reproduction, recruitment, or mortality.
• H4: Changes in salinity levels will alter the extent of freshwater wetlands. This would be accepted if the salinity level and duration exceeds freshwater species tolerances (established, for example, through literature searches) causing community boundaries to shift.
These hypotheses were tested over limited geographical areas. Hypotheses 1-3 were tested in segments 7 and 8 and hypothesis 4 in segment 2.
Methods
Assessing the potential effects of modeled changes in river levels on floodplain wetlands was done in two stages. In the first step a screening-level assessment of the nine segments delineated along the St. Johns River (Figure 3-1) was conducted to identify the segments most likely to experience altered hydrology, thus warranting a detailed analysis of the effects of withdrawals. River segments with a low potential for change due water withdrawals were eliminated from subsequent, more detailed analyses. The screening was based on the results of the hydrologic models under various water withdrawal scenarios provided by the H&H workgroup.
The second step used a combination of stage exceedence curves to relate the distribution of plant communities along the elevational gradient of the floodplain and a GIS-based analysis to display the spatial extent of wetlands in the targeted river reaches and how wetland community composition, wetland area, and boundaries between wetland community types might be affected by water withdrawals. This analysis was done using a combination of a DEM based on LiDAR data, generation of exceedence curves using elevation and plant community information from MFL transects, and a “Hydroperiod Tool.” The latter tool performed GIS-based analysis that provided estimates of daily water depth over an area by subtracting the ground surface elevation (DEM) from interpolated water surface elevations based on river stage. The latter feature allowed the output from the H&H workgroup to be distributed over the floodplain and enabled determination of changes in the spatial extent of wetlands (total area and area of each community type).
An early issue identified by the wetlands workgroup was the need for a high resolution DEM for use in the spatial analysis of wetland inundation. The coarse resolution of USGS contour data (5-ft intervals) was not adequate for the workgroup’s needs, and so available LiDAR data were used to derive a DEM with a contour accuracy of between 10 and 11.7 cm. Interference of the LiDAR readings by dense wetland vegetation made a correction for ground elevation necessary. This was accomplished using data from the four MFL transects in segment 8, which include detailed data on ground elevation, as well as the location of wetland plant communities along the topographical/hydrological gradient.
The potential change in community boundaries in segments 7 and 8 was calculated using a combination of historical surface water elevations (see below), the change in those elevations caused by withdrawals (indicating dewatered areas), and a response function based on data gleaned from literature (both primary sources and grey literature) that described vegetation responses qualitatively. As part of this analysis, stage exceedence curves of the change in mean daily water level were used to estimate whether wetland communities would shift downslope and reestablish at lower elevations where hydrological exceedences match a previous elevation. The distribution of communities along the elevation gradient of the floodplain (from river edge to upland edge) thus was used to determine the minimum elevation for each community type, and the lower boundary of each community then was moved downslope to the new, ecologically appropriate elevation.
Historical records on surface water elevation were gathered from 11 stations along the river for a 10-year period of record. Depth-to-groundwater data were obtained from groundwater wells on the MFL transects. These data were used to calculate stage exceedence curves along floodplain elevations.
A second driver of potential changes to wetlands from water withdrawals is changes in salinity. This was evaluated by considering the upstream movement of isohalines in the lower St. Johns in river segment 2. The Ortega River, a tributary to the St. Johns River, was used as a model system. The Ortega River has an extended gradient of wetland communities spanning a broad range of salinities. Vegetation ranges from freshwater hardwood swamps in the headwaters to brackish marshes of Spartina bakeri near the confluence of the Ortega and the St. Johns. Vegetation was sampled along the river corridor using nested plots to document species composition. Measurements of soil conductivity and salinity, pore water salinity, and pH also were made. Breakpoints were established between plant community types and regressed against salinity data to quantify the relationship between the two. This relationship was transferred to the St. Johns River so that the potential changes in plant communities could be predicted.
Results
The screening level assessment identified river segments most at risk for impacts based on changes in average annual water levels and salinity using the Full1995NN scenario, which shows maximum change from the base condition (Base1995NN). The highest likelihood of stage effects was found for segments 7 and 8—average decreases in river levels of 4 and 5 cm, respectively. Segment 2 showed the highest likelihood for salinity effects—a 0.12 PSU change in salinity. The reaches of segment 8 deemed to be the most vulnerable to change, and for which LiDAR data was available, were the focus of analysis for impacts resulting from water level changes.
Floodplain hydrology is complex, and water movement depends on whether water levels are above or below ground. William Wise (University of Florida) contributed background information to the workgroup, documenting that floodplain soils in segment 8 typically are very poorly drained with low hydraulic conductivities, resulting in slow lateral flow of soil water and long residence times in this dimension. The movement of water in the soil (when soils are not inundated) tends to be dominated by vertical flows due to the downward movement of precipitation and upward movement of evapotranspiration. In general, during low-flow periods when the river is below its banks, the low hydraulic conductivity of the soils means that the time needed for the water table in the floodplain to equilibrate with the river level is long. Under these conditions river flows have a relatively minor effect on wetland hydrology. During periods of overbank flooding, however, the ponded depth of wetlands on the floodplain is the same as the river stage.
Graphical analysis of river stage versus water level in the wetlands showed this pattern; levels tend to be decoupled at low flows (when the water table is below ground) and converge when water levels are above ground (during times of overbank flooding). This pattern held true for most of the seven wells that the workgroup analyzed, but there were periods when groundwater levels tracked river levels even at low stage, suggesting a weak link between river stage and groundwater stage (e.g., Mulberry Mound well 1; Figure 66, middle left panel p. 71, Kinser et al., 2011). Generally, however, the workgroup concluded that changes in surface
water-levels in the wetlands are likely to be the primary driver of ecological change and focused their analysis on changes in hydroperiod.
The wetlands workgroup analyzed each withdrawal scenario in turn, starting with the most pronounced decrease in water levels and consequent ecological effects under the Full1995NN scenario. Water withdrawals were found to lead to the dewatering of portions of the floodplain and subsequent movement of wetland boundaries along the hydrological gradient from riverbank to upland. Shallow marshes were found to be one of the most affected community types, and under this modeled “worst case” scenario, the total length of shallow marsh on the County Line MFL transect in segment 8, for example, decreased by up to 69.4 percent, while the extent of wet prairies increased by 76 percent (see Table 3-2). Within segment 8, the workgroup estimated that 27.5 percent of the total wetland area would be dewatered; even under the Full1995PN scenario (i.e., with the upper basin projects completed), 20.6 percent of total wetland area would be dewatered. Thus, substantial changes to wetlands in this segment are expected. (The subsequent analysis for segment 7 found smaller effects than for segment 8).
For segment 2, correlations between (1) river water salinity and soil salinity and (2) soil salinity and vegetation communities were used to determine breakpoints in salinity tolerance between community types. Based on modeled changes in river salinity, plant community boundaries were predicted to shift upstream by about 1 km on the Ortega River. For the modeled changes in salinity in the St. Johns River, this translates to a projected shift of saline and freshwater community types of between ~55 and ~63 km under the Full1995NN scenario.
The above findings are reflected in the decision matrix for levels of effect that the wetlands workgroup constructed (see Table 3-3). The environmental effects of withdrawals were evaluated qualitatively based on three factors: strength [three levels related to intensity, as well as spatial extent: low (1-25%), medium (25-75%) and high (> 75%)]; persistence [how much recovery occurs between perturbations (full, partial, little, or none)]; and diversity (percentage of species within a community and/or number of community types significantly affected, rated low, medium and high using the same breakpoints as above). This approach is a variation on the intensity-frequency-duration variables used to characterize ecological disturbance. Each of the 27 possible combinations of effects was rated on a continuum ranging from negligible to extreme. The largest effects were found for the Full1995NN scenario in segment 8, which received ratings of 2, 3, 3, representing a “major” level of effects. Based on the lack of water level changes described in the H&H report, the workgroup concluded that segments 1-4 would have negligible effects.
TABLE 3-2 Community Statistics for County Line Transect. Change between Historical and Full1995NN Scenarios.
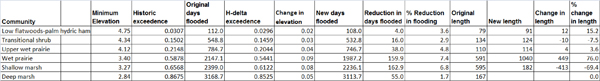
SOURCE: Kinser et al., 2011.
TABLE 3-3 Summary of Withdrawal Effects on Wetlands Metrics for the Full1995NN Scenario.
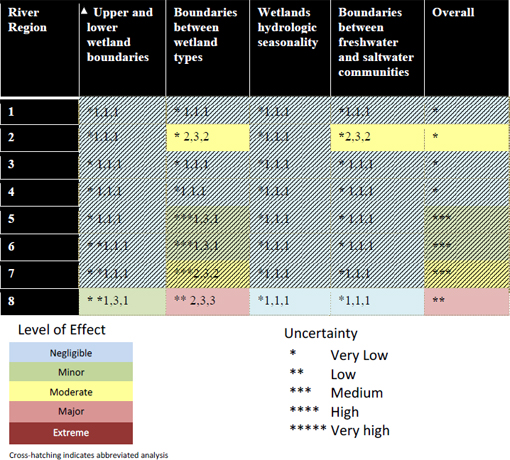
SOURCE: Table 40 from Kinser et al. (2011).
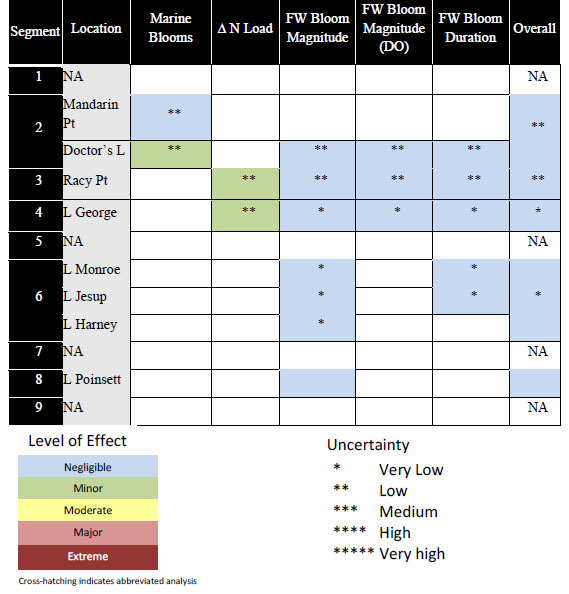
The uncertainty associated with the workgroup’s predictions was assessed using best professional judgment in two different ways. Ratings for the response variables that were directly assessed in segments 2 and 8 were based solely on ecological effects; i.e., the workgroup did not combine its ratings with the uncertainty associated with modeled output of the withdrawal scenarios from the H&H workgroup. Conversely, an abbreviated uncertainty analysis, based only on results of the H&H workgroup or arrived at deductively, was done for response variables in river segments where little to no change in river hydrology was predicted. In this case, a rating of “very low” uncertainty was assigned for the response variables in each segment (1 asterisk). In total, a direct assessment of effects was made for two response variables in segment 2 and for all four response variables in segment 8. With regard to the “overall effect
column,” the level of effect and uncertainty ratings were assigned using the most extreme rating of any of the response variable ratings.
As in the other workgroups, uncertainty was based on the strength of the predictive model, the strength of supporting evidence (e.g., literature and corroborating data), and the level of understanding of the underlying mechanisms of change. Each variable could take one of three states (low, medium, high), and the resulting uncertainties ranged from very low to very high. The wetlands workgroup had the benefit of a sound understanding of the biological mechanisms that lead to change and a rich data set for analysis and modeling in segment 8. Uncertainty was reported as low in segments of the river where the H&H workgroup predict little hydrological change, and a somewhat higher (moderate) where hydrological changes were predicted to be sufficient to create an ecological response.
Critique
The wetlands workgroup produced a solid analysis of potential impacts of water withdrawals to the St. Johns River. Their integration of a LiDAR-based DEM with floodplain stage exceedence curves to assess the spatial extent of hydrological impacts is a novel approach, and the workgroup is commended for the effort required to pull all these pieces together into an integrated whole. The salinity analysis strategically made use of the Ortega River tributary as a model system from which results could be translated to the larger St. Johns River. The Committee is confident that the methods developed here will be adaptable to other river segments and will be useful to analyze potential changes in river flow in the future.
One limitation of the workgroup’s results is the limited area to which their analyses were applied. Only segment 8 (with an average 5-cm decrease in level) was initially included in the full analysis, although segment 7 later was analyzed following a recommendation from this Committee. LiDAR data also are available for portions of segments 5 and 6, and it would be straightforward to expand the analysis to these segments (where an average 4-cm decrease in levels is predicted).
The assignment of uncertainty to the workgroup’s results is not clearly presented in the tables denoting level of effects. Some uncertainty assignments were made using the ecological analysis of the wetlands workgroup, but most effects were given the lowest uncertainty rating based on results of the H&H modeling. If this dual approach is to be used, it should be spelled out more clearly in the legend of the table.
***
The work of the wetlands workgroup evolved substantially over the course of the study, and their final report represents a rigorous scientific study of floodplain wetlands along the St. Johns. The integration of field data on the distribution and composition of plant communities, measurements of floodplain topography, remote sensing data (LiDAR) and application of the Hydroperiod Tool was computationally challenging, but the result is a robust picture of the spatial extent of dewatering and shifting boundaries between wetland types. The work is limited by the geographical extent of the analysis, however. Acquisition and processing of LiDAR data for segments 5 and 6 would enable the analysis to be expanded and would allow the District to
determine how predicted impacts might differ under the different river conditions found in those segments. This could be an important step for future assessments of how hydrological changes to the river that might result from such drivers as stormwater runoff (as impervious surfaces increase) will affect downstream areas. A full understanding of how wetland responses in different river segments vary would allow sound management decisions as the St. Johns River watershed continues to develop.
In phase I of the WSIS, the biogeochemistry workgroup identified seven potential effects of water withdrawals on biogeochemical processes in the St. Johns River and its drainage basin. All seven effects were related to the possibility that soil accretion would be reduced or oxidation of organic soils (histosols) would be enhanced in riparian wetlands of the river as a consequence of changes in stage induced by water withdrawals. The floodplain’s swampy herbaceous wetlands have organic soils, and withdrawals could increase the number of days that these soils are exposed to air. Exposure promotes oxidation of organic matter and release of materials that could be exported to the river when the soils are inundated again. The workgroup concluded that three effects of water withdrawal had potentially high significance: (1) reduced nutrient sequestration, (2) increased release of dissolved organic matter (measured as carbon, i.e., DOC), and (3) increased production and reduced sequestration of greenhouse gases (carbon dioxide, methane, nitrous oxide) by the organic soils. The workgroup decided to focus on the first two issues because they had the greatest potential for effects on the river.
Conceptual Model
The workgroup developed a conceptual model for the effects of water withdrawals on the above biogeochemical processes, as well as their effects on other ecological processes and conditions, during Phase II of the WSIS (see Figure 3-4). The model portrays the linkages between increased water withdrawals and changes in water levels and wetland soil inundation, leading to changes in oxidation of soil organic matter (SOM), release of nutrients and DOC, and consequent changes in other conditions, such as changes in nutrient loadings and decreases in dissolved oxygen (DO) concentrations. The decreases in DO were hypothesized to be caused by microbial and/or photooxidation of DOC released from SOM during its exposure to the atmosphere. The model shows how processes of interest to the biogeochemical workgroup are linked to both hydrologic forcing functions and to ecological changes in the domains of other workgroups (e.g., plankton, benthos, fisheries). The initial model was modified to reflect improved understanding of process relationships as Phase II work continued, and the Committee views the current format of the conceptual model as reasonable and appropriate.
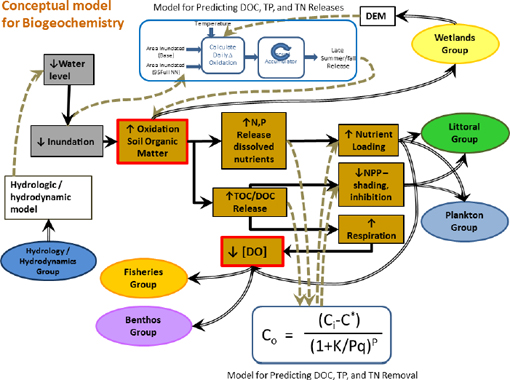
FIGURE 3-4 Conceptual model for the biogeochemistry workgroup.
SOURCE: Keenan et al. (2011).
Based on the conceptual model, the biogeochemistry workgroup posed four general questions that it attempted to answer in its Phase II studies: (1) what are the constituents of interest (relative to enhanced soil oxidation) and where in the system do these constituents occur; (2) how much additional release of the constituents of interest would occur from SOM as a result of water withdrawals; (3) how much of the additional material gets exported from the wetlands to lakes; and (4) what are the effects on downstream lake ecosystems? An implicit assumption in the last two questions is that the constituents of interest (nutrients and DOC) do not have important effects on the channelized river itself but may affect off-channel or in-channel lakes because the longer water residence times of the lakes allow the effects of the released substances on plankton and other ecosystem components to be expressed. Although the questions are broad and lacking in detail, the Committee considers them to be a reasonable step in developing a work plan to address the two issues the biogeochemistry workgroup considered potentially important.
Methods
Addressing the above four questions requires several types of information. The first part of question 1 (nature of the constituents of interest) was answered in the Phase I studies. The answer to the second part of the question (locations where potential effects would occur) relied on water level (stage-duration) results from the H&H workgroup, in combination with detailed land elevation data produced in Phase II for the wetlands workgroup.
At the outset of the WSIS Phase II studies, the biogeochemistry workgroup developed a sampling program to collect soil samples and cores from 86 wetland sites in various segments along the St. Johns River, as well as a series of field and laboratory studies using soil cores at microcosm to mesocosm scales to measure nutrient and DOC release rates from dried (and reinundated) organic soils. Unfortunately, most of these studies did not yield usable information. The study involving field cores was unsuccessful because a winter rain event flooded the wetland shortly after the study began. Similarly, microcosm- and mesocosm-scale experiments undertaken in 2010 yielded no useful data because drought conditions in the rainy season resulted in no re-flooding of the wetland soils. Some data were obtained from laboratory studies on soil cores that had been dewatered and re-flooded, but several problems were found with the data, minimizing the amount that could be used estimate nutrient and DOC release rates from exposed (dried) organic soils. For example, cores aged in the laboratory showed different responses than fresh cores from the field, and these deviations increased with time. In addition, because of biofilm growth in laboratory cores, only the first four days of data were considered reliable. The net effect of all these problems was a paucity of data on which to make estimates of nutrient and DOC release rates from exposed and re-flooded organic soils.
An initial assumption of the biogeochemistry workgroup regarding question 3 was that all nutrients and DOC released when exposed and dried organic soils were re-flooded would be exported to the river (or downstream lakes). At the suggestion of the Committee, the workgroup modified this assumption by incorporating a semi-empirical “cells in series” model based on chemical reactor theory to allow for losses of nutrients and DOC when water is transported from re-flooded soils to the river channel or lake edge:
![]()
where Co = outlet concentration; Ci = inlet concentration; C* = background concentration (which the workgroup assumed was zero to simplify their calculations); K = removal rate coefficient (m d–1); q = areal hydraulic loading (volumetric flow rate (m3 d–1) divided by the surface area (m2), or m d–1); and P = number of tanks in series. K includes removal by a variety of processes, including chemical breakdown, microbial processes, volatilization, sorption, and settling. The model thus has three parameters that must be fitted or estimated: K, q, and P. Initially, the workgroup used median values of K for TKN,1 TP, and BOD2 (9.8, 6, and 37.4 m d–1, respectively) from a recent literature review by Kadlec and Wallace (2008) on 123 studies of nutrient export from natural and constructed treatment wetlands across the United States, but in
________________________
1 TKN (Total Kjeldahl Nitrogen) is the sum of the total organic nitrogen plus ammonium in a sample and was used as a surrogate for total nitrogen in the study.
2 BOD (biochemical oxygen demand) is an estimate of the biodegradable organic matter in a sample, expressed in terms of the amount of oxygen (O2) required for its oxidation.
the final report the workgroup used the median, first, and third quartile values of K reported by Kadlec and Wallace for a treatment wetland formerly called Ironbridge, now known as the Orlando Easterly Wetlands, east of Orlando and within the St. Johns River basin. The workgroup used BOD as a surrogate for dissolved organic carbon (DOC) because of the lack of information on K for DOC in the literature on treatment wetlands. A value of P = 3 was assumed for TN and TP and P = 1 for BOD based on recommendations in Kadlec and Wallace (2008). Values of q were estimated from flow and morphometry information for the sites to which the model was applied.
To evaluate the effects of nutrients and DOC released from exposed wetlands on downstream lakes, the workgroup first calculated water budgets and mass balances for various constituents for Lake Poinsett and Lake Winder (which is upstream of Lake Poinsett in segment 8 but below the Lake Washington weir). Measured water quality data and flow data (from the H&H workgroup) for the Base1995NN condition and the Full1995NN scenario were used to perform calculations for the period 1996-2008. The monthly results for the time period June-October were used because that is when most hypoxic events occur in the lakes and also the period when exposed wetland soils would become re-inundated by summer rains. Based on the budget information, the workgroup also calculated flow-weighted concentrations of DOC, and nitrogen and phosphorus species in the inflows and outflows of the two lakes.
Finally, the workgroup used a simple calculation model to estimate the additional loading of nutrients (TKN and TP) and DOC that would be produced from oxidation of additional areas of exposed soils caused by water withdrawals from the St. Johns River. In the case of DOC, they estimated how the change in loading would translate to a change in dissolved organic carbon (DOC) concentration in the receiving water body (lake), and in oral presentations to the Committee (February and May 2011), they used a scatter plot of existing data on dissolved oxygen (DO) concentration versus TOC concentration (TOC = total organic carbon, sum of the particulate and dissolved forms of organic carbon) in Lake Poinsett to predict how a change in DOC concentration would affect the DO concentration in the lake. (Most of the TOC in colored lakes like Poinsett and Winder is DOC, and so the DO-TOC relationship should approximate the DO-DOC relationship.) The scatter plot showed that DO concentrations tended to decrease as TOC concentrations increased, but the data were highly scattered, and the correlation between the two variables was low (r2 = 0.2), indicating that TOC/DOC have only limited capability to predict DO levels. This method of analysis was changed in the written report to an equation obtained by multiple regression analysis of DO (as the dependent variable) on water elevation, TP and TOC concentrations as independent variables. This equation has an r2 of 0.415 (still rather low predictive ability).
Results
Based on a screening assessment that took into account river and wetland hydrology and the abundance of wetlands in the nine segments of the St. Johns River (Figure 3-1), the workgroup concluded that water withdrawals from the St. Johns River would have the greatest potential for biogeochemical impacts on the portion of segment 8 downstream of the Lake Washington weir. Impacts were defined in terms of increased concentrations of TN, TP, and DOC resulting from additional exposure of wetland soils and subsequent release of nutrients and DOC as a result of aerobic oxidation. Segments 7, 6, and 5 were considered to have increasingly
less potential for impacts. Segments 1-4 were considered not to be susceptible to impacts because water levels in those segments are controlled by sea level, and segment 9 and the portion of segment 8 above the Lake Washington weir also were considered not susceptible to impacts because all proposed withdrawal points are downstream of the weir, which isolates upstream segments from downstream water level changes. The workgroup also concluded that forested wetlands were not likely to be affected by water withdrawals because an analysis by the wetlands workgroup indicated that these wetlands occur primarily along tributaries or seeps and are not likely to be affected by water levels in the main channel of the river. Herbaceous wetlands (marshes) thus were assumed to be the only wetlands of importance in the analysis of biogeochemical impacts.
Table 3-4 summarizes the information that the workgroup used to make its conclusions about the relative importance of potential biogeochemical impacts on segments 5-8. Segment 7 has the largest area of herbaceous wetlands, but segment 8 downstream of the Lake Washington weir is a close second. In the context of the screening assessment, wetland area was considered to be a potential source for nutrient and DOC loading. The product of this area and the magnitude of average decrease in river stage from the 1995 baseline conditions to withdrawal scenario Full1995NN (the scenario with the greatest average decrease in river stage) was considered to represent the potential for wetland soil exposure and oxidation. Average stage declines for this scenario were greatest in segment 8 and decreased in each successive segment. In contrast, the magnitude of river flow was considered to be a means of diluting such loadings. Because each downstream segment has higher flow than the preceding upstream segment, the potential for dilution of nutrient and DOC loading increased for each downstream segment. The net effect was that segment 8, with the largest source term and smallest dilution term, was considered the most vulnerable segment for withdrawal effects on biogeochemical processes.
Results of soil chemical analyses from the synoptic sampling program show wide ranges in concentrations for many constituents, which is common for soil samples. For example, for all 86 samples collected over the length of the river, total carbon ranged from 14 to 456 g kg–1 (mean = 240; interquartile range (IR) = 118-356), and total nitrogen ranged from 0.9 to 36.7 g kg–1 (mean = 15.6; IR = 8.9-23.4). Similarly, for 12 soil samples collected in wetlands around Lake Poinsett, total carbon ranged from 120 to 450 g kg–1 (mean = 275; IR = 148-379), and total nitrogen ranged from 9.0 to 36.7 g kg–1 (mean = 21.0; interquartile range = 12.5-29.4). Although the Lake Poinsett samples showed less variability than the entire set, both carbon and nitrogen ranged over a factor of about four at this site.
Results for the field and laboratory release rate studies for nutrients and DOC from airexposed soils from the segment 8 wetlands near Lake Poinsett were presented in graphical and tabular formats. As mentioned earlier, the field experiments did not produce useful results because of unfavorable weather conditions. Some laboratory studies produced results that were
TABLE 3-4 Data Used by Biogeochemistry Workgroup for Screening Assessment
| Segment | Area of herbaceous wetlands (ha) | Average Flow (m3 s-1) | Area/Flow ratio (ha s m-3) | A/F normalized to Lake Poinsett | Average stage change for Full1995NN (m) |
|---|---|---|---|---|---|
| 8 | 15,764 | 40 | 528 | 1.00 | 0.05 |
| 7 | 17,287 | 56 | 382 | 0.72 | 0.04 |
| 6 | 6,816 | 73 | 114 | 0.22 | 0.029 |
| 5 | 6,374 | 107 | 69 | 0.13 | 0.015 |
difficult to explain and that the workgroup considered to be caused by procedural errors. The most reliable results generally were considered to be those from laboratory studies that examined the influence of soil core diameter on release rates, but even here the usable results were limited to the first four days of inundation after drying because biofilm growths in the core tubes after that point may have affected the release rates.
Overall, measured release rates for nutrients and DOC from Lake Poinsett wetland soils were low, indicating that the soils were recalcitrant to oxidation upon exposure to air. The workgroup provided supporting evidence for the low release rates in the form of carbon-tonitrogen (C:N) ratios in the soils, which they reported to be in the range 10-13. Soils collected from wetlands in segments 6 and 7 as part of the workgroup’s synoptic sampling had similar average C:N ratios. In contrast, wetland soils in some other upper basin marsh conservation areas tend to be higher (14-17). According to a soil chemistry book (Brady and Weil, 2002) cited by the workgroup, the biodegradability of soil organic matter decreases with decreasing C:N ratios. In this book, soils with C:N = 15-30 are considered to be “active,” decomposing in a timeframe of 1-2 years; those with C:N = 10-20 are considered “slow,” decomposing in 15-100 years; and those with C:N = 7-10 are considered “passive,” and are stable over timeframes of a few centuries.
Flow-weighted DOC concentrations for June-October found from the mass balances were in the range 24-30 mg/L for Lake Poinsett and 25-35 mg/L for Lake Winder. TP generally was in the range 0.10-0.20 mg/L in both lakes; higher and lower values occurred in a few years. Similarly, TKN generally was between 1 and 2 mg/L, but again higher or lower values occurred in a few years. When additional DOC and nutrients released from exposed wetland soils were taken into consideration, average concentrations of DOC in the river increased by < 0.1 to ~0.2 mg/L, depending on the value of the rate coefficient (K) used in the tanks-in-series removal model. For TP the concentrations increased by ~0.001 to ~0.01 mg/L depending on the value of K, and for TKN, concentrations increased by < 0.01 to ~0.02 mg/L. In all cases, the increases are a small fraction of the average concentrations calculated in the mass balances, and the workgroup concluded that oxidation of wetland soils would not cause significant effects on nutrient conditions in lakes of the St. Johns River.
For DOC, the workgroup conducted a further analysis to evaluate potential effects on dissolved oxygen concentrations in Lake Poinsett. Monitoring data showed that low dissolved oxygen (DO) concentrations occur in the lake during summer, and the workgroup hypothesized that the low DO was caused by oxidation of the high concentrations of DOC in the river water. A photochemical mechanism for DO depletion that involves the colored (humic) portion of DOC has been known for decades (Miles and Brezonik, 1981; Xie et al., 2004), but microbial processes also may be involved. The workgroup found a small negative correlation (r2 = 0.2) between DOC and DO concentrations in Lake Poinsett, and using a more complex multiple regression model they calculated that in-lake DO concentrations would change by negligible amounts (0.00 to ~0.02 mg/L depending on the value of K used in the tanks-in-series model).
Based on the findings summarized above, the workgroup prepared a series of summary tables for the level of effects associated with various withdrawal scenarios and the uncertainties in their conclusions (see Table 3-5 for the extreme scenario). In brief, negligible effects were predicted for all river segments for all biogeochemical conditions analyzed, but the level of uncertainty varied widely among the segments. For segments 1-4, the workgroup concluded that the uncertainty was very low because the H&H modeling showed with a high level of certainty that there would be no changes in river stage. Uncertainty in conclusions for segments 5 and 6
TABLE 3-5 Summary of Withdrawal Effects on Biogeochemistry Metrics for the Full1995NN Scenario
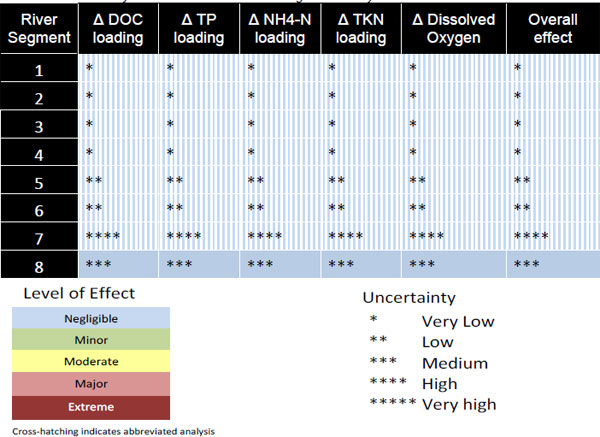
SOURCE: Keenan et al. (2011).
was regarded as low, primarily because stage changes in these segments were considered to be very small, albeit not negligible, and the ratio of wetland area to river flow also was small in comparison with upstream segments. Uncertainty was largest (high) for segment 7 because no release rates were measured on soils in this segment. Finally, the uncertainty in conclusions for segment 8, the only segment for which the workgroup conducted a complete analysis, was regarded as “medium.”
Critique
Although the general approach used in the screening assessment to rank the vulnerability of river segments to impacts of withdrawals on biogeochemical processes was reasonable, it relied on an important assumption that may not have been accurate, namely, that decomposition/oxidation rates of the wetland soils in different segments are similar. The biogeochemistry workgroup found that sediments in the portion of segment 8 where they focused their studies (i.e., Lake Poinsett) were recalcitrant—very slow to decompose, but they did not directly measure release rates on soils from segments 5-7. Instead, they relied on a similarity in the average C:N ratios of wetland soils in the segments to infer that release rates would be
similar. Unfortunately, ranges of C:N ratios were not reported for soil samples within the segments, and the reported mean value for segment 5 (16.0) is substantially higher than those for segments 6-8 (12.9-13.2; Table 3 in Keenan et al., 2011). Given the wide ranges of C and N reported for the synoptic samples (see summary in results section above), it is likely that a fair range also exists in C:N values—unless the C and N contents of the soils are highly correlated.
Moreover, the use of C:N ratios as the sole basis for assuming that release rates are similar in the four segments is troublesome for several reasons. First, decomposition of soil organic matter is highly complicated, and many factors can affect rates, including soil pH, clay content, and the chemical nature of the organic matter. In addition, the trend cited by the workgroup (decreasing biodegradability with decreasing C:N) is counter-intuitive because lower C:N ratios are closer to the C:N ratio (6.4 by weight) typically found in microbial cells. A high C:N ratio in organic matter indicates a deficiency of nitrogen relative to the needs of microorganisms for cell synthesis. We do not dispute the general statements about C:N ratios and organic matter stability reported by Brady and Weil (2002) (the reference used to support the workgroup’s conclusions), but the Committee regards the workgroup’s heavy reliance on C:N ratios as overreaching and a major source of uncertainty in the analysis.
Overall, the metrics used in the screening assessment—wetland area, river flow, and average water level decrease (Table 3-4)—led to the conclusion that the segment 8/Lake Poinsett wetlands were the most susceptible region, but in the Committee’s view, they are not sufficient to dismiss the potential importance of withdrawal impacts on downstream segments.
The physical and chemical measurements of soil cores collected in the synoptic survey were performed on integrated samples of the top 10 cm of the cores. Although this may represent a standard sampling depth in soil chemistry, it is highly likely that most of the sampled sediments was below the biologically active layer, which in lake and wetland sediments typically involves only the uppermost centimeter or two of material. Consequently, the sampling design probably was biased toward old and refractory material. In addition, except for cores used in the experiment on core diameter, the workgroup’s techniques to obtain sediments for the decomposition-release experiments did not include the surficial detritus (often called the “fluff layer”) produced within the previous year. As the workgroup noted, the recently deposited fluff layer is well known to be mostly labile. Exclusion of this material from most of the sediment release experiments likely accounts for the slow release rates that the workgroup measured. An alternative approach that the Committee recommends for calculating nutrient releases from exposed sediments would assume that all the nutrients bound in the fluff layer are released during sediment exposure.
It is unfortunate that the workgroup’s efforts to obtain experimental values of nutrient and DOC release rates from exposed wetland soils were not more successful, but the Committee recognizes that field-based experiments are especially difficult to conduct. Under the circumstances faced by the workgroup to complete its assessments, the workgroup conducted a thoughtful and objective analysis of their limited experimental results.
Although no experimental data were available from the WSIS studies on attenuation of nutrient and DOC loads as water flows from re-inundated wetlands into Lake Poinsett, to the workgroup’s credit, they found a compilation of attenuation rates from natural and constructed treatment wetlands in the literature (Kadlec and Wallace, 2008). That review included results from a treatment wetland east of Orlando that drains into the St. Johns River, which had rates within the general range for natural treatment wetlands. Because of the proximity of this site to
the wetlands around Lake Poinsett and their similar characteristics, the workgroup ultimately (and appropriately) used these values for their attenuation estimates.
The uncertainty analysis conducted on impacts of nutrient and DOC loadings on conditions in Lake Poinsett used median and interquartile values for the release rates and attenuation rate constants. In the Committee’s view, this approach was reasonable and appropriate. The existence of attenuation rate constant data from the nearby Ironbridge wetland was fortuitous, and reliance on these data for the attenuation rate constants also was appropriate. The Committee is less impressed with the regression relationship used in the report to relate increases in DOC loading to decreases in DO in Lake Poinsett; its highly empirical nature, with three predictor variables (change in elevation, change in DOC, and change in TP concentration), is problematic, and its low r2 (0.415) indicates poor predictive ability. The Committee recognizes, however, that accurate, mechanistically based predictions of changes in DO concentrations caused by changes in DOC would be very complicated and difficult to achieve. Given the small values of predicted changes in DOC concentrations produced by the modeling analysis for even the “worst case” scenario (Full1995NN), the Committee concludes that a more sophisticated analysis could not be justified.
The Committee agrees generally with the trends in levels of effects and uncertainties identified by the workgroup for the river segments in the level of effects analysis (Table 3-5), but we note that the conclusions for segments 1-4 are not based on studies conducted by the biogeochemistry workgroup. Instead, they are based solely on the H&H modeling analysis. Regarding the level of uncertainty for segments 5, 6, and 8, it could be argued that a higher rating (e.g., four stars) would be appropriate given the complete lack (5 and 6) or paucity (8) of data on nutrient and DOC release rates from the wetland soils in these segments. The large uncertainties in the predictions, which are troublesome, are mitigated in part by the very low increases in nutrient (TKN and TP) and DOC concentrations that were estimated for Lake Poinsett (segment 8), even for the worst case scenario (Full1995NN). Even if the estimates were off by more than a factor of ten, the additional concentrations still would be a small fraction of current concentrations. Finally, the Committee is at a loss to understand how the workgroup calculated the levels of effect and uncertainties reported for ammonium (NH4 +) in Table 3-5 because none of the ammonium release rates measured in the sediment release experiments was considered reliable enough to use in the workgroup’s subsequent modeling analyses to estimate impacts of withdrawals on water quality in the various segments.
The plankton workgroup was charged with identifying and quantifying possible environmental impacts of water withdrawals on plankton communities and Total Maximum Daily Loads (TMDLs) in the St. Johns River. Most of the potential impacts investigated were consequences of enhanced growth of phytoplankton. Consequently, phytoplankton bloom dynamics were a primary focus of this workgroup. The tasks of the plankton workgroup were to (1) set thresholds for adverse ecological effects of algal blooms, (2) model the relationships between bloom characteristics and hydrology, and (3) determine whether water withdrawals would cause or exacerbate adverse effects of algal blooms.
Conceptual Model
The conceptual model for the plankton workgroup, shown in Figure 3-5, consists of two different approaches to predict phytoplankton biomass, community composition, N2 fixation, cladoceran zooplankton abundance, algal toxins, and dissolved O2 concentrations. One approach involved empirical methods based on historical data, while the other involved a mechanistic water quality model. For the empirical approach, inputs for the models included nutrient loading, water age/retention time, and salinity. The potential effects were estimated using a collection of regression equations based on historical data collected on the lower, middle, and upper St. Johns River since the mid-1990s. There were roughly 60 main-stem river sites with water chemistry data and 40 sites that also had plankton data. The mechanistic model approach relied on the hydrodynamic/water quality model CE-QUAL-ICM. Model outputs were directed to the SAV, fish, and benthos workgroups.
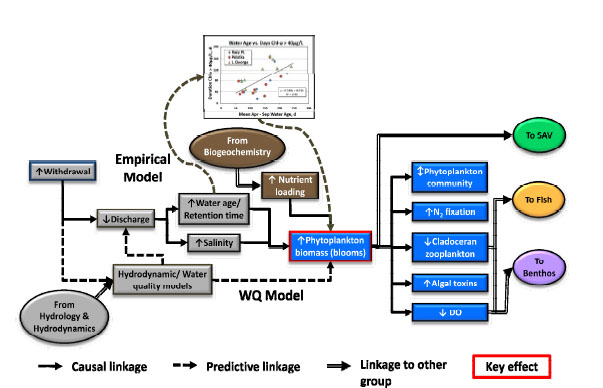
FIGURE 3-5 Conceptual model for the plankton workgroup.
SOURCE: Coveney et al. (2011).
Methods
The plankton workgroup developed four bloom metrics and thresholds. First, marine algal blooms were measured as the maximum annual dinoflagellate biovolume. The second metric was annual nitrogen (N) mass added via nitrogen fixation. Third, freshwater algal bloom intensity was measured as the maximum algal bloom biomass [expressed in terms of chlorophyll a (chl a) concentrations] above which an altered phytoplankton community or cyanobacterial toxins, dissolved O2 depletion, and fish stress may occur. Finally, freshwater algal bloom duration threshold was measured as the annual duration of the longest bloom of an intensity at which altered zooplankton communities and a reduction in fish production were likely to occur.
The marine algal blooms metric (#1) was designed to evaluate the potential effects of marine phytoplankton blooms using dinoflagellates as a surrogate group. The workgroup used best professional judgment to select a threshold for dinoflagellate biovolume of 1,000×103 μm3 m L-1, beyond which bloom conditions were considered to exist. Thresholds were based on phytoplankton data obtained from locations such as Piney Point, Mandarin Point, and Doctors Lake from 1995 to 2005. Metric #2 (annual N mass added via N2 fixation) was defined using best professional judgment to be a threshold above which additional N2 fixation would prevent the achievement of TMDL goals. The annual mass N added via N2 fixation was estimated from N mass balance calculations for Lake George for 1996-2005, where inflows, outflows, and tributary contributions of N have been well characterized. The threshold for N2 fixation was set to the point at which the additional N load (change from baseline to withdrawal scenario) exceeded 20 percent of the required TMDL reduction (i.e., to 308×106 g N yr–1).
Freshwater algal bloom intensity (metric #3) was based on the chl a concentration at which ca. 80 percent (by biovolume) of the algal community consisted of cyanobacteria. There are no water quality standards for cyanobacterial abundance but, according to the World Health Organization, cyanobacterial concentrations exceeding 50 μg/L of chl a may have negative health effects. Cyanobacterial blooms generally do not occur downstream of Lake George because of higher salinities in this stretch of the river.
Potential dissolved O2 depletion and consequent stress effects on fish were derived from a linear regression between the maximum chl a concentration during blooms and the minimum dissolved O2 (DO) after the blooms crashed. According to the fish workgroup, a DO level of 2.5 mg L-1 is a threshold dividing healthy and unhealthy conditions for fish. According to the regression relationship between maximum chl a and minimum post-bloom DO, a concentration of 135 μg L-1 of chl a results in a predicted DO of 2.5 mg L-1. Blooms lower than 135 μg L-1 of chl a might be harmful, but only blooms at or above the threshold were considered to be definitely harmful.
For the algal bloom duration metric (#4), concentrations of cladocera and three other zooplankton groups were examined from three sites in the lower St. Johns River as a function of the number of days of continuous algal blooms (chl a > 40 μg L-1). The abundance of cladoceran zooplankton was found to be reduced during extended algal blooms. Using best professional judgment, the workgroup decided that bloom durations of more than 50 days would be harmful to cladoceran zooplankton. There was no discernible effect for the other three zooplankton groups considered.
Assessment of the four metrics to identify water quality impairments under existing conditions was performed for segments 3, 4, and 6 (the freshwater portion of the lower St. Johns River and middle St. Johns River lakes). Segment 9 was not assessed because it is above a water
control structure and would not be affected by downstream water withdrawals. Segments 5 and 7 were not assessed because algal blooms typically do not occur in these areas. Preexisting impairments for algal blooms in the basin were evaluated by assigning one of five degrees of impairment to river segments based on the frequency of occurrence of threshold exceedances from 1995 to 2005. The results of this analysis indicated that all the river segments assessed in the analysis except Lake Poinsett (segment 8) had pre-existing major impairments.
The mechanistic CE-QUAL-ICM model, originally developed to determine TMDL targets for the lower St. Johns River, was used to provide a second, relatively independent assessment of water withdrawals on metric #3 (bloom maximum chl a) for segment 3. The structure, formulation, and operation of CE-QUAL-ICM were detailed in Appendix 4 of the plankton workgroup report (Hendrickson, 2011).
Results
Water withdrawal scenarios for the freshwater portion of the lower St. Johns River were tested using empirical regression models to relate algal bloom metrics to water age. The performance of various empirical regression models for specified river segments is summarized in Table 14 of the plankton report (Coveney et al., 2011). Most bloom estimates were based on multiple linear regressions with the number of independent variables ranging from two to seven; adjusted r2 values ranged from 0.80 to 0.97.
Ten different water withdrawal scenarios were tested, and the results from the “worst case” withdrawal (FwOR1995NN and FwOR1995PN) and the “long-term realistic” scenario (FwOR2030PS) were evaluated relative to 1995 baseline conditions (Base1995NN). The predicted water age (supplied by the H&H workgroup) was used as the independent variable in the regression models to calculate chl a. A comparison of the “worst case scenario” simulation (FwOR1995NN) with the 1995 baseline showed that the change in magnitude and/or frequency of blooms ranged from –2.9 to +7.6 percent. The greatest effect was seen at Lake Harney. A similar comparison between the base case and the worst case with the upper basin projects added in (FwOR2030PS) showed changes in bloom magnitude and/or frequency ranging from –8.4 to +4.2 percent. Scenario FwOR2030PS showed changes in bloom magnitude and/or frequency ranging from –12.4 to +3.7 percent, which were rated as “negligible” relative to the baseline scenario (Base1995NN) (see Table 3-6 and Table 25 of Coveney et al., 2011).
Using water budget and nutrient concentration data to calculate nitrogen budgets for Lake George, the workgroup estimated that N2 fixation varied from –259 to 1780×106 g and averaged 806×106 g from 1996 to 2005. The workgroup estimated that N2 fixation contributed 20 percent or more of the downstream flux of nitrogen in 1996-1998. A predictive model for nitrogen loadings from fixation calculated from the 1996-2005 estimates and several (unspecified) measures of water age had a high adjusted r2 (0.96).
Water withdrawal affects for Lake Poinsett (segment 8) were evaluated separately because this lake is located upstream of the proposed withdrawal location. The workgroup reasoned that withdrawals would reduce the water residence time in the lake, resulting in a concomitant reduction in chl a levels, and they concluded that there would be no adverse effects of water withdrawal.
The mechanistic water quality model CE-QUAL-ICM also was used to predict conditions resulting from the various withdrawal scenarios. The model provided a second assessment of
TABLE 3-6 Summary of Withdrawal Effects on Plankton Metrics for the FwOR1995NN Scenario
SOURCE: Coveney et al. (2011).
NOTE: Blank segments and NA indicate areas that were not assessed by Plankton Group.
effects of water withdrawals on bloom maximum chl a in segment 3 independent of the empirical model. The model was not able to capture the magnitude of extreme algal blooms but did appear to capture the timing and frequency of bloom events. In addition, the model results showed good agreement with the empirically derived projections. The CE-QUAL-ICM
predicted median changes in maximum chl a were from +1.7% to – 0.1% for the worst case scenario (FwOR1995NN) relative to the baseline scenario.
The plankton workgroup also conducted a literature review on flow-phytoplankton, flowzooplankton, flow-nutrient, and flow-salinity-oxygen relationships (see Appendix 1 of Coveney et al., 2011). The review was not exhaustive but does reflect current knowledge about flow effects on river and estuarine systems. The summary includes preliminary conclusions about the potential effects of reduced flow for the upper and lower St. Johns River, and the conclusions are supported by the literature reviewed in the summary.
Uncertainty estimates were based on qualitative assessments of the reliability of three types of evidence for effects: the results of quantitative models, supporting evidence, and understanding of mechanisms. The anticipated uncertainty in model predictions is low or very low (subjective measures).
The workgroup concluded that the range of withdrawal scenarios likely would have little impact in excess of pre-existing algal bloom conditions in this region of the St. Johns River and that ecological conditions related to plankton, which are already impaired in parts of the basin, will not change significantly under the near-term and long-term withdrawal scenarios.
Critique
Ecosystem level ecological models are difficult to construct, verify, and validate. Some of the most effective models include both quantitative and qualitative components to predict ecosystem responses to anthropogenic alterations in environmental conditions. Given the large number of variables and the stochastic nature of ecosystems, quantitative predictions in most cases represent an informed or “best guess.” It is within this framework that the plankton workgroup had the difficult task of predicting phytoplankton responses for a range of water withdrawal scenarios. The workgroup adopted two relatively independent approaches to assess the impacts on phytoplankton bloom dynamics and consequent changes in water quality. For the one segment of the river where both approaches were applied, results of both the mechanistic and empirical models were similar, which strengthens their conclusions. The overall approach of the workgroup was logical and used the best available information to derive and parameterize the models. Many of the multiple regressions used to quantify the relationships between water age and phytoplankton characteristics were robust (r2 > 0.80), which also promotes confidence in the models. The conclusions of the plankton workgroup are supported by the evidence presented and the predictions are based upon the best available data.
One weakness of the plankton study is that potential changes were compared to a 1995 base case scenario. It appears that the proposed water withdrawal may not worsen conditions related to plankton relative to 1995 conditions. As the workgroup clearly showed, however, conditions in 1995 were not “ideal,” and many sections of the river suffered from persistent algal blooms and anoxia. Withdrawals may not worsen conditions, but clearly they will not “improve” conditions in the river.
As the workgroup pointed out, nitrogen contributions by N2 fixation estimated from the 1996-2005 mass balance analyses are the net sum of several nitrogen source and sink processes, including in-lake denitrification, sedimentation of particulate nitrogen, release of nitrogen from bottom sediments, and uptake or release from macrophytes and fish. The relative importance of these processes is difficult to evaluate. Although N2-fixing cyanobacteria are found routinely in
Lake George and three sets of in situ N2-fixation measurements in 2004 confirmed that the process occurs in the lake, the Committee regards the estimates reported by the workgroup as only gross approximations. Moreover, in calculating the effects of water withdrawals on mass loadings to the system by N2 fixation, the workgroup assumed that only water flows would change and nutrient concentrations would remain the same as in the historical data used to generate 1996-2005 estimates and predictive model. The Committee views this situation as highly unlikely, and consequently views the predictions for this metric to be subject to high uncertainty.
The uncertainty analysis conducted in this study is purely qualitative and based upon best professional judgment by the workgroup. The assignment of broad categories of qualitative certainty may foster a false sense of confidence in the conclusions. Propagation of all errors from the H&H models through regression analyses, and taking into account other major assumptions about sea level rise, land use changes, and return flows would likely result in a much larger degree of uncertainty in the conclusions.
LITTORAL ZONE: SUBMERSED AQUATIC VEGETATION
The littoral zone workgroup began their consideration of the littoral zone by emphasizing the importance of submersed aquatic vegetation (SAV) in aquatic ecosystems because it “provides refuge, anchors sediments, provides dissolved oxygen, creates substrate for epifauna and epiphytes, serves as food for wildlife and competes with phytoplankton for nutrients.” They also could add that the canopy of dense beds of SAV can reduce currents and attenuate wave action, which reduces turbidity in the water column and alleviates sediment inputs by helping to reduce shoreline erosion. The workgroup pointed out that a variety of emergent species occur in the littoral zone of the St. Johns River, but consideration of these species was left to the wetlands workgroup to determine the wider impacts of various future water withdrawal scenarios.
Although approximately 11 higher plant species comprise the SAV community in the St. Johns River, by far the most common in the middle and lower basin is Vallisneria americana, which was the prime focus of the littoral zone workgroup. Because this species is found worldwide, a considerable amount of literature is available to assess its tolerance levels, especially in response to changing water levels and salinity intrusions, and a considerable local data base also exists on its occurrence in the St. Johns littoral zone, where it has been identified in 92 percent of the SJRWMD transects. Vallisneria thus can be regarded an excellent indicator of the condition of the SAV community in the littoral zone of the St. Johns estuary.
In contrast, the most common species in the upper basin is the introduced species Hydrilla verticillata, which is subjected to annual herbicide applications. The intensive control efforts, although directed at Hydrilla, also impact native SAV species in the St. Johns waterways. Unfortunately, the collateral damage to the rest of the SAV community obfuscates the normal depth distribution, and consequently understanding of the littoral community is much more fragmentary in the non-tidal portions of the St. Johns River. Because Hydrilla is very sensitive to salinity, the estuarine portion of the St. Johns River is not afflicted with the dense vegetation mats that often form when salinities fall below 1 psu.
Conceptual Model
The littoral zone workgroup developed a conceptual model (Figure 3-6) showing the relationship between major hydrological drivers (in gray)—riverine stage, flow rates, turbidity and salinity—and a set of SAV response modules, which also are affected by interactions with phytoplankton, colored dissolved organic matter (CDOM), and epiphytic growth on SAV. The latter may be considered a separate SAV component, and it also is a function of nutrients in the water column. The conceptual model shows that when a combination of the variables mentioned above exceed the tolerance of SAV, it can become stressed resulting in reduced plant growth and reproduction, and even mass mortality if extreme conditions are persistent. Going past the SAV “tipping point” may result in a decline not only in SAV, but also much of the littoral food web. This disruption results in habitat loss for the benthos and nekton and can spur a decline in local fish communities as well.
The littoral zone workgroup eventually formulated two main hypotheses that are illustrated in the central panels of the conceptual model:
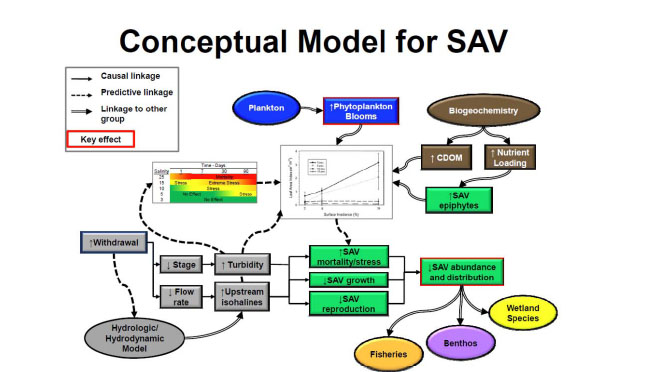
FIGURE 3-6 Conceptual model showing effects of hydrologic and other drivers on the submersed aquatic vegetation (SAV) community in the St. Johns River and the influence of this community on other components of the aquatic ecosystem (benthos, fish, wetland species).
SOURCE: Dobberfuhl et al. (2011).
1. Salinity intrusions can result in stress to Vallisneria that over extended time periods can reduce its growth and survival in the estuarine portion of the St. Johns River. This effect could be aggravated if the SAV is forced upstream where the bathymetry generally provides less suitable shallow water habitat.
2. Water withdrawals will result in the lowering of the water levels (up to 5 cm) in the nontidal portions of the St. Johns River, which acts to restrict the overall area suitable for SAV growth at the periphery of the system. SAV habitat could potentially increase in the deeper areas of the freshwater lakes, provided that both CDOM and increased turbidity associated with phytoplankton blooms did not increase in the water column as a consequence of the withdrawals.
Methods
The assessment of potential changes in the SAV community of the littoral zone from water withdrawals was based largely on output of the hydrological models under various water withdrawal scenarios, which was provided by the H&H workgroup. The littoral zone workgroup first determined the withdrawal scenario that produced the greatest hydrologic changes and progressed iteratively to the scenario with the least impacts. For example, hydrological model projections indicated that the largest change in mean water level (–5 cm) would be in river segment 8, Lake Poinsett, followed downstream in Lake Harney (–4 cm), both of which have ephemeral SAV communities. The next step was to determine a depth/stage relationship for SAV, but this was complicated by the lack of extensive data on plant distributions in these lakes (partly because of extensive herbicide applications, which made it difficult to determine the “natural” depth distribution). The littoral zone workgroup thus had to formulate a stage/depth relationship based on fragmentary anecdotal data and information from river segments 2 and 3, where SAV exists on average to a maximum depth of –85 cm (the maximum was –120 cm deep). Potential habitat changes were derived from the downstream SAV depth distribution data combined with the lake bathymetry (determined by GIS).
Water withdrawals also could impact Vallisneria by changing the distribution of salinity in the river. These impacts were based on salinity changes predicted from the EFDC hydrodynamic model output for various water withdrawal scenarios in the estuarine portion of St. Johns River. The predictions for the littoral cells of the model output were compared with a salinity/time exposure relationship developed for Vallisneria from an extensive literature review, bolstered by several types of experimental data, including analysis of stress enzymes. For example, salinity effects were found to be negligible when plants were exposed to 5 psu for one month, but showed low stress for two to three months at the same salinity. In contrast, Vallisneria began to exhibit extreme stress when exposed to 25 psu for only one or two days. Extreme stress was defined by the littoral zone workgroup as “a deleterious level of salinity stress that results in losing the majority or all of the above-ground biomass and some level of below-ground biomass.” In addition to relying on the calibration data from the main stem model cells of the lower St. Johns, the littoral zone workgroup collected additional salinity data from October 2009 to March 2010 using a YSI conductivity sensor deployed at a long-term SAV monitoring site. Data from this site were compared to data collected simultaneously at a nearby
mid-channel bridge site to determine whether there was any significant difference when using mid-channel salinity projections to assess the shallow cells where SAV actually grows.
Results
Lake Stage and Potential SAV Habitat
As mentioned above, the Full1995NN scenario exhibited the largest mean stage reductions (relative to the base scenario) in Lake Poinsett (–5 cm) and Lake Harney (–4 cm). Assuming no significant increase in plankton blooms, epiphytic loading, CDOM, or turbidity due to sediment suspended in the water column, the potential bottom area available for SAV colonization would increase in Lake Poinsett by 9 percent, i.e., 89 ha (from a base of 989 ha to 1,078 ha). Using the same assumptions, the potential bottom area available for SAV colonization in Lake Harney would decrease by 2 percent, i.e., 9 ha (from a base of 391 ha to 382 ha). The workgroup reasoned that the relatively small changes in available bottom area were the result of the flatness of the stage-area curves of the two lakes, with no dramatic inflections between the base levels and predicted values. The workgroup’s assumption of no substantial change in the components that determine light attenuation was based on information derived from discussions with other SJRWMD workgroups [e.g., minimal increases phytoplankton blooms (plankton workgroup), no substantial DOC output from surrounding wetlands (biogeochemistry workgroup), and no additional sediment resuspension due to increased wind forcing, if the lakes become shallower than their 1995 base].
Salinity Exposure Model
To assess the potential impacts of water withdrawals on Vallisneria habitat in the estuarine portion of the St. Johns River, one cell (i.e., LIJ#3480) that was considered to be particularly sensitive was selected from the EFDC model grid to track salinity changes. This cell is located near the most seaward location of the geographical extent of the SAV community and thus would be the logical location for potential salinity stress. Compared to the base scenario (i.e., Base1995NN), which has a maximum 7-day salinity of 15.5 psu, the projection for this cell under the FwOR1995PS scenario was 16.4 psu—a difference of just under 1 psu. Although the workgroup acknowledged that the combination of environmental circumstances that produce the FwOR1995PS scenario are very unlikely, they decided that it was important to test what they viewed as the worst-case scenario in a section of the river where Vallisneria is most vulnerable to salinity intrusions. Using this worst-case scenario, 199 ha (or 4 percent) of SAV in the estuarine portion would go from “no effect” to “stressed” status, but most of the change (i.e., 162 ha or 3 percent) would be in the low stress category. Only 61 ha (or 1 percent of the total littoral habitat) would become moderately stressed 10 percent of the time in the worst case scenario, and 87 ha would be exposed to extreme stress. Spatial analysis of the cells that would be affected the most showed that the area north of Buckman Bridge would be most susceptible, at least periodically, to moderate or extreme salinity stress. In this area 12 ha of Vallisneria would experience visible effects 5-6 percent more frequently under this scenario. The worst case
analysis led the workgroup to conclude that there is a small risk to stressing grass beds downstream, and it diminishes rapidly in upstream model cells.
In the larger picture, more than 60 percent of the time, noticeable stress conditions did not emerge—even under the worst case scenario. Even in beds where there would be periodic extreme stress, the workgroup concluded from a frequency analysis of salinity intrusions that recovery of Vallisneria would be likely. This conclusion appears to be bolstered by the analysis of data on salinity patterns in the shallow (nearshore) areas versus the main stem. As might be expected, the model over-predicts salinity intrusions into the Vallisneria beds on the estuarine flanks. The workgroup found that daily conductivity values generally were higher in the main stem, but the most marked differences occurred during high conductivity events (>5000 μS cm-1) when measurements in the shallow areas were 30-60 percent lower than the channel measurements. This suggests that there is enough freshwater seepage from groundwater in the shallow areas compared to the main channel to help Vallisneria survive when periodic salt intrusions dominate the main channel. The workgroup thus concluded that for Vallisneria “the actual stress frequency is likely to be lower than the model-predicted frequency for any given scenario” (Dobberfuhl et al., 2011, page 9-23).
Table 3-7 summarizes the negligible stage and salinity effects of the two “worst-case” withdrawal scenarios on segments 2 and 3 (FwOR1995PS) and segments 7 and 8 (Full1995NN). The asterisks indicate the uncertainty associated with each level-of-effects entry in Table 3-6. For the stage analysis, the uncertainty was rated as medium because of the qualitative predictive
TABLE 3-7 Summary of Withdrawal Effects on SAV for the Two Worst-Case Scenarios: Full1995NN for Stage Effects and FwOR1995PS for Salinity Effects.
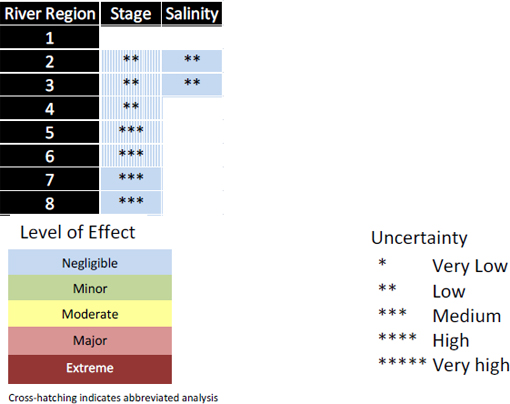
SOURCE: Dobberfuhl et al. (2011).
model relating the depth of water to light availability. Although this relationship has been quantified in similar areas of the river, it has not been measured directly in Lakes Poinsett and Harney. The hydrologic model output was designated as very low uncertainty for Lake Poinsett and low uncertainty for Lake Harney, such that the overall stage analysis is considered to have medium uncertainty. Uncertainty regarding the salinity analysis was lower because of the strong understanding of the mechanism, strong supporting evidence, and strong quantitative predictive model relating salinity exposure to SAV stress and mortality. Because the salinity data generated from the EFDC hydrodynamic model was designated as low uncertainty, the overall salinity analysis was considered to have low uncertainty.
Other SAV
The littoral zone workgroup also considered the interesting question: why are there no other species of SAV in the St. Johns River capable of replacing Vallisneria downstream when salinities rise to 15-20 psu and beyond? This is not the case in other estuaries, such as Chesapeake Bay and the North Carolina sounds or other Florida estuaries such as Indian River, Biscayne Bay and Florida Bay, where various species of seagrass often are found in abundance. Species such as Ruppia maritima often become dominant when Vallisneria becomes stressed by high salt conditions. Although Ruppia does occur in the St. Johns River, 99 percent of the time it is in conjunction with Vallisneria or another species, according to data presented by the workgroup. The workgroup hypothesized that Ruppia cannot tolerate high levels of CDOM in the water column when not in an SAV community, and this limits its ability to colonize areas left vacant by Vallisneria. One factor that could help explain the inability of freshwater SAV species (perhaps including Ruppia) to adapt to salty conditions is the low light intensity in the St. Johns River caused by the high levels of CDOM in the water. To address this hypothesis, the workgroup developed a Relative Condition Index Model based on previous studies and SAV data from the St. Johns River. Their analysis indicated, however, that increased transparency in the water column did not appear to ameliorate the deleterious impacts of salinity at the sites they selected (Bolles School, Buckman Bridge, and Moccasin Slough in the lower St. Johns River). Whatever the reason, the lack of SAV replacement downstream for Vallisneria renders the lower St. Johns River more fragile in terms of rising salinity (and global sea-level rise) than many other estuaries along the East Coast of the United States, where seagrasses often dominate downstream segments.
Critique
In general, conclusions of the workgroup regarding impacts of lowering water levels upstream and increasing salinity levels downstream on SAV are well thought-out and arise from careful data analysis. Though there were some data gaps such as in SAV distributions in Lakes Poinsett and Harney, there were logistical reasons why more information was not available (i.e., herbicide applications would have complicated any data collection program). There are no obvious instances where the workgroup overreached in their conclusions and, overall, the workgroup responded thoroughly to suggestions made by the NRC.
Of course, many of the workgroup’s conclusions are highly dependent on the H&H projections, as well as the output of other workgroups, and so there still is some uncertainty. One important issue is that the surface water withdrawals will result from increased population density in the basin that will in turn lead to higher nutrient loadings from the basin, which should increase the duration and intensity of phytoplankton blooms in the St. Johns River if strong efforts are not undertaken to control these loadings. This secondary effect of the proposed water withdrawals could be as much a problem as salinity and water levels in determining the fate of SAV in the St. Johns River ecosystem. There is abundant evidence in the scientific literature that eutrophication results in the reduction and sometimes complete demise of SAV in a variety of aquatic systems of varying salinity. It should be noted, however, that the District has contended that the TMDL and MFL regulatory processes will regulate nutrient inputs if they become a problem.
Aside from some of the constraints the littoral zone workgroup was under, the assessments they made are “state of the art” and robust with regard to salinity and water levels. Indeed, in several instances they pushed beyond what is normally achieved in environmental assessments, especially with regard to a useful Vallisneria “salinity stress model” they created from the literature and their experimental data on stress enzymes.
***
The activities of this workgroup were impressive in many ways, and many of the issues, which seemed initially uncertain, were addressed in a rigorous scientific framework. One addition to future SAV monitoring in the upper and middle portions of the St. Johns River could include analysis of SAV using aerial or satellite imagery. This would need to be done during periods between phytoplankton blooms when turbidity is low in the water column. If incoming nutrients were monitored (including benthic flux measurements), it might be possible to obtain a better understanding of the dynamics of SAV communities in the lakes and lead to a more integrated approach to control both wanted and unwanted species with more limited use of herbicides.
Another continuing issue in the estuarine portion of the St. Johns will be increasing salinity. A more detailed exploration, perhaps using mesocosm approaches, to study Ruppia growth and survival in relation to salinity and CDOM, as well as its apparent inability to grow without other species, might be instructive in better understanding the species lack of downstream survival in the lower St. Johns River. Another suggestion would be experimental transplanting of seagrass species (native to Florida) along the salinity gradient into the lower St. Johns from Buckman Bridge to the mouth of the river and careful monitoring of environmental conditions of success and failure. Combined with mesocosm studies, this possibly could yield a macrophyte species that might better withstand the higher salinity and CDOM, as well as low light, enabling it to colonize the high salinity shallow areas of the lower St. Johns River. This could be an important step in making this estuarine system more resilient to water withdrawals, downstream dredging projects, and sea-level rise as the century progresses.
Both the benthos and fish workgroups divided their investigations by river segment, thus differentiating between impacts on estuarine organisms (in segments 1 to 3) and freshwater organisms (in segments 2 to 8). Because the conceptual models for freshwater and estuarine organisms are significantly different, they are discussed separately in the following two sections.
Freshwater Benthos
Conceptual Model
Figure 3-7 presents the conceptual model for freshwater benthos. The wetlands and H&H results were used as the primary input to the freshwater benthos studies. In contrast to the conceptual models of most other ecological workgroups, the freshwater benthos model does not include any hydroecological model to predict the magnitude of changes in benthic conditions as a function of hydrologic (or other) changes resulting from water withdrawals. Consequently, the workgroup relied on professional judgment and “weight of evidence” approaches to make their assessments. Changes in stage prompted by water withdrawals were anticipated to have a direct impact on the density and distribution of the target taxa, as well as on community and population metrics such as diversity, density, and biomass. Stage also was predicted to impact benthos indirectly via changes in wetlands acreage and structure. Finally, the potential for increase algal blooms and a lowering of dissolved oxygen—inputs from the plankton workgroup—were thought to be important in determining impacts to benthos. The major recipients of information from the benthos workgroup were the fish and wetlands wildlife workgroups, although only the former is depicted in Figure 3-7.
Methods
For the freshwater benthos, there were few data to work with, especially in the main stem of the river, and the workgroup was unable to find (or develop) quantitative predictive relationships between metrics of conditions in the benthos and hydrologic (or other) potential “driver” variables. Nonetheless, the workgroup attempted to devise community level, population level, and target taxa information to use in a “weight-of-evidence” analysis on the effects of water withdrawals.
In terms of community level data, the workgroup searched the literature for information on several metrics, but ended up basing their conclusions on measures of taxonomic composition, indicators of tolerance, life history characteristics, and trophic measures. A onetime survey of benthos in 1999 found that the majority (≥50 percent) of the organisms present in the St. Johns River infaunal (in-sediment) benthic community are classified as “tolerant” of a wide range of environmental conditions.
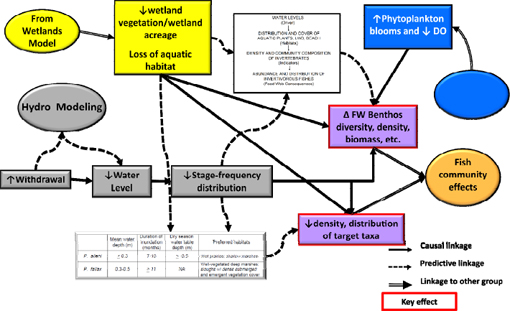
FIGURE 3-7 Conceptual model for the freshwater benthos.
SOURCE: Mattson (2011).
To augment the sparse data set, the workgroup conducted a short-term field study at Lake Monroe, Lake Poinsett, and Yankee Lake mainly in Nuphar and bulrush habitats in July (“average” water level) and November (“low” water level) of 2009. The intent of the study was to compare a more “hydrologically dynamic” ecosystem (Lake Poinsett) with a “less dynamic” one (Lake Monroe and the St. Johns River near Yankee Lake) under various water level conditions to determine whether consistent patterns for several community- and population-level metrics could be seen in the benthos that could be related to hydrology. Macroinvertebrates were collected, processed, identified, and enumerated at various taxonomic levels. They were also assigned to a functional feeding group, and biomass estimates were made.
Finally, crayfish (Procambarus alleni and P. fallax) and the Florida apple snail (Pomacea paludosa) were chosen as key target taxa—crayfish due to their importance in the diets of many aquatic vertebrates and apple snail due to its importance in the diet of the Everglades snail kite and other vertebrate taxa. The workgroup reviewed several previous studies conducted on the ecology and habitat requirements of crayfish and apple snails in the upper St. Johns River basin and in the Everglades. From the literature, the workgroup gleaned some hydrologic criteria that would be protective of the target taxa, including mean water depth, preferred duration of inundation, and dry water season water table depth. They combined this information with data on water levels along the Lake Poinsett MFL transect to make predictions about the potential effect of water withdrawals on benthos.
Results
The workgroup’s analysis consisted of their using best professional judgment given several lines of evidence. First, the workgroup relied heavily on the results of hydrologic modeling for the extreme test scenario as evidence that the benthos will not be greatly affected by a water withdrawal. For the full withdrawal scenario without the upper basin projects added in, the H&H workgroup predicted stage reductions of between 3 and 5 cm at Lakes Monroe and Poinsett, which the workgroup argued are small compared to natural variations (1-2 m) and thus not likely to present a problem for the benthos. The workgroup predicted that there would be no effect of withdrawals on benthos at average water levels, although withdrawals may have an effect at lower water levels. The workgroup noted that stage reductions of 0.10 m, which were predicted to occur frequently at Lake Poinsett under the extreme withdrawal scenario, could have more substantial effects on the benthic macroinvertebrate community. In the words of the workgroup, “the benthic data available (from the 2009 field study and the historical data) do not enable quantitative assessment of how benthic communities would respond to frequent and sustained water level reductions of 7-10 cm.” The potential impacts of the predicted water level changes of 7-10 cm in segment 8 were rated as “moderate” by the workgroup.
Second, the workgroup concluded that the widespread presence of “tolerant” taxa indicates that the benthos have already adapted to stressful conditions. A one-time survey of benthos in 1999 found that a majority (≥50%) of the organisms in the St. Johns River infaunal (in-sediment) benthic community were classified as “tolerant” (i.e., eurytopic = tolerate wide range of environmental conditions). The workgroup suggested that the macroinvertebrate community in the St. Johns River as a whole may thus be insensitive to changes in hydrology, although they admitted that there is high uncertainty associated with this assessment.
The results from their analysis of benthos data collected at three locations in 2009 were not particularly informative. Measures of macroinvertebrate taxonomic diversity, including Shannon’s diversity, Simpson’s diversity, and Pielou’s evenness, were similar among all habitats and for both collection dates. Overall mean taxa richness varied considerably among all habitats at the three locations, with the only clear significant difference being lower taxa richness in Nuphar vs. bulrush habitat in Lake Poinsett in July. Between the two habitats within each lake, there were no clear differences in relative abundance of Odonata (dragonflies) or Ephemeroptera (mayflies). Other taxa (Amphipoda, Mollusca, Diptera, Hemiptera, Oligochaeta, other Crustacea, and Trichoptera) exhibited varying patterns of relative abundance among the sampling sites at the three locations, with no clear trends. The relative abundance of various functional feeding groups in bulrush and Nuphar habitat exhibited considerable variability as well.
One of the few findings from the 2009 study suggesting a link between benthic metrics and hydrology was that longer-lived aquatic taxa (Odonata, Ephemeroptera, Amphipoda) appeared to reach peak relative abundance in areas subject to greater than nine months of inundation and had lower relative abundance in the more hydrologically dynamic Lake Poinsett. On the other hand, motile taxa (Coleoptera and Diptera) and taxa with short life histories (Oligochaeta and Diptera) appeared to exhibit higher relative abundance in shorter-duration wetland habitats. It should be noted that the metric of relative abundance limits the utility of these data because it is not possible to determine whether the taxon of interest (e.g., odonates) are more abundant or less abundant in one environment type than another without knowledge of how the total abundance of all the sampled benthos shifts; absolute abundance of the focal taxon
would have been a more appropriate way to evaluate whether (and how much) a taxon might vary in abundance from environment type to another. The workgroup also found that taxa richness at the nine marsh stations sampled in Lake Poinsett in July 2009 (measured as the number of taxa) versus months of inundation was variable, with a slight downward trend as inundation time increased. Taken together, these data suggested to the workgroup that reduced inundation caused by a water withdrawal should not affect overall benthic taxa richness, although species composition would be altered.
With respect to the target taxa, new data and information were provided on their habitat preferences along the Lake Poinsett MFL transect. These data suggested that the species would not tolerate a 180-day duration dewatering event, of which there are likely to be about 50 such extreme events in 100 years. The workgroup superimposed the predicted water level reductions at Lake Poinsett given the extreme withdrawal scenario onto the minimum, median, and maximum land surface elevations of marshes along the transect. They found that withdrawals are likely to have negligible effects on crayfish and apple snail habitat at higher water levels (because water would still be above the maximum measured land elevation) but minor to moderate effects at lower water levels.
One interesting analysis done by the workgroup evaluated the effects of water withdrawal on aquatic invertebrate production by obtaining annual production rates from several floodplain marsh habitats in the Kissimmee River (which are similar to those in the upper St. Johns River). The workgroup derived an average production rate of 68 g m-2 yr-1. This figure was then used in the biogeochemistry workgroup’s model that relates area-weighted drying of floodplain habitat in Lake Poinsett (hectare-days) to constituent release rates, but substituting the average production rate for release rate. The estimated potential loss of floodplain macroinvertebrate production under the extreme test scenario (Full1995NN) was 516 metric tons (MT) annually for the period 1996-2005. Based on an estimated total annual production in the Lake Poinsett area of 3,500 MT (how this figure was reached is not described in the benthos report), this represents a loss of about 15 percent.
No studies were done or data collected in river segments 4, 5, and 7, but a deductive assessment was made of effects based on observations in other segments where data were collected and comparison of these observations to model-predicted hydrologic changes in those unstudied segments. For example, because the EFDC model predicted minimal to no water level changes in segments 4 and 5, the workgroup inferred that effects on benthic communities would be minor to negligible based on observations in segment 6. Finally, the workgroup did not have sufficient information to make conclusions about freshwater mussels or how benthic communities will affect fish populations and vice versa.
The final results for the levels of effect from the extreme withdrawal scenarios are given in Table 3-8. Uncertainty is high in almost every segment because of the lack of a predictive hydroecological model, the lack of monitoring data, and the considerable variability observed in results of the 2009 study.
Critique
The workgroup’s analysis was based on little data on freshwater benthos in the St. Johns River, which limited the workgroup’s ability to make reliable conclusions and also greatly limited the Committee’s ability to determine the validity of these conclusions. Although the workgroup suggested that the changes in water level predicted under the most realistic future
TABLE 3-8 Summary of Withdrawal Effects on Freshwater Benthos for the Two Worst-Case Scenarios: Full1995NN for Segments 6-8 and FwOR1995NN for Segments 2-3.
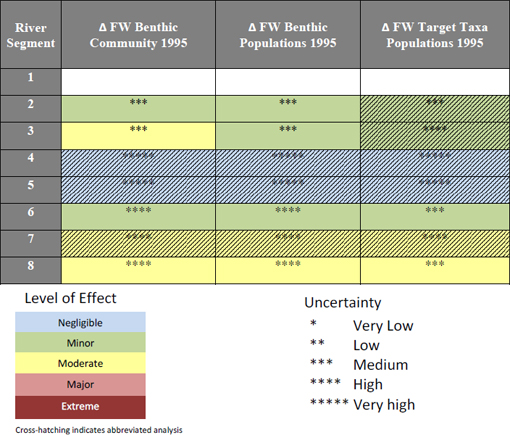
SOURCE: Mattson et al. (2011).
Blank cells indicate not applicable to these river segments.
scenarios likely will have minor effects of benthic populations, no data were presented to support this conclusion. Unfortunately, none of the results gleaned from the 2009 study could be attributed uniquely to effects of hydrologic conditions. High variability in the data prevented the workgroup from separating the effects of hydrology from seasonal and other possible water quality effects. The Committee’s concerns are somewhat lessened by the knowledge that the likely future withdrawal scenario will reduce water levels by much less than the extreme scenarios evaluated by the workgroup. Nonetheless, without a hydroecological model that describes the relationship between water level changes and benthic metrics, it is impossible to fully support the benthos workgroup’s conclusions. The lack of quantitative models may reflect the state of the science in benthological research; nonetheless, this study illustrates the need for such models to be developed.
Clearly future studies should address this paucity of data and information and strive to develop relationships that can be used to either confirm the workgroup’s predictions or revise them. The workgroup recognized the limitations of their analysis and proposed a future monitoring strategy (Mattson et al., 2011) to reduce the uncertainty associated with their predictions. With respect to that strategy, the Committee offers the following suggestions that expand on some of the recommendations in NRC (2009). First, the limitations of relative abundance as a metric should be recognized, as it depends on the nature of the comparative analysis being done. Thus, looking at relative abundances of a taxon can be useful if one wants to explore differences in space or time for a specific environment type, but not across environment types. Second, the workgroup’s continued focus on ecosystem function as opposed to ecosystem structure is not sufficiently discussed or supported. Indeed, many of the ratios for which they intend to collect data (e.g., between functional feeding groups and other variables) are known to be mathematically ambiguous at best and misleading or uninterpretable at worst. The motility, voltinism, and habitat suitability indexes can be subjected to arbitrary threshold selection without reference to real world situations. Finally, it will be important for the workgroup to conduct broad-scale analyses to gain the more detailed understanding required to make informed decisions. For example, it is hoped that the workgroup’s laudable intention to establish long-term sites that are sampled during the same seasons and for the same habitats can be expanded in terms of the organisms evaluated (i.e., beyond Odonata). Similarly, the desire to better understand the linkages between benthos and fish should extend beyond sport fish to other species that might be threatened (such as the small sunfish that concentrate in shallow edge areas), as revealed by the analyses of the fish workgroup.
Estuarine Benthos
Conceptual Model
During Phase II of the WSIS, the benthos workgroup developed a conceptual model for the effects of water withdrawals on estuarine benthic communities and selected estuarine populations (see Figure 3-8). The model portrays linkages between increased water withdrawals and changes in flow and salinity, including movement of isohalines, along with causal linkages from the SAV and phytoplankton workgroups. These lead to changes in benthic community structure and white shrimp and blue crab populations organized in the conceptual model in a box and arrow format. The current format of the conceptual model is generally reasonable and appropriate, except that it does not include an output link to the wetlands wildlife workgroup.3
The only explicit hypothesis presented regarding estuarine benthos was that changes in salinity cause changes in benthic community structure and populations of white shrimp and blue crab, ultimately causing indirect effects on fish. No hypotheses were presented about effects to wildlife directly or indirectly through impacts to fish.
________________________
3 The wetlands wildlife workgroup used the results of the benthos workgroup, and so this likely was just an oversight on the part of the benthos workgroup.
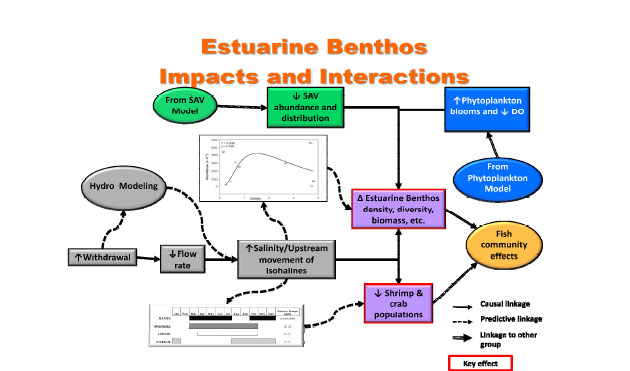
FIGURE 3-8 Estuarine benthos conceptual model.
SOURCE: Mattson (2011).
Methods
Data for the analysis of benthic macro-infaunal community structure were derived from a long-term data set (1973-1996; ten sites) of the Florida Department of Environmental Protection (Ross, 1990) and a short-term data set (2000; seven sites) from the U.S. EPA’s Environmental Monitoring and Assessment Program (Strobel and Heitmuller, 2001). The sites were interspersed along the lower St. Johns River. Additional data on white shrimp and blue crab were obtained from the Fisheries Independent Monitoring Service (FIMS) Program (MacDonald et al., 2009), coupled with supporting material from the literature on life history and environmental requirements of these species. The sampling procedures for each program were described in sufficient detail in the benthos workgroup report (Mattson et al., 2011).
Analysis of the macro-infaunal benthic data sets was conducted with Primer software (Clarke and Warwick, 2001) using non-metric multi-dimensional scaling (MDS) of logn (x+1) taxon abundance (species, genera, family and phyla) combined into station-substrate categories, and further classified by cluster analysis. According to Mattson et al. (2011), the workgroup used a weighted Spearman rank correlation to relate multivariate ordinations of community structure with measured water quality variables (temperature, salinity, pH, dissolved oxygen). They selected the best match of these ordinations to investigate different levels of environmental complexity and tested for significance of the ordinations (Clarke and Warwick, 2001). There was no discussion, however, of these results.
Comparison of benthic macro-infaunal abundance and sediment grain size was problematic because the 300 sediment samples taken by the workgroup were not associated with the organism samples used for the community analyses. To overcome this problem, the workgroup approximated spatial trends in grain size distribution using ArcGIS and kriging with a semivariogram model to interpolate grain size in areas where benthic samples were taken. The Committee assumes that the interpolated grain size distributions were used to form stationsubstrate combinations in the data matrix for the statistical analyses, but this was not actually stated.
Based on literature and prior experience, the workgroup used linear and/or nonlinear regression analyses to relate mean macro-infaunal abundance and abundances of the most common taxa with mean salinity. The nonlinear models were based on the assumption that an optimal salinity range exists, and that abundance is reduced in non-optimal salinity ranges (bellshaped curve). The approach used a standard Levenberg-Marquardt procedure to fit the independent variables to benthic abundance data, which is reasonable.
Results
Effects of Salinity on Benthic Infaunal Community Structure. Macro-infaunal communities assembled by several statistical techniques, including cluster analysis, formed two groups based on station–substrate combinations, coupled with superimposed mean salinity ‘bubbles.’ The two clusters generally separated station–substrate combinations into low salinity (0.4–5.8 psu) and high salinity (13.6–25.7 psu) groups. None of the other water quality parameters showed any meaningful patterns.
The importance of mean salinity as a directive factor for change in mean infaunal benthos abundance is supported by the nonlinear regression results, which indicated that mean abundance was higher at lower mean salinity stations (r2 = 0.55, p = 0.004). Peak abundance occurred at a mean salinity of 0.4 psu, and mean abundances generally were highest at salinities < 2–3 psu. The estuarine benthos workgroup suggested that other factors (e.g., heavy metal and organic contaminants) likely contributed to declines in mean abundance in the more saline region, but this seems speculative.
Results of linear regression analyses (for Phylum and Class) and nonlinear regressions for all taxa classification levels below Class revealed that nine taxa classes (mostly freshwater benthos) responded negatively to mean salinity; six classes (mainly marine groups) responded positively; 14 classes showed a peak abundance relative to mean salinity; and 19 classes had no relationship with mean salinity. Of the 14 taxa with optimal mean salinity delineations, nine were at the genus or species level of identification.
The benthic workgroup compared the worst-case withdrawal scenario (FwOR1995NN) and one reflecting a potential future scenario (FwOR2030PS) to the baseline scenario (Base1995NN). The FwOR2030PS scenario leads to up-river movement of the 1, 3, 5, and 7 psu isohalines, mainly in segment 2 and to a lesser extent in segment 3. Based on partial duration– frequency curves for the upper oligohaline of segment 3 (SR16/Green Cove Springs), the workgroup concluded that small salinity increases would occur (on average) annually and these would increase under drought conditions (5–10 yr recurrence). Bottom salinity was predicted to increase up to 4 psu for about 10 days during a 1-in-10 year drought under FwOR2030PS. The workgroup also reported that there were minimal differences in the predicted salinity outputs for
the FwOR2030PS and FwOR1995NN scenarios. In Segment 2, areas with low salinity would have comparatively larger salinity increases, but areas with salinities ≥15 psu would not change much under FwOR2030PS. Finally, salinities in segment 1 were predicted not to change much across any withdrawal scenario, except those involving deepening of the navigation channel.
Work commissioned by the District revealed that benthic community structure in the river under current conditions was highest in the lowest salinity areas, and that most benthic groups peaked in abundance at salinity < 5 psu (Montagna et al., 2010). The loss of low salinity habitat (≤5 psu) as a result of water withdrawals is thus a concern for estuarine benthic community structure. Segment 2 is the main area where salinity increases could affect benthic taxa, particularly aquatic insects, which generally are stenohaline (i.e., have narrow salinity tolerances). However, the predicted increases are of short duration for most salinity-tolerant estuarine taxa, except during drought periods.
The preponderance of information in the literature indicates that estuarine infauna benthos are euryhaline (have broad salinity tolerances), and because there appears to be no relationship between SAV and benthic infaunal abundance in the lower river, the workgroup concluded that water withdrawals should have minimal impacts on these benthic taxa (even if SAV were affected). In contrast, the benthic workgroup concluded that there would be no impacts on epifaunal abundance, which is related to SAV cover (Soulen, 1998), because of the predicted minimal loss overall of SAV. Whether increases in salinity might directly affect epifauna independently of changes in SAV coverage was not addressed.
According to the benthic workgroup, low DO (< 2 mg/L) occurs in the lower river about 10 percent of the time. In addition, Diaz and Rosenberg (1995) found that DO < 3 mg/L is an important threshold that adversely influences benthic communities. Nonetheless, the workgroup concluded that most benthic organisms are tolerant to low DO situations and thus most benthic infaunal organisms would not be affected by this level of reduction.
Effects on Estuarine Target Taxa Populations. Two taxa—blue crab (Callinectes sapidus) and white shrimp (Litopenaeus setiferus)—were chosen from the FIMS report (MacDonald et al., 2009) for further analysis relative to water withdrawal effects. The FIMS report showed that highest blue crab abundances for any gear type occurred mainly in backwater areas with salinities of 12–18 psu (which suggests the importance of shallow water). White shrimp were most abundant in summer–fall collections with mean salinities in the range 12–18 psu; abundances were similar in mainstem and backwater (mainly marsh and oyster) habitats.
The FIMS report analyzed the relationships between several measurements of benthic and fish abundance and river inflow, which presumably would decrease under water withdrawal scenarios. The lagged regression analyses of blue crab abundance versus inflow generally had negative slopes—that is, increasing abundance with decreasing inflow. This relationship had the maximum effect under the FwOR1995NN scenario (worst case) compared to the scenarios that added water back to the St. Johns River. Only the regressions for the 183-m seine (180 day lag) (r2 = 0.26) and the 6.1 m otter trawl center-of- abundance (180 day lag) were significant (adj r2 = 0.47; all sizes of blue crab). The predicted small changes in SAV coverage and tidal creek salinity appear to be a minor influence on blue crab abundance. In addition, the blue crab’s flexible feeding habits suggest that the minor changes in infaunal prey abundance will not be important.
The workgroup’s analysis of the combined [MacDonald et al. (2009) and 2009-2010] data sets found no significant relationship between white shrimp abundance (for any gear type)
and lagged or unlagged freshwater inflow. In contrast, the relationship between the center-ofabundance for white shrimp and freshwater inflow varied by gear type and lag periods. For example, the 30-day (r2 = 0.48) and 90-day (r2 = 0.66) lagged periods for the 21.3 m seine were both significant (p < 0.05), as were the 6.1 m otter trawl and 30-day lagged inflow data (r2 = 0.42, p < 0.05). These results indicate that white shrimp would move upstream under the FwOR1995NN (worse case; max 3.2 km) and FwOR1995PN (max 3.2 km) scenarios; in contrast, downstream movements would occur for the Base2030PS scenario (–2.6 km), and mixed results (–0.3 to 1.6 km) would occur for the FwOR2030PS scenario.
Table 3-9 shows the results for effects on estuarine benthos for the FwOR1995NN and the FwOR2030PS scenarios, using the same three metrics as the freshwater analysis: community changes, population changes, and changes to target taxa. For both of these water withdrawal scenarios, the overall response was found to be negligible to minor, and changes in community structure, total abundance, and abundance of white shrimp and blue crab populations all were minor in this scenario. The basis for the small response is that this scenario caused only small changes in salinity. Moreover, the workgroup concluded that the benthic taxa of interest generally are tolerant of potential increases in salinity, reductions in DO, and loss of SAV.
TABLE 3-9 Summary of Withdrawal Effects on Estuarine Benthos for both the FwOR1995NN and the FwOR2030PS Scenarios.
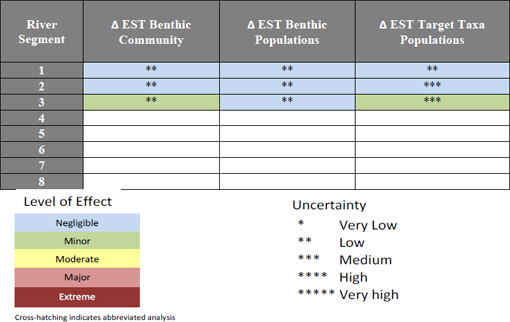
SOURCE: Mattson et al. (2011). Note: Blank segments indicate areas that were not assessed.
Critique
The estuarine benthic analyses and interpretations were considerably better than those conducted for the freshwater benthos because more data were available to consider and stronger data analyses were completed. However, the Committee concludes that the levels of uncertainty for the estuarine benthos analyses were underestimated, particularly in river segment 1, because of limitations in the spatial coverage of the data sets (limited data in river segment 1) and the low overall predictability of the FIMS-based statistical models (r2 < 0.55). Overall, we conclude that the low to medium uncertainty for river segments 1-3 are optimistic and probably should be higher (medium to high).
With regard to the analysis of benthic macro-infaunal community structure, the lack of stations clustered in the range of mean salinity of 5.8–13.6 psu suggests that there was limited spatial coverage in the databases used for the analysis. How “substrate” was evaluated in these groupings needs further explanation, and why the workgroup did not conduct analyses to search for significant differences in community structure is unclear. As mentioned above, the report does not describe results from the statistical analysis of relationships between multivariate community structure and measured water quality variables.
Relationships between taxa and environmental conditions are more clearly identified when genus- or species-level identifications of aquatic organisms are examined (e.g., Peterson, 1988) rather than higher level taxonomic classifications because pooling of species with differing physiological capabilities averages out responses. In addition, graphs and tables presented in the estuarine benthos report to illustrate the three general types of responses suggest that some of the negative and positive linear responses were driven by a few data points that skewed the slope of the regression line, which may have led to inappropriate interpretations.
The Committee is not convinced that several statements made by the workgroup are justified by its analyses. For example, more work on the direct effects of salinity on epifauna needs to be completed before epifaunal impacts can be dismissed. In addition, potential impacts on infaunal and epifaunal benthic organisms of salinity increases and coupled low DO levels, which could occur periodically in the lower river, should receive further study.
In addition to the above issues related to specific findings in the results section, the Committee has other concerns. Without data to investigate the relationship between benthic metrics and water withdrawals, the workgroup depended heavily on the results of the H&H, littoral, and fish workgroups and on the work of MacDonald et al. (2009) updated with 2009-2010 data. Second, the term “population effects” used in Mattson et al. (2011) is misleading in that the effects are based on a multitude of classification levels (Phyla, Class, Family, etc.), which are really not populations but groups of similar species that cannot be identified. Finally, there were no connections in the conceptual model or in the text between the effects of water withdrawals on estuarine benthos and effects on vertebrate groups (e.g., birds, snakes) via fish impacts.
Overall, the estuarine benthos analyses were more sophisticated than for the freshwater benthos. The multivariate data analyses were more reasonable than the salinity and abundance analyses because a number of data points in the latter analyses were far outside the limits of the model being used (e.g., outliers) and disproportionately influenced the fit of the model and form of the relationship. Also, there were no direct statistical models for abundance and inflow such that quantitative predictions could be directly made (as for other ecological workgroups of the WSIS). The interpretations appear to have been derived from how salinity changes with
withdrawal scenarios and how abundance relates to salinity. The literature supports the abundance-versus-salinity relationships, but other factors may influence distribution and abundance besides salinity (i.e., sediment composition).
The benthic workgroup provided several suggestions for future work on mitigation and data collection, all of which are appropriate and important to consider. The workgroup expressed concerns about the lack of station-specific sediment composition and associated benthic communities. They also discussed the issue of water withdrawal effects on meroplankton (pelagic larvae of benthic organisms), which are important food sources for many fishes. Meroplankton may not be influenced by salinity change itself, but by reductions in the volume of “zones of preferred salinity” along the salinity gradient (Peebles et al., 1991). The workgroup indicated that future work was needed on meroplankton and potential effects of water withdrawals on circulation patterns that might affect meroplankton, and the Committee agrees.
Freshwater Fish Assemblages
Conceptual Model
A conceptual model for the effects of water withdrawals on freshwater fish assemblages, as well as potential direct and indirect effects on other ecological processes and conditions, is shown in Figure 3-9. The model portrays the linkages between changes in water levels, flow, floodplain inundation and frequency, and entrainment/impingement impacts, leading to changes in various vital fish metrics at different levels of organization. The processes of concern to the fish workgroup are linked to both hydrologic/hydrodynamic forcing functions and ecological changes of other workgroups (e.g., SAV, phytoplankton, benthos, wildlife). The Committee views the conceptual model as reasonable and appropriate. Although there are no explicit hypotheses for the freshwater fish component, the conceptual model provides implicit general hypotheses of the potential direct effects of water withdrawals on fishes and ultimately indirect effects on wildlife.
Methods
The fish workgroup allocated fishes to five freshwater habitat-use guilds based on the literature, and then examined representative members of these guilds relative to water withdrawals. The underlying assumption of this approach is that all members of a guild would respond similarly. The geographic focus of the freshwater fish analysis was the Upper Basin between Lake Poinsett to Lake Woodruff, and all seven study sites in this stretch (except for the site at Lake Poinsett) are MFL transects. Based on the conceptual model, the fish workgroup integrated input data mainly from the H&H results and the SAV results. They compared four withdrawal scenarios—Full1995NN, Base1995PN, Full1995PS and Full2030PS—to the baseline scenario (Base1995NN) at the mean annual 30-day continuous low condition, the mean
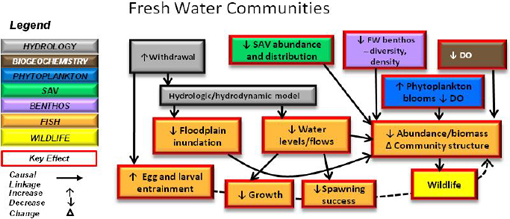
FIGURE 3-9 Conceptual model of the potential effects of water withdrawals on the fresh water fish community of the St. Johns River.
SOURCE: Miller et al. (2011).
condition, and the 30-day continuous high condition at the seven locations. They also examined the seasonality of annual (1976-2008) water-level fluctuations (timing and duration of flood pulse) at Lake Poinsett for all four scenarios, and calculated mean monthly recession rates (cm d-1) at Lake Poinsett and MFL transect H1 for the Base1995NN and Full1995NN scenarios.
The potential degree of impacts on four of the five habitat-use guilds was estimated, using best professional judgment, by examining the ecology of selected species of each guild with reference to each scenario listed above. The final habitat-use guild—littoral zone, marsh, and floodplain small fishes assemblages—used a model that generates fish densities based on flooding duration developed for a similar habitat-use guild in the Everglades (DeAngelis et al., 1997). The model was used along seven MFL transects where fish densities were calculated. The MFL transect data were compared to data generated by the use of limited (temporal and spatial) stage-duration curves and output from the DEM model to estimate a percentage change in densities from baseline. The fish workgroup indicated that the two sets of results were comparable, but comparable data were not provided. For consistency in approach, throughout the analysis the workgroup used data estimates only from MFL transects.
As part of their efforts to analyze the potential impacts of entrainment/impingement on fish assemblages, the fish workgroup conducted a sampling program to determine the species composition and abundance of spawning fish in river reaches where water withdrawal structures have been proposed. This work was started in 2008 and was completed at the end of summer 2011.
Results
Water Levels, Seasonality, and Recession Rates. The H&H output comparing the Full1995NN scenario (worst case) to the Base1995NN scenario indicated that from Lake Harney downstream, the mean, mean 30-day low, and mean 30-day high water levels would change
minimally (– 1 cm). However, mean water level upstream of Lake Harney dropped by 4-6 cm, and was variable at 30-day low (2-3 cm) and 30-day high (4-5 cm). In contrast, inclusion of the Upper Basin projects (Base1995PN) yielded a marked increase in predicted mean and mean 30-day low water levels relative to Base1995NN from Lake Poinsett to Lake Harney and no change across the rest of the freshwater reaches of the St. Johns River. Mean 30-day high levels also did not change across the sample domain. A full withdrawal combined with completion of the Upper Basin projects (Full1995PS) showed minimal effects on water levels for the mean and mean 30-day low, whereas mean 30-day high levels were lower by up to 4 cm. Finally, adding 2030 land use change (Full2030PS) showed minor effects (< 1 cm) on water level, except for the mean 30-day high difference between Lake Poinsett and H1. The fish workgroup concluded that completion of the Upper Basin projects is a “near-term” solution to projected water-level decreases. To protect future fish access to the floodplains, the land use changes must occur as predicted by 2030, or else declines of 3-4 cm (in the mean 30-day highs) would occur and would impact fish floodplain habitat use upstream of Lake Harney.
To examine changes in the timing and duration of flood events due to water withdrawals, the fish workgroup compared the Base1995NN scenario to the other predicted scenarios by month at Lake Poinsett. Under the Full1995PS and Full2030PS scenarios, the one-day lows shifted to earlier and later times of year (scenario dependent) although 50 percent remained in the April to June time frame. In contrast, the one-day highs shifted to later in the year in all scenarios compared to baseline conditions, but they still remained in the August to October time period. The authors concluded that these temporal shifts are insignificant, although no support was provided for the assertion. Finally, the worst-case scenario (Full1995NN) did not increase mean recession rates (cm d-1) markedly at Lake Poinsett or at the downstream H1 transect; the maximum increase (–0.26 cm d-1) occurred in June. The other scenarios (Full1995PS and Full2030PS) had smaller effects on recession rates.
Impacts to Fresh Water Fish Assemblages. Based primarily on water level predictions from the H&H models, no measurable impacts were predicted for four of the five freshwater habitat-use guilds. These conclusions were based directly on differences in water levels (high vs. low), flow changes (fast vs. slow), preferred habitat and lateral position of the guild in the watershed (floodplain vs. main channel), body size, and changes in SAV between the tested scenarios relative to baseline conditions. One exception to the lack of response of the habitat-use guilds was the redbreast sunfish, Lepomis auritus, a member of the Large Sunfish Assemblage. Predicted reductions in fall flows (11-18% < baseline) between Lakes Poinsett and Harney as part of the Full1995PN and Full2030PC scenarios may reduce recruitment success because this species prefers flowing water (Bonvechio and Allen, 2005). The fish workgroup suggested that elevated growth during higher spring flows (17-27% > baseline) may offset this reduction.
For the floodplain small fish assemblage, the fish workgroup used a quantitative hydroecological model that generates fish densities based on flooding duration. To generate fish density data for the St. Johns River, the workgroup used data in DeAngelis et al. (1997) to construct a regression model (r2 = 0.78) between months of continuous flooding and fish density (# m-2). Five of the seven MFL transect sites showed decreases in mean small fish density under most scenarios, but Lakes Monroe and Woodruff showed no change for scenarios without sealevel rise. Upstream of Lake Monroe, reductions ranged from –9.3% (H1) to –11.3% (County Line). In Lake Monroe and downstream, mean differences ranged from –0.2% (Lake Woodruff) to –10% (Pine Island). There appears to be a transition zone near Pine Island above which sea
level rise does not influence fish densities much, but further downstream sea level rise influences water levels such that mean increases occur because of longer flooding times.
Furthermore, the fish workgroup indicated the potential near-term scenario (Full1995PN) would cause a reduction in the floodplain standing crops of small fish assemblage members by about 4.7 percent compared to the Base1995NN condition along about 100 km of the St. Johns River between Lakes Poinsett and Harney. If expanded to the entire floodplain between these lakes, this would correspond to about 17 to 23 metric tons (19-25 English tons) of small fish annually, which may negatively impact wading bird populations.
Finally, the fish workgroup noted that their approach was simplistic and did not take into account the cumulative impacts of multi-year droughts. The table on level of effects for freshwater fish is shown later alongside the impacts to estuarine fish.
Entrainment and Impingement. Between 2008 and 2009, larval fish collections were made at six locations that were anticipated to be potential intake sites along the river. Miller et al. (2011) indicated that more than 700,000 fish larvae and eggs were collected at the various sample locations for 16 different fish species. Spawning species vulnerable to collection by the workgroup’s gear and sampling methods were identified starting in late November, peaking between February and May, and ending by mid-August of both years. Spawning periods differed among species, and in some areas it varied by year. There was also clear spatial variability in the abundance of egg and larval fishes. For example, mean catch was 2.5 to 5 times higher at SR46 and Lake Monroe than the other sites. Although SR50 had the lowest overall catch, it had the highest catch of American shad (10 times more than all other sites). Hickory and Blueback shad were highest at SR46, and American shad was second most abundant at this site. These results indicate SR50 is more important for these species than overall catch would suggest.
Critique
Overall, the freshwater fish workgroup posed appropriate questions related to potential impacts on fish assemblages and addressed them as much as available data would allow. The workgroup carefully examined impacts to fish along seven MFL transects and at Lake Poinsett in appropriate scales relative to the projected water level reductions. They were able to quantify different responses due to water withdrawals based on geography.
The Committee has a number of concerns, however. First, the approach focused mainly on mean water level with only a few comparisons of extreme levels (low and high). In addition, it did not capture cumulative effects of water withdrawals on fishes, such as concentration of fishes into reduced water volumes, causing increased predation pressure, and loss of prey for wading and fish-eating birds, snakes, and mammals. Consecutive drought years, which likely would have considerably more negative impacts on fishes, were not examined. Uncertainty in the analyses also stems from the inherent uncertainty in the H&H predictions (see Chapter 2 and NRC (2010) for further discussion of the uncertainty in the hydrologic and hydrodynamic models). Finally, the workgroup report was written as if the entire assemblage of fishes within each habitat-guild had been examined when, in fact, only common representatives of each assemblage were examined. This over-simplification is illustrated in the redbreast sunfish difference compared with the other members of the same habitat-use guild.
The fish workgroup focused its discussion of entrainment and impingement on various shad species and did not fully consider all the species they collected, which included gobies, silversides, and various centrarchids. Furthermore, the workgroup noted that their diversity and abundance data were based on collection of specimens “…vulnerable to [sampling by] our gear …”, suggesting that some species were underrepresented in their data sets. The data should be used to evaluate where to permit intake structures based on the spatial and temporal spawning patterns of the full array of fishes collected. The workgroup indicated that there should be no problems with intake between September and November but special considerations will need to be made during other months, in particular at the SR50 site because of the high catch of shad species and overall high diversity of fishes.
As noted by the fish workgroup, careful thought and planning will need to be done to reduce the loss of egg and larval fishes through intake screens. This includes the placement of intake structures, the type of intake structures used, intake water velocities permitted, and the proportion of potential spawning sites and larval habitat (mainly shad) near intake structures. Some of the preliminary data suggest this can be accomplished only when the full fish analysis is completed. Furthermore, the use of Empirical Transport Models (models used to project intake impacts across a larger-scale integrated area) will allow examination of cumulative impacts from the multiple intake sites being considered along the St. Johns River.
Estuarine Fish Assemblages
Conceptual Model
A conceptual model for the effects of water withdrawals on estuarine fish assemblages is shown in Figure 3-10. The models portray the linkages between increased water withdrawals and changes in water levels, flow, and changes in spatial coverage and distribution of salinity zones leading to changes in various biological vital metrics of selected fishes. As with the freshwater component, the Committee views the conceptual model as reasonable and appropriate.
Methods
The H&H models indicated that the Full1995NN was one of the worst-case scenarios relative to salinity changes from the baseline conditions; the limnetic habitat was reduced about 7 percent in area, and the polyhaline and euhaline habitats increased by almost 19 percent. Mean 60- and 120-d values changed less. The long-term scenario Full2030PS showed little change in salinity area from baseline conditions.
Analysis of the estuarine fish is based almost exclusively on the FIMS report (MacDonald et al., 2009; coupled with 2009-2010 new data sets), which used a 21.3-m bag seine (2005-08), 183-m seine (2005-08), and a 6.1-m otter trawl (2001-08) to obtain fish data. Each gear type collects different species, size classes, and relative abundances. MacDonald et al (2009) constructed linear and quadratic regressions for fish distribution and abundance of “pseudospecies” (species separated into size classes) and freshwater inflow by gear type. Daily
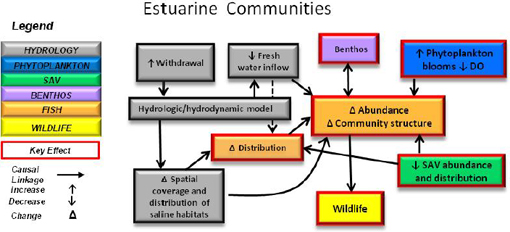
FIGURE 3-10 Conceptual model of the potential effects of water withdrawals on the estuarine fish community of the St. Johns River showing key effects considered.
SOURCE: Miller et al. (2011).
freshwater inflows were estimated from USGS gauges at DeLand and Rodman Dam near Orange Springs; these were summed to estimate total daily inflow into the St. Johns River upstream of the FIMS sampling regions. This approach did not account for additional inflow from smaller tributaries for which no data exist. The data screening and statistical approach used in MacDonald et al. (2009) was modified by the workgroup based on the approach outlined in Helsel and Hirsch (2002) and Helsel (2011).
Abundance was reported as trip abundance (based on individual monthly samples) and annual abundance (summed monthly samples) by gear type. Trip abundance was calculated based on periods of highest abundance of each pseudospecies as indicated by length–frequency plots. The geographical center (km from mouth) of the trip abundance of each pseudospecies was used to calculate distribution responses to changing inflow (called center-of-abundance) at the same lagged time periods. Each monthly sampling trip was a single data point in the regression with the center-of-abundance being calculated for all samples within each trip.
Pseudospecies were selected initially based on having > 100 individuals by gear type and at least 5 percent frequency of occurrence in all samples, and mean daily flow data used were lagged at 30-day intervals from 30 to 360 days. This produced 444 pseudospecies–lag combinations for further processing. These non-transformed pseudospecies–lag combination data were compared to inflow with a Spearmean’s rho statistic (Helsel, 2011) and the combinations with rho > 0.4 and p < 0.05 were retained for further analysis. Because some of the Spearman results of the pseudospecies–lag data had similar rho values for multiple lag periods, the District further reduced the data combinations by processing only those with rho values that were within ±3% of the highest rho. The District took those data and processed four linear regressions with various levels of transformation: (1) no transformation, (2) dependent variable transformed, (3) independent variable transformed, and (4) both variables transformed. The District also calculated a predicted r2 value (pred r2) based on the PRESS statistic (Predicted RESidual Sum of Squares statistic) for each regression, and the combinations with the best linear
r2 value (and best pred r2) were selected for further analysis. Finally, the District took these equations and processed them relative to the output from various H&H withdrawal scenarios related to the baseline. The final set of pseudospecies–lag period combinations included 20 pseudospecies for center-of-abundance (distribution), 21 pseudospecies for annual abundance, and 40 for trip abundance (Miller et al., 2011).
Finally, like the other workgroups, the fish workgroup quantified the ecological significance of their data (for each FIMS zone and fish assemblages) by developing three metrics: strength, persistence, and diversity.
Results
Center-of-Abundance Responses. Twenty (20) pseudospecies (2 freshwater and 18 estuarine/marine) had significant median center-of-abundance regressions versus inflow. The r2 values ranged between 0.27 and 0.73 (mean = 0.42). All pseudospecies moved downstream with increasing freshwater inflow, which expanded the freshwater area while reducing the saltwater area. Application of the linear regressions for these 20 pseudospecies to the H&H model outputs indicated that for the Full1995NN, Half1995NN, and Full1995PN scenarios, the center-ofabundance moved upstream with reduced inflow compared to the Base1995NN; the changes were small (2.9 km; 1.8 miles). In contrast, movement varied for the other scenarios, with all 20 pseudospecies moving downstream for the Half2030PS scenario; 13 moving downstream and 7 upstream under the Full2030PS scenario; and 13 moving upstream, 4 downstream, and 3 not moving under the FwOR2030PS scenario. Maximum movements ranged from 1.2 km (0.8 miles) downstream for white shrimp (≤15 mm TL size class only) to 2.8 km (1.7 miles) upstream for striped mullet (31-45 mm TL size class only).
Abundance Responses. Of the 61 pseudospecies that exhibited a strong change in abundance versus freshwater inflow change, 13 were freshwater and 48 estuarine/marine. Sizedependence and lag flow characteristics greatly influenced the abundance response of many pseudospecies. The general pattern was that when freshwater inflow was reduced, a decrease in the freshwater assemblage abundances (e.g., bluegill, channel catfish, white catfish, and redear sunfish in selected size groups) was observed, along with an increase in estuarine/marine assemblage abundances (e.g., white mullet, various gobies and flounders, Atlantic croaker, spot, spotted seatrout, and blue crab for selected size groups). This pattern generally reversed when freshwater inflow was increased. For example, the pooled freshwater assemblage members increased under the Half2030PS and Full2030PS scenarios relative to the Base1995NN scenario, but not in the more extreme FwOR2030PS. In contrast, the pooled estuarine assemblage members changed less from scenario to scenario, probably due to their euryhaline nature. The sciaenid and marine assemblages changed considerably, shifting mainly from very abundant under the Full1995NN, Half1995NN, and Full1995PN scenarios to less abundant under the Half2030PS and Full2030PS scenarios. The fish workgroup indicated that changes occurred mainly due to the shifting interface between oligohaline and low mesohaline regions of the St. Johns River.
Levels of Effect. Given the large number and variability in the pseudospecies considered, it is difficult to make gross generalizations about the impacts of water withdrawals
on fish in the lower St. Johns River. Nonetheless, the fish workgroup produced a level-of-effects table found below as Table 3-10. The table shows the effects of the Full1995NN scenario, which was deemed to have the largest overall effect on fish assemblages. The top half of the table (segments 1-3) reflects the estuarine fish analysis, and the bottom half of the table reflects the results of the freshwater fish analysis. It should be noted that the entrainment/ impingement analysis (first column in Table 3-10) is incomplete, such that those results and interpretations are preliminary under all scenarios.
To determine the uncertainty rankings in Table 3-10, the fish workgroup (like the other workgroups) assessed the strength of the statistical models used, supporting evidence from the literature, and their understanding of the responsible mechanisms. Statistical model strength was based on the calculated r2 and pred r2. Supporting evidence scores were based on the number of studies that could provide support for withdrawal effects documented in this study. Finally, causal mechanisms were thought to be well understood for almost all pseudospecies, except for a few that the fish workgroup thought required higher uncertainty.
TABLE 3-10 Summary of Withdrawal Effects on Fishes for the Full1995NN Scenario.
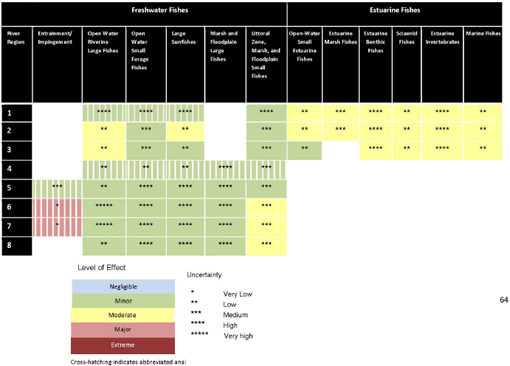
SOURCE: Miller et al. (2011).
Critique
Overall, the fish workgroup is commended for modifying their approach to this complex issue, in response to the Committee’s input over the course of two years. The fish workgroup is the only one to have found a “major” response to water withdrawal, although this was for an extreme scenario that is not plausible. Because the response surrounds the potential entrainment or impingement of larval organisms at intake sites, it is imperative that this analysis be completed soon and that precautions are taken when designing intake structures to avoid these impacts. The workgroup should evaluate the times of year when entrainment/impingement is important (such as during seasonal spawning peaks). If protective intake structures cannot be constructed, the District may need to write conditions into its permits that require water suppliers to reduce surface water extraction during those peak recruitment periods.
Throughout the text of Miller et al. (2011) responses of both pseudospecies and assemblages are discussed in an equivalent manner, and that is not appropriate because an assemblage is a collection of pseudospecies that represent what is collected in an area. The Committee suggests that the fish workgroup consider using only one of these designations (assemblage or pseudospecies) throughout the document for clarity, or provide a table indicating which pseudospecies responses were used to delineate the overall assemblage responses. Also, the detailed changes noted for each individual pseudospecies within a certain fish assemblage are probably not as important as the total number of changes within the assemblage relative to the modeled scenarios. That is, changes in the fish assemblages are more important in estimating the impacts from proposed water withdrawals because those changes may influence food web integrity and energy flow within the St. Johns River.
The wetlands wildlife workgroup assessed the potential effects of surface water withdrawals on the 320 species of vertebrate wildlife that depend on the St. John’s River floodplain habitat. Their stated goal was to identify any potential adverse impacts to floodplain wildlife. The workgroup used a qualitative approach to evaluate impacts, in large part because of the lack of quantitative data on species responses to changing hydrologic regimes for many of the species found in the watershed. Information gleaned from the literature, in combination with input from the work of the wetlands, benthos, and fish workgroups, was used to make best professional judgments on the effects of withdrawals on wildlife with respect to salinity in river segments 1 and 2, and with respect to altered hydroperiod in segments 7 and 8. To accomplish this, species were assigned to one of four “wildlife hydrologic types,” groupings of species with similar hydrologic requirements and so, it is assumed, similar responses to hydrologic change.
Conceptual Model
A conceptual model depicting the potential effects of water withdrawals on wetland wildlife species was developed to investigate possible responses to alterations in hydroperiod and salinity (Figure 3-11). Inputs include the results from the H&H workgroup on the predicted changes in flow, water depth, and salinity for each scenario that was investigated. The
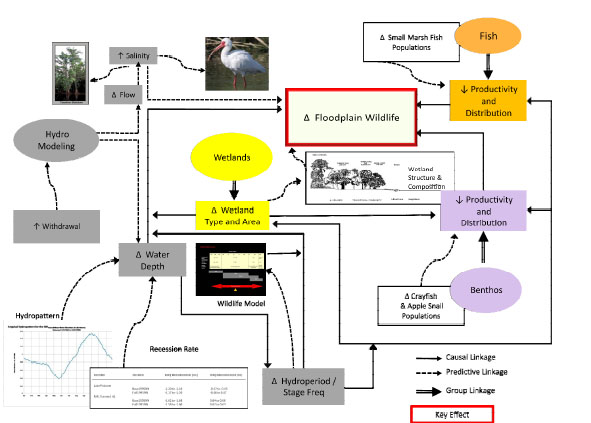
FIGURE 3-11 Conceptual model for the wetlands wildlife workgroup.
SOURCE: Curtis (2011).
workgroup predicted that changes in water depth would lead to changes in wildlife abundance as mediated by the changes in wetland type and area (shown as an input from the wetlands workgroup). The results of the fish and benthic invertebrate workgroups were integrated to make qualitative estimates of changes in secondary productivity of the floodplain wetlands. Benthos and fish, particularly crayfish, apple snails, and small marsh fish, serve as prey for many wildlife species. Declines in the abundance and distribution of prey species could result in declining wildlife populations.
Methods
To assess the potential effects of modeled changes in hydrologic parameters like river stage on wetland wildlife, information and data were gathered from existing literature and online sources. No new field data were collected for this analysis. Much of the literature is based on previous Florida research projects, including some that detail the links between wildlife habitat requirements and floodplain hydrology (e.g., hydroperiod and inundation frequency).
In order to increase the sensitivity of the model, each species was assigned a “hydrologic type” that describes its hydrologic preferences. The terms that describe the hydrologic types
were drawn from the wetland plant indicator status terminology (Reed, 1988), and include obligate (OBL), facultative wet (FACW), and facultative (FAC). The workgroup added a fourth category, aquatic (AQ), for species that use open water habitats greater than 2 m deep. Each species was assigned to a category based on the hydroperiod required to support that species (including information on the time for metamorphosis (where applicable) and floodplain recession rates), as established from the literature. The hydroperiods that correspond to the wildlife hydrologic types range from a high of 310-365 days of inundation per year for AQ species to many fewer days of inundation for FAC species; only AQ species are associated with a specific water depth (> 2 m).
A hydrologic wildlife model was created by combining the eleven vegetation communities that are typically found on the St. John’s River floodplain with four categories describing the duration of floodplain inundation (permanently flooded to dry/intermittently flooded) with the four wildlife hydrologic types. The result is a qualitative model that describes the predicted distribution of species along the floodplain’s hydrologic gradient (permanently flooded to dry). From this, an assessment of impacts was made.
Results
The screening level assessment of hydrologic change by river segment was used to identify groups of estuarine species that may be affected by water withdrawals in river segments 1 and 2, and freshwater wildlife in segments 6, 7 and 8. A partial assessment was also made for some categories of the freshwater species in segments 2 and 3. The overall effects for wildlife were determined for four withdrawal scenarios: the Full1995PN for which a table showing the levels of effects was developed (Table 3-11), and the Half2030PS, Full2030PN, and Full2030PS scenarios. The latter three were judged to have similar effects, and so the results were combined on a single table. Under the Full1995PN scenario, minor impacts were predicted for estuarine species in segment 1, moderate impacts were predicted for estuarine species in segment 2, and moderate impacts were predicted for freshwater species in segments 2, 7 and 8. These predictions were made for both freshwater and saltwater aquatic (AQ) and obligate (OBL) species. No assessments were made for facultative (FAC) or facultative wet (FACW) species. Uncertainty was judged to be very high for all predictions.
To make these assessments on the level of impacts, the results from the H&H modeling and the wetlands, benthic invertebrates, and fish workgroups were evaluated. Under the worst case Full1995PN scenario, the loss of hardwood swamp and Bald-cypress that is expected due to salinity increases would result in a loss of cover and nesting habitats for a number of species, including species of salamanders, turtles, snakes, herons, eagles, and ospreys. However, the ichthyofaunal distribution changes described for the fish pseudospecies (both reduced and increased), and their actual relationship to local wildlife, were equivocal or indeterminate. The workgroup concluded that despite the moderate level of effects predicted for the estuarine fish community, the overall fish and estuarine invertebrate biomass may not be greatly altered for the floodplain wildlife in this segment. Thus, moderate effects were predicted for segment 2 and minor effects for segment 1. Freshwater species in segment 2 were also assigned a moderate impact.
In the upper basin under the Full1995PN scenario, moderate effects were predicted for all freshwater wildlife groups in segments 7 and 8. These segments were deemed to be the most
sensitive to freshwater wildlife due to predicted changes in floodplain hydroperiods (although changes to wetland hydroperiods, which also may alter invertebrate and fish abundance, were only assessed for segment 7). An assessment of the level of effects was also made for freshwater species in segment 3 (moderate) and in segment 2 (moderate). Information on how the designations were made for segment 3 was not provided.
Overall, the AQ and OBL wildlife groups were predicted to persist if water withdrawals occur, partly due to compensation from the upper basin projects. Habitat shifts due to sea level rise, on the other hand, may lead to a shift from freshwater to estuarine habitats in the lower reaches of the river with consequent impacts to freshwater species there. One conclusion reached by the workgroup is that the 50 percent exceedance curve for floodplain inundation
TABLE 3-11 Summary of Withdrawal Effects on Wildlife for the Full1995PN Scenario as well as the FwOR1995NN, FwOR2030PS, Full1995NN, Half1995PN, Full2030PN, Half2030PS, and Full2030PS Scenarios.
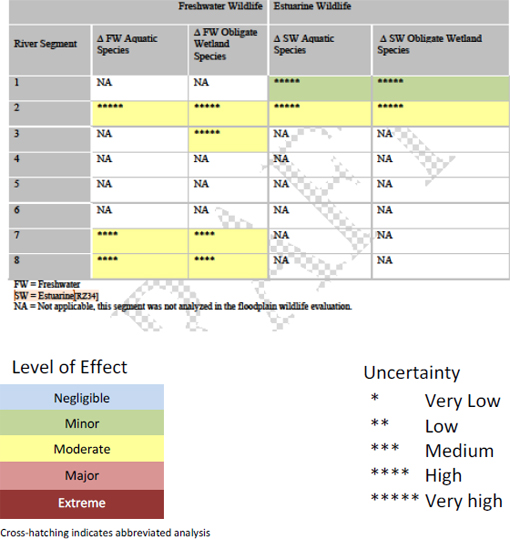
SOURCE: Curtis (2011).
appears to be an important threshold for obligate (OBL) species; most species in this group use habitat that has a 50 percent or greater inundation rate.
Potential declines in the productivity of small fish were a major driver of the predicted impacts to piscivorous wildlife in segments 7 and 8. Eight listed species were found to depend on small marsh fish, including alligators, wood storks, and the least tern. The percent of fish in the diets of these species ranges from about 2 to nearly 100 percent.
Critique
The wetlands wildlife workgroup conducted a qualitative review of the potential impacts of withdrawals to floodplain wildlife species. The analysis was limited by the lack of quantitative, species-specific information on the response of wildlife to altered hydrology and salinity. Thus, the analysis is an integration of a very thorough literature review along with the results of the H&H modeling effort and input from the wetlands, benthic invertebrate, and fish workgroups. Effects due to salinity changes in the lower reaches of the river were predicted to be much greater than impacts from lower water levels in the upper basin. The literature synthesis was thorough and will be of benefit to future research and management efforts in the St. Johns basin, particularly because it covers such a broad range of species. This report represents a true integration of the literature analysis with the results of other ecological workgroups, most notably the wetlands and fish workgroups, meeting the spirit of the approach outlined in their conceptual model. Future studies might address these links. For example, a study investigating whether the 50 percent exceedence of floodplain inundation represents a threshold for the persistence of listed wildlife species in different habitat types would be a useful undertaking.
The findings of the wildlife workgroup are obscured by the diverse ways in which species were classified according to their hydrologic attributes. Four categories of wildlife “hydrologic types” were introduced in the text and used in a hydrologic model showing the distribution of those types along a gradient of flooding (permanently wet to dry). However, the effects of water withdrawals were shown for only two of these categories. Establishing wildlife hydrologic types is an appropriate way to deal with the diversity of habitat requirements for the species included in the analysis, but the terms used to describe them were borrowed from wetland plant indicator categories used to delineate jurisdictional wetlands, and they are not fully appropriate as applied here. The plant categories describe the probability of finding a given species in a wetland habitat; for example, an OBL plant species is expected to occur in wetlands >99 percent of the time, but the OBL category is not linked with the duration of inundation. For the wildlife species in this report, however, the categories describe generally how much water the species needs for its annual habitat requirements without consideration of how flooding is associated with key life history stages. This is particularly troublesome for amphibians, which are all obligate species in the sense that they require standing water for reproduction. Finally, the ways in which the impacts of withdrawals were assessed for species in river segments 3, 6, and 8 were not presented. Because the wetlands workgroup did not directly analyze floodplain wetland changes in these segments, the wildlife levels of effects ratings should be removed.
Brady, N. C., and R. R. Weil. 2002. The Nature and Properties of Soils. Thirteenth Edition. Upper Saddle River, New Jersey: Prentice Hall.
Bonvechio, T. F., and M. S. Allen. 2005. Relations between hydrological variables and yearclass strength of sportfish in eight Florida waterbodies. Hydrobiologia 532:193-207.
Clarke, K. R., and R. M. Warwick. 2001. Change in Marine Communities: An Approach to Statistical Analysis and Interpretation. 2nd Edition. Plymouth, United Kingdom: PRIMER-E.
Coveney, M. F., J. C. Hendrickson, E. R. Marzolf, R. S. Fulton, J. Di, C. P. Neubauer, D. R. Dobberfuhl, G. B. Hall, H. W. Paerl, and E. J. Philips. 2011. Water Supply Impact Study Plankton Working Group Draft Final Report: Assessment of Impacts from Water Withdrawals. July 20, 2011.
Cowardin, L. M., V. Carter, F. C. Golet, and E. T. LaRow. 1979. Classification of wetlands and deepwater habitats of the United States. Washington, D.C. and Jamestown, ND: U.S. Department of the Interior, Fish and Wildlife Service.
Curtis, D. 2011. Water Supply Impact Study Floodplain Wildlife Working Group Draft Final Report: Assessment of Impacts from Water Withdrawals. November 2, 2011.
DeAngelis, D. L., W. F. Loftus, J. Trexler, C., and R. E. Ulanowicz. 1997. Modeling fish dynamics and effects of stress in a hydrologically pulsed ecosystem. Journal of Aquatic Ecosystem Stress and Recovery 6:1-13.
Diaz, R. J., and R. Rosenberg. 1995. Marine benthic hypoxia: a review of its ecological effects and the behavioural responses of benthic macrofauna. Oceanography and Marine Biology: an Annual Review 33:245-303.
Dobberfuhl, D., E. Lowe, L. Battoe, R. Chamberlain, S. Hall, C. Jacoby, R. Mattson, L. Morris, J. Slater, K. Moore, and R. Virnstein. 2011. Water Supply Impact Study Littoral Zone Working Group Draft Final Report: Assessment of Impacts from Water Withdrawals. 2011.
Helsel, D. R. 2011. Comments on the statistical methods used in the FIMS report by McDonald et al. (2009), and the subsequent review by Newfields. Final Report to the St. Johns River Water Management District, Practical Stats, Highlands Ranch, Co.
Helsel, D. R., and R. M. Hirsch. 2002. Chapter A3 Statistical Methods in Water Resources. Techniques of Water-Resource Investigations of the United States Geological Survey. Book 4 Hydrologic Analysis and Interpretation. Reston, VA: USGS.
Hendrickson, J. 2011. APPENDIX 4. CE-QUAL-ICM Setup, Calibration and Withdrawal Scenario Results. In: Water Supply Impact Study Plankton Working Group Draft Final Report: Assessment of Impacts from Water Withdrawals. July 20, 2011.
Kadlec, R. H., and S. D. Wallace. 2008. Treatment Wetlands. CRC Press.
Keenan, L. W., E. F. Lowe, E. J. Dunne, A. M. K. Bochnak, J. Di, W. VanSickle, R. Freese, C. P. Neubauer, I. Bujak, J. Hendrickson, K. R. Reddy, and A. Wright. 2011. Water Supply Impact Study Biogeochemistry Working Group Draft Final Report: Assessment of Impacts from Water Withdrawals. July 1, 2011
Kinser, P., S. Fox, L. Keenan, A. Ceric, F. Baird, P. Sucsy, W. Wise, and C. Montague. 2011. Water Supply Impact Study Wetlands Working Group Draft Final Report: Assessment of Impacts from Water Withdrawals. August 22, 2011.
Lowe, E. 2011. Water Supply Impact Study (WSIS) Environmental Analysis Synthesis. Presentation to the NRC Committee. May 23, 2011.
MacDonald, T. C., J. Solomon, C. B. Guenther, R. B. Brodie, and R. H. McMichael, Jr. 2009. Assessment of relationships between freshwater inflow and populations of fish and selected macroinvertebrates in the lower St. Johns River, Florida. Report submitted to the St. Johns River Water Management District. St. Petersburg, FL: Florida Fish and Wildlife Research Institute, Fish and Wildlife Conservation Commission.
Mattson, R. 2011. Benthic Macroinvertebrate Workgroup. Presentation to the NRC Committee. May 23, 2011.
Mattson, R., J. Mace, J. Slater, C. Jacoby, K. W. Cummins, R. W. Merritt, P. A. Montagna. 2011. Water Supply Impact Study Benthic Macroinvertebrate Working Group Draft Final Report: Assessment of Impacts from Water Withdrawals. July 2011.
Miles, C. J. and P. L. Brezonik. 1981. Oxygen consumption by a photochemical ferrous-ferric catalytic cycle. Environ. Sci. Technol. 15:1089-95.
Miller, S., et al. 2011. Water Supply Impact Study Fish Working Group Draft Final Report: Assessment of Impacts from Water Withdrawals. August 2011.
Montagna, P. A., T. A. Palmer, and J. B. Pollack. 2011. Draft Final Report. St. Johns Estuary: Estuarine Benthic Macroinvertebrates. Phase 2 Final Report. Report by the Harte Research Institute for Gulf of Mexico Studies. Submitted to the St. Johns River Water Management District, Palatka, FL.
NRC (National Research Council). 2009. Review of the St. Johns River Water Supply Impact Study: Report 1. Washington, DC: The National Academies Press.
NRC. 2010. Review of the St. Johns River Water Supply Impact Study: Report 3. Washington, DC: The National Academies Press.
Peebles, E. B., M. S. Flannery, R. E. Matheson, Jr., and J. P. Rast. 1991. Fish nursery utilization of the Little Manatee River estuary: relationships to physicochemical gradients and the distribution of food resources. Pp. 341-367 In: S. F. Treat and P. A. Clark (eds.) Proc. Tampa Bay Area Sci. Inform. Symposium, Vol 2. Tampa Bay Regional Planning Council, Tampa, FL.
Peterson, M. S. 1988. Comparative physiological ecology of centrarchids in hyposaline environments. Canadian Journal of Fisheries and Aquatic Sciences 45(5):827-833.
Reed, Jr., P. B. 1988. National List of Plant Species That Occur in Wetlands: 1988 National Summary. Washington, DC: U.S. Fish and Wildlife Service.
Ross, L. T. 1990. Methods for Aquatic Biology. Florida Dept. of Environmental Regulation Technical Series Vol. 10, No. 1.
Soulen, H. 1998. The effects of habitat complexity and predation on the distribution of grass shrimp (Decapoda:Palaemonetes) in the lower St. Johns River Basin, Florida. M.S. Thesis. Georgia Southern University, Statesboro, GA. Appendix 3 In: F. Jordan, An evaluation of relationships between submerged aquatic vegetation and fish community structure in the St. Johns River. Final report September 2000. Report submitted to St. Johns River Water Management District, Palatka, FL.
Strobel, C. J., and T. Heitmuller. 2001. National Coastal Assessment Field Operations Manual. Environmental Monitoring and Assessment Program. EPA/620/R-01/003. Washington, DC: EPA.
Xie, H., O. C. Zafiriou, W.-J. Cai, R. G. Zepp, and Y. Wang. 2004. Photooxidation and its effects on the carboxyl content of dissolved organic matter in two coastal rivers in the southeastern United States. Environ. Sci. Technol. 38:4113-4119.


