
Patterns and Correlates of Intergenerational Nontime Transfers: Evidence from CHARLS1
Xiaoyan Lei, John Giles, Yuqing Hu, Albert Park, John Strauss, and Yaohui Zhao
China is now facing an unprecedented aging process, which is rapid, but occurring at a low level of economic development and with few social safety nets. With the introduction of family planning policies in the 1970s that caused a plummet in the birth rate during the past few decades, and with the earlier “baby boom” generation who will soon pass their 60th birthday in the next 15-20 years, it is projected that the old-age dependency ratio will climb from the current 10-40% by 2050.2 However, unlike the advanced industrialized countries such as the United States and in Europe, which have long experienced aging and whose social safety nets cover the majority of the elder population, China is aging at a relatively low level of development with many times lower per capita income and underdeveloped political and financial institutions.
In comparison with the old-age support system that is operating with fragmented infrastructure and noncomprehensive coverage, informal familial support has long been the most important source of help in low-income countries. As a country with a long-standing history and culture,
____________
1 The research was supported by the National Institute on Aging (Grant Number R21AG031372), Natural Science Foundation of China (Grant Numbers 70773002 and 70910107022), the World Bank (Contract 7145915), and the Fogarty International Center (Grant Number R03TW008358), as well as the Knowledge for Change Trust Fund at the World Bank. The content is solely the responsibility of the authors and does not necessarily represent the official views of any of the funders.
2 Authors’ calculations based on the numbers provided by the United Nations. Available: http://esa.un.org/wpp/unpp/panel_population.htm.
China has unique traditional family values, especially strong in the rural areas. The deep-rooted Confucian “filial piety,” characterized by money and time transfers from children to their parents and the co-residence of multiple generations, has effectively helped sustain an informal old-age security.
The traditional foundation of old-age support is changing today for several reasons. First, economic shifts involving smaller household sizes, greater mobility of the population, and perhaps weakening of ties of kin outside the household are potentially undermining this tradition, making it increasingly difficult for older Chinese to receive support from their adult children. Thus, it is important at this stage to understand the patterns of intergenerational transfers among Chinese families and evaluate to what extent intergenerational transfers still function as a part of elderly support. Second, despite the existence of “filial piety,” other Chinese traditional norms may also linger and influence family transfer behaviors. For instance, there is a shared ideal of family continuity through the male line in which the females are considered inferior to the males, so parents tend to favor sons, reflected in the inequitable distribution of transfers (Lee et al., 1994). Therefore, we also try to investigate the correlates of intergenerational transfers, with a hope to better understand the driving forces behind transfer behaviors between elderly parents and their adult children.
In this chapter, we examine incidence and net amount of transfers and their correlations with parental demographics, socioeconomic status (SES), and health status, as well as children’s demographics and SES. The main findings include (1) contrary to the situations in most developed countries, transfers are predominantly from children to elderly parents, and are large in magnitude compared with parental pre-transfer income; (2) older people with a larger number of offspring tend to receive more transfers; those residing with other children are less likely to receive transfers from their nonco-resident children; (3) the relationship between parental pre-transfer income and transfers is mixed, depending on the income level of the parents; (4) married children are more able to provide transfers; (5) educated children transfer more frequently and a larger net amount; and (6) oldest sons are less likely to provide transfers.
Our findings reveal that given the insufficient pension system and social safety nets in today’s China, children remain the major source of elderly support, implying the traditional social norms still play an important role. The incidence and amount of transfers are responsive to parents’ income levels, and affected by the socioeconomic status of children. As China is growing quickly and approaching a graying society, we expect adult children will continue to shoulder the most responsibility for elder support.
LITERATURE REVIEW
Who will pay for the rising army of retirees? Does the government have the resources to meet the challenges? The situation is far from satisfactory. Under the Chinese traditional “pay-as-you-go” (PAYG) pension system, governments collect pension contributions and other taxes to pay current pensions, and each employee gets a promise that he/she will receive a pension paid for by other workers in the future. As China ages rapidly, the number of new workers entering the workforce will decline, and rising longevity will increase the size of the pension-age population. The PAYG system will start to run deficits as the dependency ratio rises, and the value of future net liabilities will start to increase sharply as well.
Although the Chinese government has recently introduced a series of social insurance and new pension programs, it faces great difficulty in implementation due to the rapid demographic transition and urbanization (Cai, Giles, and Meng, 2006). Although the current social insurance system contains three pillars in name (PAYG, funded individual accounts, and voluntary complementary insurance), this system does not differ much from the PAYG system: The money in the individual account is often used to pay for the pensions of existing retirees and is, in large part, an empty account, and the third pillar is very small. It has also been shown that even with the extremely high current payroll tax rate (28%), the pension system, due to its low return rate, would never be able to achieve the promised replacement rate if taking the demographic transition into consideration (Lei, Zhang, and Zhao, 2011a). With this insufficient social insurance, private transfers will continue to be important, at least in the foreseeable future.
A large literature has been devoted to theorizing about the patterns and determinants of private transfers (Altonji, Hayashi, and Kotlikoff, 1997; Becker, 1974; Cox, 1987; Cox and Fafchamps, 2008; Cox and Soldo, 2004; Kotlikoff, 1998; McGarry and Schoeni, 1995). Following the theoretical models, relevant empirical studies have also been conducted. Regarding the patterns of intergenerational transfers, more than one-third of parents give money to children in the United States (Hurd, Smith, and Zissimopoulos, 2007) and parental assistance is important in supporting young men (Rosenzweig and Wolpin, 1993). In Poland, high-income parents transfer to low-income young couples (Cox, Jimenez, and Okrasa, 1997).
In contrast, two or three out of five households provide financial transfers for their aged parents in Korea (Kim, 2010), which is similar to most areas of Asia where children transfer to parents to insure them against low retirement incomes (Cai, Giles, and Meng, 2006; Nugent, 1985). However, multiple transfer patterns between adult children and
their parents exist in Malaysian and Indonesian families (Frankenberg, Lillard, and Willis, 2002; Lillard and Willis, 1997). In particular, children are an important source of old-age security, which in part is children’s repayment for parental investments in their education; in the meantime, parents and children engage in the exchange of time help for money.
Regarding the determinants of intergenerational transfers, most studies focus on the relationship between transfers and recipients’ income with the purpose of exploring the underlying motives. The evidence is mixed, varying across regions. A strong negative correlation has been found in the United States (McGarry and Schoeni, 1995), but a positive one is detected in Peru (Cox, Eser, and Jimenez, 1998).
Studies regarding intergenerational transfers in China are few, possibly because available data are in short supply and not well suited to study this set of questions. In recent years, with China’s rapid development and aging, more studies have been done (Cai, Giles, and Meng, 2006; Chou, 2010; Goh, 2009; Lee and Xiao, 1998; Secondi, 1997). For example, Secondi (1997) used data from a large 1988 household survey to test the hypotheses of altruism and exchange and to study the size and direction of transfers in rural China. He found that most of the money flows appeared to be transfers from adult children to elderly parents and remittances from migrants. Cai, Giles, and Meng (2006) addressed how households with elderly members coped when enterprise-based or local public pension systems failed to provide sufficient income. They found evidence that the transfer flow was from children to parents and that private transfers responded to low household income of retired workers when income fell below the poverty line. However, these studies have the same weaknesses in that transfers are defined as a household aggregate for which the donors are unspecified, rendering these studies unable to differentiate between intergenerational and intragenerational transfers.
DATA
We draw on the released 2008 pilot of the China Health and Retirement Longitudinal Study (CHARLS), a survey conducted from July to September in 2008 by the National School of Development at Peking University (Zhao et al., 2009). As one of the sisters of the Health and Retirement Study (HRS)-serial surveys, CHARLS, with its rich information, is ideal for research on transfers. In the interview, the respondents were asked whether they had received transfers from and/or given transfers to each of their children, and if so the corresponding amount.3 Transfers
____________
3 Amounts are asked if financial transfers occur, and frequencies are asked if time transfers occur. In this chapter, we only focus on financial transfers.
are specified in two categories: financial transfers4 and in-kind transfers (mostly in the form of goods); both are nontime transfers.
The survey was conducted in Zhejiang and Gansu, representing two very different development levels in China (see the two provinces location on the map in Figure 9-1). Zhejiang, a southeastern costal province, has been enjoying rapid economic growth since the implementation of the reform policies, and now it is one of the richest areas in China. Gansu, located in the hinterland of northwest China, is one of the poorest provinces. Its development has been constrained by its inclement natural environment and insufficient commercial opportunities. The two different economic and natural conditions contribute to different living status of the residents and potentially influence intergenerational transfers. Both provinces had major declines in fertility and mortality, with the fertility decline most rapid starting in the 1970s, when stronger family planning policies began (National Bureau of Statistics of China, 2009).
CHARLS main respondents are a random sample of aged 45 and older. Both the main respondents and their spouses are interviewed in the survey. They are asked for detailed information on themselves and on their families. In this chapter, we are particularly interested in the transfers between the respondents and their adult children.5 CHARLS has information on all living children of each respondent and spouse, no matter where they live. In order to fully employ the rich information on each of their children, the basic sample of interest are the children of the CHARLS respondents. Specifically we first choose the 789 households with either the main respondent or his/her spouse older than 60.6 The 2,667 adult children (aged 25 and older7) of the 789 respondents are then treated as our study sample.
Several sample restrictions are further applied according to different purposes of the study. For the estimation on transfers, we restrict the analyses to nonco-resident children (2,202 observations) because transfers within the household are not clearly specified conceptually, and CHARLS, like other aging surveys, does not attempt to measure them. For the
____________
4 Financial transfers are further classified into two types: regular financial transfers and nonregular financial transfers. Nonregular transfers are those made at special times of the year, such as Spring Festival or a parent’s birthday.
5 The incidence of transfers between the respondents and their elderly parents are quite small (only 13.4%), so we did not take them into consideration in our analysis. Family transfers can entail interactions among members of three or even four generations, but it is beyond the scope of this chapter to give a comprehensive treatment of this issue.
6 Only 16 main respondents do not have any children in the sample; they are dropped for the purpose of studying parent-child transfers.
7 We choose age 25 because many adult Chinese people younger than 25 are full-time college students who are incapable of supporting their parents.
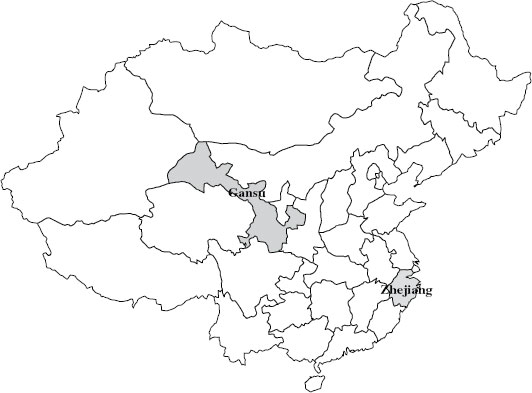
FIGURE 9-1 Location of Zhejiang and Gansu provinces.
SOURCE: China: Outline of Provinces [map]. Daniel http://d-maps.com/carte.php?&num_car=1749&lang=en.
regressions regarding family fixed-effects, only those families with at least two nonco-resident adult children are included (2,068 observations).
In order to use individual information on both parent and child, we need to match individual child and parental characteristics. We choose the information of the main respondent parent because every child has a main respondent parent and, as stated earlier, the main respondents are chosen randomly by the survey.
MEASURES AND SUMMARY STATISTICS
Parent-Level Characteristics
In our analysis, characteristics of parents are mainly concerned with three aspects: demographics, SES, and health.
Demographics include age, age squared, gender, marital status (married and living with his/her spouse/partner, married but not living with spouse, separated, divorced, widowed, or never married), location (urban
or rural, Zhejiang or Gansu), the number of children, and living arrangement vis-à-vis their children.
SES has three dimensions: house ownership, education level, and pre-transfer income.8 Education is classified into five discrete educational groups: (1) illiterate, (2) less than primary education, (3) finished primary, (4) junior high, and (5) senior high and above. In particular, the second category—less than primary education—includes those who did not finish primary school but are capable of reading or writing, or those who reported to have been in “Sishu.”9
Health-related variables include the Center for Epidemiological Studies Depression Scale (CES-D), a score of cognition using questions from the Telephone Interview of Cognition Status (TICS) used by the HRS and other surveys of the elderly, and dummies indicating whether one has poor general health, has any difficulties performing ADLs (Activities of Daily Living) or IADLs (Instrumental Activities of Daily Living), and has a major diagnosed chronic disease. Following the HRS example, the CHARLS questionnaire asked respondents to assess their general health using a scale of: excellent, very good, good, fair, or poor. Here, we look at whether a respondent reports poor health. ADL or IADL disability is defined as having difficulty in any of the ADL (including physical limitations) and IADL activities.
The cognition of the respondents comprises three questions about time orientation,10 one question about serial-7 subtraction from 100,11 and one question concerning picture drawing. These are standard cognition questions from TICS (Smith, McArdle, and Willis, 2010). We differentiate people as those with full marks (11 points), those without full marks but with a score above 8, and those with a score below 8. We choose 8 as the cutoff point because about one-third of the sample have scores below 8.
Respondents are also asked whether they have particular diagnosed diseases. They are coded as having major illness if they have one of the following: (1) cancer or malignant tumor (excluding minor skin cancers); (2) heart attack, coronary heart disease, angina, congestive heart failure, or other heart problems; (3) stroke (including transient ischemic attack or TIA); or (4) chronic lung diseases, such as chronic bronchitis or emphysema (except for asthma, excluding tumors, or cancer). If they have any
____________
8 In our analysis, pre-transfer income with and without public transfers are both conducted, and the results are similar. We only report the results without public transfers included in the pre-transfer income, because public transfers are arguably endogenous in a reasonable economic model.
9 Sishu is a kind of old-style private Chinese education that mainly taught young children Chinese classics before the 20th century.
10 Respondents are asked about today’s date (year, month, and day), week, and season.
11 The question is to subtract 7 from 100, then another 7 from that, and so on until the fifth 7.
of the other canvassed diseases,12 they are considered as having a minor illness. Otherwise, they are defined as having no diseases.
Table 9-1 summarizes parents’ characteristics by living arrangement.13 Among all the main respondent parents of the children studied, 51.8% are co-residing with adult children, 42.6% are fathers, and each has 3.4 children on average, with a mean age of 68.4 years. Overall, our parent sample has low education levels: as many as 54.9% are illiterates, and 21.8% have not graduated from primary school. The annual per capita pre-transfer income is 5.3 thousand RMB on average, with those co-residing with children having slightly lower income than their nonco-residing counterparts (5.1 vs. 5.6 thousand RMB).
Intergenerational transfers seem to play an important role for the Chinese elderly. The sample parents on average receive 2.5 thousand RMB of net transfers from all of their children, amounting to 15.15% of their household pre-transfer income. The amount is much larger for those who are not living with their children (2.9 vs. 2.1 thousand) and the discrepancy in the ratio is especially larger (26.7% vs. 9.7%). This implies that transfers and co-residence are possible substitutes. In addition, more than one-quarter of these Chinese elderly report poor general health, 24% of them have a cognition score lower than 8, nearly 30.4% are diagnosed to have a major chronic illness, and as many as 51.1% have some difficulties in performing ADLs.
The p-values reported in the last column show significant differences between co-resident and nonco-resident parents in their marital status, place of residence, house ownership, and cognition. Specifically, parents living with their children are more likely to be widowed, have more children, be from Gansu, and live in rural areas.
Child-Level Characteristics
Child characteristics are grouped into demographics and SES, the former of which consists of age, the number of their own children (grandchildren of the parents), and five dummies representing whether the child
____________
12 These diseases include hypertension, high cholesterol, diabetes or high blood sugar, liver disease, such as Hepatitis B, or other liver disease (except fatty liver, tumors, and cancer), kidney disease (except for tumor or cancer), stomach or other digestive disease (except for tumor or cancer), emotional, nervous, or psychiatric problems, memory-related disease, and arthritis or rheumatism.
13 For more detailed information on living arrangement of CHARLS elderly, please see Lei et al. (2011b).
TABLE 9-1 Summary Statistics of Parent Characteristics
| Parent Characteristics | All | Coresident | Nonco-resident | P-values |
|
Age |
68.44 | 68.34 | 68.54 | 0.726 |
|
Father (%) |
42.59 | 43.52 | 41.58 | 0.582 |
|
Marital Status (%) |
||||
|
Married |
60.84 | 54.28 | 67.89 | 0.029 |
|
Separated |
1.14 | 0.98 | 1.32 | 0.657 |
|
Divorced |
0.51 | 0.00 | 1.05 | 0.045 |
|
Widowed |
37.01 | 43.77 | 29.74 | < 0.001 |
|
Never married |
0.51 | 0.98 | 0.00 | 0.045 |
|
# of children |
3.40 | 3.54 | 3.26 | 0.016 |
|
Zhejiang |
52.85 | 44.01 | 62.37 | < 0.001 |
|
Urban |
41.95 | 34.23 | 50.26 | < 0.001 |
|
Living with adult children |
51.84 | 100.00 | 0.00 | |
|
House owner |
89.48 | 94.38 | 84.21 | < 0.001 |
|
Education (%) |
||||
|
Illiterate |
54.88 | 57.21 | 52.37 | 0.172 |
|
Less than primary education |
21.80 | 22.00 | 21.58 | 0.885 |
|
Primary school |
13.43 | 12.71 | 14.21 | 0.539 |
|
Middle school |
5.83 | 4.65 | 7.11 | 0.144 |
|
High school and above |
4.06 | 3.42 | 4.74 | 0.353 |
|
Pre-transfer income per capita (PTI, 000s) |
5.32 | 5.08 | 5.58 | 0.501 |
|
Household Pre-transfer income (HPTI, 000s) |
16.52 | 21.68 | 10.98 | < 0.001 |
|
Total net amount of transfer (TT, 000s) |
2.50 | 2.10 | 2.93 | 0.111 |
|
Transfer-income ratio (HPTI/TT, %) |
15.15 | 9.68 | 26.71 | |
|
Self-Reported Health (%) |
||||
|
Excellent |
1.39 | 1.47 | 1.32 | 0.856 |
|
Very good |
8.75 | 7.82 | 9.74 | 0.344 |
|
Good |
15.34 | 15.16 | 15.53 | 0.886 |
|
Fair |
35.23 | 32.03 | 38.68 | 0.051 |
|
Poor |
26.24 | 27.87 | 24.47 | 0.278 |
|
Cognition (%) |
||||
|
Score = 11 |
10.27 | 10.02 | 10.53 | 0.817 |
|
Score in [8, 11) |
32.32 | 25.18 | 40.00 | < 0.001 |
|
Score in [0, 8) |
23.95 | 22.98 | 25.00 | 0.508 |
|
Disease (%) |
||||
|
Minor illness |
46.51 | 47.68 | 45.26 | 0.498 |
|
Major illness |
30.42 | 31.30 | 29.47 | 0.579 |
|
CES-D score |
8.52 | 8.81 | 8.21 | 0.090 |
|
ADL or IADL disability |
51.08 | 58.92 | 42.63 | 0.090 |
|
Observations |
789 | 409 | 380 | |
NOTES: (1) Sample are main respondent parents with children no younger than age 25, and older than age 60 or spouse older than age 60. (2) P-values are from t-test of the co-resident and nonco-resident groups.
SOURCE: Data from CHARLS 2008 pilot.
is the oldest son, youngest son,14 daughter, whether he/she is married, and the highest level of education he/she has attained.15
Table 9-2 summarizes child demographic characteristics and SES by living arrangement using the child sample, i.e., those who are aged 25 and older and with at least one parent over 60. Among the 2,667 children, 465 (17.4%) are living with their parents, and this co-residence is highly related to many child characteristics. The average age of those who co-reside is 39.1, significantly less than the mean of 42.5 for those who are nonco-resident. Daughters are less likely to live with parents, and oldest sons and especially youngest sons are more likely to live with their parents. Furthermore, education is also associated with co-residence, but the pattern varies by different level: adult children with low education (those who are illiterate and those with primary school education) and high education (college and above) are not likely to live with parents, but those with intermediate levels (middle school) are significantly more likely to live with parents.
PATTERNS OF TRANSFERS
Transfers are also measured in the family module in the survey. Respondents are asked about the amount and frequency of non-time transfers, and these transfers include financial transfers and in-kind transfers (in the form of goods) received from and given to each child. Financial transfers involve giving money, helping pay bills such as medical care or insurance, schooling, and down payment for a home or rent. These transfers are further divided into regular and irregular financial transfers. Regular transfers were paid on a regular basis, such as monthly payments. Irregular transfers occurred irregularly, such as around a festival, marriage, large medical expenses, and the like. In-kind transfers are nonmonetary gifts provided or given in the past year.
We first separately analyze prevalence of transfers from a child to parents and then examine the amount of net transfers to parents, defined by subtracting the amount given to a particular child from the amount received from the same child.
Table 9-3 summarizes the patterns of transfers. Overall, familial intergenerational transfers are pervasive, with about 60% of the children having provided transfers to their parents. The prevalence of transfers from parents to their adult children is smaller, only 3.3%. The net amounts in terms of financial and in-kind transfers are all positive, toward parents.
____________
14 A son is classified as both the youngest son and the oldest son if he is an only child.
15 Children’s education is classified into five categories: illiterate, primary education, middle school, high school, college and above.
TABLE 9-2 Summary Statistics of Child Characteristics
| All | Co-resident | Nonco-resident | P-values | |
|
Child Characteristics |
||||
|
Age |
41.95 | 39.12 | 42.54 | < 0.001 |
|
Oldest son (%) |
15.90 | 22.37 | 14.53 | < 0.001 |
|
Youngest son (%) |
27.30 | 61.29 | 20.12 | < 0.001 |
|
Daughter (%) |
46.04 | 12.04 | 53.22 | < 0.001 |
|
Married (%) |
91.38 | 78.49 | 94.10 | < 0.001 |
|
# of children (age < 16) |
0.34 | 0.47 | 0.31 | 0.001 |
|
Education (%) |
||||
|
Illiterate |
16.91 | 12.26 | 17.89 | 0.001 |
|
Primary |
34.91 | 33.12 | 35.29 | 0.369 |
|
Middle school |
28.65 | 38.06 | 26.66 | < 0.001 |
|
High school |
13.65 | 13.55 | 13.67 | 0.945 |
|
College and above |
5.89 | 3.01 | 6.49 | < 0.001 |
|
Co-resident |
17.44 | 100.00 | 0.00 | |
|
Observations |
2,667 | 465 | 2,202 | |
NOTES: (1) The sample includes adult children no younger than age 25 with at least one parent who is older than age 60. (2) P-values are from t-test of the co-resident and nonco-resident groups.
SOURCE: Data from CHARLS 2008 pilot.
About 38% of children give financial transfers to their parents, roughly commensurate with in-kind transfers, which have a 42% prevalence rate. Irregular transfers account for the largest part of financial transfers, with prevalence rates roughly three times that of regular financial transfers.
The average net amount of total transfers is about 741 RMB per child, in which financial transfers take up 548 RMB and in-kind transfers take up 192 RMB. The net amount of regular transfers is much smaller than irregular financial transfers (190 RMB compared with 358 RMB).
There exist large disparities between regions: Zhejiang/urban children are more likely to provide transfers to their parents: about 64/68% in general, compared with 55/53% in Gansu/rural. Zhejiang/urban children give 1,140/1,192 RMB per year, while those in Gansu/rural only give 325/421 RMB.
CORRELATES OF TRANSFERS
A series of descriptive results from multivariate analyses of the incidence and magnitude of transfers are discussed in this section, first using ordinary least squares (OLS) models, and then family fixed-effect (FE)
TABLE 9-3 Transfer Patterns
| All | Zhejiang | Gansu | Urban | Rural | |
|
Incidence (%) |
Children to Parents | ||||
|
Financial transfer |
38.07 | 47.56 | 28.19 | 47.18 | 31.61 |
|
Regular |
8.47 | 13.70 | 3.01 | 11.66 | 6.21 |
|
Irregular |
30.09 | 34.74 | 25.25 | 36.34 | 25.66 |
|
In-kind transfer |
42.23 | 40.52 | 44.02 | 46.27 | 39.37 |
|
Total |
59.51 | 64.15 | 54.67 | 68.03 | 53.46 |
|
Incidence (%) |
Parents to Children | ||||
|
Financial transfer |
1.93 | 2.00 | 1.85 | 3.55 | 0.78 |
|
Regular |
0.42 | 0.44 | 0.39 | 1.00 | 0.00 |
|
Irregular |
1.55 | 1.63 | 1.47 | 2.64 | 0.78 |
|
In-kind transfer |
1.70 | 1.11 | 2.32 | 1.82 | 1.62 |
|
Total |
3.33 | 2.89 | 3.78 | 5.01 | 2.13 |
|
|
|||||
|
Amount (RMB/year) |
Net Transfer | ||||
|
Financial transfer |
548.46 | 864.78 | 218.70 | 894.03 | 303.18 |
|
Regular |
190.34 | 360.96 | 12.47 | 339.25 | 84.65 |
|
Irregular |
358.12 | 503.81 | 206.23 | 554.78 | 218.53 |
|
In-kind transfer |
192.32 | 275.09 | 106.04 | 297.92 | 117.37 |
|
Total |
740.78 | 1139.87 | 324.75 | 1191.96 | 420.55 |
NOTE: The sample includes nonco-resident adult children aged 25 and older with at least one parent older than age 60.
SOURCE: Data from CHARLS 2008 pilot.
models. Transfers are investigated in two dimensions: the incidence of transfers provided by the child, and the net amount of transfers provided by the child.16
Associations with Parent Characteristics
Tables 9-4 and 9-5 report the results from the OLS estimations. Specifically, Table 9-4 reports incidence of gross transfers from children to parents and Table 9-5 examines the net amount of these transfers. We have two specifications, with and without the parental health measures, which can arguably be considered as endogenous.
As is shown in Table 9-4, pre-transfer parental income, number of parents’ children, province, and living arrangements are all correlated with the incidence of children giving transfers, while the coefficients of age,
____________
16 An earlier version of this chapter included analyses of gross transfers from parents to children, which as noted is far less common than from children to parents. Results are available upon request.
age squared and gender are not significant.17 We create a linear spline for pre-transfer income with three linearly connected segments based on two percentile points (1/3 and 2/3) of pre-transfer income. Coefficients for one segment show the slope over that segment. Higher pre-transfer income is correlated with a higher likelihood of a child giving, perhaps because of strategic motives having to do with potential bequests, but, too, perhaps because higher income parents invested more in the child earlier in life and this is an implicit exchange repayment. This relationship is very nonlinear, and at higher levels of income the association becomes flat.
Having more offspring is related to a higher probability of transfers given by children, which is surprising. However, if the parents live with another child, the likelihood of transfers from nonco-resident children declines. Children thus share the burden of support. Interestingly, parental health is not generally associated with transfer incidence, except for CES-D scores, for them having a higher score (so more likely to be depressed) is associated with a lower chance of receiving transfers.
Table 9-5 shows that for the net transfer amounts, pre-transfer parental income has a weakly positive relationship for the bottom one-third income group, but it becomes significantly negative for the top one-third group. We do not have a good explanation for this change in slope. Parental education and health status do not have significant relationships with transfer amount.
Associations with Child Characteristics
Correlates of transfers from the perspective of children are examined by both OLS and family FE models. The OLS models are able to estimate the coefficients of parent characteristics, while the family FE models correct for unobserved family heterogeneity and compare transfer behaviors among different children within the same family. FE results are displayed in Tables 9-6 and 9-7, where the sample is further restricted to those having at least one eligible (i.e., nonco-resident and adult) sibling. Net transfers are classified into three categories: financial transfers, in-kind transfers, and the total of both. In the following, we will discuss the estimation results of child characteristics from both models (Tables 9-4 through 9-7) but will focus mainly on the FE results (Tables 9-6 and 9-7).
Among children’s demographic variables, age has a positive, concave relationship with transfer incidence in both the OLS and family FE models. Married children are more likely to transfer to parents, with the effect in the FE model being larger and more significant. The oldest son is less likely to provide transfers, if he lives apart, in the FE models, espe-
____________
17 We have tried interacting age with gender, but none of the coefficients are significant.
TABLE 9-4 OLS Analysis of Gross Transfer Incidence (from children to parents)
| (1) | (2) | (3) | (4) | ||
| Parent Characteristics | |||||
| Demographics |
Age |
0.006 | (0.034) | 0.009 | (0.034) |
|
Age squared/100 |
-0.011 | (0.024) | -0.012 | (0.024) | |
|
Father |
0.020 | (0.035) | 0.017 | (0.035) | |
|
Widowed |
-0.036 | (0.033) | -0.029 | (0.033) | |
|
Number of children |
0.030** | (0.013) | 0.029** | (0.013) | |
|
Zhejiang |
-0.024 | (0.106) | -0.077 | (0.111) | |
|
Urban |
0.059 | (0.038) | 0.051 | (0.039) | |
|
Living with other adult children |
-0.180** | (0.075) | -0.177** | (0.074) | |
| SES |
House owner |
-0.060 | (0.043) | -0.061 | (0.043) |
|
Education (illiterates omitted) |
|||||
|
Less than primary education |
0.009 | (0.039) | -0.002 | (0.041) | |
|
Primary school |
0.002 | (0.049) | -0.006 | (0.049) | |
|
Middle school |
0.068 | (0.063) | 0.043 | (0.066) | |
|
High school and above |
0.050 | (0.081) | 0.020 | (0.080) | |
|
P-value for education |
0.828 | 0.958 | |||
|
Pre-transfer income (000s) |
|||||
|
For the lowest 1/3 income group |
0.016*** | (0.005) | 0.017*** | (0.005) | |
|
For the middle 1/3 income group |
-0.010 | (0.011) | -0.008 | (0.011) | |
|
For the highest 1/3 income group |
-0.002 | (0.002) | -0.002 | (0.002) | |
|
P-value for pre-transfer income |
0.017 | 0.008 | |||
| Health |
Health poor |
0.054 | (0.037) | ||
|
CES-D |
-0.009*** | (0.003) | |||
|
ADL or IADL disability |
-0.045 | (0.038) | |||
|
Cognition score in [8, 11) |
-0.029 | (0.045) | |||
|
Cognition score in [0, 8) |
0.001 | (0.056) | |||
|
Major illness |
0.010 | (0.033) | |||
|
P-value for health |
0.089 | ||||
| Children Characteristics | ||||||||||
| Demographics |
Age |
0.043*** | (0.011) | 0.045*** | (0.011) | |||||
|
Age squared/100 |
-0.037*** | (0.011) | -0.039*** | (0.011) | ||||||
|
Oldest son |
0.008 | (0.035) | 0.009 | (0.035) | ||||||
|
Youngest son |
0.030 | (0.032) | 0.032 | (0.032) | ||||||
|
Daughter |
0.016 | (0.030) | 0.016 | (0.030) | ||||||
|
Married |
0.086* | (0.050) | 0.077 | (0.049) | ||||||
|
# of children (age < 16) |
0.013 | (0.011) | 0.012 | (0.011) | ||||||
| SES |
Education (illiterates omitted) |
|||||||||
|
Primary |
0.118*** | (0.035) | 0.119*** | (0.035) | ||||||
|
Middle school |
0.108** | (0.043) | 0.111*** | (0.043) | ||||||
|
High school and above |
0.229*** | (0.045) | 0.225*** | (0.044) | ||||||
|
P-value for SES |
<0.001 | <0.001 | ||||||||
| County Dummies | Yes | Yes | ||||||||
| Observations | 2,202 | 2,202 | ||||||||
| R-squared | 0.133 | 0.142 | ||||||||
NOTES: (1) The sample includes those who are no younger than age 25 and with at least one parent no younger than age 60. (2) Parent characteristics are from main respondents. (3) Clustered standard errors at family level are in parentheses. (4) * denotes p < 0.1; ** p < 0.05; *** p < 0.01.
SOURCE: Data from CHARLS 2008 pilot.
TABLE 9-5 OLS Analysis of Net Transfer Amount
| (1) | (2) | (3) | (4) | ||
| Parent Characteristics | |||||
| Demographics |
Age |
-4.397 | (103.567) | 12.873 | (107.494) |
|
Age squared/100 |
-14.772 | (73.821) | -26.042 | (76.321) | |
|
Father |
334.428 | (206.879) | 319.738 | (199.056) | |
|
Widowed |
-197.960* | (117.107) | -171.012 | (115.615) | |
|
Number of children |
22.342 | (45.193) | 16.288 | (43.332) | |
|
Zhejiang |
707.374** | (336.641) | 557.533* | (323.821) | |
|
Urban |
248.471 | (233.937) | 245.186 | (239.288) | |
|
Living with other adult children |
37.868 | (185.181) | 68.194 | (176.818) | |
| SES |
House owner |
-563.412 | (486.384) | -625.092 | (504.109) |
|
Education (illiterates omitted) |
|||||
|
Less than primary education |
54.473 | (188.363) | 0.550 | (234.450) | |
|
Primary school |
82.972 | (281.356) | 46.336 | (281.129) | |
|
Middle school |
-83.550 | (242.299) | -174.869 | (295.173) | |
|
High school and above |
-173.389 | (427.434) | -312.513 | (452.015) | |
|
P-value for education |
0.953 | 0.912 | |||
|
Pre-transfer income (000s) |
|||||
|
For the lowest 1/3 income group |
24.746* | (14.701) | 22.020 | (14.157) | |
|
For the middle 1/3 income group |
14.018 | (53.407) | 9.771 | (53.486) | |
|
For the highest 1/3 income group |
-17.654** | (8.209) | -17.544** | (7.973) | |
|
P-value for pre-transfer income |
0.104 | 0.098 | |||
| Health |
Health poor |
229.529 | (159.597) | ||
|
CES-D |
-3.524 | (13.107) | |||
|
ADL or IADL disability |
-232.873 | (158.287) | |||
|
Cognition score in [8, 11) |
-89.988 | (420.400) | |||
|
Cognition score in [0, 8) |
-235.406 | (379.792) | |||
|
Major illness |
49.144 | (148.420) | |||
|
P-value for pre-transfer income |
0.551 | ||||
| Children Characteristics | |||||
| Demographics |
Age |
45.188 | (33.500) | 44.621 | (33.803) |
|
Age squared/100 |
-48.652 | (34.362) | -47.573 | (34.734) | |
|
Oldest son |
269.309 | (358.486) | 260.596 | (351.774) | |
|
Youngest son |
13.740 | (211.908) | 20.508 | (224.390) | |
|
Daughter |
-207.249 | (126.633) | -226.639* | (133.484) | |
|
Married |
-26.839 | (339.553) | -32.229 | (323.768) | |
|
# of children (age < 16) |
98.688 | (78.154) | 102.906 | (78.549) | |
| SES |
Education (illiterates omitted) |
||||
|
Primary |
-145.349 | (170.049) | -154.430 | (172.322) | |
|
Middle school |
-5.779 | (187.153) | -5.304 | (186.350) | |
|
High school and above |
859.219*** | (264.286) | 839.743*** | (277.622) | |
NOTE: Robust standard errors in parentheses. * denotes p < 0.1; ** p < 0.05; *** p < 0.01.
SOURCE: Data from CHARLS 2008 pilot.
TABLE 9-6 Family Fixed Effect of Gross Transfer Probability (from children to parents)
| Children's Characteristics | (1) | (2) | (3) | (4) | (5) | (6) |
| Transfer | Financial Transfer | In-kind Transfer | ||||
|
Age |
0.060*** | (0.011) | 0.026*** | (0.009) | 0.055*** | (0.011) |
|
Age squared/100 |
-0.050*** | (0.012) | -0.020** | (0.009) | -0.047*** | (0.011) |
|
Oldest son |
-0.076** | (0.034) | -0.008 | (0.031) | -0.074** | (0.032) |
|
Youngest son |
-0.002 | (0.030) | 0.008 | (0.029) | -0.007 | (0.028) |
|
Daughter |
-0.043 | (0.029) | -0.035 | (0.028) | 0.031 | (0.028) |
|
Married |
0.143*** | (0.055) | 0.127** | (0.054) | 0.120** | (0.053) |
|
# of children (age < 16) |
0.002 | (0.016) | 0.010 | (0.013) | -0.016 | (0.010) |
|
Education (illiterate omitted) |
||||||
|
Primary school |
0.104*** | (0.037) | 0.082** | (0.032) | 0.075** | (0.037) |
|
Middle school |
0.069 | (0.047) | 0.076* | (0.043) | 0.068 | (0.044) |
|
High school and above |
0.122** | (0.049) | 0.140*** | (0.047) | 0.072 | (0.048) |
|
P-value for education |
0.011 | 0.015 | 0.243 | |||
|
Observations |
2,068 | 2,068 | 2,068 | |||
|
R-squared |
0.067 | 0.033 | 0.058 | |||
NOTES: (1) The sample includes those who are no younger than age 25, with at least one parent no younger than age 60, and at least one adult sibling who is not living with parents. (2) Clustered standard errors at family level are in parentheses. (3) * denotes p < 0.1; ** p < 0.05; *** p < 0.01.
SOURCE: Data from CHARLS 2008 pilot.
TABLE 9-7 Family Fixed Effect of Net Transfer Amount
| Children's Characteristics | (1) | (2) | (3) | (4) | (5) | (6) |
| Transfer | Financial Transfer | In-kind Transfer | ||||
|
Age |
-31.192 | (54.853) | -46.214 | (53.380) | 15.022* | (8.036) |
|
Age squared/100 |
19.621 | (55.265) | 36.560 | (53.616) | -16.938* | (8.961) |
|
Oldest son |
539.203 | (453.147) | 559.623 | (444.135) | -20.421 | (35.361) |
|
Youngest son |
-16.693 | (237.860) | -30.752 | (226.217) | 14.059 | (48.846) |
|
Daughter |
-231.014 | (141.305) | -225.758* | (124.928) | -5.256 | (49.848) |
|
Married |
140.903 | (228.044) | 46.342 | (208.387) | 94.562 | (62.126) |
|
# of children (age < 16) |
82.852 | (91.813) | 81.733 | (89.796) | 1.119 | (9.196) |
|
Education (illiterate omitted) |
||||||
|
Primary school |
-143.953 | (167.942) | -175.741 | (160.958) | 31.787 | (34.413) |
|
Middle school |
-336.365 | (336.321) | -362.308 | (322.653) | 25.943 | (55.805) |
|
High school and above |
735.808 | (449.759) | 675.833 | (435.832) | 59.975 | (45.856) |
|
P-value for education |
0.251 | 0.202 | 0.557 | |||
|
Observations |
2,059 | 2,059 | 2,059 | |||
|
R-squared |
0.017 | 0.018 | 0.004 | |||
NOTES: (1) The sample includes those who are no younger than age 25, with at least one parent no younger than age 60, and at least one adult sibling who is not living with parents. (2) Clustered standard errors at family level are in parentheses. (3) * denotes p < 0.1.
SOURCE: Data from CHARLS 2008 pilot.
cially for in-kind and total transfers. There is no relationship with being the youngest son or daughter.
Regarding the SES of the children, children’s educational attainment is significantly associated with the incidence of transfers, even in the more demanding family FE specification, although the magnitude of the coefficients drops substantially in the FE specification.
On the amount of net transfers, oldest sons are more likely to give more financial and total transfers, though the coefficients, while large, are not significant. Daughters, on the other hand, provide less, weakly significant for financial transfers.
Child schooling at the high school or above level is strongly related to the amount of net transfers given in the OLS regressions, but the education dummies as a group become insignificant, and the coefficient magnitudes decline once we take into account fixed family effects.
CONCLUSIONS
The economic literature has studied intergenerational transfers extensively. Most of the research is conducted in developed countries where the direction of transfers mainly goes from parents to children. In China, intergenerational transfers have long been an important source of elderly support. With rapid population aging, shrinking family size, and greater mobility of children, it is possible that the family may be losing its importance in the role of elderly support. In recent years the Chinese government has taken various efforts to develop its old-age support system, which may have further crowded out family support. As yet, we cannot say this with any degree of scientific validity. It is thus necessary to evaluate the current situation of intergenerational transfers first.
With detailed and high-quality data on intergenerational transfers, as well as rich information on both parents and their children, the CHARLS 2008 pilot provides a fine opportunity to achieve this goal. This chapter develops empirical models to explore the patterns and correlates of intergenerational transfers between the elderly parents and adult children in Zhejiang and Gansu provinces.
Contrary to the situations in most developed countries, we find that transfers are predominantly from children to elderly parents and still play important roles in the elderly support of current China. Our results reveal that older people with a larger number of offspring are more likely to receive transfers, a result indicating the potential challenge faced with dwindling number of children. Parental income has a mixed predication depending on how large is the pre-transfer income of the parent. For those among the bottom income group, the relationship is positive but becomes negative for the top income group. Within family, there is
responsibility-sharing among children, possibly based on children’s capabilities. For example, highly educated children transfer more frequently, as do married children. Although there is no significant difference in amount of transfers, oldest sons appear less likely to provide any transfer, which seems to contradict the conventional impression. Daughters are just as likely to give as other children but are likely to give less on net.
The one caveat about these results is that the older cohorts we studied still had an average of 3.4 children each, so the bite of the more stringent family planning programs that began in the 1970s has not been reached as yet. How transfers will evolve in later cohorts, who have fewer children but with more human capital and higher lifecycle incomes due to China’s rapid development, will need to be studied.
REFERENCES
Altonji, J.G., F. Hayashi, and L.J. Kotlikoff. (1997). Parental altruism and inter vivos transfers: Theory and evidence. Journal of Political Economy 105(6):1,121-1,166.
Becker, G.S. (1974). A theory of social interactions. Journal of Political Economy 82(6):1,063-1,093.
Cai, F., J. Giles, and X. Meng. (2006). How well do children insure parents against low retirement income? An analysis using survey data from urban China. Journal of Public Economics 90(12):2,229-2,255.
China Health and Retirement Longitudinal Survey. (2008). China Center for Economic Research, Peking University. Available: http://charls.ccer.edu.cn/charls/data.asp.
Chou, R.J. (2010). Filial piety by contract? The emergence, implementation, and implications of the “family support agreement” in China. The Gerontologist 51(1):3-16.
Cox, D. (1987). Motives for private income transfers. Journal of Political Economy 95(3):508-546.
Cox, D., and M. Fafchamps. (2008). Extended family, and kinship networks: Economic insights and evolutionary directions. In Handbook of Development Economics, Volume 4, T.P. Schultz and J. Strauss (Eds.). Amsterdam: North Holland Press.
Cox, D., and B.J. Soldo. (2004). Motivation for Money and Care That Adult Children Provide for Parents: Evidence from “Point-Blank” Survey Questions. CRR Working Paper No. 2004-17. Boston: Center for Retirement Research at Boston College.
Cox, D., E. Jimenez, and W. Okrasa. (1997). Family safety nets and economic transition: A study of worker households in Poland. Review of Income and Wealth 43(2):191-209.
Cox, D., Z. Eser, and E. Jimenez. (1998). Motives for private transfers over the life cycle: An analytical framework and evidence for Peru. Journal of Development Economics 55(1):57-80.
Frankenberg, E., L. Lillard, and R.J. Willis. (2002). Patterns of intergenerational transfers in Southeast Asia. Journal of Marriage and Family 64:627-641.
Goh, E.C.L. (2009). Grandparents as childcare providers: An in-depth analysis of the case of Xiamen, China. Journal of Aging Studies 23(1):60-68.
Hurd, M.D., J.P. Smith, and J.M. Zissimopoulos. (2007). Inter-Vivos Giving Over the Life Cycle. RAND Working Paper No. WR-524. Santa Monica, CA: RAND Corporation.
Kim, H. (2010). Intergenerational transfers and old-age security in Korea. Pp. 227-278 in The Economic Consequences of Demographic Change in East Asia, T. Ito and A. Rose (Eds.). NBER-EASE Volume 19 Book Series East Asia Seminar on Economics. Cambridge, MA: National Bureau of Economic Research.
Kotlikoff, L.J. (1988). Intergenerational transfers and savings. The Journal of Economic Perspectives 2(2):41-58.
Lee, Y., and Z. Xiao. (1998). Children’s support for elderly parents in urban and rural China: Results from a national survey. Journal of Cross-Cultural Gerontology 13(1998):39-62.
Lee, Y., W.L. Parish, and R.J. Willis. (1994). Sons, daughters, and intergenerational support in Taiwan. American Journal of Sociology 99(4):1,010-1,041.
Lei, X., C. Zhang, and Y. Zhao. (2011a). Old-Age Support and Protection in China. Unpublished manuscript, China Center for Economic Research, Peking University.
Lei, X., J. Strauss, M. Tian, and Y. Zhao. (2011b). Living Arrangements of the Elderly in China: Evidence from CHARLS. RAND Labor and Population Working Paper WR-866. Santa Monica, CA: RAND.
Lillard, L.A., and R.J. Willis. (1997). Motives for intergenerational transfers: Evidence from Malaysia. Demography 34(1):115-134.
McGarry, K., and R.F. Schoeni. (1995). Transfer behavior in the Health and Retirement Study: Measurement and the redistribution of resources within the family. The Journal of Human Resources, Special Issue on the Health and Retirement Study: Data Quality and Early Results 30(30):S184-S226.
National Bureau of Statistics of China (2009). China’s Population and Employment Statistical Yearbook. Beijing: China Statistics Press.
Nugent, J. (1985). The old-age security motive for fertility. Population and Development Review 11(1):75-97.
Rosenzweig, M.R., and K.I. Wolpin. (1993). Intergenerational support and the life-cycle incomes of young men and their parents: Human capital investments, co-residence, and intergenerational financial transfers. Journal of Labor Economics 11(1):84-112.
Secondi, G. (1997). Private monetary transfers in rural China: Are families altruistic? Journal of Development Studies 33(4):487-509.
Smith, J., J.J. McArdle, and R. Willis. (2010). Financial decision making and cognition in a family context. The Economic Journal 120 (November):F363-F380.
Zhao, Y., J. Strauss, A. Park, Y. Shen, and Y. Sun. (2009). China Health and Retirement Longitudinal Study, Pilot, User’s Guide. National School of Development, Peking University.


