National Academies Press: OpenBook

Review of the EPA's Economic Analysis of Final Water Quality Standards for Nutrients for Lakes and Flowing Waters in Florida (2012)

Chapter: Appendix A: Narrative, Numeric, and Proposed Florida Nutrient Criteria Processes Illustrated

« Previous: Acronyms
Suggested Citation:"Appendix A: Narrative, Numeric, and Proposed Florida Nutrient Criteria Processes Illustrated." National Research Council. 2012. Review of the EPA's Economic Analysis of Final Water Quality Standards for Nutrients for Lakes and Flowing Waters in Florida. Washington, DC: The National Academies Press. doi: 10.17226/13376.
×

Appendix A

Narrative, Numeric, and
Proposed Florida Nutrient
Criteria Processes Illustrated

Figures A-1, A-2, and A-3 at the end of this Appendix describe the narrative, numeric, and proposed Florida nutrient criteria processes, respectively. The Committee was unable to find similar flow diagrams developed by either EPA or FDEP, so the diagrams were developed internally as a means to better understand the differences in the processes. The Committee does not contend that these diagrams precisely illustrate the manner in which EPA or FDEP would implement any of the three processes. Rather, the diagrams were developed at a level of detail sufficient to compare key steps in the processes and understand the sequence and timing of events necessary to implement nutrient criteria under each.

image

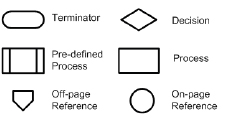
In each of the figures, common flow charting symbols are used. Rectangles represent processes, diamonds represent binary decision points (yes or no), while ovals represent terminal points in the process—a beginning or an ending. Circles and pentagons transfer the reader to other points in the processes where the next sequential step occurs if it does not directly follow the previous step in the overall process.

Suggested Citation:"Appendix A: Narrative, Numeric, and Proposed Florida Nutrient Criteria Processes Illustrated." National Research Council. 2012. Review of the EPA's Economic Analysis of Final Water Quality Standards for Nutrients for Lakes and Flowing Waters in Florida. Washington, DC: The National Academies Press. doi: 10.17226/13376.
×

image

FIGURE A-1 Process for Narrative Nutrient Criteria

Suggested Citation:"Appendix A: Narrative, Numeric, and Proposed Florida Nutrient Criteria Processes Illustrated." National Research Council. 2012. Review of the EPA's Economic Analysis of Final Water Quality Standards for Nutrients for Lakes and Flowing Waters in Florida. Washington, DC: The National Academies Press. doi: 10.17226/13376.
×

image

FIGURE A-2 Process for Numeric Nutrient Criteria in Flowing Waters

Suggested Citation:"Appendix A: Narrative, Numeric, and Proposed Florida Nutrient Criteria Processes Illustrated." National Research Council. 2012. Review of the EPA's Economic Analysis of Final Water Quality Standards for Nutrients for Lakes and Flowing Waters in Florida. Washington, DC: The National Academies Press. doi: 10.17226/13376.
×

image

FIGURE A-3 Process for Florida’s Proposed Nutrient Criteria

Suggested Citation:"Appendix A: Narrative, Numeric, and Proposed Florida Nutrient Criteria Processes Illustrated." National Research Council. 2012. Review of the EPA's Economic Analysis of Final Water Quality Standards for Nutrients for Lakes and Flowing Waters in Florida. Washington, DC: The National Academies Press. doi: 10.17226/13376.
×

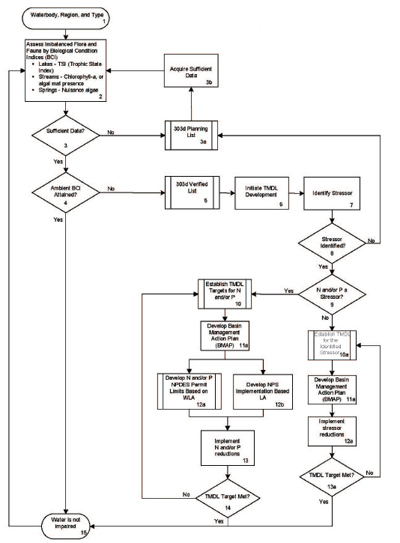
Figures A-1, A-2, and A-3 all reflect the continuing assessment process expected under the Clean Water Act (CWA). They begin with the identification and assessment of a waterbody. If that water is listed as impaired, steps follow leading to the development of a TMDL for the stressor; implementation of actions to reduce the pollutant loading (the basin management action plan or BMAP as required under Florida law); and finally a process to ascertain when the designated use is met (delisting in the CWA process). Beyond this general similarity, however, there are significant differences in the sequence of actions that occur in the three processes and what is assumed about the activities and the decisions encountered in each. These differences in assumptions can lead to differences in cost estimates.

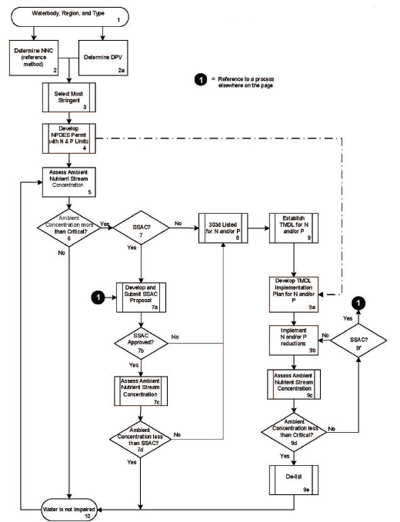
In the current Florida narrative process (Figure A-1), it is apparent the process has additional steps for determining impairment compared to the EPA numeric nutrient criteria process (Figure A-2). First, the narrative process requires impairment identification for the narrative nutrient criteria—an imbalance of flora and fauna as determined by surrogate indicators. Once a determination is made regarding whether sufficient data exist and whether the data point to nutrients as a stressor, then the water is listed as impaired, a TMDL developed, and load reduction implemented through a BMAP. By contrast, the EPA numeric process (Figure A-2) simply determines impairment based on whether the N and P criteria are exceeded in ambient waters. If so, and if site-specific alternative criteria (SSAC) have not been developed, the water is listed as impaired and a TMDL developed and implemented.

In both processes, waters are determined to return to compliance and removed from the impaired waters list if the ambient water quality criteria are met. In the case of the narrative process, the water is removed once the water supports its biological use, while in the numeric process the waters are removed if the N and P criteria are met. The processes then begin another iteration of evaluating the waters for compliance with either the narrative or numeric criteria.

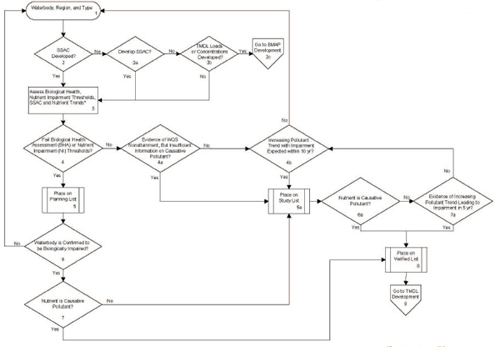
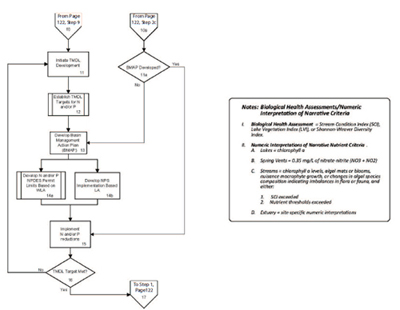
The proposed Florida process (Figure A-3) is significantly more complex than either the current narrative or EPA numeric nutrient criteria processes. The proposed process first ascertains if SSACs or TMDLs have been approved for a given waterbody. If a TMDL has already been developed, the process jumps forward to TMDL implementation or the BMAP process. If a TMDL has not been developed, but an SSAC has been approved, the waterbody is assessed against the SSAC. If an SSAC has not been approved, the waterbody is evaluated against “numeric interpretations of narrative nutrient criteria” (interpretations) and numeric nutrient thresholds. The thresholds are similar to numeric nutrient criteria in that numeric values are established for N and P. The main difference is that a failure of a threshold begins a process of additional study to see if biologi-

Suggested Citation:"Appendix A: Narrative, Numeric, and Proposed Florida Nutrient Criteria Processes Illustrated." National Research Council. 2012. Review of the EPA's Economic Analysis of Final Water Quality Standards for Nutrients for Lakes and Flowing Waters in Florida. Washington, DC: The National Academies Press. doi: 10.17226/13376.
×

cal impairments are manifested in the waterbody. If not, the waterbody is not deemed as impaired. If there is a biological impairment signal, the water is listed as impaired, a TMDL developed, and a BMAP developed and implemented.

Additionally, waters can be identified as impaired if there is an adverse trend in nutrients or nutrient indicators. In other words, if long-term data show a decline in water quality as evidenced by an adverse trend in either nutrient or nutrient indicator monitoring data, the water is studied further. If modeling indicates the adverse trend will result in a waterbody impairment within five years, the water is listed as impaired, a TMDL developed, and a BMAP developed and implemented.

Once a TMDL is triggered in the proposed process, the steps taken from that point on are essentially the same as the current narrative process. A TMDL will be developed and plan to implement the TMDL will be developed through the BMAP process.

As described in Chapter 3 of the report, both the narrative process and the proposed Florida process opt to minimize Type I error—listing a waterbody as impaired that is not truly impaired. Therefore, more study is required to identify biological impairments and to identify nutrients as stressors for the impairment. This additional study necessarily results in added time required to reach the TMDL stage in the overall process. The EPA numeric process opts to minimize Type II error—not listing a waterbody as impaired that is truly impaired. That practice moves more quickly to the TMDL stage of the process, but there is no apparent increase in the speed at which TMDLs will be developed and implemented.

Links to additional information on the three processes can be found as follow:

I.  The current Florida narrative nutrient criteria process

A.   General historical information http://www.dep.state.fl.us/water/wqssp/nutrients/

B.   Rule 62-302 – Surface Water Quality Standards http://www.dep.state.fl.us/legal/Rules/shared/62-302/62-302.pdf

C.   Rule 62-303 – Identification of Impaired Surface Waters http://www.dep.state.fl.us/legal/Rules/shared/62-303/62-303.pdf

II. The EPA numeric nutrient criteria process

A.   General historical information http://edocket.access.gpo.gov/2010/2010-29943.htm

B.   EPA final rule adopting the Florida numeric nutrient criteria http://water.epa.gov/lawsregs/rulesregs/florida_index.cfm

III. The proposed Florida nutrient criteria process

A.   General historical information http://www.dep.state.fl.us/water/wqssp/nutrients/

Suggested Citation:"Appendix A: Narrative, Numeric, and Proposed Florida Nutrient Criteria Processes Illustrated." National Research Council. 2012. Review of the EPA's Economic Analysis of Final Water Quality Standards for Nutrients for Lakes and Flowing Waters in Florida. Washington, DC: The National Academies Press. doi: 10.17226/13376.
×

B.   Proposed Rule 62-302 – Surface Water Quality Standards http://www.dep.state.fl.us/water/wqssp/nutrients/docs/meetings/62_302_final.pdf

C.   Proposed Rule 62-303 – Identification of Impaired Surface Waters http://www.dep.state.fl.us/water/wqssp/nutrients/docs/meetings/62_303_final.pdf

Suggested Citation:"Appendix A: Narrative, Numeric, and Proposed Florida Nutrient Criteria Processes Illustrated." National Research Council. 2012. Review of the EPA's Economic Analysis of Final Water Quality Standards for Nutrients for Lakes and Flowing Waters in Florida. Washington, DC: The National Academies Press. doi: 10.17226/13376.
×
Page 119
Suggested Citation:"Appendix A: Narrative, Numeric, and Proposed Florida Nutrient Criteria Processes Illustrated." National Research Council. 2012. Review of the EPA's Economic Analysis of Final Water Quality Standards for Nutrients for Lakes and Flowing Waters in Florida. Washington, DC: The National Academies Press. doi: 10.17226/13376.
×
Page 120
Suggested Citation:"Appendix A: Narrative, Numeric, and Proposed Florida Nutrient Criteria Processes Illustrated." National Research Council. 2012. Review of the EPA's Economic Analysis of Final Water Quality Standards for Nutrients for Lakes and Flowing Waters in Florida. Washington, DC: The National Academies Press. doi: 10.17226/13376.
×
Page 121
Suggested Citation:"Appendix A: Narrative, Numeric, and Proposed Florida Nutrient Criteria Processes Illustrated." National Research Council. 2012. Review of the EPA's Economic Analysis of Final Water Quality Standards for Nutrients for Lakes and Flowing Waters in Florida. Washington, DC: The National Academies Press. doi: 10.17226/13376.
×
Page 122
Suggested Citation:"Appendix A: Narrative, Numeric, and Proposed Florida Nutrient Criteria Processes Illustrated." National Research Council. 2012. Review of the EPA's Economic Analysis of Final Water Quality Standards for Nutrients for Lakes and Flowing Waters in Florida. Washington, DC: The National Academies Press. doi: 10.17226/13376.
×
Page 123
Suggested Citation:"Appendix A: Narrative, Numeric, and Proposed Florida Nutrient Criteria Processes Illustrated." National Research Council. 2012. Review of the EPA's Economic Analysis of Final Water Quality Standards for Nutrients for Lakes and Flowing Waters in Florida. Washington, DC: The National Academies Press. doi: 10.17226/13376.
×
Page 124
Suggested Citation:"Appendix A: Narrative, Numeric, and Proposed Florida Nutrient Criteria Processes Illustrated." National Research Council. 2012. Review of the EPA's Economic Analysis of Final Water Quality Standards for Nutrients for Lakes and Flowing Waters in Florida. Washington, DC: The National Academies Press. doi: 10.17226/13376.
×
Page 125
Suggested Citation:"Appendix A: Narrative, Numeric, and Proposed Florida Nutrient Criteria Processes Illustrated." National Research Council. 2012. Review of the EPA's Economic Analysis of Final Water Quality Standards for Nutrients for Lakes and Flowing Waters in Florida. Washington, DC: The National Academies Press. doi: 10.17226/13376.
×
Page 126
Next: Appendix B: Biographical Sketches of Committee Members and Staff »
Review of the EPA's Economic Analysis of Final Water Quality Standards for Nutrients for Lakes and Flowing Waters in Florida Get This Book
×
 Review of the EPA's Economic Analysis of Final Water Quality Standards for Nutrients for Lakes and Flowing Waters in Florida
Buy Paperback | $42.00 Buy Ebook | $33.99
MyNAP members save 10% online.
Login or Register to save!
Download Free PDF

The Environmental Protection Agency's estimate of the costs associated with implementing numeric nutrient criteria in Florida's waterways was significantly lower than many stakeholders expected. This discrepancy was due, in part, to the fact that the Environmental Protection Agency's analysis considered only the incremental cost of reducing nutrients in waters it considered "newly impaired" as a result of the new criteria-not the total cost of improving water quality in Florida. The incremental approach is appropriate for this type of assessment, but the Environmental Protection Agency's cost analysis would have been more accurate if it better described the differences between the new numeric criteria rule and the narrative rule it would replace, and how the differences affect the costs of implementing nutrient reductions over time, instead of at a fixed time point. Such an analysis would have more accurately described which pollutant sources, for example municipal wastewater treatment plants or agricultural operations, would bear the costs over time under the different rules and would have better illuminated the uncertainties in making such cost estimates.

READ FREE ONLINE

  1. ×

    Welcome to OpenBook!

    You're looking at OpenBook, NAP.edu's online reading room since 1999. Based on feedback from you, our users, we've made some improvements that make it easier than ever to read thousands of publications on our website.

    Do you want to take a quick tour of the OpenBook's features?

    No Thanks Take a Tour »
  2. ×

    Show this book's table of contents, where you can jump to any chapter by name.

    « Back Next »
  3. ×

    ...or use these buttons to go back to the previous chapter or skip to the next one.

    « Back Next »
  4. ×

    Jump up to the previous page or down to the next one. Also, you can type in a page number and press Enter to go directly to that page in the book.

    « Back Next »
  5. ×

    Switch between the Original Pages, where you can read the report as it appeared in print, and Text Pages for the web version, where you can highlight and search the text.

    « Back Next »
  6. ×

    To search the entire text of this book, type in your search term here and press Enter.

    « Back Next »
  7. ×

    Share a link to this book page on your preferred social network or via email.

    « Back Next »
  8. ×

    View our suggested citation for this chapter.

    « Back Next »
  9. ×

    Ready to take your reading offline? Click here to buy this book in print or download it as a free PDF, if available.

    « Back Next »
Stay Connected!