
The Institute of Medicine (IOM) committee requested that several health systems (Henry Ford Health System, Geisinger Health System, and Veterans Health Administration) and one state records linkage system (South Carolina) gather data in response to a list of surveillance questions for their populations and analyze the strengths and limitations of their systems in generating information about epilepsy. Researchers in each system generously responded to the committee’s request and provided candid evaluations of their systems’ ability to capture data on epilepsy. The following questions were posed to each system:
1. Overall Description: What are the major features of your data system and the major ways your organization makes use of the data?
• Major sources of data (billing, medical charts, surveys, vital records, etc.)
• Methods for identifying and classifying people with epilepsy
• Capacity to follow individuals over time
• Used for management, clinical, policy decision making, research, etc.
• Algorithms and characterizations used
• Strengths and limitations of your type of data system to report data on epilepsy
2. Incidence and Prevalence:
• What are the overall incidence of epilepsy in your population per 100,000 person-years and prevalence per 1,000 persons?
• What are the incidence and prevalence by gender, race/ethnicity, age ranges (< 19, 19-64, > 64), and/or insurance status (public, private, none)? (Use Office of Management and Budget [OMB] classification for race/ethnicity, collapsing American Indian/Alaska Native, Native Hawaiian-Pacific Islander, and “two or more” into an “other” category to produce the following groups: Hispanic, non-Hispanic black/African American, non-Hispanic white, non-Hispanic Asian, and non-Hispanic other.)
• What time period is covered by these incidence, prevalence, and demographic data?
• Methods—short description of methods or algorithms used to make the estimates
• Strengths and limitations of your type of data system to identify incidence and prevalence and at what level of granularity
3. Comorbidities:
• For those patients with prevalent epilepsy, what percentage also has comorbid conditions?
• For those patients with incident epilepsy, what percentage also has preexisting comorbid conditions?
• Methods—short description of methods or algorithms used to make the estimates
• Strengths and limitations of your type of data system to link with comorbidities
4. Health Care Services:
• For those with psychiatric comorbid conditions (e.g., depression, anxiety, bipolar disorder, schizophrenia/psychosis), how many are receiving treatment for those conditions?
• What is the percentage of patients in your epilepsy population receiving epilepsy care by type of provider (primary care, neurologist, epileptologist)? Provide this separately for incident and prevalent epilepsy.
• What is the percentage of patients in your epilepsy population with seizure medication use (mono- versus polytherapy)? With antidepressant use? With both seizure medication and antidepres-
sant drug use? Provide this for prevalent and incident epilepsy separately.
• What are annual rates of use (percentage with use, average number of services among users) and costs (average) of hospital care, emergency room care, physician services, and seizure medications for individuals with epilepsy? Provide this separately for prevalent and incident epilepsy. Provide comparable figures for the full non-epilepsy patient population as well.
• How many patients annually receive neurosurgical interventions, including epilepsy surgery and neurostimulator implants? Provide this separately for incident and prevalent epilepsy.
• How many patients annually receive electroencephalograph (EEG), magnetic resonance imaging (MRI), or video-EEG monitoring related to their epilepsy? Provide this separately for incident and prevalent epilepsy.
• Methods—short description of methods or algorithms used to make the estimates
• Strengths and limitations of your type of data system to assess services
5. Ideas for improving epilepsy surveillance through the use of health systems data (optional)
The systems were also provided with the relevant International Classification of Diseases, Ninth Revision, Clinical Modification (ICD-9-CM) codes and algorithms to identify epilepsy cases, health care service use, and comorbidities:
• Incident epilepsy: A single medical encounter with an ICD-9 code of 345.xx in the absence of a prior 345.xx code in the medical record or two or more medical encounters on separate days each with an ICD-9 code of 780.39 in the absence of a prior 780.39 code or 345.xx code in the medical record or a single medical encounter with an ICD-9 code of 780.39 and a seizure medication prescribed for outpatient use for 3 or more months without a prior 780.39 code or 345.xx code.
• Prevalent epilepsy: A single medical encounter with an ICD-9 code of 345.xx or two or more medical encounters on separate days each with an ICD-9 code of 780.39 or a single medical encounter with an ICD-9 code of 780.39 and a seizure medication prescribed for outpatient use for 3 or more months. These codes can be in the primary field or a secondary field.
- Incident and prevalent cases in estimating health care service use: The health care use of prevalent and incident cases should be included, even if the incident case contributes only a day to the prevalent year.
- Diagnostic fields for comorbidities: Use both the primary and the secondary diagnosis field.
-
- Mental Disorders—290-319 inclusive
- Other Major Neurological Disorders
-Cerebral palsy—343.x
-Cerebrovascular accident
• 434.xx Occlusion of cerebral arteries
• 435.x Transient cerebral ischemia
-Dementia
• 290.xx Dementias
• 294. lx Dementia in conditions classified elsewhere
-Parkinson’s disease—332.x
-Multiple sclerosis—340
® Traumatic Brain Injur (TBI)
-310 Specific nonps chotic mental disorders due to brain damage
-850-854 (concussion and other)
® Autism—299.x
® Other Chronic Disease
-410-414 (ischemic heart disease)
-401-405 (h pertensive heart disease)
® Asthma—493.xx
The following summaries of each system’s data-gathering effort help to identify the opportunities and barriers to surveillance of the epilepsies using linked electronic health records (EHRs). Although the data are not comparable due to the variety of methodologies used across the systems, each summary is informative about current U.S. surveillance capabilities and opportunities for improving surveillance of the epilepsies.
HENRY FORD HEALTH SYSTEM
David R. Nerenz, Ph.D.
Gregory L. Barkley, M.D.
Marianna Spanaki-Varelas, M.D., Ph.D.
Aida Li
Organizational Context
The Henry Ford Health System is a large, vertically integrated system with 6 hospitals, a 1,000-member multispecialty group practice, more than 2,000 other affiliated private practice physicians, more than 30 ambulatory care centers, a 500,000-member managed care plan, free-standing emergency rooms, and many other components or “business units.”
The Henry Ford Comprehensive Epilepsy Program at Henry Ford Hospital (HFH) and Henry Ford West Bloomfield Hospital (HFWBH) serves as a tertiary referral center for epilepsy care for southeast Michigan (metropolitan Detroit) and, to some extent, for a wider area that includes the rest of the State of Michigan and northern Ohio. Some patients with epilepsy are seen as one-time consults, some are seen for ongoing care through referrals from non-Henry Ford physicians, and some are seen as part of a broader medical care relationship that includes primary care and other types of specialty care within the Henry Ford Medical Group (HFMG). Patients with epilepsy who are members of Health Alliance Plan (HAP—the system-affiliated health plan) may elect to receive care from HFMG physicians but may also elect to receive care from other physician networks.
In analyzing patterns of care for patients with epilepsy then, it is a challenge to distinguish visits that represent the first contact with an HFMG physician for long-standing epilepsy from visits that represent the true onset of the condition. It is also a challenge to estimate overall service use (e.g., hospitalizations, emergency department [ED] visits), since not all services are necessarily provided within the HFH-HFWBH-HFMG network. For these reasons, some analyses reported here were conducted within a defined population of individuals who were HAP members assigned to the HFMG for care; others were conducted in a larger population of patients receiving epilepsy care at the HFH, HFWBH, or HFMG who were not necessarily HAP members. Because HAP has a record of all paid claims, including claims from other hospitals or physician networks, it is possible to get a complete picture of services provided to HAP members; it is not possible to guarantee a complete picture of services provided to patients with other types of insurance.
Methods
HAP-HFMG Patients
Using existing administrative data, we identified all individuals who were HAP members assigned to the HFMG for care for the years 2006-2010. (This is a well-defined population used as a denominator population for a variety of research and quality improvement projects.) Using the HFHS Corporate Data Store (an administrative database with data on all inpatient and outpatient care in the HFH and HFMG used for a combination of financial analysis, quality improvement, and research purposes), we identified all individuals with one or more encounters with a primary or secondary diagnostic code of epilepsy or seizure.1 For all of these individuals, we conducted a “look-back” search in records of prior years (potentially as far back as 1995 for patients whose records went back that far) to identify whether there had been previous inpatient or outpatient encounters for epilepsy. If no, cases were then labeled as “incident cases” for the year in which the first coded encounter occurred. If yes, cases were labeled as “prevalent cases” in any year in which an epilepsy-related encounter occurred. Incident cases in any one year typically became prevalent cases in later years, but patients with encounters in only one year were counted as incident cases in that year and were not counted as prevalent cases.
Patients with All Insurance Types
Using the Corporate Data Store, we identified all patients who had had one or more inpatient or outpatient encounters for epilepsy or seizure disorder (using the same ICD-9 diagnostic codes) at the HFH or with HFMG physicians in 2009 or 2010. We then conducted look-back analyses for these patients to identify the first coded encounter at the HFH or HFMG for epilepsy, the site of care for that first encounter (e.g., clinic, hospital, ED), and the specialty department of the first encounter.
Sample for Full Medical Record Review
Because of concerns about limitations of the administrative data, we created a random sample of cases that had been identified in the HAP-HFMG cohort of both incident and prevalent cases. We conducted a focused review of the complete electronic medical record (EMR) for these
_______________
1ICD-9 codes to identify epilepsy: 345.0, 345.00, 345.01, 345.1, 345.10, 345.11, 345.2, 345.3, 345.4, 345.40, 345.41, 345.5, 345.50, 345.51, 345.6, 345.60, 345.61, 345.7, 345.70, 345.71, 345.8, 345.80, 345.81, 345.9, 345.90, 345.91, 780.39.
patients to confirm diagnosis of epilepsy, use of anti-epileptic medications, and use of antidepressant medications.
Incidence or Prevalence
Incidence estimates were calculated for each of the 5 years 2006-2010, using the number of incident cases (definition above) as the numerator and the number of HAP-HFMG-assigned individuals in each year as the denominator. Similarly, prevalence estimates were calculated each year and then again for the entire 5-year period by identifying the unique patients included in any one year as the numerator and the unique individuals who were in the denominator populations in any year as the 5-year denominator.
Patient Demographics
Patient age, gender, and race or ethnicity were available as standard data elements in the Corporate Data Store. Patient age was recorded in the year in which he or she was identified as either an incident or a prevalent case (HAP-HFMG cohort) or the year in which he or she was first seen in the 2009-2010 cohort.
Use of Medications
Pharmacy claims data in the Corporate Data Store for the HAP-HFMG cohort were used to identify filled prescriptions for either anti-epileptic medications2 or antidepressant medications. The claims data include prescriptions filled at Henry Ford pharmacies as well as “outside” pharmacies, but do not include prescriptions paid either by patients themselves or by other insurance.
_______________
2Acetazolamide, carbamazepine, carbamazepine XR, Carbatrol, Celontin, Depacon, Depakene, Depakote, Depakote ER, Depakote Sprinkle, Diamox Sequels, Dilantin, Dilantin-125, di-valproex sodium, divalproex sodium ER, Epitol, Equetro, ethosuximide, Fanatrex, felbamate, Felbatol, fosphenytoin sodium, gabapentin, Gabitril, Gralise, Keppra, Keppra XR, Lamictal, Lamictal (Blue), Lamictal (Green), Lamictal (Orange), Lamictal ODT, Lamictal ODT (Blue), Lamictal ODT (Green), Lamictal ODT (Orange), Lamictal XR, Lamictal XR (Blue), Lamictal XR (Green), Lamictal XR (Orange), lamotrigine, levetiracetam, Lyrica, Mebaral, Mysoline, Nembutal Sodium, Neurontin, oxcarbazepine, Peganone, pentobarbital sodium, phenobarbital, Phenytek, phenytoin, phenytoin sodium, potassium bromide, primidone, Sabril, Stavzor, Tegretol, Tegretol XR, Topamax, Topiragen, topiramate, Trileptal, valproate sodium, valproic acid, Vimpat, Zarontin, Zonegran, zonisamide.
Service Utilization
The Corporate Data Store was used to identify outpatient visits, ED visits, hospitalizations, or other forms of service use for epilepsy. ICD-9 diagnostic codes were used to identify epilepsy-related encounters. Current Procedural Terminology (CPT) and ICD-9 procedure codes were used to identify epilepsy surgeries and services in the inpatient Epilepsy Monitoring Unit (EMU). The EMU includes video-EEG monitoring for all cases, and an MRI is standard practice, either just before or just after the EMU admission.
Other Patterns of Care Issues
Provider, department, and site codes available for every encounter in the Corporate Data Store were used to calculate time intervals between initial presentation for epilepsy and consult with a neurologist and “flow patterns” between the ED, other sites of care (e.g., primary care), and neurology.
Results
Analysis of Administrative Database on an Enrolled Population
Incidence or prevalence The incidence of epilepsy in the population was estimated at 266 per 100,000 in 2006 and 163 per 100,000 in 2010. There was a gradual, steady decline in estimated incidence of new cases over the 5-year study period. This incidence is considerably higher than the 48 per 100,000 reported by Hirtz and colleagues (2007). We believe that the higher incidence estimate here may reflect the fact that health plan members are free to choose a provider network and that plan members with epilepsy, or with newly diagnosed epilepsy, would be inclined to select the HFMG network upon either joining the health plan or receiving the diagnosis. They would appear to be incident cases in our administrative data set, but some would not in fact be incident cases and others would be, but would be “self-selecting” into both numerator and denominator populations used to calculate incidence.
The prevalence of epilepsy was relatively stable over the 5-year period, with each individual year yielding an estimate of approximately 4 cases per 1,000 in the denominator population. We also identified all of the individuals who had been in the denominator population in any of the 5 years studied and calculated a prevalence estimate in that larger group. The numerator in this estimate included any individual who had had an encounter coded as epilepsy or seizure disorder at any time during the 5-year period. This prevalence estimate was approximately 8 per 1,000 (1,884 out
of 231,347). We believe that the difference between the prevalence estimate based on single-year data and the estimate based on 5-year data reflects the fact that many patients with stable, well-controlled epilepsy are seen at intervals greater than one year, so they appear in the numerator once or twice in the data set in a 5-year period, but do not appear in each individual year, even though they are consistently in the denominator population.
Demographics About two-thirds of both incident and prevalent cases were adults between the ages of 19 and 64. The remaining cases were evenly split between children (< 19) and older adults (65+). There were approximately equal numbers of males and females among both incident and prevalent cases. The race or ethnicity distribution of the incident and prevalent cases reflected the distribution of both health plan membership and the Detroit area, with relatively large black and non-Hispanic white groups (each approximately 40-50 percent of the total) and much smaller Hispanic, Asian, or other groups.
Comorbidity Patients with epilepsy in our population also had other medical and psychiatric conditions for which they receive care. In the 1,603 incident cases for example, 1,213, or 76 percent, had at least one other coded diagnosis at an HFMG medical encounter. In the 3,258 cases who had either incident or prevalent epilepsy, 1,174, or 36 percent, had another psychiatric condition coded for at least one visit, along with epilepsy.
Sources of care Virtually all patients had at least one physician encounter of some kind in any one study year. The average number of physician office visits for incident cases in the year in which they were diagnosed was approximately 12; the average number of physician office visits for prevalent cases in any year in which they had at least one visit at all was in the range of 9-10. Most encounters for which epilepsy was coded were with neurologists. Fewer than 20 percent of cases have a recorded ED visit (although ED visits at hospitals outside the Henry Ford system would not be recorded); 25-30 percent of cases have visits with primary care physicians, and approximately 75 percent have at least one visit with a neurologist.
Use of medications The pharmacy claims data for both incident and prevalent cases did not show any filled prescriptions at all for 20 percent of the patients. Although this could conceivably reflect a true absence of prescriptions filled, it seemed to us more likely that to be a reflection of patients’ having drugs paid for through an insured spouse or perhaps having a benefits plan with a high deductible for prescription drugs so that some prescriptions were not shown as having been paid for by HAP.
Keeping this issue in mind, we found that 25-30 percent of the incident
cases in any one of the 5 years had a filled prescription for anti-epileptic medications in that year and 55-65 percent of the prevalent cases had a prescription for anti-epileptic medications in any one of the 5 years. Approximately 20 percent of both incident and prevalent cases had a prescription for antidepressant drugs in any one of the 5 years. Approximately 5-10 percent of the incident cases and 15 percent of the prevalent cases had both types of medications in any one year. Because all of these proportions seemed unreasonably low, we generated a random sample of 100 cases from the lists of both incident and prevalent cases in order to more carefully analyze the use of prescription drugs by doing a complete review of the patients’ EMRs.
Medical Record Review
Of the 100 cases selected for full medical record review, 72 were confirmed as having epilepsy, either through text in physician notes or text from EEG or EMU reports; 6 of the remaining 28 had possible epilepsy, but the diagnosis either was not confirmed by EEG testing (e.g., patient was seen in the ED several times and did not return for EEG evaluation) or was in some other way ambiguous. Of the 22 remaining patients, the primary reasons for reactive seizures other than epilepsy were encephalopathy, brain tumor, alcohol withdrawal, or hydrocephalus. In one case, a neurocardiogenic syncope was the diagnosis eventually given to what had originally been labeled as a seizure.
All but one of the 72 cases with confirmed epilepsy were receiving seizure medications. That one patient had been seizure-free since 1989 and seizure-free after having been weaned off anti-epileptic medications for 2 years prior to the 5-year study period. Use of antidepressant medications was much less common in these patients; only 7 of the 72 confirmed cases were prescribed antidepressant medications during the 5-year study period.
Administrative Data on Hospitalizations and ED Visits
The proportion of patients hospitalized in any one year was higher among incident cases than among prevalent cases, perhaps reflecting admissions to the EMU as part of the process of establishing epilepsy as a diagnosis for seizures. The mean number of hospitalizations for a patient in any one year was in the range of 1.7-2.2 for both incident and prevalent cases, among those with any hospitalizations at all. The maximum number of hospitalizations observed in any one year was 13 for incident cases and 22 for prevalent cases. The proportion of incident cases with at least one hospitalization in each year ranged from 43 percent in 2006 to 55 percent in 2010. The proportion of prevalent cases with at least one hospitalization
in each year was stable in the range of 26-29 percent across the 5 years studied.
ED care was relatively stable in its occurrence, both across study years and in incident and prevalent cases. Among incident cases, the proportion with at least one ED visit ranged from 30 to 38 percent in specific study years. Among prevalent cases, the range was 29 to 33 percent. There were on average of two to three ED visits per year among those patients who had any ED visits at all, among both incident and prevalent cases. (We note that not all ED visits were for epilepsy or epilepsy-related problems.)
Surgical treatment was relatively rare. There were only seven surgeries among 1,603 incident cases in the 5-year study period and 24 among the 1,884 prevalent cases. This rate is, however, higher than that reported nationally. Our higher rate probably reflects the presence of a well-respected epilepsy surgery program in the medical group and the potential for health plan members who might be candidates for surgery to elect the HFMG network and thereby enter both numerator and denominator of the surgery rate.
Patterns of Care for Patients with All Insurance Types
There were 9,588 patients in 2009-2010 who met criteria for epilepsy based on ICD-9 diagnostic code criteria and were seen by HFMG physicians at one of 35 clinic sites. An additional 2,588 patients in the same time period were classified as “possible epilepsy” based on the presence of just one epilepsy code (suggesting its use as a “rule-out” diagnosis) or an ICD-9 code such as “seizure or seizure disorder” that could signify either epilepsy or some other form of seizure.
The distributions of age, gender, and race or ethnicity were essentially the same in this larger sample of patients as in the cohort of HAP-HFMG patients described above. Most of the patients were in the 19-64 age range, most were either non-Hispanic black or white, and there were approximately equal numbers of males and females. The proportion of patients insured by Medicare was larger than the proportion of patients over age 65, suggesting that many patients with epilepsy had obtained Medicare coverage on the basis of disability.
A preliminary examination of patterns of visits to different types of providers suggested the presence of four distinct groups of patients under care for epilepsy at Henry Ford. These include the following:
- patients in the system with a primary care relationship who develop epilepsy;
- patients who come to the neurology department from outside the system for outpatient consult or referral;
- patients whose first point of contact for epilepsy is the ED at a Henry Ford facility; and
- patients whose first point of contact is a hospital admission.
Of the 9,588 patients, the first known point of contact was neurology for 4,269 of them (44 percent). The ED was the most common first point of known contact other than neurology. Among the patients who had a first contact in the ED, 52 percent did not have a subsequent visit to neurology, 16 percent went from the ED to neurology without an intervening visit elsewhere, and the remaining 32 percent had a visit to some other department and then had a visit in neurology after that.
Of the patients who had a first point of contact for epilepsy other than neurology, 2,838 saw a neurologist in our system at some point; 2,438 did not see a neurologist in our system. Among the total of 9,588 patients with epilepsy then, 7,107 (74 percent) saw a neurologist at Henry Ford at some time.
For the patients who had a first point of contact other than neurology, the average time from first contact to a neurology visit was 15.3 months. The average time was longer for adults than for either children or adults over 65 and was somewhat longer for black patients than for white patients.
The role of Henry Ford as a regional referral center suggests that at least some visits to Neurology for patients with epilepsy are for consults, second opinions, or purposes other than continuing care. Among the patients whose first recorded contact was in neurology:
• most (3,303) had subsequent epilepsy care provided in both pri-mary care and neurology;
• only a very small number (27) had all subsequent epilepsy visits in primary care; and
• many of the remaining 939 neurology-only patients were one-time consults.
In the larger sample of patients, 4,901 (51 percent) had a recorded session in the inpatient EMU. As a general policy, the vast majority of the EMU admissions are for incident cases, but it was not possible for us to clearly identify incident versus prevalent cases in the larger sample of patients, many of whom had a first point of contact at Henry Ford for a specialty consult but had some previous epilepsy care elsewhere. There were 68 surgeries for epilepsy in this group.
Discussion
Our findings about patterns of care for patients with epilepsy in a single, large, vertically integrated health care system indicate both opportunities and challenges for working with existing data sources. On the one hand, the administrative data could be used relatively easily and quickly to identify patients with epilepsy or seizure disorders, identify sites and types of care provided, and estimate basic features of patient “flow” (e.g., sequence and timing of visits) through various sources of care. Available demographic data on age, gender, and race or ethnicity allowed analysis of potential disparities in patterns of care on the basis of those demographic factors.
On the other hand, however, the detailed medical record review and the unusually high annual incidence estimates from administrative data suggest caution in using the administrative data without additional checking (e.g., full medical record review on a sample of cases). Approximately 28 percent of the cases identified as “epilepsy” in the administrative data base (using a set of ICD-9 codes for both epilepsy proper and seizure disorders) did not actually have confirmed epilepsy based on information in the full medical record. Virtually all of the patients did have seizures, or at least one seizure, but there was a cause other than epilepsy for 28 percent of cases. The set of codes we used, then (see footnote 1), seems to work well for identifying patients with seizures and appears to be sensitive for identifying patients with epilepsy, but is not highly specific for identifying patients with epilepsy.
Among the patients with confirmed epilepsy, we were generally pleased with the proportion receiving anti-epileptic medications (essentially 100 percent) and the proportion who were receiving care in a collaborative or team fashion between a neurologist and a primary care physician. The fact that administrative data gave much lower estimates for anti-epileptic medication use than the medical record review is interesting—in addition to the possibility of drugs being paid for through a spouse’s insurance or other means, we also note that many patients take advantage of “$4 generic” programs at some retail pharmacy outlets and would not then have pharmacy claims recorded in our databases.
Although some neurologists in the neurology department of the HFMG specialize in epilepsy, this is not an official designation, and we were not able to formally distinguish between “epileptologists” and “other neurologists” in our analysis of practice patterns. Informally, however, it appeared that the majority of care in neurology was provided by three or four staff members most highly specialized in epilepsy care. For most patients, ongoing care was a collaborative or team effort between neurology, primary care, and perhaps other specialists in the group; the relatively high number of patients seen only in neurology suggests (1) a number of one-time consult visits; (2) some patients for whom a neurologist is the sole or primary care
provider; and (3) a specialty-only care role for Henry Ford, with other types of care provided elsewhere.
Understanding patterns of care, then, is possible in a system such as Henry Ford that has health plan, hospital, primary care, and specialty care components that do not completely overlap, but is perhaps more challenging than in more completely self-contained systems with well-defined denominator populations, such as Kaiser.
GEISINGER HEALTH SYSTEM’S DATA ON HEALTH CARE SERVICES FOR PATIENTS WITH EPILEPSY
Matthew A. R. Eccher, M.D., M.S.P.H.
Joshua N. Liberman, Ph.D.
Amanda C. Bengier, B.A.
Frank G. Gilliam, M.D., M.P.H.
Introduction
As we collect, collate, and summarize our own contribution to the IOM’s Committee on the Public Health Dimensions of the Epilepsies, the issue of exactly how to capture epilepsy—how to define and classify, how to find and count—is very much an active discussion (Berg et al., 2010; Thurman et al., 2011). The perennial American conversation regarding how to fund our health system is no less active. Obtaining systematic epidemiologic data, especially from large, complex health systems, must of necessity be an iterative, continually renewing process. We are grateful to the IOM and the committee for the opportunity to make a contribution to this important project, and we hope information of utility is learned from our work.
Methods
Data were retrieved from Geisinger Health System’s (GHS’s) electronic repository of health record information. Data are entered into this system, the Clinical Decision Intelligence System (CDIS), on an ongoing basis from the EMR system, EpicCare (Epic Systems Corporation, Verona, Wisconsin). Data are also entered from pathology laboratory computer systems, insurance claims and billing systems, and other computerized systems as well. Comprehensive data are compiled, including all inpatient and outpatient ICD-9-CM diagnostic codes utilized for documentation of and billing for care delivered, all CPT codes for procedures performed, all inpatient and outpatient medication prescriptions, and all laboratory values. Data collec-
tion began in 2001. CDIS is used in the GHS for purposes of policy decision making—in particular for designing “product line”-level initiatives to improve the quality of care system-wide for patients with specific health conditions—as well as for epidemiologic research such as our own. According to Geisinger’s internal website description of the system (http://infoweb.geisinger.edu/cdis, accessed January 2, 2012),
[t]he CDIS is a single, enterprise-wide data aggregation (“Enterprise Wide Data Warehouse” or “EDW”) architected to support and interoperate with an analytic system designed to identify and measure trends, interrelate different forms of information (e.g. patient clinical, eligibility and preference data) to inform care and support data-driven clinical and operational decision making throughout Geisinger Health System. The EDW will consist of all relevant Geisinger data, cleansed, normalized and stored in a common database at the most granular level to allow for an effectively unlimited number of reporting, analysis and application roles.
Our own previous study experience (Weinstein et al., 2011) has shown that catchment of all medical diagnoses, diagnostic studies, and treatments is far more consistent for patients with a primary care practitioner (PCP) within the GHS than for those receiving only subspecialty care from the GHS and that data are most accurate for the years 2004 and thereafter; therefore we restricted our analysis to patients fitting these parameters.
For estimation of prevalence of epilepsy, records were reviewed for the prevalent year July 1, 2010, to June 30, 2011. A diagnosis of epilepsy was defined as appearance within that year of two codes: either (1) two separate outpatient care visits including an epilepsy-related ICD-9-CM code (any diagnosis from the Epilepsy family of codes 345.xx, or 780.09 Alteration of Awareness Not Otherwise Specified [NOS], or 780.39 Convulsive Disorder NOS), or (2) any one encounter with such a diagnosis and one outpatient medication order for any agent in the anticonvulsant class of medications.
For estimation of the incidence of epilepsy, records were reviewed for the entire study period January 1, 2004, to June 30, 2011. A new diagnosis of epilepsy was considered established if the above definition of prevalent epilepsy was newly met in a record not previously containing such codes, with the additional requirement that the subjects’ record contain documentation of GHS PCP care establishment at least 2 years prior to the new appearance of the epilepsy-related codes.
Our database and approach have, as all do, inherent strengths and limitations; for the broader applicability of our results, there are also strengths and limitations of the context of our work in a unified, integrated health system located in a rural environment.
Strengths:
• a large population under management;
• a comprehensive EMR, through which all care is delivered;
• > 10 years’ epidemiologic research experience with the database, with ongoing reengineering to improve the quality of the database over this time;
• fairly low turnover of population in the region of coverage; and
• rural derivation of data, in contradistinction to many previously published epidemiologic data.
Limitations:
• coding is only as accurate as clinicians’ use thereof in delivery of care and coders’ and billers’ entries for financial purposes;
• ICD-9-CM codes are of imperfect validity for epilepsy;
• analysis is limited to codes entered in the EMR—free text of clinical care notes not accessible within CDIS;
• low numbers of nonwhite subjects in the population; and
• CDIS’s importation of cost and charge data has not yet been optimized; we were unable to abstract reliable information regarding costs and charges.
Incidence and Prevalence
Prevalence
Of 421,174 patient records with an associated GHS PCP in the study year (7/1/2010-6/30/2011), 4,293 met prevalent case definitions, resulting in a one-year period prevalence of 10.2 cases per 1,000 patients. This is nearly within the range of estimates reported previously (3.70-9.99 per 1,000) (Annegers, 2004). Roughly 74 percent of cases met both definitions we prespecified, and 20 percent met only the first definition of two separate entries of an epilepsy-class ICD-9 code, leaving 6 percent captured by the second definition of one diagnosis code and an anticonvulsant order. Within the 20 percent of prevalent cases that were captured by the two definitions, only a small minority (exact number unavailable) were captured on the basis of the least-specific ICD-9 code 780.09 (Alteration of Consciousness, Other).
Incidence
Records for 439,204 patients had at least 2 consecutive years of GHS PCP assignment over the study period (1/1/2004-6/30/2011). Thus, requiring 2 years’ preceding data, incidence is assayed beginning January 1, 2006,
and ending June 30, 2011. With a cumulative 2,335,208 patient-years of data, 485 cases met prevalent case definition after 2 years with GHS PCP and no epilepsy-related codes entered, resulting in an incidence rate of 20.8 per 100,000 patient-years. This appears to be a moderate underestimate on multiple grounds:
1. The case duration provided by dividing our prevalence estimate of 0.0102 cases by incidence of 0.000208 cases per year = 49 years. As early-childhood-onset epilepsy is likely to be associated with a shortened life expectancy (Sillanpää and Shinnar, 2010), and later-adulthood-onset epilepsy (Hauser et al., 1993) occurs with fewer years of life remaining, case duration of epilepsy averaged across an entire population of patients with epilepsy seems likely to be considerably lower than 49 years.
2. Previously published meta-analyses estimate incidences of 43 to 82 per 100,000 (Kotsopoulos et al., 2002; Ngugi et al., 2011).
It is likely that our restrictive definition, designed in the interests of specificity (avoiding accepting prevalent cases as newly incident), achieved our aim at the expense of sensitivity.
Incidence and Prevalence Rates by Demographic Groups
Prevalence and incidence rates were roughly balanced by gender (prevalence 48.3 percent male, 51.7 percent female; incidence 46.8 percent male, 53.2 percent female). By age groups (19 years and under, 19-64, over 64), prevalence rates were 21.2 percent, 58.5 percent, and 20.1 percent, respectively, and incidence rates 34.6 percent, 47.6 percent, and 17.7 percent, respectively. Ethnic background was dichotomized simply by “white” versus all other because of the low number of minorities in rural Pennsylvania; prevalence was 95.8 percent white, 4.2 percent nonwhite, and incidence 95.4 percent white, 4.5 percent nonwhite. Numbers were subdivided into a 2 x 3 x 2 table, that is, by gender, age group, and ethnicity, respectively; all 12 resulting 95 percent confidence intervals (95 percent CIs) on the point estimate within each cell were completely mutually overlapping.
Medical Comorbidities
Rates of comorbidity with medical diagnoses of interest provided by the IOM were also sought, for both prevalent and incident cases; comparison rates were derived from records for all other patients under GHS PCP care during the same period. All diagnoses were assayed on the basis of ICD-9 code entry by any practitioner at any point during the study pe-
riod; for incident cases, no distinction was made for this data abstraction between diagnoses coded prior to versus after the coding of case-defining epilepsy ICD-9 diagnoses. ICD-9 codes of interest were obtained from IOM study staff. One mental health diagnosis code (any code from the Axis I disorders of American Psychiatric Association’s Diagnostic and Statistical Manual, Fourth Edition; i.e., 290-319 inclusive) was coded in 86.2 percent of prevalent epilepsy cases and 69.3 percent of incident cases, compared to 32.5 percent of the primary care population; more than one such diagnosis was coded in 47.3 percent of prevalent, 58.7 percent of incident, and 24.0 percent of comparators. Cerebral palsy (343.x) was coded in 2.7 percent of prevalent, 5.5 percent of incident, and 0.1 percent of comparators. Cerebrovascular disease (434.xx or 435.x) was coded in 4.7 percent of prevalent, 3.2 percent of incident, and 0.7 percent of comparators. Dementia (290.xx or 294.1x) was coded in 1.9 percent of prevalent, 2.0 percent of incident, and 0.4 percent of comparators. Parkinson’s disease (332.x) was coded in 1.2 percent of prevalent, 1.1 percent of incident, and 0.3 percent of comparators. Multiple sclerosis (340) was coded in 0.8 percent of prevalent, 0.8 percent of incident, and 0.2 percent of comparators. TBI (310, or 850-854 inclusive) was coded in 1.9 percent of prevalent, 3.1 percent of incident, and 0.4 percent of comparators. Autism spectrum disorders (299.x) were coded in 1.2 percent of prevalent, 1.7 percent of incident, and 0.1 percent of comparators. Ischemic heart disease (410-414 inclusive) was coded in 5.1 percent of prevalent, 8.0 percent of incident, and 4.1 percent of comparators; hypertensive heart disease (401-405 inclusive) was coded in 24.3 percent of prevalent, 27.8 percent of incident, and 18.4 percent of comparators. Asthma (493.xx) was coded in 13.0 percent of prevalent, 13.0 percent of incident, and 6.9 percent of comparators. Obesity (278.xx) was coded in 8.2 percent of prevalent, 9.1 percent of incident, and 4.9 percent of comparators; morbid obesity (278.01), in 2.7 percent of prevalent, 3.1 percent of incident, and 1.6 percent of comparators. Cancer (140.xx-210.xx) was coded in 6.2 percent of prevalent, 9.8 percent of incident, and 4.7 percent of comparators. Obstructive sleep apnea (327.23) was coded in 0.4 percent of prevalent, 1.8 percent of incident, and 0.7 percent of comparators. Rheumatoid arthritis (714.0) was coded in 0.8 percent of prevalent, 0.9 percent of incident, and 0.6 percent of comparators.
Health Care Services
The database was queried for medication orders in the psychoactive and anticonvulsant classes, for types (ED, outpatient, inpatient) and numbers of patient care encounters—including whether with a neurological practitioner—and for numbers of cases in which specific epilepsy evaluation
and management procedures (EEG, MRI, EMU evaluation, and neurosurgical treatments) were used.
Of the 419 incident cases with at least one psychiatric comorbidity, 165 (39 percent) were receiving an agent from the psychiatric class of pharmacologic agents, exclusive of their seizure medications; of the 2,973 prevalent cases, 1,698 (57 percent) were on such treatment. This compares with 69,279 of 135,466 (51 percent) treatment rate among the primary care comparators.
Of incident cases of epilepsy, 469 (97 percent) had a visit with a PCP; however, only 161 (33 percent) had a documented outpatient visit with a neurology physician or advanced practitioner. Among prevalent cases, 4,206 (98 percent) had at least one PCP visit, and 2,665 (62 percent) had a neurology outpatient visit. These numbers merit a brief comment—the database does not permit effective audit of whether a practitioner in a specific specialty has seen a patient during an ED evaluation or inpatient admission; we suspect that some of these patients did in fact see neurology in such a manner but were not seen in clinic subsequently during the audit period. That noted, the rates of outpatient neurology visitation, which we would prefer close to 100 percent, did not completely surprise us: we have had a subspecialty-oriented comprehensive epilepsy program for just over 2 years as of this writing and have noticed a pattern of practice whereby many patients with epilepsy in the system are in fact receiving their care from a PCP only. We suspect we are impacting on this pattern of practice only incrementally.
Utilization of hospital resources (ED, inpatient, and outpatient visits) was reasonably stable and consistent across time: 15.8 percent of prevalent patients utilized the ED over the study year (with 2.1 services utilized), compared with 5.2 percent of non-epileptic primary care patients (1.5 services); 15.3 percent utilized inpatient services (3.0 services), compared with 3.7 percent of primary care comparators (2.6 services); fully 78.5 percent of prevalent patients had outpatient visits anywhere in the system (7.8 services), compared with only 56.6 percent of primary care comparators (4.6 services). For incident cases, the extended time period over which these cases were studied allows us to assess changes in rates of use after establishment of diagnosis. In the first 12 months after meeting case definition, 14.4 percent had ED visits (1.7 services), 19.3 percent had inpatient admissions (2.4 services), and 100 percent received outpatient care of some type (7.8 services); over the subsequent (second, third, and fourth) years after diagnosis, rates fell from the first year but were thereafter stable from year to year, with ED visits at 10.1-11.1 percent across those 3 years (1.5-1.9 services), admissions 7.8-11.9 percent (1.6-2.5 services), and outpatient visits 85.3-88.3 percent (4.4-6.1 services). Clearly, the outpatient service utilization of 100 percent the first year is an artifact of the case definition, but this does
not mute the interest that utilization in years following the first appears to fall stably to rates similar to those among prevalent cases in general and to remain substantially elevated above primary care comparators.
With regards to medication use, among incident cases, 269 (55 percent) had orders for only one seizure medication, and another 59 (12 percent) had orders for more than one (reflecting either polytherapy or a switch from one agent to another), leaving 158 (32 percent) for whom no order for seizure medication was documented; 120 (25 percent) had orders for at least one seizure medication and at least one antidepressant. Among prevalent cases, the rates for monotherapy were 2,493 (58 percent) and polytherapy 938 (22 percent), leaving 862 (20 percent) for whom we do not have documented seizure medication orders; we believe that there are large inherent incompletions in the data on medication ordering.
Our documented rates of specific EEG and MRI utilization were surprising to us: 390 (41 percent) of incident and 3,794 (37 percent) of prevalent cases had an EEG documented, 184 (19 percent) of incident and 2,815 (27 percent) of prevalent cases had an MRI, and 115 (12 percent) of incident versus 1,720 (17 percent) of prevalent cases had a video-EEG monitoring unit evaluation. We believe these apparently low rates of EEG and MRI use to be a function of three primary limitations in our database: (1) because our system focuses on cost-effective care, we frequently utilize outside MRIs and EEGs for provision of care, reviewing them ourselves if we deem them at all questionable and repeating them only if necessary; (2) many of our own patients had diagnostic EEGs and MRIs within the system performed well before the period of the study, and we presume this applies to the prevalent population as a whole; and (3) procedure rates especially appear suboptimally accurate (see discussion of neurosurgery below).
Neurosurgical interventions were predictably uncommon in the incident group, with a total of 3 (1 vagus nerve stimulation [VNS] implantation, and 2 craniotomies)—we are presuming that these few patients caught as “incident” were most likely in fact longstanding prevalent cases. Among prevalent cases, data indicate 40 VNS procedures (0.4 percent of the group) and 33 craniotomies (0.3 percent). We are quite certain these electronically captured rates are low—we know that our program recently passed its hundredth craniotomy for epilepsy since the two epileptologists among the authors (M.E., F.G.) joined, yet only 33 of them were captured by the electronic query.
Conclusion
Our data clearly contain a degree of inaccurate classification of cases utilizing our case definitions. This is unsurprising, given our “quick-and-dirty” criteria, derived rapidly to provide data to the IOM as expeditiously
as possible, and the structure of the database itself, as discussed. The advantage of CDIS’s structure is that data can be abstracted by research institute personnel rapidly, without any patient identifying information at all, and therefore full institutional review board (IRB) review and approval can be waived; this is the approach under which our data were abstracted. Rates of procedure utilization are especially suspect, as above. Rates of comorbidity diagnosis are likely also prone to undersensitivity for some and oversensitivity for other diagnoses. This cannot be a surprise, however, and the fact that the prevalence estimate of 10.2 per 1,000 is essentially right at the top end of the previously published range augurs fairly well for accuracy of diagnoses at least. The power of the chart-derived CDIS system is that analyses can be run fairly quickly, which should mean that they can periodically be re-run to assess changes in numbers previously obtained—changes in population and the impact of system-wide treatment initiatives could be thus evaluated. We hope that in the future, this will allow us within our own system to polish an institution-wide care approach with minimized tolerance for continued seizures.
VETERANS HEALTH ADMINISTRATION
Mary Jo Pugh, Ph.D.
Megan Amuan, M.P.H.3
Overall Description
The Department of Veterans Affairs’ (VA’s) Veterans Health Administration (VHA) operates the largest integrated health care system in the United States. The availability of these data derives from the long history of computerized clinical information systems in the VHA. Episodes of care provided by VA hospitals, outpatient clinics, nursing homes, and so forth, or paid for using VA funds are input to the EHR by facility staff using the Computerized Patient Record System. These data are then transmitted to a central repository in Austin, Texas, where clinical data elements are maintained in SAS data sets (SAS Institute, Cary, North Carolina). The data sets that are most commonly used include the VHA annual medical SAS data sets for VA inpatient and outpatient care, VA pharmacy data, VHA extended care, VA inpatient short stay (< 24 hours) observation care, health care provided for veterans outside the VA with VA funding (fee-basis),
_______________
3We acknowledge funding of this work from VA Health Services Research and Development Service, IIR 06-062 and DHI 09-237 (Dr. Pugh, principal investigator) and the VA Epilepsy Centers of Excellence. The views expressed here are those of the authors and do not necessarily represent the views of the Department of Veterans Affairs.
and clinical data extracts from the Decision Support System files. These databases are used for administrative purposes and are commonly used to conduct epidemiologic, in addition to health policy and health services, research. While decades of inpatient data are available, outpatient and pharmacy data are available from fiscal year (FY) 1999 onward, allowing us to follow individuals over time as long as they receive care within the VHA. Our surveillance of epilepsy within the VA contains inpatient, outpatient, and pharmacy data that are linked using an encrypted patient identifier. These databases include diagnosis codes, dates of care, clinic or hospital ward in which care was received, facility in which care was received, specific medications received, the dose of each medication, and the number of days that medication was received. While an active surveillance program through the VA Epilepsy Centers of Excellence (ECOEs) is in development, for the purposes of this report we provide estimates of epilepsy in two distinct cohorts of VA patients for whom we had research data: elderly veterans (> 65 years of age) in FY 2006 (October 1, 2005-September 30, 2006) and veterans from Afghanistan and Iraq (Operation Enduring Freedom-Operation Iraqi Freedom [OEF-OIF]) in FY 2009 who received VA care in the index year (FY 2006 or FY 2009) and the year prior.
Incidence and Prevalence
Methods
Using inpatient and outpatient data files, we identified prevalent cases of epilepsy as those with a diagnosis indicative of epilepsy (ICD-9-CM codes 345 or 780.39) in the index year, who also had at least 30 days of seizure medications prescribed during that year. Using a look-back period (the previous year), we identified individuals who had neither a diagnosis nor a seizure medication prescribed the previous year as having incident epilepsy. We then conducted cross-tabulations of epilepsy status by race or ethnicity and gender and calculated the prevalence per 1,000 and incidence per 100,000 among different race or ethic groups and for men and women based on the overall population for each category in each cohort.
It is important to note that the algorithms used in this assessment were validated and found to have a positive predictive value between .94 and .98 in the elderly VA population; the positive predictive value for the OEF-OIF population has not been determined.
Strengths and Limitations
The major strength of this approach is ease of use in a large integrated medical system. However, several limitations exist. First, our reported inci-
dence may be inflated because we had only a year of prior data to determine previous diagnosis and treatment. We are unsure of the extent to which incident cases may be overestimated based on a 1-year compared to a 2- or more year clean period; however, overestimation is certain. Second, it is possible that individuals who receive medications and health care outside the VA are misclassified if their diagnosis of seizure or prescription for a seizure medication occurs in a non-VA setting. However, many individuals with epilepsy receive free VA health care and medications; therefore we believe this bias is not significant. Third, there is also a risk of identifying individuals as having epilepsy when they had a provoked seizure and received a seizure medication for another indication, such as bipolar disorder, depression, or chronic pain. We validated this algorithm for use in the geriatric veteran population using chart abstraction and found a positive predictive value of .94-.98 (Pugh et al., 2008), but no such validation has yet been conducted for the OEF-OIF veteran population. Thus, these estimates are preliminary assessments of incidence and prevalence.
A final limitation with regard to examining prevalence and incidence by race or ethnicity is that although the data are quite accurate when available, race data were missing for approximately 22 percent of older veterans and 19 percent of OEF-OIF veterans.
The first estimates are based on the geriatric VA patient population in FY 2006 who received care in FY 2005 and FY 2006 (N = 2,023,477). Overall, if all groups that meet epilepsy criteria are included, 1.8 percent of older veterans meet criteria for epilepsy (N = 37,023), which equates to 18.3 per 1,000. This is similar to our estimate using data from FY 1999 (Berlowitz and Pugh, 2007). If we exclude those with ambiguous onset (N = 23,102), the prevalence is 11 cases per 1,000. Our prior study incorporating Medicare data suggests that inclusion of individuals with ambiguous epilepsy onset is more accurate since many individuals (about 60 percent with new diagnosis) are initially diagnosed in the Medicare setting (Hope et al., 2009).
For incident epilepsy, we included only the group for which we could definitively identify onset of diagnosis and treatment in the VA. The finding for incident epilepsy (N = 1,412) was 70 per 100,000 person-years.
The second estimates are preliminary and unvalidated reports from FY 2009 based on the OEF-OIF VA patient population who received VA care in FY 2008-2009 (N = 191,797). It is important to note that inclusion in this cohort was based on deployment to a war zone. As such the age range was 20-73 years in FY 2011 (median = 31; interquartile range = 16), and this population has a high prevalence of blast injury and TBI, which place them at elevated risk of epilepsy. Including all groups that meet epilepsy criteria (N = 1,545) the prevalence is 8.1 per 1,000 individuals. Incidence of epilepsy (N = 255) was 133 per 100,000 person-years. Because our algorithm
has not been validated in the younger veteran population, we also examined incidence and prevalence of epilepsy excluding gabapentin from the list of seizure medications, since it is also commonly used for pain. Using that less inclusive algorithm, we found 503 individuals with epilepsy; prevalence is 3 per 1,000 and incidence (N = 90) 47 per 100,000 person-years.
Incidence and Prevalence by Race or Ethnicity and Gender Within Cohorts of Geriatric and OEF-OIF Veterans
The prevalence and incidence of epilepsy by gender and race or ethnicity are provided for the following groups: black or African American, Hispanic, other (Asian, American Indian or Alaskan Native, Native Hawaiian or other Pacific Islander), white, and unknown. Of interest with regard to race or ethnicity, in the geriatric cohort, we saw significantly higher prevalence and incidence in veterans from black or African American and Hispanic heritage, while we see significantly higher incidence and prevalence of epilepsy in whites among the OEF-OIF cohort.
Among the geriatric cohort, we saw prevalences (per 1,000) and incidences (per 100,000) of 33.1 and 155 (black or African American), 23 and 105 (Hispanic), 17 and 78 (other), 19 and 71 (white), and 12 and 42 (unknown). For the OEF-OIF cohort, we saw prevalences (per 1,000) and incidences (per 100,000) of 7 and 71 (black or African American), 7 and 121 (Hispanic), 8 and 64 (other), 10 and 159 (white), and 5 and 127 (unknown).
With regard to gender, there were no statistically significant differences between males and females in the geriatric cohort (prevalence 19 per 1,000 males or females, incidence 81 per 100,000 males and 71 per 100,000 females). The prevalence and incidence of epilepsy were significantly higher in males in the OEF-OIF cohort. The prevalence of epilepsy for males was 8 per 1,000 and for females 6 per 1,000. The incidence of epilepsy was 140 per 100,000 for males and 86 per 100,000 for females.
We also calculated the incidence and prevalence for OEF-OIF veterans excluding gabapentin as a seizure medication and found the exact same patterns but with different magnitude. Prevalence was 2 per 1,000 for blacks or African Americans and Hispanics, 3 per 1,000 for those of white and unknown race, men, and women. Incidence was 23 (black or African American), 42 (Hispanic), 32 (other), 61 (white), and 34 (unknown) per 100,000 person-years.
Further research will be required to determine the most appropriate algorithm for this new population of veterans. For the purposes of this report, comorbidities, treatment, and health care utilization are based on the definition of epilepsy using all seizure medications since the pattern of findings is essentially the same using both definitions.
Comorbidities
Methods
Comorbidities were identified using inpatient and outpatient administrative data. We used validated ICD-9-CM code algorithms from the Selim and Elixhauser comorbidity indices to identify mental and physical health conditions. ICD-9-CM codes from the Australasian Rehabilitation Outcomes Centre and the Department of Defense were used to identify TBI-related diagnoses.
Strengths and Limitations
The strength of this approach in linking epilepsy with comorbidities is that the integration of inpatient, outpatient, and pharmacy data in this system allows ready identification of chronic comorbid conditions in large numbers of individuals relatively quickly. However, we can only identify conditions that are diagnosed during the process of VA care. It is less likely that active mental health conditions and TBI-related diagnoses are underdiagnosed in the OEF-OIF VA patient population since mental health conditions and TBIs are the subject of service-connected disabilities. The high levels of posttraumatic stress disorder (PTSD) in particular, while logical given the combat exposure of the population, suggest we should more closely explore the possibility of seizure-like events with a psychological basis in this population. The greater weakness for the geriatric population is that TBI-related diagnoses are only acute and do not provide a history of TBI, which may be substantial in those with prior combat (e.g., World War II, Korea).
Among the individuals in these cohorts, there was a high prevalence of physical comorbidities, especially in the geriatric population. As expected, cerebrovascular disease and dementia were high in geriatric cohorts (cerebrovascular disease: 33 percent prevalent, 46 percent incident; ischemic stroke: 8 percent prevalent, 15 percent incident; transient cerebral ischemia: 5 percent prevalent, 10 percent incident; dementia: 18 percent prevalent, 25 percent incident), but relatively low in OEF-OIF cohorts (cerebrovascular disease: 4 percent prevalent, 2 percent incident; ischemic stroke, transient cerebral ischemia, dementia: less than 1 percent for both prevalent and incident). Approximately 7 percent of older veterans with prevalent epilepsy and 9 percent with incident epilepsy had other major neurological conditions such as multiple sclerosis or Parkinson’s disease. OEF-OIF veterans had lower rates (2 percent prevalent and incident) than the elderly. Cardiac-related diseases were also common. Cardiovascular disease (e.g., myocardial infarction, congestive heart failure, angina) was diagnosed in 24 percent of those older veterans with prevalent epilepsy and 25 percent
of those with incident epilepsy; 73 percent of prevalent and 81 percent of incident cases also had hypertension. Cardiovascular disease was far less likely (0.8 percent prevalent and 0.4 percent incident) for OEF-OIF veterans with epilepsy; hypertension affected 16 percent of those with prevalent and 15 percent of those with incident epilepsy. Similarly, chronic obstructive lung disease affected older veterans with epilepsy (prevalent 24 percent and incident 25 percent) more frequently than OEF-OIF veterans with epilepsy (prevalent 6 percent and incident 7 percent).
The opposite patterns were observed for the OEF-OIF veterans when examining mental health comorbidities. OEF-OIF veterans had high rates of having a diagnosed comorbid mental health condition (81 percent prevalent, 87 percent incident) compared to the geriatric population (44 percent prevalent, 51 percent incident). Further exploration suggests this was due to very high rates of PTSD (60 percent prevalent, 68 percent incident), depression (33 percent prevalent, 35 percent incident), anxiety (19 percent prevalent, 24 percent incident), substance abuse or dependence (17 percent prevalent, 22 percent incident), bipolar disorder (9 percent prevalent and incident), and other mental health conditions including psychosis (51 percent prevalent, 47 percent incident). These high rates were similar regardless of the cohort definition algorithm and are consistent with the fact that this cohort is based on deployment to a war zone. The prevalence of psychiatric conditions was lower in the geriatric cohort, but the psychiatric disease burden was still significant. The most common single condition was depression (18 percent prevalent, 19 percent incident) followed by anxiety (8 percent prevalent, 9 percent incident), substance abuse or dependence (5 percent prevalent, 6 percent incident), PTSD (4 percent prevalent and incident), bipolar (3 percent prevalent, 2 percent incident), and other mental health including psychosis (29 percent prevalent, 38 percent incident). Finally, head injuries were more commonly found in OEF-OIF veterans due to an ongoing TBI screening program associated with postdeployment. Moderate to severe TBI was found in 4 percent of prevalent and 5 percent of incident cases; concussion diagnoses were found in 28 percent of prevalent and 32 percent of incident cases. Among the geriatric cohort, moderate to severe TBI was less than 0.5 percent in both prevalent and incident cases, and concussions were diagnosed in 2 percent of prevalent and 3 percent of incident cases.
Health Care Services
Methods
We identified the seizure medications, antidepressants, and antipsychotic medications received by each individual using VA pharmacy data
based on the VA product name. We identified the type of outpatient care (neurology [315, 335, 345], primary care [301, 322, 323, 348], emergency care [130, 131], EEG [106], prolonged video-EEG monitoring [128]) using VA clinic codes indicated, and inpatient care was identified based on data present in the inpatient data file. Neurology hospitalizations were identified using bedsection (10) found in the inpatient treatment file. We then counted the number of days for all hospitalizations completed during the index year. Because much of the prolonged video-EEG monitoring occurs at academic affiliates, these estimates are considered extremely conservative. These methods have been previously validated for use in documenting sources of inpatient and outpatient care broadly in VA settings though not specifically for epilepsy.
Strengths and Limitations
Our method allows us to accurately describe care received in the VA since previous studies have found that care provided is routinely documented. However, several limitations exist. First, the only data available were those approved for use in our ongoing research: inpatient, outpatient, and pharmacy data. We did not have access to cost data or data for outside care that was paid for by the VA (fee-basis files). Thus, we were not able to provide information on neurosurgical interventions and the costs of care or to ensure that our assessments of other utilization—especially prolonged video-EEG monitoring—were complete. Second, it is possible that individuals received care outside the VA as described above. We are unsure of the extent to which this non-VA care may affect our estimates. Finally, individuals who received hospital care for epilepsy would be evaluated by a neurologist as an inpatient; therefore our assessment of neurology care may be underestimated.
Treatment of Comorbid Conditions
In the geriatric cohort, we found that among those with any mental health diagnosis 57 percent of prevalent cases and 58 percent of incident cases received a prescription of a psychotropic medication. Antidepressants were prescribed to 51 percent of both prevalent and incident cases in FY 2006; 17 percent of prevalent and 19 percent of incident cases received an antipsychotic. When restricting the analysis to those diagnosed with depression, 78 percent of prevalent and 82 percent of incident cases received an antidepressant in FY 2006. When examining only those with a psychosis, 55 percent of prevalent and 70 percent of incident cases received an antipsychotic.
We found that OEF-OIF veterans with any mental health diagnosis
were commonly treated with a psychotropic medication (79 percent prevalent, 84 percent incident). Antidepressants were commonly used in both prevalent (75 percent) and incident cases (82 percent), as were antipsychotics (33 percent prevalent, 35 percent incident) in FY 2009. When examining only those with depression we found that 87 percent of prevalent cases and 91 percent of incident cases received an antidepressant in FY 2009. Restricting analyses to those with any psychosis, we found that 56 percent of prevalent cases and 57 percent of incident cases received an antipsychotic.
Treatment in Specialty Care
Our examination of the type of care received by veterans in the geriatric epilepsy cohort indicated that for prevalent cases, 23 percent had at least one visit with a neurologist in FY 2005 and 21 percent received neurology care in FY 2006. For those with incident epilepsy, 44 percent received care at least once in a VA neurology outpatient clinic. Frequent primary care visits (five or more in a year) were similar for prevalent (29 percent) and incident (30 percent) cases.
For the OEF-OIF cohort, 56 percent of those with prevalent epilepsy received outpatient neurology care in FY 2008 and 60 percent received outpatient neurology care in FY 2009. For those with incident epilepsy, 71 percent received care at least once in a neurology outpatient clinic. Frequent primary care visits were more common in incident (34 percent) than in prevalent (21 percent) patients.
Treatment in Primary Care
In the geriatric cohort, of those with prevalent epilepsy, 74 percent received primary care only, 20 percent received primary and neurology care, 1 percent received only neurology care, and 4 percent received neither primary nor neurology care. For incident cases, we found that 54 percent received only primary care, 43 percent received neurology and primary care, 1 percent received only neurology care, and 2 percent received neither primary nor neurology care. These rates are significantly different for older veterans without epilepsy (92 percent primary care only, 3.5 percent primary and neurology care, and < 1 percent with just neurology care; p < .001). The mean number of primary care visits in FY 2006 was 4.0 (standard deviation [SD] = 4.7) for prevalent cases, 5.1 (SD = 5.1) for incident cases, and 3.1 (SD = 3.3) for those without epilepsy. Differences among all groups were statistically significant (p < .001).
In the OEF-OIF cohort, among those with prevalent epilepsy 34 percent received only primary care, 54 percent received neurology and primary care, 6 percent received only neurology care, and 6 percent received neither
primary nor neurology care. Among incident cases, 29 percent received only primary care, 65 percent received primary and neurology care, and 5 percent received only neurology care (< 1 percent received neither primary nor neurology care). This was significantly different from OEF-OIF veterans without epilepsy (72 percent only primary care, 6 percent neurology and primary care, < 1 percent only neurology care, 22 percent neither neurology nor primary care (p < .001). The mean number of primary care visits in FY 2009 was 3.5 (SD = 4.3) for prevalent cases, 3.9 (SD = 2.9) for incident cases, and 1.9 (SD = 2.1) for those without epilepsy. Differences among all groups were statistically significant (p < .001).
Medications
For those with prevalent epilepsy, 84 percent of geriatric and 89 percent OEF-OIF cohort patients received at least one seizure medication, with most receiving monotherapy (geriatric: 77 percent; OEF-OIF: 63 percent). Among incident cases, 80 percent of geriatric patients and 84 percent of OEF-OIF patients received seizure medication monotherapy during their first year of treatment.
For those with prevalent epilepsy, 30 percent of geriatric and 57 percent of OEF-OIF patients received concomitant seizure medication and antide-pressant treatment. For incident cases, 34 percent of geriatric patients and 73 percent of incident patients received concomitant seizure medication and antidepressant treatment.
Hospital and Emergency Care
Prevalent cases in the geriatric cohort had relatively stable utilization of care, with approximately 15 percent of the cohort having at least one hospitalization (mean hospital days 6.4, SD = 118 in FY 2005; mean 6.3, SD = 41 in FY 2006) and 27 percent having at least one emergency visit in FY 2005 and FY 2006 (16 percent > 1 visit FY 2006). Incident cases demonstrated significant utilization that was likely associated with epilepsy. In FY 2005 17 percent had at least one hospitalization (mean hospital days 7, SD = 34) in the year of epilepsy diagnosis, and 30 percent had at least one hospital stay (mean hospital days 18.0, SD = 75). Similarly, the year before meeting epilepsy criteria, 32 percent received emergency care, while the year of meeting epilepsy criteria, 48 percent had at least one emergency visit (19 percent > 1 visit FY 2006).
Similar findings were obtained from the OEF-OIF cohort where 21 percent of patients with prevalent epilepsy were hospitalized at least once in FY 2008 and FY 2009 (mean hospital days 6.0, SD = 26, FY 2008; mean 6.0, SD = 27, FY 2009). Emergency care was also common for patients
with prevalent epilepsy, with 39 percent receiving emergency care in both FY 2008 and FY 2009 (22 percent > 1 visit FY 2009). For incident epilepsy patients, only 9 percent had at least one hospitalization in FY 2008 (mean hospital days 3.3, SD = 23), with an increase to 30 percent (mean hospital days 6.8, SD = 23) in the year of meeting epilepsy criteria. Similarly, in FY 2008 29 percent of incident patients had at least one emergency visit, and 49 percent had at least one emergency visit in FY 2009 (29 percent > 1 ER visit FY 2009).
Neurosurgical Interventions
We were unable to assess this due to unavailability of data given the time constraints of this evaluation, since most neurosurgical interventions are conducted at academic affiliates and data are not readily available.
EEG, MRI, Video-EEG Monitoring
Assessments for EEG and video-EEG related to epilepsy were available for this assessment. MRI data were not specific to epilepsy. In the geriatric cohort, VA EEG testing was completed for 3 percent of prevalent cases and 16 percent of incident cases. Prolonged video-EEG was conducted for less than 0.5 percent of older veterans regardless of epilepsy status. For the OEF-OIF cohort, 22 percent of prevalent cases and 55 percent of incident cases received EEG testing. Less than 0.5 percent of prevalent cases and 2 percent of incident cases received prolonged video-EEG testing within the VA. However, these numbers are likely to be an underestimate since so much prolonged video-EEG testing is conducted through academic affiliates.
Ideas for Improving Epilepsy Surveillance Within the VA
The funding of VA ECOEs provides an opportunity to proactively conduct surveillance of epilepsy within the VA using available data and technology. We are currently validating the epilepsy detection algorithm for use in the OEF-OIF patient population. In addition, the ECOEs have invested in a biostatistician who will assist in providing surveillance in real time using the clinical enterprise data. That real-time identification, combined with chart abstraction when specific issues arise, will help us refine algorithms to provide the best approach to epilepsy surveillance. A second recommended improvement is to begin a national epilepsy registry for the VA. There are ongoing efforts to begin a registry of individuals who receive care from an ECOE clinician. However, to date, our data suggest that this would include only a portion of VA patients with epilepsy since only a small portion of the
patient population is seen in an ECOE clinic or hospital. Thus, such a registry would have to be based more broadly on all VA patients who receive epilepsy care rather than only the most severe patients who receive care in ECOE clinics. A national registry of all VA patients with epilepsy will allow ECOEs and other neurology providers to better monitor the quality of care for the VA epilepsy patient population.
SOUTH CAROLINA
Anbesaw W. Selassie, Dr.P.H.4,5
Overview
The South Carolina Epilepsy Surveillance System (SCESS) was established in response to funding announcement from the National Center for Chronic Disease Prevention and Health Promotion (NCCDPHP), Centers for Disease Control and Prevention (CDC), which sought a comprehensive system to monitor incidence, prevalence, and unmet needs of persons with epilepsy. Funding was granted to the Department of Biostatistics and Epidemiology at the Medical University of South Carolina. The SCESS was established in August 2002 in partnership with public and private organizations that have a stake in epilepsy surveillance. The partners include the SC Department of Health and Environmental Control, the SC Budget and Control Board Office of Research and Statistics (ORS), and the Epilepsy Association of South Carolina. Other stakeholders that supported the surveillance effort are the Medical Association of South Carolina, the SC Hospital Association, and the SC Chapter of the American Neurological Association. The broad collaboration and interprofessional support still remain critical to the flow of data and access to medical records.
The SCESS relies on multifaceted data sources to collect, analyze, and monitor the occurrence of epilepsy in the statewide population (Figure B-1). The primary goal of the surveillance activities is to determine the service needs of people with epilepsy, identify risk characteristics that impact in their quality of life, and monitor incidence and prevalence. As a chronic health condition that requires periodic access to clinical care, the main task in the development of the SCESS was to identify the venues of care for people with epilepsy. These include inpatient, emergency,
_______________
4Associate professor, Department of Biostatistics and Epidemiology, Medical University of South Carolina.
5This report is prepared with the support and collaboration of Mr. Chris Finney, M.S., Office of Research and Statistics, South Carolina Budget and Control Board. Special thanks go to Ms. Sandra Kelly for facilitating permission to the various data sources and securing approval from the South Carolina Data Oversight Council.
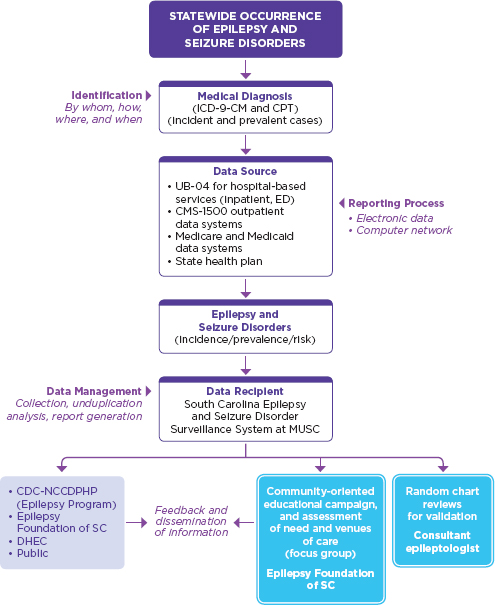
FIGURE B-1
Systems involved in epilepsy and seizure disorder surveillance in South Carolina.
NOTE: CDC-NCCDPHP = Centers for Disease Control and Prevention’s National Center for Chronic Disease Prevention and Health Promotion; CMS = Centers for Medicare and Medicaid Services; CPT = Current Procedural Terminology; DHEC = Department of Health and Environmental Control; ED = emergency department; ICD-9-CM = International Classification of Diseases, Ninth Revision, Clinical Modification: MUSC = Medical University of South Carolina; SC = South Carolina.
and hospital-based outpatient departments (OPDs) including outpatient surgery, physician office visits, nursing homes, and specialized clinics and institutions. In this regard, the unique strength of the State of South Carolina is the availability of a central data repository for all of these services. The ORS is the designated repository for all health and human services in the state and is legally charged to receive uniform billing (UB) and noninstitutional claims (Centers for Medicare and Medicaid Services [CMS]-1500) extracted data from all nonfederal health care establishments. The full list of the data systems housed in the ORS along with the integrated data system that enables the tracking of individuals is described elsewhere (South Carolina Budget and Control Board Office of Research and Demographics, 2012). The main sources of data that provide and validate clinical, demographic, socioeconomic, and short-term outcome information are as follows.
UB-04 (Hospital Discharge, Emergency Department, and Hospital-Based Outpatient Data Systems)
The UB-04 is an electronic claim form for institutional health care services. The ORS receives copies of patient billing extracted quarterly from all nonfederal hospitals, EDs, and hospital-based OPDs and outpatient clinics. In South Carolina, this reporting system is population-based for all patient encounters in a hospital setting for the civilian population. The database includes up to 15 ICD-9-CM codes, primary and secondary external causes of injury codes, unique personal identifiers (full name, Social Security number [SSN]) date of birth, address and county-level information, length of hospital stay, acute care charges, primary and secondary procedure codes, and discharge disposition. The data set is required to be 99 percent complete and 99 percent accurate with exception granted to the fifth digit of the diagnosis codes, which may be inaccurate due to limited access to diagnostic resources. Because the data sets are legally mandated, compliance with the submission guideline for UB reporting is 100 percent. Furthermore, the ORS has developed a report card as a feedback mechanism to provide accuracy rates to each hospital on an annual basis. The inclusion of personal identifiers (SSN and name) and addresses for each encounter greatly increases the potential benefits of these data sources for data linkage, medical record review, and follow-up of patients. The variables included in the UB-04 data set are described elsewhere (South Carolina Budget and Control Board Office of Research and Demographics, 2012). Data captured through the UB-04 are collated into the venues of clinical services as the inpatient department, ED, outpatient surgery, or clinic. The hospital inpatient department captures 20-22 percent of
people with epilepsy, while the ED and OPD jointly capture 45 percent of people with epilepsy each year. Hospital inpatient data mostly capture severe and refractory forms of epilepsy. ED surveillance is invaluable to capture people with epilepsy who do not have health insurance and use the ED as their medical home. One in ten people with epilepsy have no health insurance because they earn the bare minimum that makes them ineligible for Medicaid. The S.C. surveillance data suggest that two-thirds of people with epilepsy could be captured through hospital-based surveillance that includes inpatient, ED, and outpatient encounters.
Centers for Medicare and Medicaid Services-1500 (Noninstitutional Claims)
This billing system captures insurance claims for medical services provided by health professionals in noninstitutional facilities that are exempt from submission of electronic claims. These include clinical services rendered in physician offices, nursing homes, and long-term care facilities. Th ORS receives copies of patient billing extracted data on all items included in the CMS-1500 form, which are collated into the various venues of patient care as physician office visits, nursing home care, et cetera. The data set has a comparable level of completeness and accuracy to the UB-04 for most of the data items since it is intended to validate the accuracy of reimbursable billing. This data system captures young adult males with private insurance and older patients with Medicare. Nearly 15 percent of people with epilepsy are captured through this billing data set.
The Statewide Medicaid Data Set
The ORS has been receiving Medicaid data since the 1990s. According to Title XIX of the Social Security Act, a state’s Medicaid program must offer medical assistance for certain basic services to most categorically needy populations. The ORS works under contract with the state Medicaid agency supplying statistical analysis for utilization and quality assurance issues. Health care providers are required to submit all claims within a year if they are to be reimbursed. The ORS receives all transactions files for Medicaid including payment and eligibility files from all providers. Because about half of adults with epilepsy are classified as needy without employment, Medicaid captures about half of the people with epilepsy. The Medicaid state plan represents 500,000 eligible state residents.
State Health Plan Data Set
The ORS obtains this data set under a signed, open-ended contract with the State Employee Insurance Program, an agency also under the Budget and Control Board. The State Health Plan (SHP) has 463,000 subscribers and their families, accounting for 10 percent of the state population. The program tracks deductibles and copays associated with the health care system for enrollees and dependents. Information contained in the SHP data set includes physician office visits, hospitalizations, outpatient services, rehabilitation, procedures, and so forth. There are limitations to the SHP data set. It is not subject to Title 44 of the South Carolina Code of Laws and therefore is not subject to the same completeness and accuracy requirements as the health services utilization data sets. It also does not include information on race. However the SHP data set captures 10 percent of people with epilepsy that are not captured by any other data system.
Medicare Standard Analytic Files
These data provide a population-based analysis for persons older than 65 years of age and persons qualified for Social Security disability. The outpatient physician office visit data along with the pharmacy data will provide a mechanism for identifying patients with epilepsy. The detailed data elements for these files are compiled into a Medicare Data Dictionary. The ORS applies for the Beneficiary Encrypted Standard Analytical Files for all claims from the CMS. Approval to access the data set is more cumbersome than the direct access that the surveillance system has to other sources. Because it overlaps with the UB-04 system, 20 percent of people with epilepsy under Medicare are captured through the UB system. Given the increasing incidence of epilepsy among the elderly, access to Medicare Standard Analytic Files is important to complement epilepsy surveillance. Based on the 2010 demographic distribution of the state, this data system could provide detailed information on 12 percent of the South Carolina population (536,000: 486,000 older adults and 50,000 individuals with disability).
Medical Chart Review
Review of clinical records is one of the most important components of the surveillance system to validate and complement information. Records of randomly selected epilepsy (345.x) and seizure unspecified (780.39) patients are reviewed to estimate the sensitivity and predictive value positive of the case ascertainment criteria and acquire more detailed information on severity, frequency, type of seizure diagnosed, and seizure medication use. During the initial funding cycle, we reviewed 3,881 (5.5 percent) of the 70,955
records with 345.x and 780.39. A comprehensive report on the findings of chart reviews is available (Selassie et al., 2005). Since there is no specific code for seizure-like events and in order to validate the accuracy of 780.39, chart reviews are invaluable to determine the extent to which misdiagnosis confounds estimation of the incidence and prevalence of epilepsy. Sampling of records takes into account the size and status of the hospitals. There is oversampling of records from underresourced and rural hospitals where the accuracy of diagnosis is likely to be affected.
Methods of Identifying and Classifying People with Epilepsy
The SCESS receives electronic data from the ORS on all patient encounters with a primary or secondary diagnosis of epilepsy (345.x) and 780.39 (seizure unspecified) collated in UB, SHP, and Medicaid files on a biannual basis. The latter two files include noninstitutional claims on patient encounters rendered in physician offices, nursing homes, and long-term care facilities. A case of epilepsy is identified in each data file from any one of the 15 diagnosis fields. Each observation in these data files has a unique identifier (UID)—an encrypted individual tracking number developed by the ORS using various combinations of personal identifiers that include SSNs, dates of birth, and other demographic attributes. The UID is unique enough to allow linkage across multiple providers and services since 1995. The reported error rate of the UID for matching observations across files is < 0.05 percent (South Carolina Budget and Control Board Office of Research and Demographics, 2012).
Case identification begins by sorting the type of epilepsy diagnosis recorded in the data files. A flag variable is assigned for each observation based on the ICD-9-CM diagnosis grouped in the following order using “arrays” and “do loops” in a SAS program data step:
- Generalized nonconvulsive epilepsy (345.0)
- Generalized convulsive epilepsy (345.1)
- Petit mal status (345.2)
- Grand mal status (345.3)
- Focal epilepsy with complex partial seizures (345.4)
- Focal epilepsy with simple partial seizures (345.5)
- Infantile spasms (345.6)
- Epilepsia partialis continua (345.7)
- Other recurrent forms of epilepsy (345.8)
- Epilepsy unspecified (345.9)
- Seizure NOS (780.39)
Types of seizure listed in items 1 through 10 are considered highly probable cases of epilepsy, while the eleventh classification (seizure NOS) is considered as a likely case of epilepsy based on satisfying the decision algorithm depicted in Figure B-2. After cases have been identified, they are sorted by the UID and seizure type in an SAS data step (Proc sort data = xx; by UID ascending type). This step is followed by counting the number of times a given UID is listed in the database for encounters at least 2 days apart in each calendar year. Observations with more than one count (encounter) are allowed to have up to five seizure diagnoses and dates of encounter retained by extending the logical record length of the files using the SAS command “Proc transpose.” Duplicate records with identical entries or encounters noted in < 48 hours are deleted, keeping the updated and more complete information. The sorting of the type of seizure diagnosis in ascending order reduces the likelihood of deleting the more suggestive diagnosis of epilepsy than the least suggestive (345.9 versus 780.39). Data analysis shows that specific epilepsy diagnoses are frequently assigned by neurologists or after EEG evaluations. This procedure guides the process of deleting the less accurate provisional diagnosis.
Capacity to Follow Individuals Over Time
The SCESS has capacity to track and follow individuals over the course of accessing the health care system in South Carolina. This capacity is facilitated in partnerships with the ORS—the state entity with the legal authority to link the UID to secured files with names, telephone numbers, mailing addresses, and other information that aids in tracking. There are two levels of tracking. The first involves tracking of individuals across the various data systems housed in the ORS. A partial list includes the ED, hospitalizations, outpatient surgeries, Medicare, Medicaid, state employee health, vital records, mental health, alcohol and drug services, disabilities and special needs, vocational rehabilitation services, social services, home health, and disease registries. This tracking activity provides substantial amounts of information on vital events and utilization rates of services across health and social services in the state. Examples include how many people with epilepsy receive behavioral and mental health services or how many died in a given year. The second level of tracking occurs when researchers want to identify and acquire specific data on individual patients for IRB-approved study. In such circumstances, the ORS mails a letter of invitation, after approval from the data oversight council, to people with epilepsy on behalf of the study inquiring their willingness to participate in the proposed study. If they grant their consent to participate in the study, the ORS releases their personal information to the research team, including access to their medical records. In summary, the key factors that enable tracking and follow-up
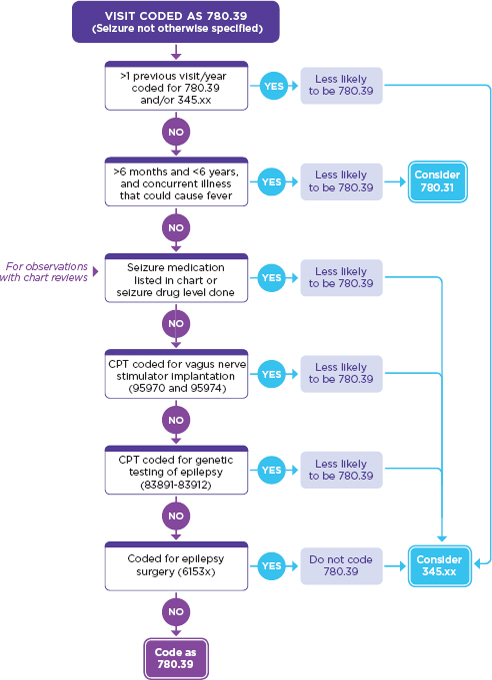
FIGURE B-2
Decision algorithm for individuals coded with a seizure not otherwise specified (780.39).
NOTE: CPT = Current Procedural Terminology.
are the availability of a central data repository for multiple data systems in an agency that has legal authority to identify people with epilepsy and the availability of the UID linked to personal information files to contact patients as needed.
Usefulness
The SCESS has demonstrable usefulness for case management and service delivery, policy development, and research. Examples include identifying low-income, severe cases of TBI-related epilepsy for service delivery in the Department of Disabilities and Special Needs. In this collaborative work, data gleaned from the SCESS inform resource planning based on periodic prevalence estimates and prioritizing for services. In the areas of policy development, the SCESS provided the information needed to build the case for a joint resolution (Act No. 168) to develop a comprehensive service delivery system for people with epilepsy. This act is currently pending the signature of the governor. In areas of clinical services, planning is under way to incorporate epilepsy care in underserved communities via telemedicine platforms. The overwhelming evidence of need for this approach emanated from the surveillance information. Data show that 40.7 percent of people with epilepsy in the state reside in rural counties that require at least a day’s trip to see a neurologist. In areas of research, the SCESS continues to be critical for development of pilot projects and cooperative grants by providing the preliminary data needed for research applications. Other uses include public information and education in an annual event known as “Epilepsy Boot Camp” and dissemination of brochures to health workers and physician offices on depression among people with epilepsy.
Strengths and Limitations
The SCESS has several strengths. First, it is a passive surveillance system that relies on existing data sources collected for administrative purposes. This makes the system cost-efficient with little or no need for data solicitation. Second, the events of epilepsy are captured from a well-defined population base, making the numerator representative of the denominator. This ensures that estimates derived are generalizable and valid. Third, data acquisition is timely, providing estimates on short- and long-term trends. Currently, 15 years of person-specific data are available on epilepsy and seizure disorders, making the system among the best sources of epilepsy data for epidemiological analysis. Fourth, the data system includes UIDs that allow linkage across multiple data platforms for service delivery, clinical research, and outcome studies. Capacity to link electronic surveillance data with medical charts has been particularly useful to evaluate positive
predictive value, sensitivity, and coding accuracy. Fifth, the data sets include information on procedures (up to 50 CPT codes) and acute care charges. CPT codes provide substantiating information on VNS implant, epilepsy surgery, genetic testing for epilepsy, and EEG monitoring to validate the diagnosis codes of epilepsy among persons coded with 789.03. Lastly, the availability of the full range of acute care charges broken down by type of service and procedure is important for cost-related comparative effectiveness studies.
Despite the aforementioned strengths, there are important limitations worth noting. First, while the data system is representative and complete for the civilian population, it does not capture cases diagnosed in federal medical facilities, specifically persons from the two VA and the five military hospitals. Given the high incidence of TBI-related epilepsy among Gulf War veterans, this is likely to contribute to underestimation of prevalence. South Carolina has an estimated 300,000 veterans whose risk for epilepsy is presumed to be higher than that of the general population. However, this limitation is a universal flaw of all public health data systems in the United States. Second, data come from administrative records designed primarily for billing third-party providers. This makes the coding of a diagnosis responsive to the policies of providers and the preference for diagnosis codes that maximize reimbursement. Further, there is preference for diagnosis codes that are less likely to be denied, lead to reduced reimbursement, or put more financial burden on the patient. A plausible explanation for the preference of 789.03 over 345.x in the face of multiple visits is in part to avoid labeling patients with a diagnosis of epilepsy. Our data evaluation shows that 82.6 percent of cases coded as 789.03 are true epilepsies. Third, with wide variability in skill sets and diagnostic resources among hospitals, the accuracy of the fourth and fifth digit of the diagnosis codes from underresourced hospitals might be unreliable. Fourth, the CPT codes are nonspecific for assessing if all EEGs, video-EEGs, and MRIs are related to the diagnosis of epilepsy without medical record evaluation. Likewise, cost estimates for epilepsy are “contaminated” by costs incurred by other conditions unrelated to epilepsy, requiring the development of a better methodology for cost analysis.
Incidence and Prevalence Estimates for 2006-2010
Brief Description of Methods for Estimating Prevalence and Incidence
Cases of epilepsy are discriminated as incidence or prevalence based on their first encounter. Case ascertainment criteria are described earlier. A flag variable is constructed by counting the number of times a case with a
UID is encountered. Cases with more than one encounters are labeled as “R” for repeat and “N” for new encounters. Because this report provides information on encounters since 2006, a few incident cases seen in the latter part of 2005 might have been labeled as new in 2006, making the estimated incidence in 2006 slightly higher—0.14 percent compared to 0.10 percent for the average of 2007-2010. The advantages and disadvantages of the system are described earlier.
Nontabular Description of Incidence and Prevalence
Incidence and prevalence were calculated taking the 2008 (the median year) population of the state as the standard. Population estimates were acquired by county and demographic characteristics from the CDC National Center for Health Statistics website (CDC, 2010). County-specific information on income and poverty level was extracted from the U.S. Census Bureau Small Area Income and Poverty Estimate (Census Bureau, 2011). Results show that the cumulative incidence of epilepsy from 2006 through 2010 is 0.5 percent, which yields an annual incidence of 0.095 percent, or 95 per 100,000 population per year. This estimate is much higher than the 39 per 100,000 per year reported from Rochester, Minnesota, for the period 1955-1984 (Annegers et al., 1995)—the only population-based study published based on complete case ascertainment criteria. This discrepancy is attributable to temporal variation and differences in population composition (Sander, 2003). By taking the mean age (32.2 years) of people with epilepsy in the state as the average duration of follow-up, person-year denominator was constructed to generate incidence density that can readily be converted to risk as proposed by Morgenstern and colleagues (1980). Accordingly, a probability of 0.0051 (5.1 in 1,000 S.C. residents) is estimated for new onset of epilepsy over the 5-year period of observation.
Annual incidence by age group showed 0.19 percent, 0.08 percent, and 0.05 percent for 0-18, 19-64, and ? 65, respectively. Gender differences were minimal, with females at 0.11 percent and males 0.10 percent per annum. Incidence was twice as high in blacks (0.16 percent) as in whites (0.08 percent). Incidence was 0.09 percent in Hispanics and 0.07 percent in other races. The most profound difference in incidence was noted among the insurance categories. Medicaid-insured individuals had 26-fold increased risk of new onset of epilepsy compared to those with private insurance (0.398 percent per year for Medicaid and 0.015 percent per year for private). Incidence was 0.053 percent for Medicare and 0.020 for the uninsured. Comparison of ratios in reference to private insurance indicates that the incidence of new onset was 26.0, 3.5, and 1.3 times greater in Medicaid, Medicare, and uninsured, respectively.
Annualized prevalence was in the same direction as the incidence. It was higher in the age group 0-18 (0.541 percent) followed by 19-64 (0.375 percent). The prevalence among older adults, age ≥ 65, was 0.242 percent. Analysis by gender showed higher prevalence in females (0.468 percent) than in males (0.328 percent). The magnitude of the difference in prevalence among the race or ethnic groups was comparable to incidence, with ratios nearly twice as high in blacks (0.626 percent) as in whites (0.317 percent). The prevalence among Hispanics was 0.222 percent and in races grouped as “other” was 0.273 percent. Prevalence estimates also show the disproportionate burden of epilepsy borne by persons with Medicaid insurance (1.059 percent). This is nearly seven times higher than the prevalence of people with epilepsy with private insurance (0.153 percent). The second highest prevalence was among persons with Medicare insurance. It is important to note the discrepant prevalence estimates observed in older adults (0.242 percent) and the high prevalence in persons with Medicare insurance (0.474 percent). This discrepancy is explained by Medicare eligibility criteria. Although all older adults are eligible for Medicare, not all Medicare eligibles are older adults. Medicare is also an entitlement program for persons with disability who qualified for Social Security Disability Income. In the epilepsy data set analyzed for this report, 25 percent of people with epilepsy younger than age 65 have qualified for Medicare. In fact the mean age of Medicare insured was 55.9 (±17.6) and the median age was 55. Thus, Medicare insurance carries a large proportion of prevalent cases of epilepsy with disability as reflected by the higher prevalence than that observed among older adults.
Comorbidities
Brief Description of Methods for Estimating Comorbidities
Co-occurrences of illnesses other than the primary disease of interest (epilepsy) are identified from the secondary diagnosis fields (9 in Medicaid and the SHP; 14 in the UB) in the data sets. Thirty-one comorbid conditions known to be associated with epilepsy beyond those that could be explained as chance and/or of interest to this report were identified using “arrays” and “do loops” in SAS V9.1.3. The SAS program was written in such a way that it identifies one disease at a time while ignoring the other comorbid diseases until the “do loop” exhausts all the diagnosis fields referenced in the array listing. This procedure allowed counting of more than one comorbid condition per patient. For example, 170 patients had 5 or more of the 31 conditions at the same time.
Description of Comorbidities Among Prevalent Cases
Of the prevalent cases, 39.3 percent have one or more comorbid conditions (i.e., 18.3 percent with two or more, 21.0 percent with one condition). Mental health comorbidities accounted for 14.9 percent, while cardiovascular diseases including established hypertension accounted for 21.6 percent. Diabetes mellitus and asthma with chronic bronchitis accounted for 7.9 percent and 8.1 percent, respectively. Based on corroborating Vcode (V15.82) and CPT code (99406-07), most of the chronic bronchitis cases appear to be associated with smoking. Substance abuse disorders (drugs and alcohol) were noted in 2,607 (4 percent) of the prevalent cases. Cognitive and learning difficulties were noted in 1,981 (3 percent) of the prevalent cases and appear to be associated with duration of illness based on the number of encounters with these patients. Stroke was noted in 2.5 percent of the prevalent cases, but it is uncertain whether it is temporally antecedent to the epilepsy or a subsequent event. Forty-three percent of stroke was noted among older adults with epilepsy. Another high-frequency comorbidity among prevalent cases is anemia, noted in 2,179 (3.25 percent) patients. While 59.5 percent of the prevalent cases are females, the proportion of females with anemia was 68.5 percent, suggesting the preponderance of females with epilepsy that have comorbid anemia. Other low-frequency but important comorbid illnesses include nutritional deficiency (N = 879; 1.3 percent), brain trauma (N = 272; 0.41 percent), multiple sclerosis (N = 265; 0.40 percent), and HIV/AIDS (human immunodeficiency virus/acquired immune deficiency syndrome) (N = 232; 0.35 percent).
Description of Comorbidities Among Incident Cases
Of incident cases, 16.2 percent have comorbid conditions. In contrast to the number of persons with comorbid illnesses among prevalent cases, comorbidity among incident cases is 60 percent less. The distribution of comorbid illnesses mirrors that of the prevalent cases with the difference being the counts of comorbidities. When proportions are derived from the number of cases with at least one comorbid illness (i.e., positive cases for comorbidity), significant differences exist between incident and prevalent cases. Chronic physical illnesses such as cardiovascular disease, diabetes, and asthma were significantly higher among prevalent cases, while the proportion of emotional and behavioral problems such as depression, mood, and anxiety disorders was significantly higher among incident cases: 48.3 percent of incident cases had emotional and behavioral problems in contrast to 37.5 percent of prevalent cases; conversely, 56.4 percent of the prevalent cases with at least one comorbidity had cardiovascular disease, compared to 39.2 percent of incident cases. These differences in the distribution of comorbidities between incident and prevalent cases yield
important information to estimate the residual risk of comorbid illnesses attributable to epilepsy.
Health Care Services
Brief Description of Methods Used to Estimate Health Care Services
The UB, SHP, and Medicaid files were linked with mental health and substance abuse service files that provide information on service utilization in clinics run by various agencies. Additional information pertaining to receipt of services was acquired with the CPT codes of 96150-96155, which indicate treatment for psychological, behavioral, emotional, and cognitive health problems. Information on access to specialty care was identified from rendering the specialty label included in all of the data sets utilized. Professional specialties were grouped in the following manner. Evaluations made by neurologists and neuropathologists were listed as a “neurologist care”; neurological (epilepsy) surgeons as “neurosurgery”; evaluations made by neuropsychiatrists and psychiatrists as “psychiatric care.” Evaluations made by family physician, internist, pediatrician, emergency medicine, and general practitioner were listed as “primary care.” All other consults and evaluations made by various specialties, including radiologist, nurse practitioner, psychologist, neuropsychologist, et cetera, were grouped as “all other care.” Receipt of care for psychiatric problems was determined by the specialist rendering the service or by referral disposition to mental health clinics, which when flagged indicated that the service was received. Venues of care were grouped as inpatient, hospital outpatient, or ED; physician offices; and ambulatory care services. Annual rate of use by venues of care was estimated by counting the total encounters made in each of the venues and expressed as a proportion. The algorithm used to identify epilepsy cases and recency of onset (incidence) is described earlier. Information on seizure medication use and most common prescription was identified from 2,226 randomly selected chart reviews in the state. The abstraction expenses were covered by funding from the CDC, NCCDPHP Epilepsy Program Office. Estimates for selected services are provided by the CPT codes. Direct cost of medical care was derived from charged amount per specialty and venues of care. According to the ORS, the charge-to-revenue ratio in South Carolina is $1.0:$0.92. Cost summary is analyzed using SAS “Proc tabulate” with “sum*$charge” and “mean*$charge” options. Information on provider specialty was missing in 24.3 percent of the cases. In these circumstances, missingness was determined to be completely at random and ignorable when comparisons of demographic, hospital, and payer characteristics of observations with missing and nonmissing values were not significantly different.
Receipt of Care for Psychiatric Problems
There is some discrepancy between the number of people with established diagnosis of psychosis, depression, mood and anxiety disorders, and receipt of care for these problems. While 9,489 (10.6 percent) of the total 89,938 people with epilepsy had the mentioned diagnoses, 7,570 (8.4 percent) received treatment. This suggests that of those with these psychiatric diagnoses, 79.8 percent received treatment for mental health problems, which included therapies offered by primary care physicians, clinical psychologists, and psychological counselors. The number of people with epilepsy who received treatment from psychiatrists was only 856 (0.93 percent of those with mental health problems).
Receipt of Epilepsy Care
Of the total 67,040 prevalent cases of epilepsy identified from 2006 to 2010, 22.8 percent were diagnosed and treated by neurologists (includes the 18 epileptologists in the state); 59.6 percent were evaluated and treated by PCPs; and 16.3 percent were evaluated and treated by other providers. Of the total 22,898 incident cases of epilepsy, 32.1 percent had evaluation and treatment rendered by a neurologist; 55.8 percent by PCPs; and 11.9 percent by other providers.
Seizure Medication Types and Combinations
Information on treatment relied on 2005 chart reviews since the surveillance data are not linkable to pharmacy files. Further, while revenue codes based on National Drug Codes are available, there are too many codes for the same generic product depending on dosage, routes of administration, and brand names, making such linkage unwieldy. Data from chart reviews of randomly selected 2,226 people with epilepsy showed that 70.5 percent were only on monotherapy; 24.2 percent were on two medications; and 5.3 percent were on three or more seizure medications. The most commonly prescribed seizure medications were phenytoin (55 percent), valproic acid (19 percent), carbamazepine 18 percent, phenobarbital (13 percent), and gabapentin (6 percent). Fifteen other seizure medications have usage rate of 5 percent or less. Odds of taking more than one seizure medication was influenced by severity (adjusted odds ratio = 1.72; 95 percent CI 1.29-2.30). Unfortunately, this information was completed earlier and could not be separated by incidence and prevalence. Similarly, it was not possible to obtain data on antidepressant use alone or in combination with seizure medications.
Annual Rates of Use and Direct Cost of Care
Usage rates were estimated by rates of encounters. Over the 5 years, there were 1,226,479 encounters with 89,938 unduplicated patients. The average encounters per patient per annum were 2.73. The most frequently utilized venue of care was the hospital-based ED at 26.6 percent. Most of the ED encounters were made by Medicaid and uninsured people with epilepsy, suggesting the disproportionate reliance of these patients on the ED as their medical home. Medicaid accounted for 55.4 percent of the total 1,226,479 encounters contributing to the heavy utilization of the ED. Medicaid patients have limited quota in private practices because of the very low reimbursement rate of Medicaid. Inpatient hospital care has the second-highest utilization rate per annum at 22.9 percent, with a preponderance of children and older patients for admission regardless of insurance status. Hospital-based outpatient services were the third most common venues of care, accounting for 17.8 percent of the encounters. Case mix was 33.8 percent Medicaid, 25.4 percent Medicare, and 25 percent private insurance. There were an average of 38,757 private physician office visits per annum accounting for 15.8 percent of the total encounters. The case mix was predominantly Medicare and Medicaid. EEG, psychological testing, imaging, and laboratory evaluation accounted for 16.9 percent of the visits.
The average charged amount per annum was $6,884 for inpatient care, $586 for ED care, $469 for hospital-based outpatient care, and $186 for private office visits. Hospital-based bills, EDs, and OPDs include procedure charges that are less frequently rendered in private offices. This analysis was not able to partition total charges per service into subcharges.
Receipt of Neurosurgical Interventions
There were 5,173 surgical interventions over the 5 years of observation, with annual interventions averaging 1,034. For this analysis, interventions were not partitioned by procedure types. The average cost of neurosurgical intervention ranged from $1,809 for Medicaid to $5,602 for commercial insurers, with an overall average of $4,501.00 per intervention. The total charge included the whole range of neurosurgical interventions from inserting and replacing a neurostimulator pulse generator in outpatient surgery to lobectomy. The great majority (90 percent) of the interventions were implants.
Detailed information on annual rates of use and costs of hospital care, ED care, and physician services in a given year; average number of services per setting; cost of seizure medications; and comparison to non-epilepsy population were not available. Furthermore, it is not possible to partition services by prevalence and incidence status until supplementary data elements are acquired from the sources.
Suggestions and Recommendations
For population-based analysis and public health activities, systematic and ongoing surveillance of epilepsy is best conducted by using existing multifaceted data sources. It will be ideal if there is a centralized agency or organizations, such as the ORS, that has the legal authority to serve as a data repository in defined jurisdictions. It will be important that there be unique identifiers to link files across multiple data platforms to unduplicate observations and discriminate incident and prevalent cases. Access to medical charts for periodic evaluations of positive predictive value, sensitivity, and accuracy of the case ascertainment criteria is of paramount importance. Because of the chronic nature of epilepsy and the stigma associated with it, epilepsy diagnosis is frequently masked with seizure unspecified, delirium, and even syncope codes. Sufficient knowledge of these cases is acquired when corroborating evidences is available from CPT codes, medication use, prior visits, and review of records. There is sufficient evidence gleaned from periodic surveillance to indicate the disproportionate burden of epilepsy in minorities and economically disadvantaged groups, rampant payer-related substandard care, and the occurrence of comorbidities among people with epilepsy that exceed the general population threshold. The increasing trends of epilepsy in the elderly and socioeconomically disadvantaged population groups suggest the plausibility of an ecological link between the disease and socioeconomic determinants. The chronic nature of epilepsy, with its major impact on quality of life, economic impact on the national health care cost, and potential to prevent secondary conditions associated with it, are strong public health rationales supporting the need to maintain four to six sentinel sites across the nation for ongoing surveillance of epilepsy.
REFERENCES
Annegers, J. F. 2004. Epilepsy. In Neuroepidemiology: From principles to practice, edited by L. M. Nelson, C. M. Tanner, S. K. V. D. Eeden, and V. M. McGuire. New York: Oxford University Press. Pp. 303-318.
Annegers, J. F., W. A. Hauser, J. R. J. Lee, and W. A. Rocca. 1995. Incidence of acute symptomatic seizures in Rochester, Minnesota, 1935-1984. Epilepsia 36(4):327-333.
Berg, A. T., S. F. Berkovic, M. J. Brodie, J. Buchhalter, J. H. Cross, W. van Emde Boas, J. Engel, J. French, T. A. Glauser, G. W. Mathern, S. L. Moshe, D. Nordli, P. Plouin, and I. E. Scheffer. 2010. Revised terminology and concepts for organization of seizures and epilepsies: Report of the ILAE Commission on Classification and Terminology, 2005-2009. Epilepsia 51(4):676-685.
Berlowitz, D. R., and M. J. V. Pugh. 2007. Pharmacoepidemiology in community-dwelling elderly taking antiepileptic drugs. International Review of Neurobiology 81:153-163.
CDC (Centers for Disease Control and Prevention). 2010. Bridged-race resident population estimates: United States, state and county for the years 1990-2009. http://wonder.cdc.gov/wonder/help/bridged-race.html (accessed January 6, 2012).
Census Bureau. 2011. Small area income and poverty estimates. http://www.census.gov/did/www/saipe/ (accessed January 6, 2012).
Hauser, W. A., J. F. Annegers, and L. T. Kurland. 1993. Incidence of epilepsy and unprovoked seizures in Rochester, Minnesota: 1935-1984. Epilepsia 34(3):453-468.
Hirtz, D., D. J. Thurman, K. Gwinn-Hardy, M. Mohamed, A. R. Chaudhuri, and R. Zalutsky. 2007. How common are the “common” neurologic disorders? Neurology 68(5):326-337.
Hope, O. A., J. E. Zeber, N. R. Kressin, B. G. Bokhour, A. C. Vancott, J. A. Cramer, M. E. Amuan, J. E. Knoefel, and M. J. Pugh. 2009. New-onset geriatric epilepsy care: Race, setting of diagnosis, and choice of antiepileptic drug. Epilepsia 50(5):1085-1093.
Kotsopoulos, I. A., T. van Merode, F. G. Kessels, M. C. de Krom, and J. A. Knottnerus. 2002. Systematic review and meta-analysis of incidence studies of epilepsy and unprovoked seizures. Epilepsia 43(11):1402-1409.
Morgenstern, H., D. G. Kleinbaum, and L. L. Kupper. 1980. Measures of disease incidence used in epidemiologic research. International Journal of Epidemiology 9(1):97-104.
Ngugi, A. K., S. M. Kariuki, C. Bottomley, I. Kleinschmidt, J. W. Sander, and C. R. Newton. 2011. Incidence of epilepsy: A systematic review and meta-analysis. Neurology 77(10):1005-1012.
Pugh, M. J. V., A. C. Van Cott, J. A. Cramer, J. E. Knoefel, M. E. Amuan, J. Tabares, R. E. Ramsay, D. R. Berlowitz, and the Treatment in Geriatric Epilepsy Research Team. 2008. Trends in antiepileptic drug prescribing for older patients with new-onset epilepsy: 2000-2004. Neurology 70(22 Pt. 2):2171-2178.
Sander, J. W. 2003. The epidemiology of epilepsy revisited. Current Opinion in Neurology 16(2):165-170.
Selassie, A. W., B. B. Wannamaker, P. L. Ferguson, E. E. Pickelsimer, G. Smith, and R. Turner. 2005. Final report of the South Carolina epidemiological studies of epilepsy and seizure disorders. Charleston, SC: Medical University of South Carolina.
Sillanpää, M., and S. Shinnar. 2010. Long-term mortality in childhood-onset epilepsy. New England Journal of Medicine 363(26):2522-2529.
South Carolina Budget and Control Board Office of Research and Demographics. 2012. Health utilization menu. http://ors.sc.gov/hd/utilization.php (accessed January 6, 2012).
Thurman, D. J., E. Beghi, C. E. Begley, A. T. Berg, J. R. Buchhalter, D. Ding, D. C. Hesdorffer, W. A. Hauser, L. Kazis, R. Kobau, B. Kroner, D. Labiner, K. Liow, G. Logroscino, M. T. Medina, C. R. Newton, K. Parko, A. Paschal, P.-M. Preux, J. W. Sander, A. Selassie, W. Theodore, T. Tomson, S. Wiebe, and the ILAE Commission on Epidemiology. 2011. Standards for epidemiologic studies and surveillance of epilepsy. Epilepsia 52(Suppl. 7):2-26.
Weinstein, A., A. Bengier, M. A. Eccher, and F. G. Gilliam. 2011. Enzyme-inducing anti-convulsant effects on lipid levels: Absence of evidence from a patient database. Poster accepted for presentation at the American Epilepsy Society Annual Meeting, Baltimore, Maryland (December). http://www.aesnet.org/files/dmfile/PosterSession1_2011.pdf (accessed January 6, 2012).


