
Data Evaluation and
Software Development
The computational and the value submodels were developed in parallel and then integrated over a software platform that allows users to interact with and understand the relationships between the model input and output. The model development and interface development occurred concurrently. The committee received and adjusted its software development strategy based on feedback received from consultant concept evaluators.
In the following sections we describe the selection of vaccine candidates and of the related data to be fed into the model and then the actual model development and evaluation process.
Selection of vaccine candidates
The committee considered several hypothetical vaccine candidates from the perspectives of the United States and of a developing country. The committee agreed on South Africa as the particular developing country for this process since its income profile, its population, and its health, economic, and social priorities are vastly different from those of the United States. A second reason for selecting South Africa was the availability of input data for disease burden and vaccine estimates, which were necessary to populate and test the model.
The five hypothetical candidate vaccines chosen were a universal influenza vaccine plus vaccines against tuberculosis, group B streptococcus, malaria, and rotavirus. However, as the work of assembling the data for the first vaccines began, it became clear that the present scope of work
made it feasible to complete testing for only three of the candidate vaccines. The committee chose the universal influenza vaccine, the tuberculosis vaccine, and the group B streptococcal vaccine for this phase for a collection of reasons related to how the candidate vaccines helped capture various health, economic, and vaccine attributes.
For example, the universal influenza vaccine addresses a disease that is important in both high- and low-income countries, and the convenience of a single vaccine for all influenza strains would make it readily useful for all parts of the world. Furthermore, influenza affects all age groups and causes widespread morbidity worldwide. In contrast, tuberculosis does not pose a significant threat in high-income nations, thus a vaccine for tuberculosis would likely be of most use in the low- and middle-income countries. And group B streptococcus vaccine would be pertinent for both low- and high-income countries but is designed for administration to pregnant women (a special population) and would confer benefits to their infants. Additional information on the impact of influenza, tuberculosis, and group B streptococcus can be found in Boxes B-1, B-2, and B-3 in Appendix B.
In its data-gathering process, the committee did not attempt to develop the best or most detailed estimates about each disease. The objective was instead to obtain reasonable data that could help the committee evaluate the model rather than to generate precise projections about specific vaccines.
The committee chose to develop reasonable estimates for data based on literature reviews and expert opinion, and it sometimes also relied upon committee-generated assumptions because much of the information required for the model, especially information concerning South Africa, was not available. It is thus reasonable to view the data inputs as characterizing hypothetical vaccines against influenza-like, tuberculosis-like, and group B streptococcus–like syndromes.
The estimates and assumptions used in this model were based upon literature reviews, publicly available data provided by international agencies such as the World Health Organization (WHO), and publications of various other organizations, such as the Agency for Healthcare Research and Quality (AHRQ) and the Healthcare Cost and Utilization Project (HCUP) in the United States.
For each candidate vaccine, the model used several categories of inputs (see Table 3-1 for specifics):
TABLE 3-1
Data Entries, Sources, and Methods of Analysis
| Data | Parameters | Sources | Method of Analysis | Notes |
| Demographic Variables | Life Tables |
•The country life tables are available from WHO, Global Health Observatory Data Repository (http://bit.ly/H5iYNC) •Standard life expectancy depicts the life expectancy for the Japanese population. Also available through WHO, Global Health Observatory Data Repository (http://bit.ly/Ho2VI3) |
Total Population, N, data was used from a separate document provided by WHO officials. | |
| HUI-2 |
•Fryback et al. (2007). U.S. norms for six generic health-related quality-of-life indexes from the National Health Measurement study. Medical Care 45(12):1162–1170. |
HUI-2 scores are derived from the literature. Due to the lack of HUI-2 data for South Africa, values for the United States are used. | ||
| Wage Rate |
•Hourly wage rate is gathered from the Bureau of Labor Statistics. |
The BLS Current Population Survey data were used for wage rates. | Wage Rate for South Africa was crudely estimated by converting the United States wage rate to South African wage based on the prevailing exchange rate. | |
| Data | Parameters | Sources | Method of Analysis | Notes |
| Disease Burden | Target Population |
•Obtained from the total population data used in the “demographics” section. |
Specific group from the entire population suited for the vaccine. | |
| Annual Incidence Rate |
•CDC, WHO •Published literature |
See disease and vaccine tables in Appendix C for details. | ||
| Case Fatality Rate |
•Published literature •Expert opinion |
|||
| Vaccine Coverage | ||||
| Vaccine Effectiveness | ||||
| Herd Immunity Threshold | Assumed to be 100 percent due to infectious nature of each disease. | |||
| Vaccine Characteristics | Length of Immunity |
•Published literature •Expert opinion |
||
| Doses Required per Person | ||||
| Cost per Dose | •CDC | |||
| Research Costs | •Expert opinion | |||
| Licensure Costs | ||||
| Start-Up Costs | ||||
| Time to Adoption | ||||
| Disease Morbidities | Percent of Cases Disutility (Toll) Disability Weight Duration |
•Published literature •Expert opinion |
In cases, where information on exact conditions was not available in HUI-2 index and DALY weights, proxies were used to estimate values for tolls and disability weights. | See disease and vaccine tables in Appendix C for details. |
| Vaccine-Reiated Complications | Morbidity Probability per Dose Disutility (Toll) Disability Weight Duration |
•Published literature •Expert opinion |
See disease and vaccine tables in Appendix C for details. | |
| Health Care Services | Services Used for the Treatment of Disease and Potential Complications Caused by the Vaccine |
•Healthcare Cost and Utilization Project (HCUP) •WHO-CHOICE (Choosing Interventions that are Cost Effective) tables of costs and prices (WHO, 2003) |
See disease and vaccine tables in Appendix C for details. |
• Population characteristics, including the number of persons in the population and age and sex distributions. The underlying population characteristics for both the United States and South Africa were imported from country life tables provided by WHO through its Global Health Observatory Data Repository.
• Disease characteristics, including annual incidence rate, case-fatality proportion, and complications. For the United States, disease-burden data were obtained primarily from the literature and reports by the Centers for Disease Control and Prevention (CDC), such as Morbidity and Mortality Weekly Reports (MMWR) and National Vital Statistical Reports (NVSR). Comparable information for South Africa was not as readily available. Statistics South Africa and SA Health Info were helpful in providing approximate data, which were adapted to best fit the model parameters.
• Health characteristics, including disability-adjusted life years (DALYs) and quality-adjusted life years (QALYs), were obtained from the available literature. DALYs were calculated by assigning DALY weights from the Global Burden of Disease study (Mathers et al., 2006). Similarly, HUI-2 was used as a measure to calculate QALYs. When the exact condition of concern was not categorized in DALY and HUI-2 weights, proxies were used. Appendix C provides a listing of the data used in the model.
• Vaccine characteristics, including the number of years to full adoption, population coverage rate, effectiveness, length of immunity, doses required per person, costs of administration, and research and development costs. Vaccine traits were a combination of factual data and expert panel judgments. Vaccine efficacy, vaccine-associated complications, coverage, and the number of doses required for immunity were estimated from the literature, whereas time to adopt a vaccine within an immunization scheme, development risk, and innovation for new delivery methods were guided by expert opinions. Data on health care costs for disease and vaccine candidates were obtained from both a literature review and governmental Web sites such as those for HCUP and CDC for the United States and WHO’s Choosing Interventions that are Cost-Effective (CHOICE) project for estimates of health care services costs in South Africa.
For each of the selected vaccines, assembling the data needed for the model presented a different set of challenges.
Tuberculosis poses a significant health challenge in South Africa, and published literature concerning the magnitude of the disease is available.
But accurate epidemiologic and health care cost estimates are difficult to obtain. Some assumptions about disease burden were made to generalize available information to South African populations when age-specific data were not available. By comparison, tuberculosis incidence and health care cost records are available for the United States; thus data for the disease in the United States can be considered fairly accurate.
Group B streptococcal infection is a serious disease in infants. Regardless of the disease burden posed in this vulnerable population, comprehensive surveillance is lacking throughout the world. Additionally, locating data for economic analyses is a daunting task in light of the limited resources available for this estimation. Thus, it was very difficult to populate all the model parameters for group B streptococcus, and many fields of data entry are informed assumptions.
Information for influenza, for example, was fairly accessible through U.S. and international flu surveillance modules, and literature on flu vaccines is abundant, given the global prevalence of the illness.
SMART Vaccines includes two submodels—the computational submodel and the value submodel. As previously shown (Figure 2-1), the computational submodel calculates multiple health and economic measures associated with new vaccine candidates. Many of these measures build upon the work presented in the 2000 IOM report. The computational submodel evolved with the improvements in the health and economic attribute listing for the model. The desire for interpretable health and economic attributes drove much of the computational submodel design.
Early prototypes strongly resembled the model presented in the 2000 report. Those prototypes were tested using the same input information and were determined to reliably replicate the results of the 2000 report. However, this initial prototyping highlighted several limitations in the analytical structure of the 2000 report, specifically in the context of accommodating the following features:
• Computations for all desired health and economic attributes.
• Variations in timing between vaccine administration and onset of disease or death.
• Differences between vaccines that protected for different lengths of time (i.e., 5-year universal influenza vaccine versus 1-year seasonal influenza vaccine).
• Potential future improvements accounting for disease or population dynamics.
Limitations in flexibility directed the modeling efforts toward a population process model whose technical aspects are presented in Appendix A.
The computational submodel comprises seven computed attributes derived from health, vaccine, and economic inputs. The remaining 22 attributes, called “qualitative attributes,” were defined in an iterative process by the committee. After formal definitions were developed, levels of assessment were specified (Table 2-1).
The health and economic attribute measures were stratified by category (e.g., Level 2 = $/QALY between $0 and $10,000) so as to not over-specify computational model results, given the inherent uncertainty in input information. Determining the appropriate categories for health and economic measures that are to be generalized across populations of varying size, disease incidence, and mortality rates is a complex process. The categorization of the health and economic attributes needs to be conducted through a thorough evaluation of the model, supported by epidemiologic and economic evidence. This categorization has yet to be completed, but the preliminary assessment resulted in an initial set of categories to use as examples. The qualitative attributes not generated by the computational model are directly assessed by users. Definitions of categories for direct assessment were developed in an iterative process and then finalized. After finalizing the attribute definitions and assessment categories, the committee incorporated the multi-attribute weighting approach. The committee chose the rank order centroid method described in Chapter 2 for ease of use and reliability.
Development of the computational submodel
The computational submodel contains expressions for health and economic values that are based on a population process model. The process model is initialized at year i = 0 for a stationary population with: no vaccine (i.e., the baseline population); the vaccine in steady state delivery; and the vaccine first being introduced.
Annualized health and economic values are calculated by comparing a population with a vaccine in steady state to a baseline population after aging 1 year. Values capturing the efficiency of the investment (i.e., cost-effectiveness) are calculated by comparing a population where the vaccine is first introduced to a baseline population after aging 100 years. The following are further relevant details about the three types of populations:
1. The baseline population may have received no vaccine for the disease target. However, the baseline population may include the current vaccination state as a reference against which to compare a newly developed vaccine with different (i.e., more desirable) characteristics targeting the same disease.
2. When the vaccine is administered to the steady state population, individuals of all ages are assumed to have had the opportunity (i.e., accounting for coverage) to receive the vaccine at model initialization. For example, for a vaccine that is solely targeted for infants, individuals of all ages are assumed to have had the opportunity for vaccination. Achieving steady state for this vaccine would require many years, as compared with a vaccine designed for delivery to all ages.
3. The vaccine first being introduced to a population assumes that the vaccine is delivered solely to the target population (i.e., accounting for coverage) at model initialization.
The age-specific population process model simulates measures of population size for the total population, the target population, the vaccinated immune members of the populations, the vaccinated susceptible members, the not-vaccinated immune members (i.e., those who have indirect protection through herd immunity), and the not-vaccinated susceptible members. Simulated health measures include incident cases, deaths by disease, vaccine complications, all-cause deaths, and cause-deleted deaths. Mathematical expressions for these process measures may be found in Tables A-1 and A-2 in Appendix A.
Health and economic attributes are calculated from the population process model with mostly linear expressions (as shown in Tables A-1 and A-2) to serve as a starting point for the committee’s modeling effort. Annualized measures are differentiated over the first year i = 1 between a population with no vaccine and a population with the vaccine in steady state. These annualized measures include deaths averted, cases prevented, QALYs gained, DALYs averted, net direct costs, workforce productivity (i.e., indirect costs), and one-time costs. The length of time associated with the annualized health and economic attributes associated with death and permanent impairment is assumed to be 6 months, as this is the average time of death between year i = 0 and year i = 1. Within these tables, vaccine populations for annualized measures refer to the vaccine-in-steady-state populations.
Alternatively, calculations on cost-effectiveness measures (i.e., $/QALY or $/DALY) are performed over 100 years. Time durations incorpor-
ated within QALYs and DALYs (i.e., included in cost-effectiveness only) associated with death and permanent impairment are assumed to be future life expectancy. Life expectancy is adjusted for baseline health utility indices (i.e., HUI2) for QALYs only. Life expectancy is discounted for both QALYs and DALYs when a discount factor is introduced. Expressions for cost-effectiveness measures may be found in Tables A-1 and A-2. Within these tables, vaccine population references are assumed to be the populations where the vaccine is first introduced.
Evaluation of the computational submodel
The computational submodel has been evaluated using four base cases for preventative vaccine candidates. These cases, given in Table 3-2, are for seasonal influenza, group B streptococcus, and tuberculosis within the United States (2009) and for tuberculosis within South Africa (2009).
Table 3-2 presents input assumptions for the target population, the duration of immunity, the cost to administer, the herd immunity threshold, and coverage. It also displays annualized health and economic attribute measures applicable to a vaccine in a steady state population and efficiency measures for a population in which a vaccine is first introduced. These measures are summed over 100 years and discounted at three percent. These evaluations allow for a constructive comparison of characteristics across base cases.
The model identifies the vaccine for seasonal influenza (i.e., with 1-year duration of immunity) having the largest health impact in terms of averting deaths, preventing cases, and increasing health-adjusted life years within the United States. Direct costs are notably high because annual administration (i.e., delivery costs) to an assumed undifferentiated target population of all ages is much more expensive than delivering the vaccine solely to infants. However, given improvements in health-adjusted quality of life, the cost-effectiveness is greater for the seasonal influenza vaccine than for other candidates in the United States.
The evaluation of the base cases demonstrates major differences between targeting tuberculosis in the United States and in South Africa. The health and efficiency attribute measures are improved within the South African population, where disease incidence is much higher. In South Africa administering the vaccine in steady state is cost-saving (i.e., net direct costs <0). It is important to note that the corresponding efficiency measures do not demonstrate cost savings (i.e., cost per QALY or DALY >0). This highlights a difference between examining vaccine candidates in steady state and the standard computations of cost-effectiveness
TABLE 3-2
Computational Submodel Evaluations for Baseline Cases
| Demographic Attributes | Influenza, United States 2009 | Group B Streptococcus, United States 2009 | Tuberculosis, United States 2009 | Tuberculosis, South Africa 2009 |
| Target Population | All ages | Infants | Infants | Infants |
| Duration of Immunity | 1 year | Life | Life | Life |
| Cost per Dose | $13 | $100 | $50 | $25 |
| Herd Immunity Threshold | None | None | None | None |
| Coverage (Average) | 38% | 85% | 85% | 50% |
| Health Attributes (per Year) | Vaccine Steady State | |||
| Premature Deaths Averted | 12,095 | 1,248 | 671 | 28,973 |
| Incident Cases Prevented | 6,123,612 | 14,841 | 7,451 | 140,239 |
| QALYs Gained | 21,011 | 3,571 | 1,373 | 40,680 |
| DALYs Averted | 8,665 | 1,170 | 622 | 21,421 |
| Economic Attributes (per Year) | Vaccine Steady State | |||
| Net Direct Costs (Delivery—Health Care) | $1,929,730,356 | $274,313,238 | $253,174,240 | -$95,357,702 |
| Vaccine Delivery Costs | $2,691,438,051 | $570,970,118 | $285,485,059 | $15,278,835 |
| Health Care Costs Averted | $761,707,695 | $296,656,880 | $32,310,819 | $110,636,537 |
| Workforce Productivity Gained | $4,619,173,825 | $102,210,335 | $28,345,945 | $285,934,338 |
| One-Time Costs (Research + Licensure) | $150,100,000 | $810,000,000 | $610,000,000 | $610,000,000 |
| Cost Effectiveness (100 Years) | Vaccine First Introduced | |||
| $/QALY | $7,389 | $40,539 | $801,122 | $204 |
| $/DALY | $14,130 | $54,992 | $1,195,821 | $270 |
for introducing a vaccine to a stationary population. For new candidate vaccines, a ramp-up phase may exist, which likely depends upon the timing of the desired vaccine administration (i.e., age of delivery) and the onset of disease. During this phase, the efficiency (i.e., health-adjusted life years and net direct costs) may be different than in a steady state. Furthermore, vaccine delivery schedules and target populations may be designed differently, based on the objectives for each phase.
The base cases were altered to test the relationship between the input information and the health and economic attribute measures (i.e., outputs). This verification process was performed across all inputs with example test cases shown in Table 3-3.
For example, the seasonal influenza vaccine (i.e., with 1-year duration of immunity) was altered to reflect a hypothetical universal vaccine that would provide protection for 10 years. A projected increase in the administrative costs was also included. These changes resulted in a decrease in delivery costs and improved efficiency because of less frequent administration compared to the seasonal base case. However, the improvements are substantially mitigated by the projected increases in the cost of vaccine.
Similarly, the reductions in cost to administer the group B streptococcus vaccine demonstrate more desirable economic measures. Herd immunity threshold was set at 80 percent for tuberculosis in the U.S. test case. Intuitively, the resulting health attribute measures should increase as a result of the indirect protection associated with herd immunity. Finally, the vaccine coverage for tuberculosis in the South Africa base case was increased. This resulted in proportional increases in the health and economic attribute measures. The health impact is greater; however, the cost-effectiveness remains constant compared to the base case.
Simulation of the value submodel
The committee also developed an iterative version of the value submodel in a worksheet in order to simulate and understand the variations in user preferences of attributes. Figure 3-1 displays a screenshot of the user worksheet. Two large blocks and one graph make up the screen. In the top block there are four columns; from left to right these are:
1. Two yellow columns in which the user selects and rank orders the subset of attributes to be used in the multi-attribute utility model.
2. A white area listing the 8 categories of attributes, with a total of 29 attributes.
TABLE 3-3
Computational Submodel Evaluations for Test Cases (Input Changes Indicated by Bold Orange Italics)
| Demographic Attributes | Influenza, United States 2009 | Group B Streptococcus, United States 2009 | Tuberculosis, United States 2009 | Tuberculosis, South Africa 2009 |
| Target Population | All ages | Infants | Infants | Infants |
| Duration of Immunity | 10 years | Life | Life | Life |
| Cost per Dose | $65 | $50 | $50 | $25 |
| Herd Immunity Threshold | None | None | 80% | None |
| Coverage (Average) | 38% | 85% | 85% | 75% |
| Health Attributes (per Year) | Vaccine Steady State | |||
| Premature Deaths Averted | 12,095 | 1,248 | 838 | 43,459 |
| Incident Cases Prevented | 6,123,612 | 14,841 | 9,314 | 210,358 |
| QALYs Gained | 21,011 | 3,571 | 1,719 | 61,020 |
| DALYs Averted | 8,665 | 1,170 | 777 | 32,131 |
| Economic Attributes (per Year) | Vaccine Steady State | |||
| Net Direct Costs (Delivery—Health Care) | $232,954,193 | $83,989,865 | $242,021,811 | -$143,036,554 |
| Vaccine Delivery Costs | $994,661,888 | $380,646,745 | $285,485,059 | $22,918,253 |
| Health Care Costs Averted | $761,707,695 | $296,656,880 | $43,463,248 | $165,954,807 |
| Workforce Productivity Gained | $4,619,173,825 | $102,210,335 | $41,522,924 | $428,901,508 |
| One-Time Costs (Research + Licensure) | $705,000,000 | $810,000,000 | $610,000,000 | $610,000,000 |
| Cost Effectiveness (100 Years) | Vaccine First Introduced | |||
| $/QALY | $1,062 | $14,212 | $639,232 | $204 |
| $/DALY | $2,030 | $19,279 | $952,630 | $270 |
FIGURE 3-1 Prototype value submodel simulation worksheet with user attributes and graphical display of vaccine priority scores.
3. A yellow area into which the user enters achievement levels for up to 5 hypothetical vaccines (labeled at the top) for each of the 29 attributes.
4. A white and gray area defining the potential achievement level categories for each of the attributes.
The lower block and the bar chart display outputs of the multi-attribute model. The selected attributes from the upper areas have been assigned weights, the categorical achievement levels on each attribute have been scaled with the weights, and the scaled weights have been summed to display a total priority score for each of the five vaccines at the bottom in the orange colored rows. These scores are displayed in the form of a bar chart showing the scores for each vaccine.
Figure 3-2 shows a closer view of the user input areas. Five hypothetical vaccines are shown in the right-hand yellow columns. The hypothetical influenza vaccine is conceived of as a modest improvement on an existing annual influenza vaccine. Reading down the column titled Influenza,
FIGURE 3-2 A closer view of the user input areas in the value submodel simulation worksheet.
one can see that it is rated as Level 2 on the attribute Premature Deaths Averted per Year (Attribute 1.1), as Level 1 on Incident Cases Prevented per Year (Attribute 1.2), and so forth down the column. The figure shows the levels entered for five hypothetical vaccines. Levels for each attribute are defined in the worksheet (Figure 3-1) and in Table 2_1.
The purpose of this spreadsheet was to allow the committee to experiment with the value computations part of the SMART Vaccines model. This permitted the committee to do “What if?” modeling quickly. But it also required the committee to estimate or fabricate entries for the hypothetical vaccines outside of the computations of the formal model.
Figure 3-2 shows a situation in which the user has selected 11 attributes with which to evaluate the vaccines. The submodel requires that Likelihood of Successful Licensure (Attribute 5.2) be selected in order to ensure that the user considers this factor. This requirement was added after some concept evaluators of SMART Vaccines Beta strongly endorsed
the importance of this factor. The Likelihood of Successful Licensure in 10 Years will depend greatly on specific scientific and immunologic advances and constraints, and different users may have different levels of knowledge about this area.
Users indicate factors to be considered by placing an “x” in the left-most column. The spreadsheet counts the “x” boxes and notes in red colored count at the bottom how many have been selected. This total is also reflected in the message at the top of the second column where the instruction reads, “Rank from 1 to 11.” If only six boxes had an “x,” then this message would read “Rank from 1 to 6,” and so forth.
To demonstrate how perspectives might affect ranking choices, two hypothetical perspectives are presented: a vaccine producer and a health minister of a developing country. In this example, the user (say, a vaccine manufacturer) has entered numbers from 1 to 11 in the second column to indicate the rank order of importance of the selected attributes, with 1 being most important and 11 being the least important. Once the ranking is completed, the output of the value model is shown in the lower block (Figure 3-3) and the graph (Figure 3-1).
Figure 3-3 shows the tabular output from the simulated value submodel spreadsheet. The tabular output displays, from left to right, the weights associated with each of the selected attributes, the attribute labels, the subtotal percentage weight in the model assigned to each of the eight logical groupings of attributes, and the single attribute weighted score for
FIGURE 3-3 Output of the simulated value submodel.
each of the vaccines. At the bottom of the table in orange are the total scores for the five vaccines (scaled from 0 to 100).
The attribute ranked as most important by the hypothetical vaccine manufacturer, Attribute 2.4, Cost-Effectiveness, received 27.5 percent of the weight; the next most important, Attribute 5.2, Likelihood of Successful Licensure in 10 Years, received 18.4 percent of the weight. The category Public Concerns received a total of 29.0 percent of the weight (summing across the three attributes selected in this group). Reading down the GBS column, representing a hypothetical group B streptococcus vaccine, Attribute 1.3 contributed nothing to its total score because the rating on that attribute was only a Level 4, or the lowest level possible. By contrast, Attribute 2.4 contributed 0.275 to the total score.
Summing down the columns, the maximum possible total is 1.0—which is achieved only if the vaccine is rated at Level 1 (the best level) for each of the selected attributes. The minimum score is 0, which would be achieved only if the vaccine was rated at the lowest (worst) possible level for every one of the selected attributes. The sums in the table have been multiplied by 100 to scale them from 0 to 100. In the figure, the influenza vaccine scored a total of 0.635, which multiplied by 100 is 63.5; the tuberculosis vaccine scored 35.3, the group B streptococcus vaccine scored 61.9, and vaccines D and E scored 22.9 and 61.1, respectively.
The weights in the table are assigned using the rank order centroid method described in Chapter 2. They are displayed as percentages of the total weight in the model. If the user were to re-rank the attributes, the weights would change, as would the subscores and the total scores for the vaccines. If the user were to change the achievement levels for the hypothetical vaccines in the yellow area in Figure 3-2, these scores would change. This output table shows the detailed effects on the priority scores of the achievement levels of vaccines on the attributes, of the user’s attribute selection, and of the user’s ranking of attributes.
Now, let us assume the perspective of a health minister from an emerging South American country who may wish to place the priorities for a new vaccine in the following order:
1. QALYs Gained or DALYs Averted
2. Benefits Infants and Children
3. Reduces Challenges Relating to Cold-Chain Requirements
4. Cost-Effectiveness
5. Likelihood of Successful Licensure in 10 Years
Based on this order, QALYs Gained or DALYs Averted (Attribute 1.3) receives the highest weight of 45.7 percent. In contrast to the hypothetical vaccine manufacturer who selected 11 attributes, the health official only selected five, thus distributing the weights among fewer selections. The second important attribute for the health official—Benefits Infants and Children (Attribute 3.1)—receives 25.7 percent weight followed by “Reduces Challenges Relating to Cold-Chain Requirements” (Attribute 6.3) with 15.7 percent of the weight. Cost-Effectiveness (Attribute 2.4) and Likelihood of Successful Licensure in 10 Years (Attribute 5.2) receive 15.7 percent and 4 percent, respectively. The final ranking of vaccine candidates are the TB vaccine with a score of 54.6, followed by the GBS vaccine at 54.3, vaccine D at 47.5, the influenza vaccine at 40.6, and vaccine E at 1.0.
These examples illustrate the flexibility of the value submodel in response to the preferences set by the user. The final ranking scores of the vaccine manufacturer and the health minister are quite different because of their differing priorities, which highlights the potential of SMART Vaccines to facilitate discussions among parties and helping them reach mutually desired objectives.
The value experiment and scenarios
To further illustrate the effect of—and sensitivity to—different choices in the multi-attribute utility model, a simple exercise was performed, called the “value experiment.” Six vaccines, for use against one or the other of two diseases, were considered; some of the vaccines actually exist, and some were fictitious, created for use in the experiment. The value experiment was designed to test and illustrate the process of selecting values and to generate sample sets of values that would then be assigned weights and used to test the model. This experiment was conducted while the prototyping of the model was ongoing, so the vaccines evaluated and the assumptions were slightly different from the completed SMART Vaccines Beta.
The committee members and staff ranked the following six vaccines:
1. influenza with 1-year efficacy;
2. influenza with 5-year efficacy;
3. tuberculosis with 3-year efficacy;
4. tuberculosis with lifetime efficacy;
5. influenza with 50 percent increase in efficacy for those receiving vaccination; and
6. tuberculosis with 3-year efficacy, but with a 100-fold increase in incidence in the population risk.
Participants were asked to think about the candidate vaccines for the United States and for low-income countries. Half the participants ranked these vaccine characteristics from the perspective of the United States and half from the perspective of low-income countries. They were provided with a list of an earlier draft attributes deemed important for vaccine prioritization (see Table 2-1). The participants then selected up to five attributes of highest importance to them and ranked them based on their own perspectives. The group included individuals with diverse perspectives, from infectious disease epidemiologists and authorities on health care in low-income countries to experts in health economics, systems engineering, and decision sciences.
The weights were then applied against the vaccines under consideration through SMART Vaccines Beta to calculate each person’s priority score for the vaccine and disease combinations. The participants ranked the priorities in the following order:
1. Premature deaths averted per year
2. Incident cases prevented per year
3. Likelihood of successful licensure in 10 years
4. QALYs gained or DALYs averted (DALYs were #4, and QALYs were #6)
5. Cost-effectiveness ($/QALYs)
This experiment shows how weights can have a significant effect on the priority scores. Table 3-4 shows the results for participants A through N. Compare, for example, rankings produced by the multi-attribute utility weights of persons A and B. The weights specified by A led to the highest value (priority score) being placed on the influenza vaccines, the order being quite understandable intuitively (highest for a 1-year with 50 percent increase in efficacy, then the 5-year vaccine, followed by the 1-year vaccine), with the two tuberculosis vaccines running considerably behind. The weights specified by B, however, gave quite a different ranking. That participant gave the highest value to the hypothetical tuberculosis vaccine with 3-year immunity in a population with 100 times higher incidence.
Two other observations emerge from examining this table. First, one cannot meaningfully compare numerical scores across different raters. Person B’s score of 44 (tuberculosis with lifetime immunity) has no relationship to person K’s score of 44 (influenza with 5-year immunity). To equate these two scores would be to make a mistake similar to saying that 65ºF and 65ºC were the same temperature. To compare values across similar or different vaccine scenarios for two persons is faulty because the priority
TABLE 3-4
Scores from the Value Experiment
| Influenza, 1-year immunity | 72 | 42 | 36 | 68 | 61 | 43 | 56 | 61 | 52 | 54 | 36 | 63 | 36 | 49 | 64 | |
| Influenza, 5-year immunity | 76 | 52 | 36 | 70 | 69 | 47 | 57 | 77 | 54 | 66 | 44 | 69 | 47 | 67 | 67 | |
| Tuberculosis, 3-year immunity | 34 | 22 | 35 | 24 | 46 | 14 | 13 | 21 | 10 | 18 | 28 | 27 | 11 | 20 | 18 | |
| Tuberculosis, lifetime immunity | 43 | 44 | 35 | 29 | 47 | 20 | 13 | 58 | 10 | 28 | 29 | 42 | 26 | 42 | 24 | |
| Influenza, 1-year immunity, 50% increased coverage | 86 | 42 | 36 | 89 | 69 | 55 | 77 | 69 | 73 | 70 | 44 | 76 | 41 | 58 | 84 | |
| Tuberculosis, 3-year immunity, 100 times increased incidence | 49 | 87 | 92 | 66 | 80 | 89 | 70 | 65 | 58 | 53 | 57 | 58 | 71 | 59 | 59 | |
| A | B | C | D | E | F | G | H | I | J | K | L | M | N | Aggregate | ||
values are different for each individual. Person A’s values for choosing the given scenarios are completely different from person B’s value selections.
Second, the scores do not have importance relative to their size. Person K’s score of 57 for the high-risk tuberculosis scenario is not “twice as much” as K’s rating of 28 for the 3-year tuberculosis immunization, nor is person B’s rating of 87 (tuberculosis scenario with 100 times increased incidence) twice as large as B’s rating of 44 for lifetime immunity against tuberculosis.
This raises the issue of the meaning of the scale of utility in the multi-attribute utility value models. The issue, as discussed in Chapter 2, is the same as encountered when using a temperature scale such as fahrenheit or centigrade; one may be tempted to say that one temperature is “twice as warm” as another, but 20ºC is not twice as warm as 10ºC, nor is 90ºF twice as warm as 45ºF. Using the temperature analogy, the multi-attribute value function does not begin at “absolute zero,” and hence 80 is not twice as high as 40.
What do the scores mean? The most important result they offer is to provide rank orderings. Furthermore, for a given person, it is generally the case that differences in scores have meaning, so that the difference between 20 and 40 in a priority score has the same meaning as a difference between 50ºF and 70ºF. This is just the same as saying that the difference between 50ºF and 70ºF is the same as the difference between 20ºF and 40ºF—both represent a difference of 20ºF, nothing more and nothing less.
Since each rating process is unique, based on the user’s perspectives, different rankings will produce different values for users. A multinational health organization will have different weights and priorities than a minister of health or finance from a developing country. The Pan American Health Organization, for example, may choose values that lead to a rank for tuberculosis higher than for influenza, whereas a vaccine manufacturer might have different weights, thus producing different rankings. Similarly, a basic research institution such as the National Institutes of Health (NIH) may have different priorities than a private company. A manufacturer is likely to be interested in return on investment and securing a market for its product, therefore assigning different values than an NIH official who may be interested in scientific advancement that may also apply to other vaccines. The flexibility to accommodate multiple priorities from many users is an asset, as it allows the many sectors within the vaccine enterprise to enlist in the broader discussion that is important in vaccine development and prioritization.
In short, SMART Vaccines allows users to rank attributes to reflect their value preferences. Once users have ranked the set of attributes for the
candidate vaccines under consideration and have received a priority score, they can go back and change the ranks of their original selection to see which of them affect the score the most. Users can then decide to retain or modify their rank order.
Software development: Operational features of SMART Vaccines Beta
This section of the report presents screenshots of SMART Vaccines Beta to illustrate its current features. The intention is to provide readers with an understanding of the conceptual flow of the model in a software platform, the data needs of the program, and the current user interface and navigation, which has potential for further improvement. SMART Vaccines Beta was developed using three software tools: MATLAB for algorithm development and testing, JAVA Servlets for the middleware, and Axure for visual prototyping and interface development. The preliminary database was managed using Microsoft SQL Server.
In its current version SMART Vaccines Beta has a six-step process for producing a value score for vaccine candidates. All the data and the results shown in the screenshots are hypothetical and should not be interpreted as any form of endorsement by the committee or the Institute of Medicine.
Figure 3-4 shows the disclaimer page (Step 0) of the software, which requires the user’s agreement to the terms. All of a user’s work can be saved for future use and modified and re-saved to allow variants in baseline data conditions. User accounts with password protection are possible options.
The values page (Figure 3-5) introduces the user to the overall program structure and navigation. Every page has a similar panel of six tabs at the top (with this page having “Values” highlighted). Typically users will move sequentially through these tabs. Every page the user visits will have, in the upper right corner, a pop-up window for a glossary of terms and instructions. The advanced mode (presented in all the screenshots) allows the user to enter data in order to consider attributes beyond health and economic factors. The basic mode, by contrast, has options relating only to health and economic attributes in case the user has a predetermined attribute (say,
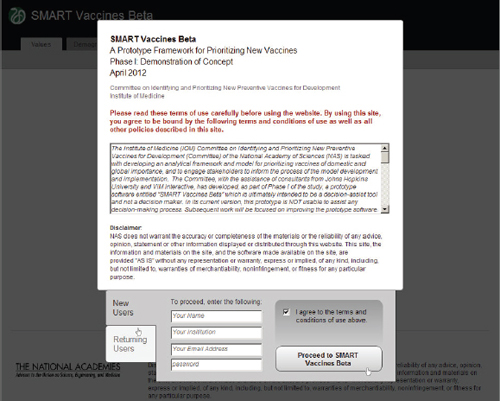
FIGURE 3-4 Terms of agreement page for SMART Vaccines Beta showing options for users to create accounts.
premature deaths averted) in mind on which to base the ranking of his or her set of vaccine candidates.
Step 1 in the process has the user specify the attributes of importance toward the ultimate ranking of candidate vaccines. This feature, wholly novel to the SMART Vaccines approach, makes it possible for users not only to specify which attributes of candidate vaccines are important but also to move them around in rank order. All of this occurs with a drag-and-drop feature, using a pointing device to highlight and drag individual items, including shifting them around in sequence. Users can later alter the list and the ranking of attributes and see immediately what effect this has on final value score.
Attributes fall into eight different categories, and users can select from as many categories as they wish and—in all but a few cases—select multiple attributes from each category. In order to avoid double-counting, the software does not permit the use of highly similar attributes, so, for example, the user must choose either QALYs or DALYs for ranking, and
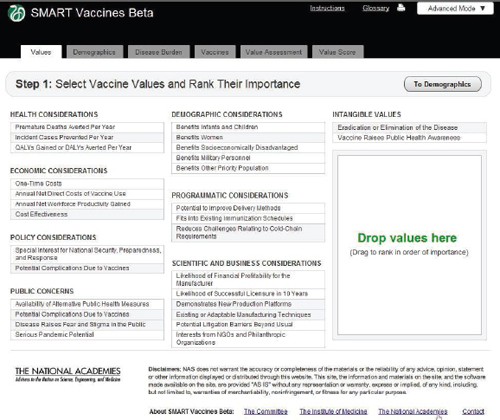
FIGURE 3-5 The SMART Vaccines Beta Values screen allows the user to specify the attributes of importance toward the ranking of candidate vaccines.
the appropriate cost-effectiveness criterion will automatically be used to coincide with the choice of QALYs or DALYs.
SMART Vaccines Beta converts the rank order of attributes selected in the drag-and-drop box into numerical weights to be used in the multi-attribute value model. Chapter 2 described this process and provides references to justify this approach. Later versions of SMART Vaccines should be able to incorporate the direct entry of value weights by the user.
Figure 3-6 shows the demographics screen in which the user enters population data. The user can either pull up pre-specified populations (such as those of the United States or South Africa in the lower left panel) or begin with a blank template and fill in data for an entirely new population. The
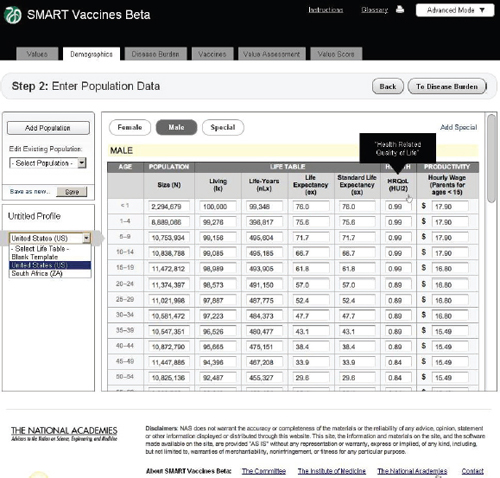
FIGURE 3-6 The SMART Vaccines Beta Demographics screen allows the user to specify the population (by age and sex) to be used for ranking candidate vaccines.
software requires complete templates for males and females, provided in 5-year age intervals for adults and more refined for children. While the data demands in this step seem considerable, the data can be readily imported from available databases at the World Health Organization for most populations around the world.
Average wage rates for children and adolescents are assigned based on the parents’ wage rates, on the logic that a sick child will divert a parent from his or her normal productive activity. Market wage rates are used as a proxy for the value of people who may be in nontraditional settings, such as stay-at-home parents. The scroll bar on the right side of the screen
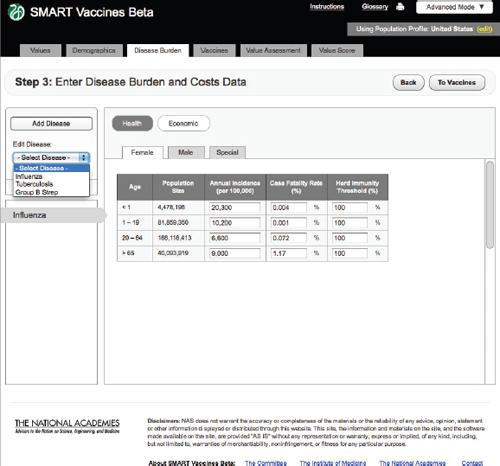
FIGURE 3-7
The SMART Vaccines Beta Disease Burden (health) screen allows the user to enter incidence and case fatality rates for the particular disease.
takes the user to population age groups above those shown (e.g., ages 65 and older).
Step 3 takes the reader into the specification of disease burden (Figure 3-7). Unlike Steps 1 and 2, Step 3 must be filled out separately for each disease that might be prevented by a candidate vaccine (e.g., influenza, tuberculosis, or group B streptococcus), and, as shown below, subsequent screens apply to each candidate vaccine, and there may be more than one candidate vaccine per disease.
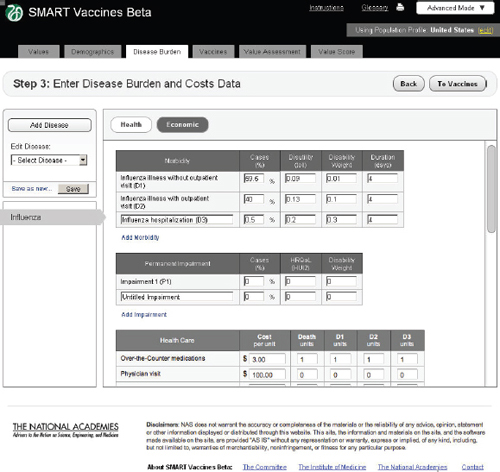
FIGURE 3-8
The SMART Vaccines Beta Disease Burden (economic) screen allows the user to enter morbidity scenarios and associated quality-of-life score values.
Health
SMART Vaccines Beta automatically fills in the population size in each relevant population group from data shown at Step 2, so the user must fill in population-specific information about the annual disease incidence per 100,000 persons in each age group, the case-fatality proportion, and the herd immunity threshold.
The herd immunity threshold provides a simple way to specify whether there is any meaningful herd immunity effect from the vaccine. Some diseases have no person-to-person transmission (e.g., tetanus), in which case the herd immunity level should be set at 100 percent (that is, 100 percent of the population must be vaccinated to achieve 100 percent
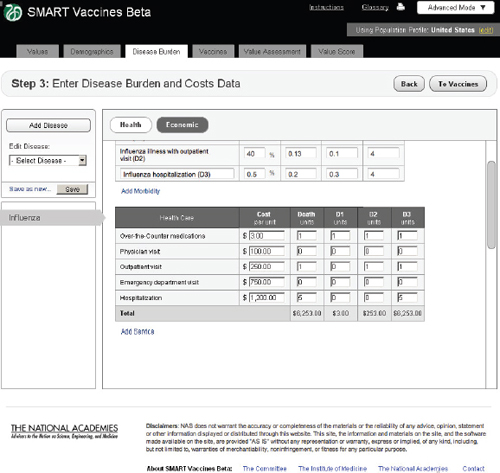
FIGURE 3-9 The SMART Vaccines Beta Disease Burden (economic) screen allows the user to enter health care costs and economic implications for the disease.
immunity). With transmissible diseases such as influenza, one could set the herd immunity threshold at, say, 80 percent, indicating that once 80 percent of the population has achieved immunity, the remaining population gain protection through herd immunity. This is, of course, a highly simplified treatment of the complex dynamics of herd immunity. Later versions of SMART Vaccines will be able to accommodate more sophisticated dynamic models of herd immunity.
Future versions will also be able to allow the user to specify more finely grained populations for the disease burden. This version uses only four categories—infants, children, adults, and adults over 65—to minimize
data-entry burdens. Ultimately the age categories in Step 3 will be able to take on the same level of refinement as the population data in Step 2.
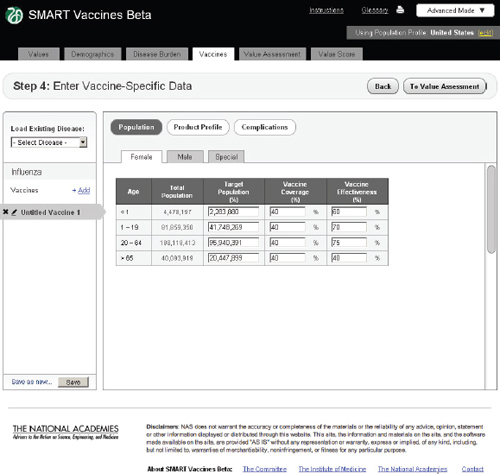
FIGURE 3-10
The SMART Vaccines Beta Vaccines (population) screen allows the user to estimate coverage and effectiveness of a vaccine candidate in a target population.
This step also allows for definition of special populations—perhaps those infected by HIV or some other special group, although use of the “special population” tab requires that equivalent numbers of people be removed from the female and male populations to keep population totals accurate.
Economic
In the Economic tab of Step 3 (Figure 3-8), users specify typical treatment patterns for each disease in question and the costs of each type of treat-
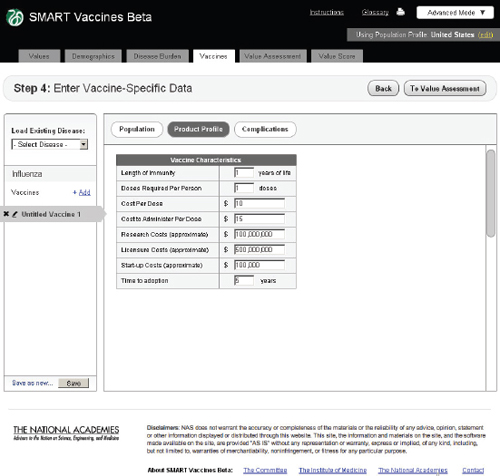
FIGURE 3-11
The SMART Vaccines Beta Vaccines (product profile) screen asks the user to enter vaccine coverage characteristics such as length of immunity, research, licensure, and start-up costs.
ment. These data serve as the basis for calculating the medical costs saved through prevention. This step also requires that users specify the disutility toll for each disease for this specific population (used in the calculation of QALYs) and the disability weight (used in the calculation of DALYs). Disutility tolls are available for some populations through household survey and related studies. DALY disability weights are normally drawn from expert opinion, and typically users find related DALY weights in publications from the developers of the DALYs approach.
In this example screen (influenza in the United States), the user has specified that 59.5 percent of those infected do not visit a doctor, 40 percent have an outpatient visit, and 0.5 percent are hospitalized, but none have permanent impairment. Other diseases would obviously have different patterns. The user may specify additional categories of morbidity or
impairment as appropriate for each disease. These categories of morbidity are combined with the cost of each type of treatment (see bottom of Step 3 screen) to estimate the costs of treating unprevented disease. Figure 3-9 shows the lower half of this screen, using the scroll bar on the right side of the screen. This feature is common to most pages of SMART Vaccines.
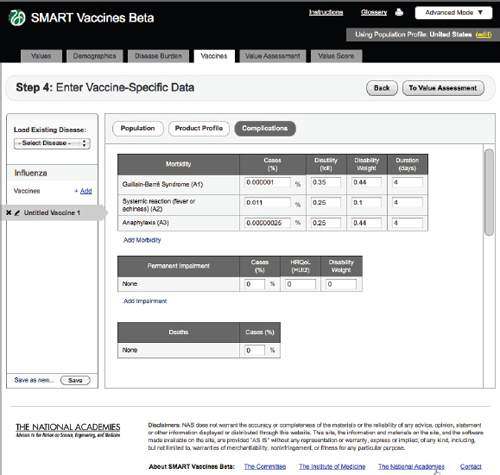
FIGURE 3-12
The SMART Vaccines Beta Vaccines (complications) screen asks the user to enter information relating to expected vaccine-induced complications, permanent impairments, and deaths.
Population
In Step 4 users enter vaccine-specific data (Figure 3-10). Each potential disease under consideration (in this example, influenza, tuberculosis, or
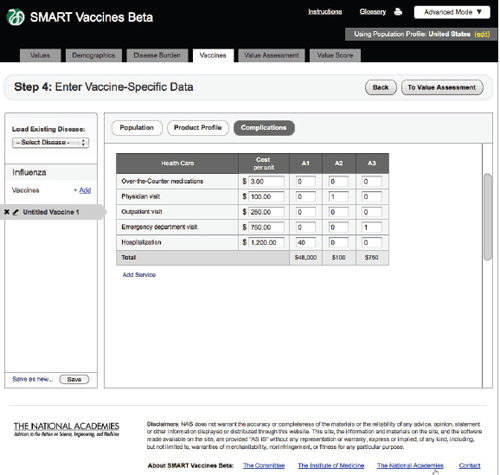
FIGURE 3-13
The SMART Vaccines Beta vaccines (complications) screen further asks the user to enter estimated costs associated with vaccine-related complications.
group B streptococcus) might have multiple vaccine candidates. Users can build up the data for a single vaccine, save it (e.g., as “TB Vaccine A”), modify the input data to reflect another candidate vaccine’s characteristics, and save it as another vaccine (e.g., “TB Vaccine B”).
As with the disease burden data, these data currently have only four age groups but will be expandable in future versions. Here, the user specifies age-specific vaccine coverage (the percent of the population receiving the vaccine) and effectiveness (among those being vaccinated). SMART Vaccines Beta automatically fills in the population numbers for each age group. These data show, for example, that the user expects 40 percent of
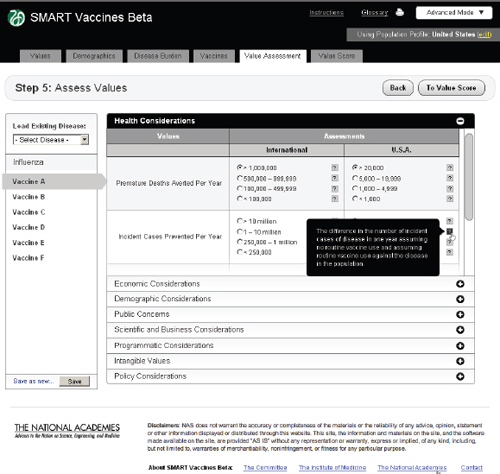
FIGURE 3-14
The SMART Vaccines Beta Value Assessment page allows the user to enter information in eight categories, from health to policy considerations. Each category on this page expands and collapses like an accordion menu.
adults to be vaccinated with a 75 percent effectiveness so that 30 percent of the adult population becomes immune.
Product Profile
In this step the user specifies the potential attributes of a specific vaccine (Figure 3-11). Of course, these are not known with certainty before actual development, so users must use expert opinion to conjecture about the candidate vaccines. These attributes are central to the issues of vaccine prioritization because they include basic aspects of the vaccine (e.g., how many doses and costs per dose to purchase and administer), research and development costs, licensing costs, and expected time to adoption. The
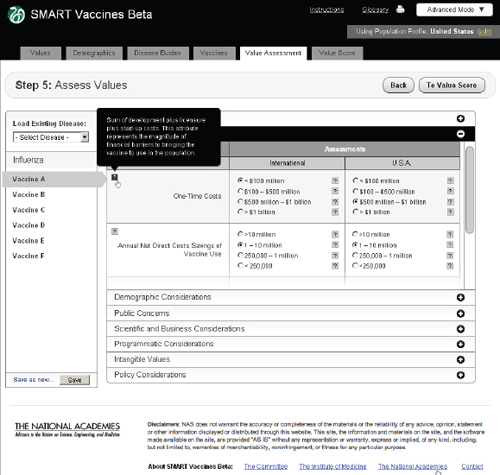
FIGURE 3-15
The SMART Vaccines Beta Value Assessment page showing economic entries from the user with pop-up help menus containing definitions of terms.
user can subsequently change these product profile attributes and see (on a concurrent view of Step 6) how the computed attributes and the priority score have changed. This gives an “on the fly” capability to see how these attributes affect rankings and their computed components, and it allows users to consider trade-offs between attributes as they focus product development efforts—for example, choosing larger research and development costs but reducing the costs to administer by removing cold-chain requirements or product shelf-space demands.
Complications
Step 4 also includes an entry screen for potential complications that a new vaccine may cause (Figure 3-12). These data are similar in concept to those
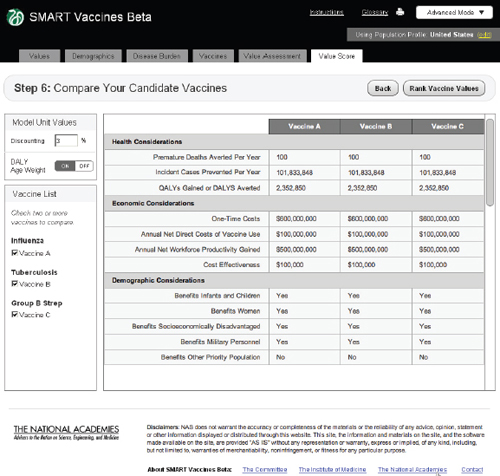
FIGURE 3-16
The SMART Vaccines Beta Value Score (dashboard screen) presents the final values for each vaccine attribute, given the information entered by the user in the earlier steps.
in Step 3 (Disease Burden), but in this case they refer to complications of a candidate vaccine rather than to the consequences of unprevented disease. Users need to specify each possible complication and all associated data. Since these complications are unknown until a vaccine is fully field tested (or used widely so as to detect rare complications), users will necessarily draw on expert opinion and work by analogy from vaccines with similar characteristics (e.g., live or inactivated virus or types of adjuvants). Figure 3-13 shows the bottom of the Complication page using the scroll bar at the screen’s right side.
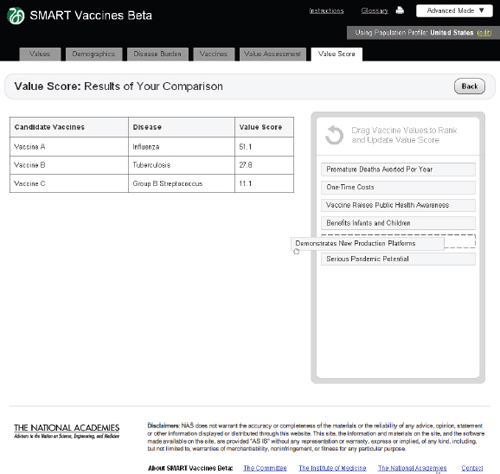
FIGURE 3-17
The SMART Vaccines Beta Value Score screen shows a side-by-side comparison of all vaccine candidates. The top priority areas selected by the user are presented in the Drag Vaccine Values to Rank box for reference to enable re-ranking if necessary.
Step 5 asks users to enter qualitative information about each vaccine. These come in eight categories, as previously shown in Table 2-1. Each one of these categories opens up like an accordion menu to show all of the qualitative attributes associated with any vaccine, whereupon the user checks the appropriate category for each attribute. Each category has a pop-up bubble associated with it to describe to the user the committee’s intent or definition regarding a particular categorical choice for each attribute (each indicated by a symbol). The user need not fill out these data queries if the attributes in question have not been selected in the value choices (Step 1). Figure 3-14 shows this step with the Health Considerations bar opened up,
and Figure 3-15 shows the same step with the Economic Considerations bar opened up.
Step 6: Value Assessment and Score
The screen at Step 6 shows values for all of the calculated attributes for each vaccine under consideration (Figure 3-16). This provides a single “dashboard” point that shows what all of the previous data entries lead to in calculated attributes. For example, Premature Deaths Averted per Year uses data on population size by age, disease incidence by age, vaccination rate by age, vaccine efficacy rate by age, and the case mortality rate to compute the number of premature deaths averted per year. A similar computation creates the Incident Cases Prevented per Year. Calculation of QALYs gained and DALYs averted also include information (entered at Step 2) regarding disease burden.
As noted before, users may select either DALY or QALY measures, but not both. If a user selects the DALY measure, he or she has the option (at the upper left of the Step 6 screen) to use or avoid the associated age-weights. The calculated illustrative value scores are shown in Figure 3-17.
In this phase, the committee was unable to explicitly model issues relating to uncertainty in SMART Vaccines Beta. In Phase II the committee will consider various elements of uncertainty to be included in SMART Vaccines 1.0. Sources of uncertainty and how they affect SMART Vaccines are briefly discussed, along with some possible methods to address these issues in Phase II.
Uncertainty About the Likelihood of Successful Licensure
SMART Vaccines Beta includes one uncertainty component but instead of listing it as a probability the committee characterized it as a value attribute: “Likelihood of Successful Licensure in 10 Years” under “Scientific and Business Considerations” (Table 2-1). The uncertainty related to the time the vaccine may become available for public use affects judgments about priority.
Otherwise, some possible ways to address the issue of uncertainty include programming the uncertainty component into the computational submodel as a delay between “now”—the time when the priorities are being set—and the time when the health benefits due to vaccination might
be expected to accrue, and the time when net costs begin to include the vaccination costs.
Earlier, in the 2000 report, each vaccine candidate under consideration was assigned to one of three development intervals: 3 years, 7 years, or 15 years. An additional 5-year post-licensure delay was assumed before the vaccine was actually made available for public use. The vaccine candidates in this study were assigned to the respective development intervals based on the 2000 “committee’s assessment of the current state of the vaccine’s development” (IOM, 2000). Once the interval was assigned, no further consideration of uncertainty was made. Costs and benefits were discounted in accordance to the chosen time intervals.
SMART Vaccines Beta addresses this uncertainty in a different way consistent with the programming resources available in this phase of the study. The computational submodel computes the health benefit and economic consequences on an annual basis as if the vaccine is presently available. The committee added the attribute “Likelihood of Successful Licensure in 10 Years” to reflect the increase in value of a vaccine that may be developed in the near future versus sometime in the distant future. This attribute requires a subjective assessment by users in the same manner as the 2000 report’s subjective assignment of the development interval.
In SMART Vaccines Beta, users are asked to assess the state of the science and market to support the development and licensure of the new vaccine candidate according to a five-point Likert scale (1 reflecting “almost certainly will be licensed within 10 years”; 5 reflecting “almost certainly will not be licensed within 10 years”). This attribute increases the overall priority score of the vaccine as a function of higher likelihood of licensure. The committee determined that 10 years was a reasonable limit for the purpose of modeling.
Another possible way to implement this concept as an attribute would be a direct assessment of expected time to vaccine licensure and availability, but this would then not include a sense of uncertainty around this assessment. The effect of using such an attribute in the value submodel is functionally equivalent to including a direct estimate in the computational submodel—vaccine candidates that are expected to be licensed sooner will receive higher scores and those not expected to be licensed soon will receive lower scores when everything else is equal.
There are advantages to embedding this uncertainty component in the value submodel. Typically, users think about vaccine benefits and costs as if the vaccine were available, not as if they were discounted to the future. If the time to availability were embedded in the computational submodel, the definitions of certain attributes relating to the benefits and costs must be changed. The user entries would then need to be averaged out as a func-
tion of the subjective distribution of the estimated licensure time supplied by the users. Although economists are used to thinking in terms of discounted quantities, the average user may not be.
There are also possible disadvantages to this approach. Because users may not appreciate the exponential effect of discounting benefits delayed to the future, they may underweight the value attribute relating to the likelihood of successful licensure in 10 years. The committee discussed making selection of this particular attribute mandatory among the 29 attributes in part to reflect the concern about underweighting. In Phase II, the committee will revisit how to better represent this uncertainty component in SMART Vaccines 1.0.
Manning and colleagues (1996) identify three sources of uncertainty in cost-effectiveness models (that otherwise affect any computational model such as SMART Vaccines): (1) parameter uncertainty; (2) model structure uncertainty; and (3) model process uncertainty.
Parameter Uncertainty
The computational submodel in SMART Vaccines Beta, although simplistic in its current form, is a function of many parameters: population modeling, estimates of health burden and benefits, and estimates of health care costs. Each of these parameters has components of uncertainty surrounding it.
The current model does not incorporate uncertainty about these parameters in its computations. The most straightforward method to do so would be to specify a distribution surrounding each parameter and then use Monte Carlo simulation to sample from the distributions and compute results for each sample. Then a distribution for each of the computational outputs could be built, and these, in turn, could be used to determine an overall distribution on the priority score.
The committee elected not to do this for SMART Vaccines Beta due to two concerns. The first relates to the source of the distributions for input parameters. Some parameters may affect all vaccine candidates, such as population life tables, while others are specific to an attribute or a vaccine candidate. It is well known that life tables are built from population sample data and thus have uncertainty concerning every age-specific mortality rate or life expectancy. Whether these uncertainties should be incorporated in the computational submodel is an open question; many models such as these take population and life-table values as “given” without incorporating any uncertainty surrounding them. In any case, with additional effort, these uncertainties could be represented in the computational submodel.
More concerning are uncertainties about health-related quality of life tolls and disability weights for various disease states. These are, in part, based on data and expert opinion. The disability weights used in DALY models are also, in part, based on expert opinion while disutility weight for QALY models can also use results elicited from studies of relevant populations. In the case of low-income countries, the committee anticipates that only sparse data, at best, will assist users in specifying disutilities or (even more challenging) the distributions around them. Additional uncertainty relates to the economic estimates in SMART Vaccines Beta. These too will come from combinations of sparse data and expert opinion.
Incorporating uncertainty about these parameters requires a separate module within SMART Vaccines that is able to elicit subjective distributions for each parameter—a task that the committee will consider in Phase II. The committee can, however, envision what this module may incorporate. It is unlikely that parameters will be estimated from data because most users will not have access to primary data needed for statistical estimation of parameters and their distributions.
Instead, the committee may use a subjective estimation approach similar to a Bayesian estimation to elicit distribution. In Phase II, the committee expects to identify a distribution for each parameter. For example, if the parameter is a probability, then a statistical beta distribution may be employed to describe uncertainty about it. Costs may be better described by a distribution bounded below by zero and having a tail to the right. Health utility tolls are bounded and might well be described by statistical beta distributions.
Credible interval estimation (used in conjunction with direct estimation of means in some cases), specifying equivalent data samples (used in specifying beta distributions) is one way to describe uncertain quantities in the computational submodel. Other parameters in the model whose uncertainty may be best addressed with sensitivity analysis include vaccine effectiveness and the duration of immunity.
Computation of outputs which are functions of uncertain inputs can be accomplished either by Monte Carlo simulation, or using Markov Chain Monte Carlo simulation to build a pseudo-distribution for the outputs if simple independent sampling of parameters is not realistic within the computational submodel. The committee intends to consider these challenges in the Phase II effort.
Another challenge is to determine the rank order distributions for vaccine candidates. Perhaps this would require a secondary Monte Carlo sampling module within SMART Vaccines where the distribution for each of the n vaccine candidates is input to this module and the output is
n distributions over position in the rank order for each of the candidates. Because these distributions may involve codependency of some candidates on uncertainties about certain diseases and assumptions about health utility tolls and costs, the output may not be just a simple independent sampling of priority score distributions. Obviously this is a complicated task that the committee will consider in Phase II.
Model Uncertainty
Manning and colleagues (1996) also identify model uncertainty as uncertainty about whether the computational model itself is an adequate representation of the process that is being investigated. In regards to SMART Vaccines Beta, this uncertainty concerns whether the structure of the computational submodel is adequate. There are only two approaches to incorporating this uncertainty: one is sensitivity analysis where model structure is varied, and the other is to construct a set of alternative models and then to make some weighted combination of them. Either of these is beyond the scope of Phase I or Phase II work of the committee.
Model Process Uncertainty
This final source of uncertainty stems from the fact that SMART Vaccines Beta was constructed by a particular committee tackling a prioritization exercise. If a different set of individuals were to do the same task under the same constraints, the model that would result would differ and could well arrive at somewhat different results.
Manning and colleagues (1996) have called for research concerning model process uncertainty to be a priority for further research. The National Cancer Institute has used the multiple modeling team approach to study simulation models of various cancers (e.g., Berry et al., 2005). They found different modeling approaches lead to results that were quantitatively distinct but qualitatively similar. Similar multiple model approaches are used in climate forecasting (Knutti et al., 2010). The multi-groups or multi-models approach is very expensive and time consuming.
The committee judged the consideration of both the model uncertainty and model process uncertainty to be far beyond the scope of either Phase I or II development of SMART Vaccines.
Current capability for sensitivity analysis
SMART Vaccines Beta has the capability to permit variations in attributes to observe the consequences in the final utility score. This sensitivity analysis can be conducted manually in the current version, and indeed, differ-
ent versions of a single vaccine candidate (with different attributes) can be saved and then compared directly one against another as well as with competing vaccines.
For example, suppose a new vaccine against tuberculosis with some predefined set of attributes is entered by a user as TB Vaccine 1. The multi-attribute utility model will create a value score for this vaccine, and the user can save this specific vaccine as one among many.
Now let the user alter one or more of the attributes for the same tuberculosis vaccine and save the results as TB Vaccine 2. This can be compared against TB Vaccine 1 and other versions. This process thereby allows the user a choice among alternative intensities and distributions if necessary data have been provided by the user.
Phase II enhancements could incorporate, for example, “tornado diagrams” showing how much each candidate vaccine’s score changes in response to, say, a doubling or halving of each attribute’s value. These diagrams give an immediate visual representation of the extent to which the outcomes strongly depend on the value of inputs. The committee will also consider the possibilities to expand and automate the sensitivity analyses in Phase II.
Following the development of SMART Vaccines Beta, a concept evaluation session was organized to obtain feedback from potential users. Each of the 11 consultant evaluators participated in a webinar led by a committee member and staff; four similar webinars were held, with two to four evaluators participating in each session. The evaluators were asked to provide feedback regarding the basic concept, software design, technical features, potential applications, and audiences. In general, the overall concept of SMART Vaccines Beta was received positively, even enthusiastically, with the exception of one evaluator who shared concerns regarding the basis and extension of the work. Many of the features of SMART Vaccines Beta have already been updated in response to the comments from concept evaluators. More important, many features have the potential to be upgraded in Phase II of this study.
The committee’s observations and views on the next steps in the enhancement of SMART Vaccines Beta are presented in Chapter 4.


