
Suggested Citation:"Appendix I: Plots of Relative Differences, 2005-2009 ACS Estimates and 2007 Expected Estimates of the Group Quarters Population in Selected Counties by Region." National Research Council. 2012. Small Populations, Large Effects: Improving the Measurement of the Group Quarters Population in the American Community Survey. Washington, DC: The National Academies Press. doi: 10.17226/13387.
×
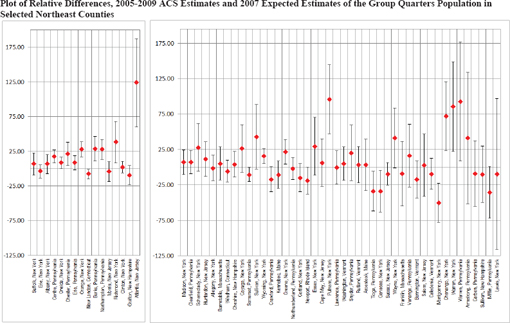
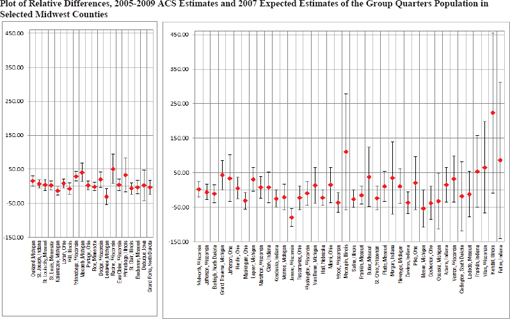
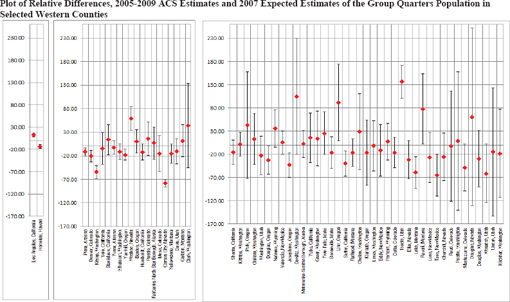
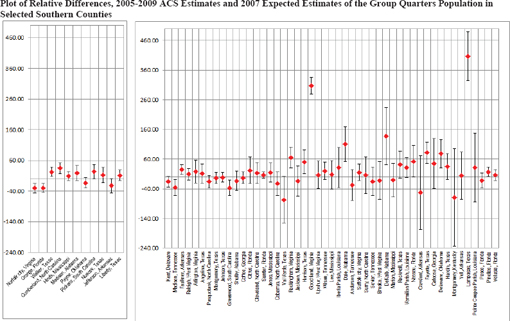
NOTE: Relative differences are defined as 100*(ACS–Interpolated estimate/Interpolated estimate).
SOURCE: Plots generated by the panel based on data available from U.S. Census Bureau. Available: http://factfinder2.census.gov/faces/nav/jsf/pages/index.xhtml.
Suggested Citation:"Appendix I: Plots of Relative Differences, 2005-2009 ACS Estimates and 2007 Expected Estimates of the Group Quarters Population in Selected Counties by Region." National Research Council. 2012. Small Populations, Large Effects: Improving the Measurement of the Group Quarters Population in the American Community Survey. Washington, DC: The National Academies Press. doi: 10.17226/13387.
×
This page intentionally left blank.
Suggested Citation:"Appendix I: Plots of Relative Differences, 2005-2009 ACS Estimates and 2007 Expected Estimates of the Group Quarters Population in Selected Counties by Region." National Research Council. 2012. Small Populations, Large Effects: Improving the Measurement of the Group Quarters Population in the American Community Survey. Washington, DC: The National Academies Press. doi: 10.17226/13387.
×

