


Below is the uncorrected machine-read text of this chapter, intended to provide our own search engines and external engines with highly rich, chapter-representative searchable text of each book. Because it is UNCORRECTED material, please consider the following text as a useful but insufficient proxy for the authoritative book pages.
PREPUBLICATION COPYâUNCORRECTED PROOFS 3 Research Opportunities in the Demography of Aging Melissa Hardy and Vegard Skirbekk INTRODUCTION Population aging has provoked a combination of acceptance and alarm as policy makers search for a reasonable set of programmatic adjustments that will address both constrained national budgets and the limited means of individuals and families to manage the risks of old age on their own. In the 1960s, the major demographic concern was overpopulation and the need to reduce fertility rates (Ehrlich, 1968). Initiatives to encourage zero population growth and replacement rate fertility coincided with the development of family planning programs, improved options for birth control, and the milestones in the womenâs rights movement. The longer term consequences of fewer births were magnified by unanticipated reductions in mortality at older ages, and as fertility rates continued to fall and life expectancy increase, populations grew older. The dilemma facing developed countries that relatively high and growing proportions now have relatively high proportions of older people will not be an easy one to resolve: How can the worldâs largest economies continue to offer their citizens a high quality of life when projections suggest many will experience a shrinking labor force, sluggish rates of economic growth, and an increasing proportion of national spending encumbered by health care and wage replacement commitments made to a segment of the population that continues to grow larger and live longer? For the developing world, the challenge of accommodating a rapidly increasing proportion of older people can be complicated by a combination of high levels of poverty, weak infrastructure, corruption, hunger, infectious diseases, poor sanitation, limited job opportunities, or illiteracy. The demography of aging is generally associated with a set of population statistics that emphasize the compositional changes associated with the first demographic transition, a theoretical model proposed to account for the observed declines in both birth and death rates as countries shift from agricultural to industrial economies (Davis, 1945;Thompson, 1929). The squaring of the age pyramid, increasing life expectancy, rising ratios of the older to the working- age population, and declines in total fertility rates have become common statistical referents in the media. These demographic developments coincided with changes in the gendered life course and gender roles, an expanding base of scientific knowledge, and a growing role for government in promoting public welfare. How these processes are connected in terms of cause and effect remains a point of debate. What seems clear, however, is that fundamental demographic processes such as birth and death, biological processes such as maturation and senescence, social processes such as family formation and the division of labor, and economic processes such as employment and investment are all intertwined. Change that occurs in any one process can ripple through other domains in both expected and unexpected ways. The ambiguity in interpreting
PREPUBLICATION COPYâUNCORRECTED PROOFS these standard aging measures significantly undermines their utility for social policy and program development. The macro-patterns of fertility or mortality rates result from the aggregation of births and deaths within a specific time interval. Each birth and death marks an individual transition preceded by a sequence of earlier behaviors, exposures, and social interactions. The macro-level characteristics that predict lower or higher rates for national populations are unlikely to explain the individual or subgroup behaviors that result in more or fewer children and in younger or older ages of death. Addressing within- and between-population heterogeneity in behaviors, states, and traits relative to the broader framework of compositional differences and changing societal processes defines a research program that connects formal and social demography to the dynamics of aging and social change. The contributions of demography within this broad research agenda can occur at multiple levels. Formal demography can provide projections based on population processes that assist planners in designing and funding policies that smooth the transitions. Social demography can provide a better understanding of the underlying behavioral patterns and micro-processes that translate into these macro-patterns. But perhaps the greatest contribution will be for demographers to begin to identify the translational mechanisms that connect the macro to the micro, the interrelated processes that operate at the individual, group, and societal levels. A GLOBAL PERSPECTIVE Recently, the global nature of population aging has come into sharper focus. As populations grow older, demographers are expanding their research into the processes and consequences of aging. The types of societal changes that coincided withâsome say fueledâthe decline in total fertility rates were not occurring in the developing world. Therefore, population growth continued unevenly through the higher fertility in the developing world, but also through the lowered later life mortality rates in developed countries. National populations became distinguished by geometric shapeâpyramids versus rectangles. Compared to most other developed countries, the United States is in a more favorable position. For example, although the total fertility rates in places such as Canada, China, the United Kingdom, Europe, Russia, and Japan have fallen below replacement rates, the U.S. fertility rate continues to hover close to 2. The list of the 25 oldest countries (measured by the proportion of people aged 65-plus) is topped by Japan, Italy, Germany, Greece, and Sweden; the United States does not make the list. Additional demographic features that distinguish the United States from many other developed countries include a high level of immigration (which led to increases in the number of working- aged adults as well as the total fertility rate); continuing growth in the overall population as well as in the working-aged population (a trend that is expected to continue past mid-century); relatively high rates of labor force participation for those 65 and older; and a rising average age of retirement (although a relatively recent reversal of the post-war decline in retirement age). In many developing countries, public health campaigns, which were often targeted at stemming the AIDS epidemic, discouraged unprotected sex and encouraged the empowerment of women. Imported medical technology, vaccines, antibiotics, and the like increased the odds of surviving to adulthood as fertility rates began to decline in some developing countries. At the same time, the gains in life expectancy at birth have been unequally distributed across richer and poorer regions (see Figure 3-1). As can be seen, from Figure 3-1, the changes that occurred in 3-2
PREPUBLICATION COPYâUNCORRECTED PROOFS mortality rates followed a very different tempo across countries. The approximate doubling of life expectancies at birth that occurred over approximately 150 years in many European countries took roughly half that time in countries such as Vietnam or Guatemala. The speed of change has given them less time to adjust their fertility to a preferred number of surviving offspring, to prepare for the impact of rapid population growth, or to prepare for the relatively rapid increase in population aging taking place in these countries. One consequence of these trends is that the proportion of young children in the global population will be surpassed by the proportion of people age 65 and older within the next decade. These population dynamics have resulted in a faster rate of aging among developing countries than was experienced by countries now counted among the oldest. Because of various international programs, the social dynamics of aging in developing countries are influenced by the interventions of other nations. As in the developed countries, the prevalence of chronic disease in the developing world is rising. At the same time, however, developing countries must also deal with the relatively high incidence of infectious diseases, inadequate access to drinking water, poor sanitation, a shortage of health professionals and medicines, rudimentary shelters, and rising population density. The developing world is also experiencing rapid urbanization without the infrastructure necessary to deal with the growing population, in general, and the growing urban population, in particular. China and India have the largest numbers of people aged 65 and older, and although the United States, Japan, Germany, Italy and France are among the top 10 countries with the largest older populations, Brazil, Pakistan, Mexico, Thailand, Bangladesh, Vietnam, and Nigeria are also in the top 25 (U.S. Census Bureau, International Data Base1). The median age in Brazil is expected to increase from the current 29 to 41 by 2040, in South Africa from 24 to 32, and in Pakistan from 21 to 32. The time frame necessary for significant growth in the proportion of people age 65 and older is also more compact in developing countries. For example, those 65- plus were 7 percent of the U.S. population in 1944 and will be 14 percent by 2013. Brazil has just reached the 7 percent mark, but will have 14 percent by 2032, a doubling within 21 years compared to 69 in the United States (U.S. Census Bureau, International Data Base). That the rate of change in population aging is much more rapid for developing countries than countries that have already completed the first demographic transition may not be surprising since the proportions of elderly in developing countries is now relatively small. Much of Sub-Saharan Africa, for example, will continue to have single-digit proportions of people aged 65 and older decades into the future; however by 2040, 76 percent of the worldâs 65 and older population will live in developing countries (Kinsella, 2000). Although the proportions of older people in the population will be higher in developed countries, their absolute numbers will be swamped by the elderly living in the developing world. The scope of research into the demography of aging has expanded not only because populations in both developed and developing countries are getting older, but also because population aging is not occurring in isolation. Changes in family structure and living arrangements, in the accumulation and transmission of capital (human, social, and financial), and in work and retirement are changing the organization of the life course. In addition, trends in the basic population processes of fertility, mortality, and migration are transforming populations at different rates within different social, political, and economic contexts. Although statistics show 1 http://www.census.gov/population/international/data/idb/informationGateway.php Accessed July 27, 2012. 3-3
PREPUBLICATION COPYâUNCORRECTED PROOFS evidence that population aging is a global phenomenon, the underlying processes behind increased survival and longer lives, the quality of life, the sources of social support, and the integration versus marginalization of older people are likely to vary considerably across time and place. The conceptual framework of the first demographic transition aptly describes the trajectories of a subset of countries that are advanced industrial democracies. Those countries led the world in developing greater economic capacity, extensive systems of education, publicly funded research programs, rapid and reliable systems of communication and information technology, and improved standards of living, which has included much improved odds of survival to old age and longer lives. Should it be assumed that developing countries will evolve in similar fashion? To what extent are patterns of aging and adult development conditioned on the level of societal development? These are some of the questions the ânewâ demography of aging will try to answer. But in formulating answers, demography will need to work at disciplinary intersections with the social, computational, and life sciences. The micro-processes behind the behaviors of social actors who interact in and with physical, social, and temporal contexts somehow translate into the macro-processes that operate at a different scale and pattern of complexity. In recent decades, demographers operating at both the societal and individual levels have begun to look for mechanisms that connect the two. These attempts rely on broadly interdisciplinary research designs that embrace the heterogeneity of the aging process. Building a better understanding of how biological and social processes interact within complex systems presents a challenge to the conventional boundaries that have defined disciplines. But it is in the rethinking of conventional approaches that space for innovation is created. In this chapter, we describe what we consider to be three promising areas of research in the demography of aging: biodemography, the changing life course, and simulations and projections. Each one can generate many research questions at different levels of social organization, and each one requires a different set of collaborations. We rely on some common themes in discussing these areas. We emphasize the importance of studying cohorts and generations to better understand the underlying social processes. Both approaches classify people relative to historical time and provide some comparability in exposure to trends or events, but they differ significantly in the level and type of connectivity. Cohorts link people largely unknown to each other whose experiences of aging are similarly framed by history and cultural context. Generations link people through a common lineage and shared social and physical environments, although family members of the same generation often are born in different years. We stress the power of quantitative analysis techniques, large national samples, and innovative measurement. We believe in the importance of comparative research and the need to study aging at different levels of economic development and in different cultural contexts, which may require initial qualitative investigations to better understand these contexts. The emphasis on the comparative study of people born at different times, in different places, and in different social circumstances underscores the need for creative measurement and data collection strategies that allow such comparisons. 3-4
PREPUBLICATION COPYâUNCORRECTED PROOFS COHORTS, GENERATIONS, AND THE LIFE COURSE Three temporal concepts play a central role in demographic research by providing different ways to organize interrelated behaviors and linked lives. At the population level, fertility and mortality combine to define a metabolic process through which populations expand, contract, and age. People born in the same time and place enter the population at once and create sequential developmental pathways into adulthood, while at the same time, people born at earlier times are moving into senescence and death. Research on the connection between the regular replacement of âolderâ cohorts by ânewerâ cohorts and social change contributed to the development of the life course perspective, which links life experiences to broader societal features. Mannheim (1952) wrote of generations; Ryderâs essay (1965) shifted the focus to birth cohorts; Cain (1964) and then Elder (1975) demonstrated how cohort similarities in the timing of major life transitions were shaped by social structure. All three conceptsâgeneration, cohort, and life courseâare useful for understanding the social production and transformation of populations. Cohorts introduce the temporal connection between life stage and historical time under the argument that external events will impact people in different ways depending on their developmental stage (the timing of exposure). Compositional differences in cohorts can be created by internal or external processes: Whereas changing fertility rates can produce larger or smaller cohorts as a reflection of shifts in reproductive choices, a health event that significantly reduced the likelihood of reproduction would also result in smaller cohorts despite individual preferences. The process of cohort formation and replacement is continuous, although characteristics across cohorts can display discontinuities. Even so, compositional differences among cohorts that signal a trend toward or away from a behavioral pattern will seldom occur in only one birth year. More often, cohort-specific proportions will illustrate rates of change over some time span. Examination of individual choices in cohort-specific samples may characterize leaders (for example, women who used birth control pills as soon as they were available) or laggards in the process under study. Whereas birth cohorts organize regional populations relative to historical exposure, generations perform a similar function in families. Alterations in the generational structure of families reflect the transformation of societyâs age structure and typical family size. For example, with increasing longevity and fewer children per household, a âlongerâ multi- generational family structure replaces a âwiderâ generational structure. On the other hand, as family dissolution and reformation patterns become more complex, so does generational structure, with several sets of grandparents and step-grandparents, parents and step-parents, and the like. The span of a cohort is determined by some accounting conventionâone-year birth cohorts, five-year birth cohortsâwhereas the temporal span of a generation is modified by delays in the age at first birth. As age of first child is delayed, generations become longer (Goldstein, Lutz, and Scherbov, 2003). Later-born cohorts inherit the institutional arrangements put in place by earlier cohortsâperiods of stability or volatility, opportunities and constraints, levels of resources, degrees of distributional inequality, possibilities and capabilities (Sen, 2007). In an analogous way, parents and grandparents endow their offspring with genetic, human, social, and financial capital; intergenerational transfers can provide resilience in difficult times; and economic inequality can be reproduced through the intergenerational transmission of wealth 3-5
PREPUBLICATION COPYâUNCORRECTED PROOFS and resources. Finally, the life course describes the typical nature, timing, and sequencing of transitions from one status to another (e.g., single to married), from a period of dependence to independence (moving from parental to oneâs own household), and from one stage to another (schooling to employment) (Billari and Liefbroer, 2007; Hogan and Astone, 1986). The life course experienced by the parent generation often varies from that of both their parents and their children, and siblings may differ in their attempts to reproduce or deviate from family patterns. Newer cohorts may change the nature, the timing, and the sequencing of life transitions. Further, cohort differences can be apparent in âtypicalâ timings and sequences as well as in the shape of distributions in which the âtypicalâ is embedded. PROMISING AREAS The three promising areas for the new demography of aging we discuss below include: (1) biodemography and the study of micro-processes that attempts to link cells and physiological systems (through genetics, biology and biochemistry) to cohorts and populations using the individual (and individual behaviors, dispositions, and attitudes) as the nexus; (2) the demography of the family, systems of stratification and inequality, and gender, which includes the study of social change in the life course and explores the intersections of changing behavioral patterns and variability in individual trajectories within changing environments and disparate circumstances using the cohorts and generations as the organizing concepts; and (3) the development of new approaches to projections and simulations that attempt to translate the changing composition of successive cohorts and the changing micro-processes that transform successive cohorts into macro-level features and population characteristics. Starting Small: Biodemography, Chronological Age, Health, and Disability Understanding the aging process requires learning more about health and mortality and the connection between the two. Although it is tempting to assume that a population queue can somehow formâespecially of those in old ageâfrom good to poorest health and expect that those in the poorest health will be first to die, the association between health and mortality is not that simple. Further, how increased longevity has changed the overall health distribution of the older population remains a point of debate. In living longer lives, population health trajectories can be reorganized in a number of possible ways (Crimmins et al., 2009; Zeng and Crimmins, 2006). People can enjoy more years of good health and a delayed onset of illness or disability; can experience the same number of years of good health and a longer period illness and disability; can spend the same proportion of their life span in good health, which thereafter declines until death; or can alternate between intermittent spells of health, illness, and recovery, with peaks and valleys becoming more or less pronounced over time. Researchers have demonstrated that as life expectancy has increased, the fatal impact of a number of diseases has been reduced. Have these changes made the population healthier or less healthy? How and why do health trajectories differ across time and space, among people with the same diagnosed conditions, between men and women or among people of different races? While good health is being reported at older ages, recovery from health setbacks is occurring at older ages, and more people are surviving to old age and living longer lifetimes, a clear explanation of the mechanisms that have produced these successes remains elusive. One goal is to construct profiles of health 3-6
PREPUBLICATION COPYâUNCORRECTED PROOFS risks, illness trajectories, the combinations of conditions that are amendable to intervention, and the types of interventions with the greatest probability of success. Achieving that goal requires finding a balance between the individual-level details and definable risk groups. This task will be difficult to accomplish without knowledge of the contingencies of social and biochemical responses, genetic and environmental factors, and gene-environment interactionsâa task that cannot be reasonably tackled by any single discipline, but one that does require a methodological approach that translates conclusions into a broader population profile. When comparing the demographic profiles of nations, measures such as median age, percent of the population age 65 (or 85) and older, and average life expectancy are reported. Chronological age seems a straightforward measure to calculate. But for countries without systematic registries of births and deaths, measuring even age can be a challenge. In making geographic or temporal comparisons or in establishing trends or regional differences, estimates can be generated to document how populations have aged over time or how different regions of the world are aging at different rates. However, expected increases in the number or proportion of people in older age groups provide an incomplete and potentially misleading picture, since the societal implications of population aging are often framed relative to functionality, health care needs, medical expenses, disability, retirement income, and the like. In creating rules of eligibility for social programs, societies have relied on age as a quick and easily implemented criterion, but chronological age masks considerable population heterogeneity in capabilities. The standard indicators of population aging mean little if the content of those chronologically based measures, the health and functional status associated with any given age range, changes over time and place. The need for standardization in other measures is recognized when making comparisons across time and place. For example, in reporting the number of U.S. households with income less than $20,000 per year by decade, there is quick recognition of the need to adjust for inflation (to compare ârealâ versus ânominalâ dollars); for different tax rates and social welfare benefits (since states or years with higher tax rates would yield lower after-tax income while more generous in-kind benefits or subsidies would improve living standards, though these effects would likely influence different portions of the income distribution in different ways ); perhaps for differences in purchasing power (the cost of living is higher in California than Arkansas); or even household (or family) size (to adjust for how many adults and children the income must support). But speaking of population aging generally makes no comparable adjustments. Are median chronological age and the proportion of people age 65 and older the best measures for the questions asked? As life expectancy increased, researchers began to focus not only on the number of years, but also on the quality of life in the latter stages of the life span. Increased longevity could imply a prolonged period of decline, or the longer time span could be accompanied by a delay in the onset of health limitations. Policy makersâ concerns about population aging were grounded in the historical connection between age, labor force withdrawal, and the onset of disability. But, if people were living longer lives, perhaps they were also living more years in good health, with the onset of disabling conditions being pushed to older and older ages. Assessing age structures within the context of health and independent living required some adjustment to measurement. Various indicators with different sorts of data demands have been proposed for comparisons across nations as well as across subpopulations within nations. Many are based on making adjustments to overall life expectancy to produce health expectancy, where âhealthâ is defined in different ways. This family of measures can adjust for the disablement process, 3-7
PREPUBLICATION COPYâUNCORRECTED PROOFS chronic morbidity, functional limitations, difficulties performing activities of daily living, physical dependency, and cognitive functioning (Molla, Wagerner, and Madans, 2001). Active life expectancy cordoned off years of functional ability, using activities of daily living to accomplish the segmentation (Katz et al., 1983; Laditka and Wolf, 1998). Disability-free life expectancy, disability-adjusted life expectancy, years of life lost to premature mortality, and years of life lived with disabling conditions offer summary measures of the âburdenâ of disability and mortality (Mathers, Lopez, and Murray, 2006; Murray and Lopez, 1997a,b). Another approach is to compare the ages associated with a specific survival time, thereby contextualizing chronological age relative to longevity (Lutz, Sanderson, and Scherbov, 2008). Because policy entitlement is often defined by age, and demographic estimates (and projections) are used to prepare budgets and to forecast program costs in the future, chronological age distributions matter. But if the goal is to estimate how demand for long-term care may change over the next 30 years, a measure that is more informative and better incorporates related processes, such as the development of disabling health conditions or the decline in cognitive functioning, is preferable. The measure should not only take into account likely changes in the compositional characteristics of the elderly over the next 30 years, but also allow for judging the level of uncertainty associated with these predictions. Differences in life expectancy are one aspect of within-country inequality that also change across time. Race and ethnicity, education, and income are among the factors that structure mortality rates. For example, during the latter part of the 20th century, education-related gaps in mortality rates grew substantially, particularly in the last decade (Cutler et al., 2010). Relative access to medical technology, vulnerability to infectious diseases, and public health investments in preventative care also can create longevity gaps within as well as between countries. Therefore, variation in life expectancy within national populations but across subgroups can be as important a feature as average longevity for nations as a whole. Measuring Health Better conceptualizations of health must precede the development of better measurement of health. Self-reported health (an ordinal measure of perceived health status), disability status (reporting a health condition that prevents working, being entitled to disability benefits, or being unable to perform certain activities), health limitations (reporting a health condition that limits the kind of amount of work one can do), number of ADLs (self-reported limitation in ability to perform basic activities or an external assessment of whether someone needs help in performing these activities), chronic disease (reporting a disease diagnosis, entry on a medical record of a diagnosis, or experiencing symptoms associated with a disease), and comorbidity (reports of more than one chronic disease) are common measures. These measures better address the consequences of poor healthâon any given day, a person may feel âfairâ rather than âexcellent,â can no longer do certain tasks, or been diagnosed with certain illnesses or syndromesârather than the underlying processes that create these health-related problems. They most often rely on thresholds (which vary), ordinal categories or counts (which produce limited variability), and respondent reports (which are subject to error and varying levels of sensitivity and frames of reference). Comparisons based on these measures often have an uncomfortable amount of ambiguity in interpretation. For example, what one person defines as âgoodâ health may be deemed âexcellentâ health by another; how people make those distinctions may differ by cohort, by culture, and by the information they have from various medical tests and family histories. A 3-8
PREPUBLICATION COPYâUNCORRECTED PROOFS particular configuration of blood biomarkers that had been viewed as non-problematic 20 years ago may now trigger a diagnosis of early-stage disease or high risk of developing that disease, the same disease may produce symptoms or influence overall health differently across people, and counts of chronic diseases mask variability in severity of disease. Further, the connection between pathology and how societies sort people relative to levels of disablement may also be changing (Freedman, 2008). How are the trajectories of disease pathology, disablement, and mental health interrelated, and what are the key inflection points that effective interventions might target? In projecting the age and sex composition of future populations, the populations at risk and their mortality hazards are recognized as heterogeneous. The trends in age at death may vary across these subgroups. Projections that cannot incorporate information on both changing composition and different social processes across cohorts and across regions may create a false sense of stability or crisis. Cohort-specific health trajectories that incorporate multiple measures may allow a better sense of interrelated processes, such as the interplay between biological and behavioral processes that damage health or facilitate resilience, repair, or recovery and how these processes are influenced by differential exposure to positive or negative social or physical environments, advancements in medical treatment or adaptive technologies, or increases in social support and interaction. Approaching health measurement with biological data has linked demography with biology, medicine, biochemistry, and genetics. Assaying levels of various hormones, markers of inflammation, the presence of specific alleles, and the like have linked the collection of biologically enhanced survey data to the routine blood work ordered by physicians for diagnostic purposes. Rather than analyzing them on a case-by-case basis, however, their use in national samples provides another method for assessing risk factors in the population. Connecting biomarker profiles to risks of death or illness or more complex health trajectories requires an understanding of the mechanisms that link the two, as well as a formulation of how other personal characteristics or exposures may moderate these relationships. Heterogeneity of Risk Demographers have identified a number of factors predictive of health risk, such as gender, race, marital status, level of education, and socioeconomic status. Associated with many of these factors are âpuzzlesâ or âparadoxes.â For example, although men appear healthier and less prone to chronic disease, women survive longer, but the reasons why are not fully understood (Luy, 2009). Married people tend to be in better health, but this marriage benefit is stronger for men than it is for women; although selection into marriage may be part of the story and the quality of the marriage also plays a role, the underlying mechanisms continue to be debated. If the benefit to women is economic, will an increase in gender parity in earnings reduce this effect? If the benefit to men is carried through womenâs caring activities, will parity in gender roles eliminate this gap? And as marriage rates decline, will health in old age decline as well? In the United States, African American men have the shortest life expectancy among various demographic groups, but can this longevity gap be attributed to lifestyle and socioeconomic status (SES), or is the story more complicated? Without a better understanding of mechanisms, these questions have no answers. Studies of health have tended to focus on different life stagesâinfancy, childhood, adolescence, young adulthood, midlife, and old age. Studies of health in older age have 3-9
PREPUBLICATION COPYâUNCORRECTED PROOFS emphasized conditions associated with the major causes of death or a need for long-term care, such as stroke, cardiovascular disease, dementia, or Alzheimerâs. Some explanations for increased life expectancy point to advances in early childhood health for part of the story. Vaccinations against common childhood diseases and better treatment for infections may have reduced levels of inflammation at younger ages. Combined with improvements in nutrition, these factors may have been important in reducing health risks at older ages (Crimmins and Finch, 2006). However, since mortality and late-life health research is necessarily cohort-specific, and the cohorts studied were born and came of age as medical technology was being transformed, the variability and correlates of exposures, medical treatments, and prophylaxis also may have been reconfigured. Certain risk factors can be reduced through healthy behaviors and lifestyle changes, although adopting and maintaining these changes has proven difficult. Both gender and education have been linked to health behaviors, with women and those with more education more likely to make healthy choices. While access to quality health care, nutritional foods, social support, and healthy behaviors may be reducing health risks across cohorts, the amount of stress that people routinely manage as more responsibilities fall into their laps may be working in the opposite direction. All of these observations point to possible connections between larger environments, cognitive styles, physiological reactions, coping techniques, and other types of resources on which people may draw. Understanding health trajectories will require identifying the complex connections among these dispersed but interrelated processes. The Changing Life Course: Family, Socioeconomic Status, and Inequality The processes of fertility and mortality jointly create a population metabolism through cohort succession. Cohort differences in the life course have been a strong focus of demographic research, which has documented changes in educational attainment, delay in entry into full-time employment, the early- and mid-20th century decline and late-20th century increases in average retirement age, changes in family structure and family formation, and changes in home ownership, household income, debts, and assets. Pension wealth (the expected value of future benefits from defined benefit and defined contribution plans) has become a standard component of any financial profile and, as in other sources of income or wealth, provides a clear advantage for married couples versus singles, whites versus nonwhites, the more educated versus less educated, and men relative to women. Individuals and families are expected to absorb more of the risks of economic downturns, the need for expensive health care, and the financing of retirement, leading some to observe that the era of early retirement has passed. What these trends will mean for the process of aging is difficult to predict. Both family and education are regarded as core institutions by the social sciences. The family household is viewed as the basic unit of consumption, decision making, socialization, and social cohesion. Education serves as a primary element of socioeconomic status, the key to upward mobility, entry into a favorable career, and the ability to master the technology necessary to navigate an increasingly complex environment. Both have been linked to improvements in health and the standard of living at the societal level and to better health and a higher standard of living at the individual and household levels. Exactly what roles do they play in shaping the underlying processes that drive health maintenance, survival, and longevity? 3-10
PREPUBLICATION COPYâUNCORRECTED PROOFS Education Cohort and generational differences in educational attainment reflect the adoption of compulsory schooling and the elaboration of systems of public education. At the individual level, those with more schooling enjoy a competitive advantage in launching and sustaining stable and rewarding careers, higher levels of compensation and accumulated wealth, and longer and healthier lives. At the same time, more highly educated regions attract business and industry, and more highly educated countries boast higher levels of worker productivity, higher standards of living, and healthier populations along with lower total fertility rates, longer life expectancy, and a national infrastructure to promote social welfare. Expanding educational opportunities was a primary goal of the 20th century and was seen as the pathway to a better and more fulfilling life. Persistent inequities by gender and race were often discounted on the basis of differences in education and experience, which were proposed as the âtrueâ sources of the inequality. Gender and race differences in these qualifications provided a partial explanation for the disparities in the types of jobs and levels of compensation. The historical educational advantage of men relative to women, however, is disappearing. Among recent cohorts, the proportion of U.S. women with at least a high school education now exceeds that of men (KC et al., 2010). Societal trends toward more highly educated populations and the expected growth in the proportion of educated women are expected to continue. Educating women in the developing world is a major initiative in slowing population growth, since more educated women not only desire fewer children, but are better able to realize their fertility aspirations by having fewer children than less educated women. Research on women in Africa also points to the importance of empowering women to make decisions about their own lives. The social and political environment that values education, improves womenâs rights, promotes the importance of schooling for girls, and expands employment opportunities for women may also be the environment that encourages a reduction in family size and the utilization of contraception at the discretion of women rather than men. Countries with more educated populations also boast more productive workers, and the higher rates of productivity have been attributed to the enhanced skillsâboth general and job- specificâlearned by those with more schooling. Recent research has demonstrated that cognitive ability also predicts worker productivity better than any other observed personal characteristic (Neisser 1997; Schmidt and Hunter 2004; Spitz-Oener 2006), a relationship that is found in both high- and low-income countries (Behrman, Ross, and Sabot, 2008; Tansel, 1994). In place of using life expectancy to adjust indicators of population aging (Lutz et al., 2008), the old age dependency ratio could also be adjusted for cognitive functioning (Skirbekk, Loichinger and Weber, 2012). Countries with more educated populations also demonstrate higher levels of cognitive functioning among those aged 50 to 85, using immediate recall of ten words as the cognitive measure. Comparing Figure 3-2 with Figure 3-3, the ordering of countries is similar. Northern and Central Europe and the United States have more than 90 percent of their populations completing lower secondary education or more, with rates above 70 percent even at older ages. Southern Europe, China, and Mexico show sharp educational differences between their older and younger cohorts, with the majority of younger cohorts completing lower secondary schooling, but completion rates less than 30 percent at older ages. Word recall is also highest in Northern and Central Europe and the United States. For example, a 53-year-old respondent in Mexico functions at the same level as a 78-year-old in the United States, on 3-11
PREPUBLICATION COPYâUNCORRECTED PROOFS average (Skirbekk, Loichinger, and Weber, 2012). Research has linked variation in cognition at older ages to a range of factors including education and literacy, nutrition, vaccinations, and physical and mental activity levels, which can provide at least part of the explanation for why seniors perform poorer in some countries relative to others (Kagitcibasi and Biricik, 2011; Khaleefaa, Abdelwahidb, and Addulradic, 2008; te Nijenhuis et al., 2011). In addition, better cognitive performance has been attributed to occupational complexity, increased mental activity, and increased synaptic density resulting from increased mental stimulation. Cohort differences in cognitive ability at younger ages had been documented for those born in the first half of the 20th century (Flynn, 1987; Tuddenham, 1948). The process of cohort replacement will gradually supplant earlier-born cohorts with later-born, more highly functioning cohorts, and if the trend toward improved cognitive functioning continues, so will this replacement process. Given the positive correlation between education, health, and longevity, substantial improvement in life expectancy and in cognitive and physical health might be expected as these better educated cohorts move into old age. Although education has clearly operated as a primary sorting mechanism in developed countries, the cause-and-effect connections between socioeconomic status, genetic traits, cognitive performance, and later life outcomes remain unclear. Sociologists have long recognized the interplay of status and early cognitive development in these dynamics, but the nature and persistence of that interplay remains a point of disagreement. Variants of the status attainment literature emphasize the importance of family background (and the transmission of advantage or disadvantage), quality of school, capabilities, habits, dispositions, social connections, orientation toward the future, and health in placing and sustaining people on certain pathways. Parents were responsible for successfully launching their children into adulthood, but the nature and timing of this function has also been changing. On the one hand, some researchers argue that the importance of school placement and social connections has been moved earlier and earlier in the childâs life (a âwinner take all societyâ). On the other hand, the age at which children shift to a status of independence from their parents seems to be getting older, as more adult children move back in with parents, rely on parental help with finances and childcare, and struggle to gain stability in their lives. This extended period of parenting (and grandparenting) fundamentally redefines family dynamics, and it has been proposed as an explanation as to why the human lifespan extends so far beyond the end of reproduction (Lee, 2008). Socioeconomic differences in educational attainment have been demonstrated repeatedly throughout the developed world (Shavit and Blossfield, 1993), and the likelihood of completing a given level of education and advancing to the next favors the more affluent. Status differences are observable not only in the level of performance, but also in the types of choices made by people whose performance is the same (Boudon 1974; Erikson et al., 2005; Marks, 2005). Why choices differâwhether or how status difference shape aspirationsâmoves the question to an earlier stage. If societies benefit most when those with the best performance and the highest aptitude fully develop their potential, then the inequality embedded in this process diminishes the social benefits of the outcome. Do societies want capable people to eschew higher education because such aspirations seem too lofty given their background? Family Declining fertility rates and increased longevity have reshaped family structure for recent cohorts, but family dynamics have also changed, and the implications of these changes for how 3-12
PREPUBLICATION COPYâUNCORRECTED PROOFS future cohorts will experience aging are unclear. Younger cohorts are marrying at later ages, often after a period of cohabitation, having children later in life, and relying more on reproductive technologies to conceive (Waite, 2005). The proportion of people ever having experienced a divorce has increased as people spend more years of their lives outside of marriage or in sequential marriages. Various dimensions of these patterns are being studied as definitions of family, marriage (or partnering), gender roles, and patterns of intergenerational exchange evolve. These cohort differences have also produced family differences in intergenerational structure. The first demographic transition was characterized by increasing marriage rates, younger ages at first parenthood, and a decline in fertility outside of marriage (Lesthaeghe, 1977;Lesthaeghe and Neels, 2002). As a result, the generational structure of familiesâthrough consanguinity and affinityâwas reinforced. Each siblingâs or offspringâs marriage expanded the familial network, and the average age at which daughters had a first child established an average length of a âsocialâ generation. Family gatherings were occasions for intergenerational exchanges. In fact, families provided routine opportunities for intergenerational contacts that contrasted with the otherwise dominant pattern of age-homogeneous social networks. During recent decades, the length of a generation (the time gap between the birth of a woman and her first child) has grown wider and differences across nations have increased. Family variability in generational structure has increased in other ways as well, with step-families, more births outside of marriage, and a wider distribution of age at first birth. Relationships between children and their parents will extend further into adulthood, with the progress in media technology allowing more frequent contact. Although the emphasis has been on the caregiving role played by adult children for their elderly parents, a key aspect of the informal care that complements the long- term care industry, the flow of assistance from parents to adult children, is more substantial (Swartz, 2009). Women constitute a growing share of the U.S. labor force, as their labor force participation rates and the career aspirations of new cohorts of women have increased. Although womenâs employment and their contributions to household income have increased, the gendered household division of labor, including caring for young and elderly family members, encouraging spouses to engage in healthy behaviors, performing household chores, and managing the household has been slower to change, requiring more time from women than men. How are these family dynamics linked to the changes in family structure? Societies clearly have an interest in healthy, well-adjusted, well-educated children, stable families, reliable workers, and networks of care that allow older people to remain in their communities. At the same time, womenâs financial security has been increasingly linked to training for, building, and sustaining stable careers and reducing their dependence on their husbands. How will these increasing demands be reflected in womenâs physical and mental health trajectories and mortality rates? The health benefits of marriage, womenâs longer life expectancy, and the informal networks of family caregiving reflect the experiences of specific cohorts in specific regions of the world. The cohorts studied were fulfilling the expectations of a gendered life courseâone that differed by race/ethnicity and one that has been revised in some dramatic ways. How will these revisions reshape the health advantages or disadvantages that have been linked to gender and marital status? 3-13
PREPUBLICATION COPYâUNCORRECTED PROOFS Interrelatedness of Family and Socioeconomic Status One trade-off between social welfare programs and a reliance on market mechanisms for building financial security occurs at the intersection of cohorts and generations. Public policy can create (as in the âwindfallâ benefits for early Social Security beneficiaries) or ameliorate (as in the wage indexing of earnings histories in 1977 to standardize earnings replacement rates) inequalities across cohorts and, through tax policy, facilitate or interfere with the intergenerational transmission of wealth. At the same time, as cohorts come of age, the decisions they make combine with the societal conditions they inherit to set the circumstances later-born cohorts will face and expand or limit the degrees of freedom with which they can operate. Cohort variability exists both within and across cohorts, since populations are organized not only by age, but also by a range of other factors, some of which stratify while others simply diversify. At the macro level, changing economic circumstances can give some cohorts a relative advantage compared to cohorts born in an earlier period. For example, the periods of young adulthood and midlife for the Baby Boom cohorts coincided with a period of strong economic growth, rising standards of living, increases in real wages, and relatively strong returns on investments. In addition, after the Vietnam War, compulsory military service was eliminated for men, and access to higher education increased for men and women. In contrast, their children and grandchildren are coming of age in a period of economic uncertainty, global competition, stagnated or falling wages for much of the labor force, and less articulation between educational credentials and job opportunities. These types of inequities across cohorts have been common. Some cohorts face famines, wars, epidemics, natural disasters, depressions/recessions and the like, while more fortunate cohorts experience surplus, peace, medical breakthroughs, discovery of natural resources, and growth. One rationale for federal programs is to ameliorate the effects of the downturns, at least at a national level, but accomplishing that goal requires redistribution. When the advantaged cohorts are working-aged and the disadvantaged cohorts are older, these inter-cohort transfers can be funded from wage growth; however, when working-aged cohorts feel disadvantaged relative to the receiving cohorts and wages are stagnant, intergenerational transfers are reevaluated. Familial inheritances, growing income, wealth inequality, and the importance of endowments for sorting people onto different trajectories have received growing attention as sources of cumulative advantage over the life course. To the extent that the transmission of advantage and opportunity follows familial (or generational) lines, equality of opportunity within cohorts is called into question. The Big Picture: Forecasts, Projections, and Simulations An important role of demographic research is to provide policy makers with information about likely futures so they can anticipate the changes that may be required and (perhaps) opt for more gradual and less disruptive adjustments than would be necessary without advance notice. Absent this kind of data, policy makers remain reactive and at least one step behind where they need to be. This type of structural lag (Riley and John, 2010) may be unavoidable, since attitudes and behaviors often seem slow to change and demographic foresight does not necessarily translate into timely action. 3-14
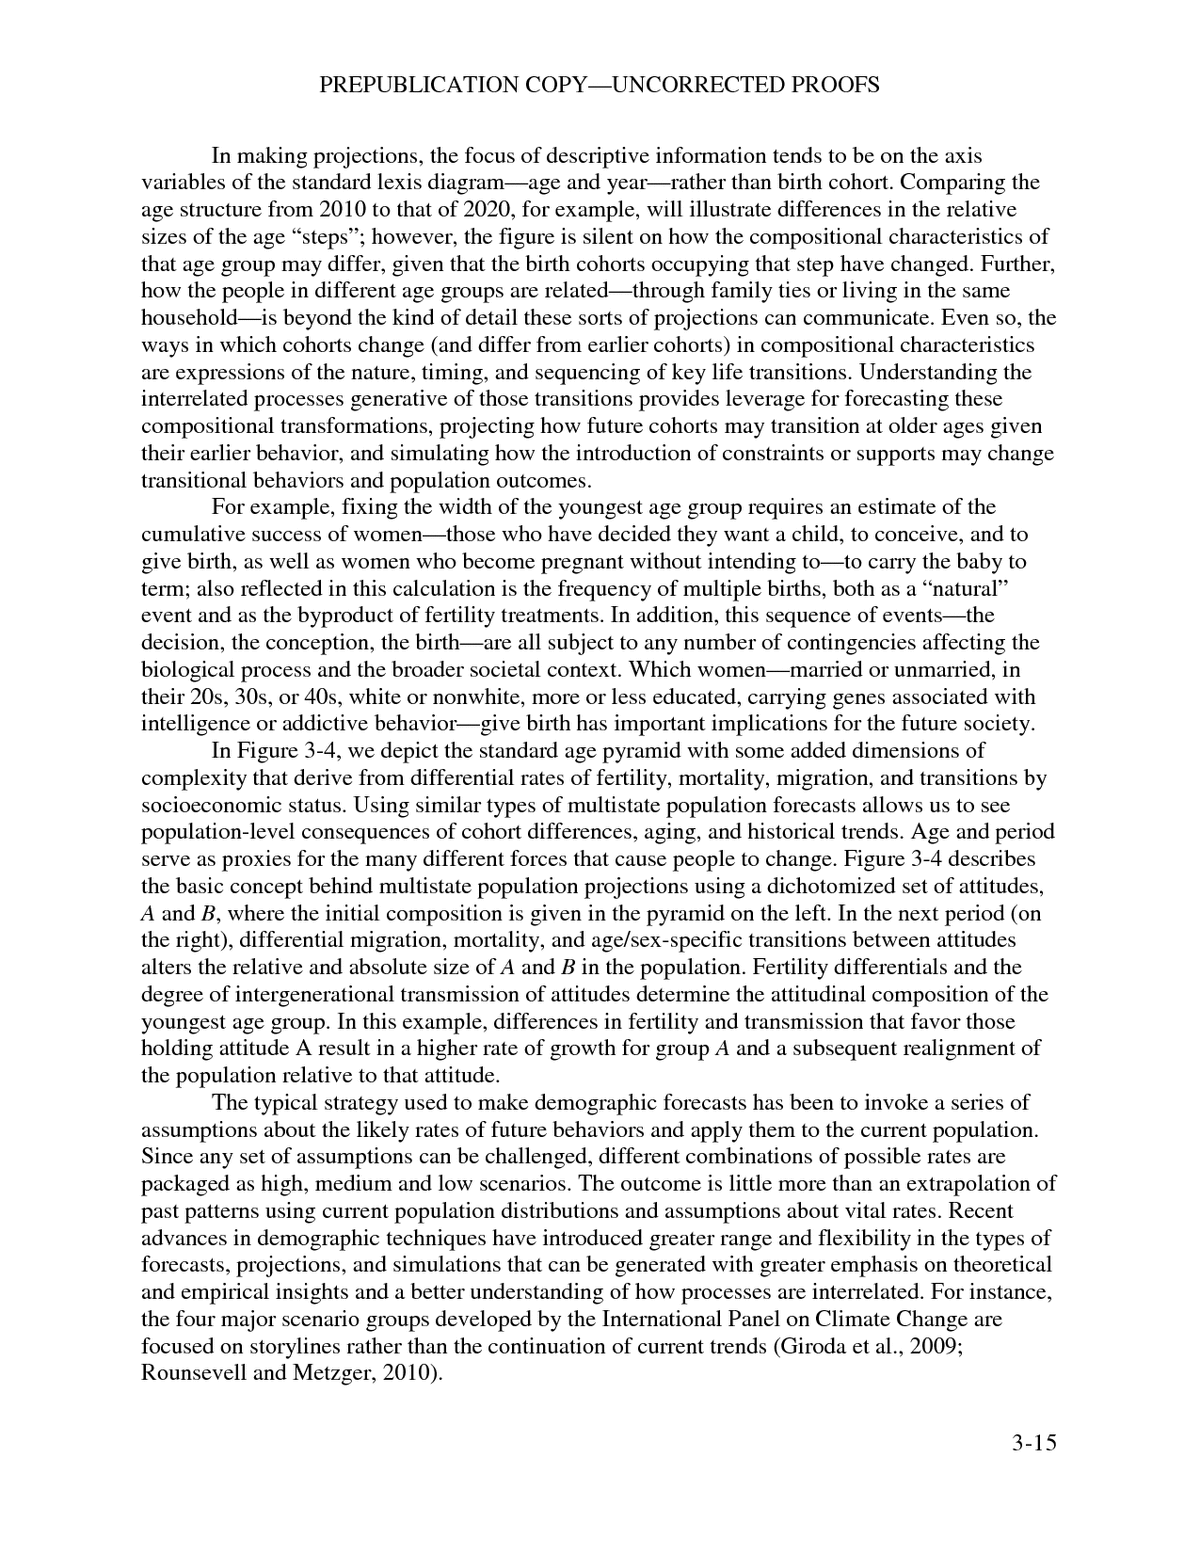
PREPUBLICATION COPYâUNCORRECTED PROOFS In making projections, the focus of descriptive information tends to be on the axis variables of the standard lexis diagramâage and yearârather than birth cohort. Comparing the age structure from 2010 to that of 2020, for example, will illustrate differences in the relative sizes of the age âstepsâ; however, the figure is silent on how the compositional characteristics of that age group may differ, given that the birth cohorts occupying that step have changed. Further, how the people in different age groups are relatedâthrough family ties or living in the same householdâis beyond the kind of detail these sorts of projections can communicate. Even so, the ways in which cohorts change (and differ from earlier cohorts) in compositional characteristics are expressions of the nature, timing, and sequencing of key life transitions. Understanding the interrelated processes generative of those transitions provides leverage for forecasting these compositional transformations, projecting how future cohorts may transition at older ages given their earlier behavior, and simulating how the introduction of constraints or supports may change transitional behaviors and population outcomes. For example, fixing the width of the youngest age group requires an estimate of the cumulative success of womenâthose who have decided they want a child, to conceive, and to give birth, as well as women who become pregnant without intending toâto carry the baby to term; also reflected in this calculation is the frequency of multiple births, both as a ânaturalâ event and as the byproduct of fertility treatments. In addition, this sequence of eventsâthe decision, the conception, the birthâare all subject to any number of contingencies affecting the biological process and the broader societal context. Which womenâmarried or unmarried, in their 20s, 30s, or 40s, white or nonwhite, more or less educated, carrying genes associated with intelligence or addictive behaviorâgive birth has important implications for the future society. In Figure 3-4, we depict the standard age pyramid with some added dimensions of complexity that derive from differential rates of fertility, mortality, migration, and transitions by socioeconomic status. Using similar types of multistate population forecasts allows us to see population-level consequences of cohort differences, aging, and historical trends. Age and period serve as proxies for the many different forces that cause people to change. Figure 3-4 describes the basic concept behind multistate population projections using a dichotomized set of attitudes, A and B, where the initial composition is given in the pyramid on the left. In the next period (on the right), differential migration, mortality, and age/sex-specific transitions between attitudes alters the relative and absolute size of A and B in the population. Fertility differentials and the degree of intergenerational transmission of attitudes determine the attitudinal composition of the youngest age group. In this example, differences in fertility and transmission that favor those holding attitude A result in a higher rate of growth for group A and a subsequent realignment of the population relative to that attitude. The typical strategy used to make demographic forecasts has been to invoke a series of assumptions about the likely rates of future behaviors and apply them to the current population. Since any set of assumptions can be challenged, different combinations of possible rates are packaged as high, medium and low scenarios. The outcome is little more than an extrapolation of past patterns using current population distributions and assumptions about vital rates. Recent advances in demographic techniques have introduced greater range and flexibility in the types of forecasts, projections, and simulations that can be generated with greater emphasis on theoretical and empirical insights and a better understanding of how processes are interrelated. For instance, the four major scenario groups developed by the International Panel on Climate Change are focused on storylines rather than the continuation of current trends (Giroda et al., 2009; Rounsevell and Metzger, 2010). 3-15
PREPUBLICATION COPYâUNCORRECTED PROOFS These developments point to three directions that hold much promise for improving the information available to policy makers and for testing various theories about the interrelated ways in which processes at various levels of aggregation operate. Extensions of the cohort component model, the linkage of projections to their level of uncertainty, and the creative use of data-based and agent-based micro-simulation models can transform the demographic approach by directly incorporating the strengths of both the social and computer sciences. Cohort Component Approaches Demographic rates vary by age, and these different rates may interact with population structure in determining the dimensions of future populations. Cohort component projection models apply age-specific rates to different birth cohorts, thereby producing an expected size, sex, and age structure for future populations. When an historic event significantly changes age- specific fertility and/or mortality rates for a segment of the population, projections should take the effects of this event into account (Schoen, 2006). Multistate extensions of the cohort component approach (Heuveline and Timberlake, 2003; Rogers, 1986; Lutz and Goujon, 2001; Schoen and Canudas-Romo, 2006) allow this elaboration by further classifying the population relative to exposure to that event. In theory, the multistate life table approach allows the joint- classification of a population across any number of useful dimensions. Not only age and sex, but also race, marital status, living arrangements, region, level of education, employment status, income, beliefs, and ideological views would provide useful detail to projections. However, as the cells multiply, so do the data demands and the difficulty in generating reliable estimates of group-specific distributions and transition rates, although work on mitigating this issue continues (e.g., Lynch and Brown, 2005). A more intractable complication stems from the processes that continue to unfold. Defining race/ethnic groups has become a much more difficult enterprise given the growth in multiracial identities and the partnering of men and women from different race/ethnic groups. In addition, characteristics such as marital status and employment are not fixed at birth and do not change on a predictable schedule. Taking these demographic factors into account requires the ability to estimate mortality rates, for example, for different marital states, but also to compute transition probabilities across marital states (e.g., from unmarried to married, married to divorced). Theoretical work must accompany these technical extensions, since the way factors such as marital status or living arrangements are introduced into calculations depends on how, why, and under what conditions they are believed to matter. An additional quandary in expanding projections to joint classification by living arrangements stems from convention of assigning households to one sex. Progress has been made on this front, as well (see e.g., Keilman, 2003; Schoen, Landale, and Daniels, 2007; Wilson and Rees, 2005). The extended cohort-component model (ECC) represents one strategy for including family structure and living arrangements in projections. Using groups of individuals as the unit of analysis, invoking assumptions of stochastic independence and limiting when some transitions can occur, using the harmonic mean to ensure consistency, and using a model standard schedule with a few âtuningâ parameters provide one framework for introducing more complexity (Zeng and Crimmins, 2006). 3-16
PREPUBLICATION COPYâUNCORRECTED PROOFS Forecasting Uncertainty Recent research that explicitly addresses uncertainty in projections adds a new dimension to this field. Standard approaches to projections incorporated uncertainty in the underlying assumptions by providing different scenarios that tended to bracket the favored prediction; however, unlike the bracketing of a confidence interval, these alternative scenarios were not associated with probability distributions. In addition, the details of the underlying assumptions were too often unsystematic and poorly documented (Booth, 2006). Weaknesses of this approach have been well documented (Bongaarts and Bulatao, 2000; Lee and Tuljapurkar, 1994). Probabilistic projections account for uncertainty in a less ambiguous way. Two approaches that are being pursued rely either on expert opinion or on the statistical analysis of historical time series data. The former combines subjective probability distributions for predictions from a field of experts to produce a set of âlikelyâ values for vital rates (Lutz et al., 1998). These expert predictions are presumably informed by past structural changes as well as expected future developments, with experts acting as a kind of filtering mechanism for many and disparate sources of information. In contrast, the time series analysis approach relies on the statistical properties of the estimators to generate probability distributions for population size or vital rates (Lee, 1998). One can also model the error structure comparing similarly generated projections for an earlier time period with observed rates. Assigning probabilities to a range of possible outcomes provides policy makers not only with possible futures, but also with the likelihoods of the alternatives. Any student of statistical inference understands the value of linking parameter estimates with error estimates. Making these calculations relies on how the sample was generated as well as variability in the distributions of interest. Providing analogous measures for projections is more complicated, however, since no observations are made beyond the present, and the further the attempt to see into the future, the more errors that were made early in the series can be compounded. Errors emanate from a variety of sources, including the unavailability or poor quality of data, the underlying models used to generate the projections, the expert judgments, and the parameter estimates themselves. Although the Frequentist perspective has been prominent in this literature, research on Bayesian approaches to probabilistic projections also holds promise. For example, Bayesian estimation has been used to project demographic components when data were sparse, as is often the case for developing countries (Alkema et al., 2008). Bayesian time series approaches using autoregressive models and parameters that allow the variance to be time-varying have also been developed (Abel et al., 2010). In general, these newer Bayesian methods attempt to address uncertainty in the model and uncertainty in the parameters; incorporate uncertainty in model choice through model averaging techniques; incorporate expert opinion through Bayesian priors; circumvent the intractability of complex integrations by generating samples from the posterior and predictive distribution using methods such as Markov Chain Monte Carlo simulations; and use these sample to construct empirical confidence intervals (Alkema et al., 2008 Bijak, 2011; Thomas and Clark, 2011). The desire to make projections more accurate often involves introducing additional complexity, which requires innovative methodologies for implementation. Multidimensional extensions of the cohort-component approach, approaches that take into account regional 3-17
PREPUBLICATION COPYâUNCORRECTED PROOFS variation, techniques that allow disaggregated rates into their components, and the ability to construct conditional projections that allow answering important âwhat ifâ questions would significantly enhance the utility of projections. However, each extension will require pushing the boundaries of the science. Simulations and Agent-Based Models As useful as accurate forecasts can be, they remain extensions of a methodology of extrapolation. Based on certain assumptions about the trends in transition rates, some idea is gained of how these processes will âplay forward.â The dynamic micro-to-macro articulation between changes in cohort composition, changes in social structure, and the nature, timing, and sequencing of transitions remains a black box. Simulation techniques can be applied to large national samples or to âmanufacturedâ data to demonstrate how social processes may unfold over time. When based on statistical models, the judicious use of counterfactuals, and Monte Carlo algorithms to adjust parameters of the time trend, simulations can extend the methodology of cohort component projections in useful directions (Raftery and Bao, 2010). Microsimulations can incorporate a larger number of covariates, interactions among covariates, and a wider range of link functions in specifying social processes and tracing their effects. Static versions of these models, which begin with baseline data and a set of accounting rules, have been eclipsed by dynamic alternatives that do a better job of incorporating time into the calculations. These data-based approaches draw heavily on techniques of event history analysis and differ in how they model transitions and whether they rely on discrete or continuous time approaches. Building these models requires a substantial initial investment, and the level of detail and reliability of the estimates depends on the quality of data used to generate the parameter estimates of the statistical models that drive them. Their strengths include a capacity to assess the effects of policy changes on both the decision-making process and on the consequences of the decisions taken; flexibility in aggregation, which makes distributional outcomes measurable; and the stochastic basis of the modeling exercise, which incorporates elements of uncertainty and precision into the results. Although they are individually based, the âactorsâ in these models do not âinteractâ in social space. Further elaboration of event history techniques, such as estimation of diffusion models or a melding of event history with network analysis, may create more flexibility; however, even those developments would not change the fundamental data-driven, equation-defined nature of these approaches. Because of their high level of detail and large number of calibrations, equations, and interactions, these models invoke âblack boxâ approaches at intervening steps, thereby exchanging an intuitive understanding of the simulated process for computational feasibility. The third wave of social simulation research is represented by agent-based models (ABMs), which provide a different strategy for modeling emergent properties of social systems (Macy and Willer, 2002). Social science has traditionally had to weight the design trade-off between experimental and survey methodologies. On the one hand, experiments carried the loss of external validity, limitations in the number of factors that could be explicitly considered at any one time, and ethical concerns for the protection of participants while they allowed manipulations, treatments, a tight focus supported by random assignment, and the assumed controls for unobserved heterogeneity it afforded. On the other hand, surveys were compromised by the selective sorting of people into social categories, participant refusals and attrition, 3-18
PREPUBLICATION COPYâUNCORRECTED PROOFS reporting error, and the inability to dismiss the confounding effects of unobserved population heterogeneity. ABMs combine advances in artificial intelligence, theories of social process and social behavior, and âagentsâ that are autonomous, interdependent, adaptive rule followers to create computerized thought experiments. Rather than emphasizing the forecasting role of microsimulations, ABMs allow a test of possible mechanisms that, through their operation in social space, produce patterns of outcomes. These models thereby provide leverage in illuminating fundamental processes, such as the emergence of social structure, unintended consequences of policy âtreatments,â or the societal ramifications of rapid technological change. By design, ABMs fit well with demographic research on the life course, since the agents in ABMs are âlocatedâ in social time and space, socially integrated through networks of interaction, capable of strategic goal-oriented actions integrated across time, and able to adapt by adjusting the timing or sequencing of key transitions, for example. Consistent with their experimental nature, ABMS are âartificialâ in design and thereby subject to questions of validity. Even so, they provide demographers with another tool to gain a better understanding of how the micro level links to the macro level in ways more complex than aggregation. CONCLUSIONS During the mid-20th century, the scientific study of aging and the aged was organized into the discipline of gerontology. Proposed as an interdisciplinary study of the experiences, characteristics, and behaviors of a marginalized subpopulation, this area of scholarship remained on the margins of traditional scientific disciplines. The interdisciplinary nature of gerontology was more a juxtaposition of the various âsystemsâ that needed to be addressed when studying aging and the elderly. Understanding the biological and psychological changes that accompanied aging allowed societies to better confront the social problems of elder poverty, unaddressed needs for long-term care, and increased vulnerability. The claim was that the biology of aging put years into lives, and the sociology of aging put life into the years. That division is not as clear-cut as previously thought. The demography of aging provides a valuable counterpoint to person-centered studies of the aging process. As more is learned about how environments shape the way people change over time, demography can contribute to an understanding of how changes in the aging process at the person-level translate into population changes in salient compositional characteristics. But as appreciation grows about the variability in the aging process across time and space, better ways to translate key dimensions of that variation to the macro-level must be developed. The traditional measures of population aging implicitly assume homogeneity in the aging process, and temporal comparisons based on these traditional measures assume that the societal implications associated with skills, abilities, functionalities, and behaviors linked to chronological age operate in the same way across time. There is ample evidence that neither of these assumptions is correct. Those over age 65 are not uniformly dependent, retired, on fixed income, or unhealthy, nor are those in their 20s uniformly independent, employed, and healthy. Nevertheless, policy discussions continue to rely on measures that have increasingly ambiguous, and arguably erroneous, interpretation. Demographic techniques of standardization, event-history analysis, cohort projections, and simulations are the foundations of quantitative techniques that will help build the bridges across levels of aggregation. But the task is about more than statistical estimators with desirable 3-19
PREPUBLICATION COPYâUNCORRECTED PROOFS properties; also central to this enterprise is the development of comparative criteria that allow us to extend our measures across time and space, across cohorts and cultures. This task requires strong conceptual grounding in cross-level linkages, careful consideration of the way these measures can be, will be, and should be used, and a sensitivity to the vectors of social change that will inevitably shift the terrain on which our measurement is based. 3-20
PREPUBLICATION COPYâUNCORRECTED PROOFS FIGURE 3-1 Gains in life expectancy for selective countries. 3-21
PREPUBLICATION COPYâUNCORRECTED PROOFS FIGURE 3-2 Population share with at least lower secondary education, 2005. 3-22
PREPUBLICATION COPYâUNCORRECTED PROOFS FIGURE 3-3 Mean age-groupâspecific immediate recall scores. NOTE: Immediate recall score (values between 0 and 1, where, e.g., a score of 0.4 means being able to recall 40% of the given words). Curves are smoothed by using spline interpolations. Logistic regression to test for significant age-related decline, significance levels P <0.001. Analysis of variance to test for differences between countries, significance levels P < 0.01. SOURCE: Skirbekk et al. (2012). Reproduced with permission. 3-23
PREPUBLICATION COPYâUNCORRECTED PROOFS FIGURE 3-4 Multistate cohort component model, stylized diagram. 3-24
PREPUBLICATION COPYâUNCORRECTED PROOFS REFERENCES Abel, G.J., Bijak, J., Forster, J., Raymer, J., and Smith, P.W.F. (2010). What do Bayesian methods offer population forecasters? Centre for Population Change Working Paper ISSN2042. Alkema, L., Raftery, A., Gerland, P., Clark, S., and Pelletier, F. (2008). Estimating the Total Fertility Rate from Multiple Imperfect Data Sources and Assessing its Uncertainty. Working paper No. 89, Center for Statistics and the Social Sciences, University of Washington. Behrman, J., Ross, R., and Sabot, D. (2008). Improving quality versus increasing the quantity of schooling: Estimates of rates of return from rural Pakistan. Journal of Development Economics, 85, 94-104. Bijak, J. (2011). Forecasting International Migration in Europe: A Bayesian View. New York: Springer Billari, F., and Liefbroer, A. (2007). Should I stay or should I go? The impact of age norms on leaving home. Demography, 44, 181-198. Billari, F., and Prskawetz, A. (2003). Agent-Based Computational Demography: Using Simulation to Improve Our Understanding of Demographic Behaviour. Heidelberg: Springer. Bongaarts, J., and Bulatao, R.A. (Eds.) (2000). Beyond Six Billion: Forecasting The Worldâs Population. Washington, DC: National Academy Press. Booth, H. (2006). Demographic forecasting: 1980 to 2005 in review. International Journal of Forecasting, 22(3), 547-581. Boudon, R. (1974). The Logic of Social Explanation. London: Penguin Cain, J.L. (1964). Life Course and Social Structure. Chicago: Rand McNally. Crimmins, E., and Finch, C. (2006). Infection, inflammation, height, and longevity. Proceedings of the National Academy of Sciences, 103, 498-503 Crimmins, E., Hayward, M., Hagedorn, A., Saito, Y., and Brouard, N. (2009). Change in disability-free life expectancy for Americans 70 years old and over. Demography, 40, 627-646. Cutler, D., Lange, F., Meara, E., Richards, S., and Ruhm, C.J. (2010). Explaining the rise in educational gradients in mortality. NBER Working Paper 15678 Danigelis, N., Hardy, M., and Cutler, S. (2007). Population aging, intracohort aging, and sociopolitical attitudes. American Sociological Review, 72, 812-830. Davis, K. (1945). The world demographic transition. Annals of the American Academy of Political and Social Science, 237. Ehrlich, P. (1968). Thinking about the Environment. New York: Library of Congress. Erikson, R., Goldthorpe, J.H., Jackson, M., Yaish, M., and D.R. Cox (2005) On class differentials in educational attainment. PNAS 102(27): 9720-9722. Elder, G. (1975). Age differentiation and the life course. Annual Review of Sociology, 1, 165- 190. Flynn, J. (1987). Massive IQ gains in 14 nations. What IQ tests really measure. Psychonomic Bulletin and Review 101, 171-191. Freedman, V., Martin, L., Schoeni, R., and Cornman, J. (2008). Declines in late-life disability: The role of early- and mid-life factors. Social Science and Medicine, 66, 1588-1602. 3-25
PREPUBLICATION COPYâUNCORRECTED PROOFS Giroda, B., Wieka, A., Mieg, H., and Hulmed, M. (2009). The evolution of the IPCC's emissions scenarios. Environmental Science and Policy, 12, 103-118. Goldstein, J., Lutz, W., and Scherbov, S. (2003). Long-term population decline in Europe: The relative importance of tempo effects and generational length. Population and Development Review, 29, 699-707. Heuveline, P., and Timberlake, J. (Eds.) (2003). Toward a Child-Centered Life Course. Hogan, D., and Astone, N. 1986. The Transition to Adulthood. Annual Review of Sociology 12, 109-130. Kagitcibasi, C., and Biricik, D. (2011). Generational gains on the Draw-a-Person IQ scores: A three-decade comparison from Turkey. Intelligence, 39, 351-356. Katz, S., Branch, L.G., Branson, M.H., Papsidero, J.A,, Beck, J.C., and Greer, D.S. (1983). Active life expectancy. New England Journal of Medicine 309(20), 1218-1224. , Barakat, B., Goujon, A., Skirbekk, V., Sanderson, W., and Lutz, W. (2010). Projection of populations by level of educational attainment, age, and sex for 120 countries for 2005- 2050. Demographic Research 22, 383-472. Keilman, N. (2003). Household sizes and biodiversity. Nature, 421. Khaleefaa, O., Abdelwahidb, S., and Abdulradic, F. (2008). The increase of intelligence in Sudan 1964-2006. Personality and Individual Differences, 45, 412-413. Kinsella, K. (2000). Demographic dimensions of global aging. Journal of Family Issues, 21, 541-558 Kinsella, K.G., and He, W. (2009). An Aging World: 2008. Washington, DC: U.S. Dept. of Commerce, Economics and Statistics Administration, U.S. Census Bureau. Laditka, S.B., and Wolf, D.A. (1998). New methods for analyzing active life expectancy. Journal of Aging Health, 1092, 214-241. Lee , R. (1998). Probabilistic approaches to population forecasting. Population and Development Review. 24 (Supplement), 156-190. Lee, R. (2008). Sociality, selection and survival: Simulated evolution of mortality with intergenerational transfers and food sharing. Proceedings of the National Academy of Sciences. Published May 5, 2008, PMCID: PCM2438215 10.1073/pnas.0710234105 (Social Sciences). Lee, R., and Tuljapurkar, S. (1994). Stochastic population projections for the United States: Beyond high, medium and low. Journal of the American Statistical Association, 89 (428), 1175-1189. Lesthaeghe, R. (1977). The decline of Belgian fertility, 1800-1970. Princeton, NJ: Princeton University Press. Lesthaeghe, R., and Neels, K. (2002). From the first to the second demographic transition: An interpretation of the spatial continuity of demographic innovation in France, Belgium and Switzerland. European Journal of Population, 18, 325-360. Lutz, W., and Goujon, A. (2001). The world's changing human capital stock: Multi-state population projections by educational attainment. Population and Development Review, 27, 323-339. Lutz, W., Kritzinger, S., and Skirbekk, V. (2007). The demography of growing European identity. Colloque international de la Section dâétudes européennes de lâAssociation française des science politique (AFSP). Grenoble: Amours et Désamours entre Européens: Pour une sociologie politique des sentiments dans lâintégration européenne. 3-26
PREPUBLICATION COPYâUNCORRECTED PROOFS Lutz, W., Sanderson, W., and Scherbov, S. (2008). The coming acceleration of global population ageing. Nature, 451, 716-719. Lutz, W., and Scherbov, S. (1998). An expert-based framework for probabilistic national population projections: the example of Austria. European Journal of Population 14: 1- 17. Luy, M. (2009). Unnatural deaths among nuns and monks: Is there a biological force behind male external cause mortality? Journal of Biosocial Science, 41, 831-844. Lynch, S., and Brown, J.S. (2005). A new approach to estimating life tables with covariates and constructing interval estiamtes of life table quantiles. Sociological Methodology 35, 177- 225. Macy, M., and Willer, R.W. (2002). From factors to actors: Computational sociology and agent- based modeling. Annual Review of Sociology, 28, 143-166. Mannheim, K. (1952). Essays on the Sociology of Knowledge. New York: Oxford University Press. Marks, G. (2005). Cross-national differences and accounting for social class inequalities in education. International Sociology, 20, 483-505. Mathers, C.D., Lopez, A.D., and Murray, C.J.L. (2006). The burden of disease and mortality by condition: Data, methods, and results for 2001. In A.D. Lopez, C.D. Mathers, M. Ezzati et al. (Eds.), Global Burden of Disease and Risk Factors (pp 45-94). Washington, DC: World Bank. Mirowsky, J., and Ross, C. 2003. Education Status and Social Health. New York: Library of Congress. Molla, M.T., Wagener, D.K., and Madans, J.H. (2001). Summary measures of population health: Methods for calculating healthy life expectancy. Healthy People Statistical Notes, No. 21. Hyattsville, MD: National Center for Health Statistics. Murray, C.J.L., and Lopez, A.D. (1997a) Regional patterns of disability-free life expectancy and disability-adjusted life expectancy: Global Burden of Disease Study. The Lancet,349(9062), 1347-1352. Murray, C.J.L., and Lopez, A.D. (1997b). Alternative projections of mortality and disability by cause 1990-2020: Global burden of Disease Study. The Lancet, 349(9064), 1498-1504. Neisser, U. (1997) Rising scores on intelligence tests. American Scientist, 85 440-447 Raftery, A., and Bao, L. (2010). Estimating and projecting trends in HIV/AIDS generalized epidemics using incremental mixture importance sampling. The International Biometric Society, 66, 1162-1173. Riley, M., and John, W. (Eds.) (2010). Society's Failure to Provide Meaningful Opportunities in Work, Family, and Leisure. Oxford: John Wiley & Sons Rogers, A. (1986). Parameterized multistate population dynamics and projections. Journal of the American Statistical Association Publication Information, 81, 48-61. Rounsevell, M., and Metzger, M. (2010). Developing qualitative scenario storylines for environmental change assessment. Wiley Interdisciplinary Reviews: Climate Change, 1, 606-619. Ryder, N. (1965). The cohort as a concept in the study of social change. American Sociological Review, 30, 843-861. Sanderson, W., and Scherbov, S. (2005a), Average remaining lifetimes can increase as human populations age. Nature, 435, 811-813. 3-27
PREPUBLICATION COPYâUNCORRECTED PROOFS Sanderson, W., and Scherbov, S. (2005b). A new perspective on population ageing. European Demographic Research Papers. Vienna: Vienna Institute of Demography, Austrian Academy of Sciences. Schoen, R. (2006). Dynamic Population Models. Dordrecht, The Netherlands: Springer. Schoen, R., and Canudas-Romo, V. (2006). Multistate cohort models with proportional transfer rates. Demography 43(3), 553-568. Schoen, R., Landale, N.S., and Daniels, K. (2007). Family transitions in young adulthood. Demography, 44(4), 807-820. Schmidt, F.L., and Hunter, J. (2004). General mental ability in the world of work: Occupational attainment and job performance. Journal of Personality and Social Psychology, 86, 162- 173. Sen, A. (2007). Population and reasoned agency: Population growth and food security. Development, 50, 98-102. Shavit, Y. and Blossfeld , H.-P. (eds) (1993) Persistent Inequality: Changing Educational Attainment in Thirteen Countries, Boulder, Westview Press. Skirbekk, V. (2008). Fertility trends by social status. Demographic Research, 18, 145-180. Skirbekk, V., Kaufmann, E., and Goujon, A. (2010). Secularism, Fundamentalism, or Catholicism? The religious composition of the United States to 2043. Journal for the Scientific Study of Religion, 49, 293-310. Skirbekk, V., Loichinger, E., and Weber, D. (2012). Variation in cognitive functioning as a refined approach to comparing aging across countries. Proceedings of the National Academy of Sciences, 109, 770-774. Spitz-Oener , A. (2006) Technical change, job tasks and rising educational demands: looking outside the wage structure. Journal of Labor Economics, 24(2) 235-270. Swartz, T.T. (2009). Intergenerational family relations in adulthood: Patterns, variations, and implications in the contemporary United States. Annual Review of Sociology 35, 191-212. Tansel, A.E.E.R. (1994.) Wage employment, earnings and returns to schooling for men and women in Turkey. Economics of Education Review 13, 305-320. te Nijenhuis, J. C., Cho, S., Murphy, R., and Lee, K. (2011). The Flynn effect in Korea: Large gains. Personality and Individual Differences 53(2), 147-151. Thomas, J. and S. J. Clark (2011). More on the cohort-component model of population projection in the context of HIV/AIDS: A Leslie matrix representation and new estimates. Demographic Research, 25: 39-102. Thompson, W. (1929). Population. American Journal of Sociology, 6, 959-975. Tuddenham, R. (1948). Soldier intelligence in World Wars I and II. American Journal of Psychology, 3, 54-56. Waite, L. (2005). Marriage and Family. New York: Paperback. Wilson, T., and Rees, P. (2005). Recent developments in population projection methodology: A review. Population, Space and Place, 11, 337-360. Zeng, Y., and Crimmins, E. (2006). Longer Life and Healthy Aging. Dordrecht: Springer. 3-28
