
3
Understanding Measures and Strategies
Researchers have been examining the health and environmental consequences of the various stages of the food cycle from varying perspectives and with different methodologies. Speakers from several fields were invited to share their approaches to analyzing and interpreting the food system and its unpriced costs (and benefits). This chapter summarizes those presentations.
Marty Heller, research specialist with the Center for Sustainable Systems at the University of Michigan, described how life cycle assessment (LCA) is used to evaluate the environmental impacts of a product. He described the three stages of LCA; discussed how LCA is used, emphasizing that ultimately it is a decision-supporting tool; and considered the opportunities and challenges of using LCA in a study on the cost of food. LCA’s greatest strength is its comprehensive nature. It provides a systematic means for analyzing all stages of the food cycle and avoiding “burden-shifting” (i.e., shifting burdens to other life cycle stages, outcomes, or geographic regions). Although Heller did not elaborate, he mentioned the availability of tools that can be used to link LCA results with costing perspectives.
Jonathan Fielding, director of the Los Angeles (LA) County Department of Public Health, described how health impact assessment (HIA) is used to evaluate the health impacts of a policy, plan, program, or project. He emphasized that there is no single HIA approach, rather a range of approaches, and he provided some examples. One of the greatest strengths of HIA, in Fielding’s opinion, is the opportunity it provides for intersectoral collaboration during policy decision making and for influencing decision makers to base their decisions on a broader understanding of health and a wider range of evidence.
John Antle, professor in the Department of Agricultural and Resource Economics at Oregon State University, mentioned two additional methodologies that could be used to analyze environmental externalities of the food system: cost-benefit analysis and multidimensional impact assessment. He elaborated on multidimensional impact assessment, emphasizing its reliance on modeling. He also elaborated on some of the major challenges to relying on modeling as a means to quantify externalities. Key among them is the vast heterogeneity that exists in the food system, especially with respect to production (e.g., large- versus small-scale production) and geography, and implications of that heterogeneity for collecting and analyzing data.
Finally, James Hammitt, professor of economics and decision sciences at the Harvard School of Public Health, described how risk assessment could be used to analyze the health outcomes of exposure to a wide range of food system–related stressors; identified sources of data for analysis; and explained how health effects are valued and quantified. Hammitt also discussed, more broadly, the challenge of measuring externalities in the context of noneconomic behavior. He explained that the concept of externality is not very well defined outside the classical economic model. According to classical economic theory, individuals behave as fully informed rational agents. In the “real world,” nonmarket factors influence how people behave.
“Eating is an agricultural act.”
—Wendell Berry
LCA is a tool for examining the environmental impact of a product. Marty Heller remarked that the defining characteristic of LCA is its “cradle-to-grave” perspective. LCA covers not just the impacts of manufacturing, but also the impacts of the upstream production chain (e.g., material extraction [i.e., mining], fuels and transportation, etc.) and downstream disposal (e.g., recycling, landfilling, etc.). Heller provided an overview of the history of the LCA methodology, described the three main stages of a typical LCA, and discussed how LCA is used and could be used to study the food system.
History of LCA
Heller described the current state of LCA methodology as being in a “mid- to late adolescent stage.” The first LCA studies were conducted in the late 1960s and early 1970s on the impacts of different beverage containers, initially for Coca-Cola and later for the U.S. Environmental
_________________
1 This section summarizes the presentation of Marty Heller.
Protection Agency (EPA). Those studies yielded mixed results. Another early series of LCA studies was conducted on the impacts of cloth versus disposable diapers, again yielding mixed results. According to Heller, the mixed results from these early studies were partly a reflection of the variable methodologies being used. At that time, investigators were only just beginning to explore LCA. There was no common theoretical framework upon which to build. The field experienced slow growth in the 1980s, but it did not really “jump forward” into something that “everyone could grab onto” until the 1990s. Since then, the methodology has experienced very rapid growth, with a number of organizations helping to coordinate the harmonization of different theoretical frameworks and to standardize methods and procedures. The EPA, the Society of Environmental Toxicology and Chemistry, and International Organization of Standards (ISO) have all been involved. ISO issued two international standards for LCA, both of which were renewed in 2006: ISO 14040 and ISO 14044. For example, ISO 14040 defines LCA as the “compilation and evaluation of the inputs and outputs and the potential environmental impacts of a product system throughout its life cycle.”
Importantly, Heller said, even though ISO has provided good standardization, LCA is still very much an “accommodating methodology.” It is used to study a broad range of systems and address a broad range of questions, with many methodological decisions being made along the way. Sometimes, as investigators become familiar with the system under study, decisions made earlier during the LCA may need to be reconsidered. He said, “Appreciating these methodological decisions is pretty important in understanding what the results are really telling us—what we can really draw from those outcomes.”
The Three Stages of LCA
Standard LCA has three main stages: (1) goal and scope definition; (2) inventory analysis; and (3) impact assessment. Heller described each in turn.
Goal and Scope Definition
The first stage of LCA involves deciding the purpose of the study, the questions being addressed, and the knowledge being sought. These decisions inform which of two major LCA approaches to take. The typical, or traditional, LCA approach is known as “attributional LCA.” Its goal is to describe a system as it is, using data averages. (A “system” includes all the environmentally relevant physical flows in and out of the life cycle and its subsystems.) The second approach is known as “consequential LCA.” Its
goal is to describe how environmental flows change in response to potential decisions. For example, if a policy decision causes an increased demand for electricity, what are the environmental impacts of that increased demand? Both approaches are important, Heller opined, as they answer different types of questions.
In addition to deciding whether one is going to take an attributional or consequential LCA approach, another important set of decisions made during of the first stage of LCA is defining the system boundaries. Because LCA examines flows between the system being examined and its environment (or another system), it is important to know where that system ends and the environment (or another system) begins. In addition to spatial boundaries, temporal boundaries need to be defined, according to Heller. For example, is the goal to measure impact over the course of a year or over 5 years? For well-defined technical systems, the boundaries can be fairly straightforward. But for agricultural and other biological systems, a distinction between a system and nature (or another system) can be unclear.
Yet another important task of the “goal and scope definition” stage of LCA is defining the functional unit. Heller described LCA as a relative tool. That is, the goal is not to examine absolute impacts, rather impacts relative to some defined unit. The functional unit not only helps to define how flows across a life cycle relate to each other, but it also allows for apple-to-apple comparisons across different systems that produce the same function. Again, with a well-defined technical system, the functional unit is fairly straightforward. For example, the functional unit of an electrical system is the kilowatt hour, with a kilowatt hour generated from a solar panel being relatively the same as a kilowatt hour generated from a coal plant. But it is not clear what the “true” function of food is. It is much more difficult to make that type of direct comparison. Heller explained that many LCAs on food systems have used a reference flow as the functional unit, for example, product mass or volume. While that may be sufficient for benchmarking a product, it does not allow for comparisons across different types of food products. For example, it is difficult to compare a kilogram of beef with a kilogram of milk. Some researchers have explored ways to incorporate nutritional value into the functional unit, for example, grams of protein or caloric value. Foods also have emotional value, although it is unclear how to incorporate that into the functional unit. Depending on stakeholder perspective, one might also think of food as having economic function or environmental function.
Inventory Analysis
The second stage of LCA, inventory analysis, is where Heller said one really “digs in” and examines all of the relevant material and energy flows.
Again, two different main approaches have evolved. First is the traditional “process LCA,” which involves examining a very specific product. Heller described process LCA as a “slow” methodology, one that is very data-intensive and typically involves examining very specific processes, yielding very detailed information about a particular product. The second approach, input-output LCA (IO-LCA), uses economic input and output data, usually country-level economic data, and involves examining economic flow between sectors and then connecting those flows with environmental impacts. So rather than looking at a particular type of meat, for example, IO-LCA looks at all meat products. One of the limitations of IO-LCA is that economic input and output data are not always available for all life stages, so some information is missing. Additionally, the level of detail is coarser than what process LCA yields. An advantage of IO-LCA is that it takes the full economy into consideration, which means that decisions do not have to be made about where system boundaries end. IO-LCA captures all interactions among sectors, regardless of how small the contributions of each interaction are to the impact being examined.
Regardless of which approach is taken, process or IO-LCA, inventory analysis is a very data-intensive stage. Often, hundreds of different flows over many dozens of different types of processes are being tracked. Fortunately, Heller said, there is good software available to help organize and account for all those data flows (e.g., SimaPro by Pre Consultants and GaBi by PE International), along with databases that can be used as proxies for some of the ancillary components of the system life cycle. As just one example, the U.S. Department of Agriculture has begun converting some of its agricultural Census data and other information about agriculture into data that can be used in LCA (e.g., www.lcacommons.gov). When good data are not available, for example, enteric fermentation data from ruminant animals, LCA researchers rely on modeling.
In addition to data considerations, another important component of inventory analysis is allocation. Most processes do not produce single outputs, but rather multiple coproducts. This creates a challenge: How should the various emissions and associated environmental burdens be allocated among coproducts? ISO established a hierarchical procedure for managing allocation issues, with their first suggestion being to avoid allocation whenever possible, either by dividing the system into subsystems or by expanding the system. But that is not always possible. For example, it is difficult to divide the process of producing milk from the process of producing meat. If allocation cannot be avoided, ISO’s next best suggestion is to reflect the coproduction in some physical relationship between the products (e.g., through energy flows or mass). If that is not possible, the next best suggestion is to reflect it in some other sort of relationship between the products, for example, through economic value. How allocation is managed can
significantly affect the results of an LCA. Heller said, “It is important to understand when we are looking at an LCA study—what were some of the decisions that were made here, and how is that influencing what we are looking at?”
Impact Assessment
The third and final stage of an LCA, impact assessment, involves interpreting the environmental significance of the examined material and energy flows. Commonly assessed impacts include energy use, global warming potential, eutrophication, acidification, and tropospheric ozone. Heller also listed some other relevant impact categories that have not received as much attention by LCA investigators: land use, water use, biodiversity, human toxicity, ecotoxicity, erosion, and landscape quality. Depending on the impact being examined, spatial information may or may not be important; for example, the impacts of water use are very spatially dependent. Most LCAs to date have been conducted without much spatial information.
Two additional tasks one may want to consider during this final stage of LCA are normalization, which involves comparing impacts from the system in question to total impacts in a region, and weighting impacts based on the relative importance to society or a particular stakeholder, which Heller said has no scientific foundation, but could be useful when communicating results of the LCA.
Uses of LCA
Heller listed several general uses for LCA. First, it can be used to identify and evaluate unintended consequences. Second, because of its comprehensive nature, it can be used to identify and avoid burden shifting (i.e., avoid shifting burden to other life cycle stages, environmental impacts, or geographic regions). Third, it can be used to identify hot spots. That is, where in the life cycle are the bulk of impacts occurring, and therefore, where should abatement strategies be focused? Fourth, it can be used to communicate environmental impacts, either to consumers or to other stakeholders. Fifth, it can be used to examine differences in scenarios. Once an LCA model has been built, it is easy to examine influences of changes in a particular scenario on environmental impacts. Finally, LCA is ultimately a decision-making tool, one that provides decision makers with more information. Heller noted that both the European Commission and the EPA have used LCA. The European Commission has used it to analyze the impacts of products; the EPA used LCA to determine whether renewable fuels meet GHG thresholds under the Energy Independence and Security Act of 2007.
With respect to the use of LCA in food and agriculture, Heller observed
that an International Conference on LCA in the Agri-Food Sector has been meeting since 1996. The group will be meeting for its eighth conference in October 2012. Its first U.S. meeting will be held in 2014. Additionally, there have been hundreds of LCA studies of food and agriculture products, mostly in Europe, although many commodity groups in the United States are beginning to use LCA as a way to quantify environmental impacts (e.g., the Innovation Center for U.S. Dairy is using LCA to examine fluid milk and cheese). Heller and Keoleian (2003) examined key economic, social, and environmental sustainability indicators at each life cycle stage of the U.S. food system (i.e., indicators demonstrating whether the food system is sustainable). Heller mentioned one result in particular that he said always strikes him: 30 percent of energy input into the U.S. food system is associated with household storage and preparation, mostly refrigeration.
Use of LCA in a Study on the Cost of Food: Opportunities and Challenges
In conclusion, Heller encouraged the use of LCA as a tool for addressing at least some questions about the true cost of food. LCA is a comprehensive methodology with established methods and standards. Moreover, not only does it provide a good systematic means to connect production and consumption, but there are other tools available for connecting LCA results with costing perspectives. LCA results can also be linked to health or other additional endpoints, including what Jolliet et al. (2003) refer to as “damage category” endpoints (see Figure 3-1). So, for example, when examining climate change as part of an LCA, one might be interested in further examining how climate change impacts human health or one of the other damage categories. According to Heller, while linking LCA results to additional endpoints adds more levels of uncertainty, a number of methodologies are available for making those links.
However, the methodology is not without its challenges. Data are certainly a challenge, as is the need for some of the methods to be refined for food and agriculture applications. Also, although the focus of LCA is on environmental impact, the methodology is being expanded to incorporate some social impacts (social-LCA), including rural community vibrancy, farmer/worker rights, and eater health (i.e., the impact of the actual food on health). In Heller’s opinion, use of the methodology for studying food systems would also benefit from being expanded to incorporate ecosystem services (see the summary of Scott Swinton’s presentation in Chapter 4 for discussion on ecosystem services). Currently, LCA is used mostly to assess the impacts of technical systems on the environment, usually with the goal of producing more of whatever that system produces for less impact. Agricultural systems are more challenging than most of these other technical
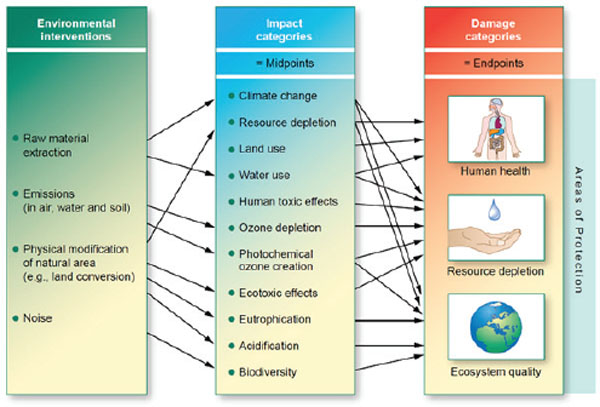
FIGURE 3-1 Overall scheme of the environmental life cycle impact assessment framework linking life cycle impact results to midpoint categories to damage categories.
SOURCE: UNEP/SETAC (adapted from Jolliet et al., 2003).
systems. They are ecosystems—and ecosystems typically have distinct carrying capacities, or the maximum load that can be supported indefinitely by the environment without deterioration; exceeding that carrying capacity can have dire consequences, regardless of whether the system is able to produce more for less impact.
HIA is not a single method, but rather a systematic process that uses a wide array of data sources, analytical methods, and stakeholder input to determine the potential effects of a proposed policy, plan, program, or project on the health of a population and the distribution of those effects within the population. Additionally, HIA provides recommendations on monitoring and managing those effects. Jonathan Fielding emphasized that
_________________
2 This section summarizes the presentation of Jonathan Fielding.
there is no single HIA approach, rather a wide range of HIA approaches. He discussed the benefits of HIA, described what a typical HIA involves, and provided some examples of national and local HIAs.
The Benefits of HIA: Opportunity for Intersectoral Collaboration
HIA has many benefits. One of its major benefits is that it brings partners from the non-health and health sectors together so that the impact of non-health-sector policy decisions on health is considered during the decision-making process. Fielding observed that many policy decisions in non-health sectors impact public health. For example, agricultural subsidy policy can impact the availability of nutritious foods, mass transportation policy can impact opportunities for walking and bicycling, and environmental policy can impact the availability of clean air. HIA can ensure that health effects are at least on the table for discussion; tip the scales, adding evidence in favor or against a certain course of action; change the terms of debate by encouraging transparent decision making and consideration of the best available evidence; tweak plans, with policies modified in ways that minimize potential harm and maximize potential benefits; bring new parties to the table that give voice to concerns of affected stakeholders who otherwise have difficulty making their concerns known; and change institutional missions and responsibilities. Fielding mentioned the city of Los Angeles as an example of an institution that has incorporated health effects as part of its general plan. Now, when thinking about new developments or policy, potential health effects must be considered. “This seems pretty obvious,” Fielding said. “But it was actually a major victory to get health incorporated into the plan.”
In addition to its role in facilitating intersector collaboration, HIA also highlights potentially significant health impacts that are unknown, under-recognized, or unexpected; assesses how proposals, policies, and plans will affect all community members, particularly the most vulnerable; supports sustainable development by considering both short- and long-term impacts; and identifies opportunities to enhance health benefits and mitigate harms.
What an HIA Looks Like
There are two kinds of HIA: project-specific and policy-oriented. With project-specific HIA, the major goal is to gather a wider range of stakeholder input into the decision-making process and to make the process more transparent. Policy-oriented HIA affects public policy in a broader way.
Whether the focus is on a specific project or a broader policy, the HIA framework has six major steps:
- Screening: getting a preliminary sense of how important a particular proposal is and whether an HIA would be helpful.
- Scoping: building what Fielding described as the “logic framework,” that is, a summary and descriptions of relevant pathways and likely health effects, research questions, and alternatives to the proposed action. For example, if the proposed action is widening of a road, is that really the best approach, or should an increase in mass transit or other actions also be considered as alternatives?
- Assessment: determining the baseline health status, analyzing the beneficial and adverse health effects of the proposed actions and its alternatives, and integrating stakeholder input into the analysis.
- Recommendations: identifying alternatives or actions to avoid or minimize adverse health effects; and proposing a health management plan to identify who could implement those recommendations and, more importantly in Fielding’s opinion, monitor implementation of the HIA recommendations.
- Reporting: documenting the HIA and communicating results and recommendations to decision makers, the public, and stakeholders. HIAs come in many forms. An HIA can be a comprehensive 200-page report, a 2-page policy brief, a “logic framework” and supporting discussion showing causal pathways, a checklist completed by an agency or policy makers, a spreadsheet or “calculator” allowing users to estimate health impacts for different scenarios, or a process for guided community engagement that results in testimony given to a policy-making body.
- Monitoring and evaluation: evaluating whether the HIA was conducted according to plan and applicable standards, whether the HIA influenced the decision-making process, and, when practicable, whether implementation actually changed health indicators as expected.
Although the National Environmental Policy Act of 1969 requires an analysis of health effects of proposed actions,3 Fielding said the requirement was not enforced. Had it been enforced, HIA as a key set of approaches to considering health effects would have probably come into use much earlier. However, the HIA “movement” didn’t really start until the mid-1980s in Europe. In the United States, the methodology did not really pick up until around 2000, with only about three dozen U.S. HIAs conducted by the mid-2000 decade. Many more have been conducted since then—both project-specific and policy-oriented HIAs. Most of the growth has been local, with 86 registered HIAs in 2012 being local, 18 state-level, and 6 federal-level.
____________________
3 42 U.S.C. §§ 4321-4347.
Today, HIA plays an important role in the assessment, monitoring, evaluating, and dissemination component of Healthy People 2020.4
Examples of HIA
As an example of a national-level, policy-oriented HIA, Fielding described the results of an HIA on the 2002 Farm Bill and its expected health effects on the U.S. population (Partnership for Prevention/UCLA School of Public Health, 2004). Fielding and colleagues identified five major pathways through which the new legislation was expected to impact health: (1) rural income and quality of life; (2) dietary consumption patterns; (3) food safety; (4) environmental pollution; and (5) other environmental degradation. Investigators focused their analysis on two pathways: dietary consumption patterns and environmental pollution. Specifically, they asked whether dietary consumption patterns would be affected by the Farm Bill subsidy policy and whether air pollution would be affected by ethanol production. Results of the HIA indicated, first, that changes in commodity supports would have little, if any, effect on consumer prices and consequently consumption, primarily because commodity price is only a small portion of the consumer price for most foods; second, that the air pollution effects of the production of ethanol were uncertain.
Fielding emphasized the importance of repeating HIA when new information becomes available. When the 2002 Farm Bill analysis was conducted, competing models yielded contradictory results with respect to the air pollution effects of ethanol production. Since then, more recent data have become available that show a negative effect given current production technology.
As an example of a local policy-oriented HIA, Fielding described an LA County HIA of a county government food procurement policy on sodium reduction (Gase et al., 2011).5 LA County government is large and complex, with over 101,000 employees and 37 departments. The county
_________________
4 Launched in 2010, Healthy People 2020 is a U.S. government 10-year goal for health promotion and disease prevention. As Fielding explained, the Healthy People 2020 ecological model of health is an action model, with interventions (i.e., policies, programs, information) impacting not just individual behavior, but also social networks (including family and community networks), living and working conditions, and broader environmental and other conditions (broad social, economic, cultural, health, and environmental conditions and policies at the global, national, state, and local levels). HIA is used to monitor various health outcomes and decide which interventions to support.
5 Food procurement policy is only one component of the effort to reduce sodium intake. The county is also participating in a national coalition that is encouraging food processors to voluntarily reduce sodium in their foods, and communicating with the U.S. Food and Drug Administration about changing sodium from a generally recognized as safe food to another type of food.
operates many food service venues and contracts with many food service vendors across its 87 regional and local parks, 344 miles of trails, 19 public golf courses, and a multitude of beaches, museums, libraries, theaters, prisons, juvenile prisons, juvenile detention centers, and probation camps. In 2009-2010, the county conducted an HIA to evaluate the likely impact of food procurement policies on sodium intake among patrons at LA County venues. HIA investigators estimated the reach of food procurement policies (e.g., county hospital cafeterias serve about 600 adults per day, senior meals programs serve about 9,200 adults per day, child care venues serve about 24,000 children per day, and other county cafeterias serve about 1,800 adults per day); gathered qualitative data and input from county food service vendors; and mathematically simulated the effects of varying levels of sodium reduction on mean systolic blood pressure (SBP). Preliminary findings predicted that adults eating at county food service venues that reduced sodium levels would consume 233 fewer milligrams of sodium per day, corresponding to a reduction in SBP among adults with hypertension, fewer cases of uncontrolled hypertension, and lower costs of treatment. Thus, the HIA investigators concluded that food procurement policy could have a positive health impact in LA County.
Opportunities and Challenges for Using HIA in a Study on the Cost of Food
In conclusion, Fielding emphasized that HIA is only one of many tools that can be used to inform and improve health policies. But one of its greatest strengths is the opportunity it provides for intersectoral collaboration. He said, “In our experience it has really moved health into discussions in other sectors where we know that there are health impacts of decisions, but health effects have really not been considered.”6 But it is not without its challenges. In many cases, HIA yields only qualitative results or quantitative results with very wide confidence intervals. Its applicability is also challenged by the complexity of relationships between determinants and health outcomes; the lack of research on many causal pathways; the lack of sufficient data on interventions to improve health status; and the lack of reliable and valid indicators of environmental effects.
Measuring the cost of food is a complex, multidisciplinary challenge—one without a magic fix or solution. “We are all groping for how to deal
_________________
6 Fielding referred workshop attendees to the UCLA Health Impact Assessment Clearinghouse Learning and Information Center website: www.HIAguide.org.
7 This section summarizes the presentation of John Antle.
with [it],” John Antle remarked. Antle shared some thoughts about the challenges of valuing social costs and benefits and discussed the opportunities and challenges of a multidimensional impact assessment modeling approach that he and colleagues have been using to quantify environmental externalities, one that considers not just environmental but also economic and social outcomes.
The Challenge of Valuing Social Costs and Benefits
Traditional agricultural policy is focused on farmer income. Antle speculated on how consideration of the cost of food shifts the focus to a different set of questions that revolve not around transferring income to farmers, rather on social well-being: First, are we producing and consuming the right amounts of food in the right ways? Second, given that many experts would agree that the answer to the first question is no, what can be done to correct the problem(s)?
Antle explained that economists address these questions by thinking in terms of social costs and benefits and attaching value to them. He observed that there is a huge body of empirical research that at least attempts to quantify both negative externalities (i.e., social costs) and positive externalities (i.e., social benefits) associated with agricultural production and food systems. Much of the work to date has focused on farm-level production, as opposed to components of the food system that reside beyond the farm. Despite these efforts, quantifying social benefits and costs in a meaningful way, that is, in a way that can inform public policy, remains tremendously challenging.
Even deciding whether an externality is positive or negative can be challenging. For example, water contamination associated with agriculture could be considered either a positive or negative externality depending on how property rights are initially assigned. One could consider farmers the “bad guys” and tax them accordingly, or as “stewards of the land” and pay them to do more good. In this example, the property rights issue is whether farmers have a right to use fertilizer. If the answer is no, then farmers who pollute the water should be penalized for doing so. But if the answer is yes, that is, if farmers have the right to use fertilizer, then farmers who use less fertilizer should be compensated for the cost they will bear associated with using less fertilizer. A related challenge is understanding how the economic agents that create the externalities, that is, the farmers, respond to policy intervention. According to Antle, modeling that response to policy is another “big part” of what economists do in their effort to answer these questions.
Added to the challenge of quantifying externalities is the reality that, as Antle put it, “There is a lot more to life than externalities.” He suggested
that food policy may need to address the broader set of factors that people care about, such as food quality or animal welfare.
Additional Tools for Quantifying the Cost of Food
In addition to LCA and HIA, Antle identified two additional tools for quantifying externalities: (1) cost-benefit analysis and (2) multidimensional impact analysis. Additionally, regardless of methodology, he encouraged more appreciation for qualitative considerations and how those could be added to the “quantitative toolbox.” Many environmental outcomes, like biodiversity, are difficult to quantify.
Cost-Benefit Analysis
Cost-benefit analysis involves valuing all benefits and costs in monetary terms and then adding those values. The method is limited by many factors, including distributional issues (i.e., the distribution of benefits and costs), the timing of benefits and costs (i.e., comparing current versus future benefits and costs), and valuation. Antle noted that the issue of valuation is especially challenging when considering the cost of food. It is not clear whose values should be used. Another major challenge is aggregation across outcomes, that is, measuring all outcomes in terms of one metric (e.g., measuring all GHG emissions in terms of carbon equivalents). The challenge of aggregation is what led Antle to his work on what he calls “multidimensional impact assessment.” Also, Antle questioned the practicality of adding all of the positive and negative externalities associated with food into a single sum, as a cost-benefit analysis would do. He suggested focusing on a small number of key indicators, being careful not to leave out any important ones, and understanding those indicators well enough that their estimated values can actually have a policy impact.
Multidimensional Impact Assessment
Multidimensional impact assessment is a modeling methodology that takes into account economic, environmental, and social impacts—what Antle referred to as the “three pillars of sustainability.” The approach involves quantifying key indicators and their relationships, with a focus on trade-offs and synergies. The approach typically involves coupling an ecosystem model with an economic behavioral model and examining and understanding the underlying processes well enough to predict what will happen in response to a policy, price, or other change. Predictions can be made at regional, national, or even global levels. Regional predictions can be made with fairly good site-specific detail. For example, using counties
as the basic spatial unit, Antle and Ogle (2012) linked what is known as a century ecosystem simulation model (a model used for examining soil carbon dynamics) to an economic behavioral model and examined the effects of no-till production on GHG emissions, taking into account not just soil carbon, but also nitrous oxide emissions and fuel use.
Data and Modeling Challenges
A major limitation of impact assessment is dimensionality. As Antle explained, trying to quantify trade-offs among 30 key indicators can become extraordinarily difficult. Another major challenge is the heterogeneous nature of agricultural systems. For example, there is considerable heterogeneity even in the corn-soybean world of Iowa or in the wheat-fallow-livestock rangeland systems of the Great Plains. Not only are agricultural systems spatially heterogeneous, but they are also temporally dynamic. Together, this spatial and temporal variation creates very serious analytical challenges to measuring environmental externalities.
In addition to the analytical challenge of quantifying multiple environmental outcomes across space and time, collecting enough high-quality data to conduct those analyses in the first place can also pose a challenge. This is true even though the availability and quality of some types of data have improved over time. For example, farm-level agricultural census and other data are now available (e.g., Agricultural Resource Management Survey data, jointly collected and managed by the Economic Research Service [ERS] and the National Agricultural Statistics Service [NASS]). Also, remotely sensed data are yielding more accurate annual land use and crop yield data, improving the capability to not only conduct multidimensional impact assessment modeling, but also make it more dynamic. Yet, at the same time, federal government budget constraints are reducing availability of other types of data. Antle mentioned that he has not been able to access data more recent than the 2007 version of the National Resources Inventory, which he said used to be a heavily used data source (the database is currently being revised). He said, “If we really want to get at this question of the true cost of food, good data are going to be really essential.”
Added to its analytical and data challenges, impact assessment is made difficult by funding and institutional constraints to transdisciplinary team building. It is also costly, Antle cautioned. Indeed, in Antle’s opinion, the cost of analysis is “one of the big issues” to consider when planning a study on the cost of food.
Yet another challenge is the lack of a systematic approach to model development, comparison, and improvement—in other words, as Antle put it, to “making this modeling research really good science.” He mentioned
the Agricultural Model Intercomparison and Improvement Project and its efforts to compare and integrate different modeling approaches.
Based on his work with risk assessment, James Hammitt views health as depending on three sets of factors: (1) exposure to physical, chemical, biological, and social agents and stressors; (2) behavior that reduces exposure or mitigates the effects of exposure, with the ability to avert or mitigate exposure depending on income, information, and other resources; and, more broadly, (3) the food production-distribution-consumption system, which can affect both exposure and behavior. As examples of how the system itself impacts health, specific foods have constituents and contaminants that affect health; overall diet affects health; and the food system itself can impact disposable income, with a higher cost of food reducing the amount of disposable income available for other, health-protective measures. Hammitt discussed how risk assessment can be used to analyze exposures to stressors in the food system and their impact on health, and identified major sources of data for conducting risk assessments. He also offered some general thoughts on defining externality in the context of noneconomic behavior.
Risk Assessment
Risk assessment involves analyzing how exposures to various stressors influence the probability of morbidity and mortality. Risk assessment involves three steps: (1) identify exposure; (2) calculate exposure-response functions; and (3) attach value.
Identify Exposure
Hammitt identified five major exposure pathways in the food system: (1) production and processing (i.e., exposure to nutrients, contaminants, and pesticides in food; waste streams from production and processing facilities; and energy pathways related to production and processing); (2) packaging (i.e., exposure to contaminants in packaging, and to energy pathways related to packaging); (3) distribution (i.e., exposure to energy pathways related to distribution); (4) preparation (i.e., exposure to nutrients and contaminants influenced by how food is prepared and to environmental pollution related to energy use); and (5) consumption (i.e., exposure to nutrients, contaminants, and pesticides in food, and to overall diet).
_________________
8 This section summarizes the presentation of James Hammitt.
Hammitt noted that his list of exposure pathways was “not very well researched” and that his intention was for the list to be “provocative.” Another public health effect to consider that he said does not really fit into any one of these five pathways is antibiotic resistance. He suggested that one way to analyze antibiotic resistance is by examining the distribution of resistant microbial strains and the ways that people can come into contact with those strains (i.e., the chance of infection from all possible pathways).
Calculate Exposure-Response Function
After identifying exposure, the next step is to calculate what is known as the exposure-response function, that is, the probability of an adverse health effect given exposure to a certain quantity of stressor.
Attach Value
The third and final step is valuation. Because multiple health effects can arise, with the same food sometimes having both “good” and “bad” effects (e.g., eating fish can be cardio-protective because of its omega-3 fatty acid content, while at the same time serving as a major exposure pathway to methyl mercury, which has negative health effects), valuation involves aggregating those effects not just for individuals, but also across a population (the “social aggregation problem”). Economists attach value in one of two ways: via either monetary value (i.e., willingness to pay [WTP]); or health utility (i.e., quality-adjusted life years [QALYs], value per statistical life, or a related concept).
Analyzing Health Effects
Hammitt offered some thoughts on how one might use risk assessment to analyze health outcomes associated with four major sources of exposure: (1) diet; (2) nutrients, contaminants, and pesticides; (3) energy; and (4) waste streams.
Diet clearly affects the risk of many diseases and health effects, from cardiovascular disease to obesity, not just for the person actually consuming any given diet, but also for his or her offspring. The major source of information for analyzing those effects is epidemiological data. Hammitt commented on how diet itself is affected by many factors, including prices and convenience (i.e., as determined by availability, distribution, and preparation), consumer information about the consequences of eating different types of foods, and traditions and customs. To examine how these many factors impact diet, Hammitt speculated that the major data sources would
be economic (e.g., demand system modeling, social science methods that determine how people perceive risk and choose diet).
With respect to exposure to nutrients, contaminants, and pesticides, Hammitt noted that the effects can be either positive or negative and that some substances may have positive or negative effects depending on dose. For example, many nutrients are beneficial at low levels, but harmful at higher levels. Additionally, some contaminants and pesticides may have safe exposure thresholds, below which there is no risk of adverse effect. Major sources of information for analyzing these effects include epidemiology and toxicology data. One of the challenges to collecting and analyzing these types of data is that the dose-response function is often unknown or unreported. While some nutrients have established tolerable upper levels (ULs), above which risk for adverse effects increases, for other nutrients, not enough data were available to establish ULs.
All stages of the food life cycle use commercial energy. Hammitt identified production and processing, packaging, and possibly distribution as the most energy-intensive stages, with the main exposure pathways being environmental release of stressors, mostly air pollutants. The major source of exposure is fossil fuel combustion (i.e., for electricity production, farm vehicle transportation, etc.), with particulate matter and, to a lesser extent, ozone precursors being especially problematic. Even after consumption, waste disposal and clean-up processes use energy (e.g., hot water to wash dishes), although it is unclear whether postconsumption energy use is quantitatively significant. Upstream pollution associated with producing these fuels in the first place is another source of exposure to consider. Hammitt remarked that research on these phenomena is a fairly well-developed field, with major information sources being epidemiology; and fate, transport, and exposure modeling.
Finally, waste streams are another important type of food-related exposure pathway. Waste streams include waste from livestock and fertilizer/pesticide run-off from fields. Waste stream exposure pathways include air emissions; water exposure (i.e., through drinking, bathing, swimming); and food contamination (e.g., livestock waste is the source of many bacterial outbreaks in vegetables). Again, data for studying these types of exposure and their health effects come from epidemiology; toxicology; and fate, transport, and exposure modeling.
Valuing Health Effects
There are two conventional approaches to valuing health effects. The first is a money measure: WTP, or willingness to accept compensation for change. In economic parlance, WTP is the change in wealth that one is will-
ing to accept to increase his or her survival probability by a certain amount. WTP is widely used in environmental and transportation applications. The second approach is based on health utility: QALYs. QALYs are a measure of the trade-off between health (or, more specifically, health-related quality of life, with “0” being death and “1” being optimal health) and longevity. QALYs are estimated using what is known as a health profile, that is, a graph with time on the x-axis and health-related quality of life on the y-axis, and with total QALYs being equal to the area under the curve.9 QALYs are widely used in public health and medical applications.
A key question to consider when thinking about these two different approaches is whether they are consistent with the preferences of the affected people. Hammitt explained how economists traditionally have considered individuals to be the best judges of their own interests and determined whether a policy is going to improve someone’s situation by asking him or her whether they think they would be better off with the policy in place. He said, “It seems like it is very important, if we are trying to measure welfare that the welfare measure ought to at least have something to do with the preferences of the people whose welfare we are trying to affect.” A significant difference between the money measure and health utility approaches is that the health utility approach is based on assumptions about individual preferences that are reasonable on average, but clearly false at the individual level. For example, one assumption is that the trade-off between health and length of life that QALYs measure is independent of wealth (i.e., that the fraction of one’s lifetime one would give up to be free of some disability is independent of whether one can afford technologies that help offset the disability, such as reading glasses or electric wheelchairs), an assumption that Hammitt said does not make much sense either theoretically or empirically. WTP is less constrained and more accurately reflects individuals’ own preferences. So, for example, even if the risk of cancer from smoking were exactly the same as the risk of cancer from pesticides in food, an individual might have different preferences for those two risks and, therefore, differ-
_________________
9 During the question-and-answer period, Hammitt explained that QALYs are estimated by surveying and interviewing people. People are asked three general types of questions: (1) Respondents are asked to rate their health on a scale from 0 to 100. (2) They are asked what is called a “time trade-off” question. For example, they are asked to assume that they are going to live the rest of their life, say 40 years, in a specific health state with a chronic illness and decide at what point they would exchange that future life for a shorter life in perfect health. (3) Respondents are asked what is called a “standard gamble” question. They are asked to imagine living the rest of their life in an impaired health state and being given the option for a treatment that would either restore their health or cause death. Surgery is a good example of this type of treatment, that is, one with an up-front mortality risk. Hammitt said that there is a lot of “noise” associated with each of these three questions, but that they generally provide the same answers.
ent willingness to pay to reduce those risks. WTP would account for those different preferences, while QALY would not. However, to the extent that people are confused about their own preferences, empirical estimates of WTP are more susceptible to fuzzy thinking.
But when is it appropriate to harm some people in order to provide benefits to others? The implicit social objective to increasing QALYs is to maximize total health and longevity in a population. A policy that provides more total QALYs to one subpopulation is viewed as better than a policy that provides fewer total QALYs to another subpopulation, regardless of the number of people in each group and their characteristics. The same situation occurs with WTP. The implicit social objective to making a policy based on WTP is to maximize total WTP, independent of the number and characteristics of the people who benefit.
Defining Externality in the Context of Noneconomic Behavior
The concept of externality is not well defined outside the classical economic model—that is, when individuals do not behave as fully informed rational agents as economic theory assumes they do. Hammitt identified several questions to consider before embarking on a study of the external costs and benefits of food. First, when human behavior differs from what an economic model assumes, how should externality be defined? Will the study really be about externalities, or will it be about consequences? Why focus on externalities? Is it because, if all externalities could be internalized, then the outcome would be efficient? While that may be the case in a simple economic model, it is not true in the real world. In the real world, nonmarket influences affect how people behave. For example, information asymmetry, that is, where people do not know about the properties of various foods or the risks of different diets, influences eating. Another major nonmarket influence is the social network or environment, as people are influenced by what other people in their social networks do. Another question to consider is whether health risks from poor diets are internalized or not. At the simplest, one can assume that consumers are the best judge of their own interests. But again, behavioral economics and related research suggest that people do not behave as simple economic theory assumes they do. People behave inconsistently over time and exhibit limited self-control, for example, by procrastinating (i.e., eating badly today while promising to eat better tomorrow). It is unclear whether the health risks associated with those behaviors constitute externalities.
Antle, J., and S. Ogle. 2012. Influence of soil C, N20, and fuel use on GHG mitigation with no-till adoption. Climatic Change 111(3):609-625.
Gase, L. N., T. Kuo, D. Dunet, S. M. Schmidt, P. A. Simon, and J. E. Fielding. 2011. Estimating the potential health impact and costs of implementing a local policy for food procurement to reduce the consumption of sodium in the County of Los Angeles. American Journal of Public Health 101(8):1501-1507.
Heller, M., and G. Keoleian. 2003. Assessing the sustainability of the U.S. food system: A life cycle perspective. Agricultural Systems 76:1007-1041.
Jolliet, O., A. Brent, M. Goedkoop, N. Itsubo, R. Mueller-Wenk, et al. 2003. Final report of the LCIA definition study.http://www.lca-net.com/files/LCIA_defStudy_final3c.pdf (accessed October 19, 2012).
This page intentionally left blank.


