
4
Nutritional Status and Usual Dietary Intake of Lactating Women
As a first step in the process of describing the nutritional status of lactating women in the United States, the subcommittee evaluated the methods used to assess the nutritional status of lactating women as well as anthropometric and biochemical data from apparently well-nourished lactating women. It also conducted a detailed review of the information on dietary intake by lactating women in the United States. The lack of nationally representative data on dietary intake and laboratory values of lactating women presented a substantial barrier to this effort.
Few lactating women have been included in the nutrition monitoring activities conducted by the U.S. Departments of Agriculture (USDA) and Health and Human Services (LSRO, 1989) (for example, only 59 of 2,910 women in the Continuing Survey of Food Intake by Individuals, core sample, wave 1, were lactating) (S. Krebs-Smith, USDA, Human Nutrition Information Service, personal communication, 1988). Thus, the lack of general knowledge about nutritional status in this population group is destined to continue for some time unless action is taken to obtain more data on this subject.
ASSESSMENT OF THE NUTRITIONAL STATUS OF LACTATING WOMEN
The subcommittee briefly reviewed the general reasons for assessing nutritional status, as well as the tools for doing so, and their suitability for application to lactating women. It also identified purposes for which new tools may be necessary and provided guidance on interim strategies for the assessment of
nutritional status among lactating women. These are all discussed below along with a summary of the normative data that are available on the nutritional status of well-nourished lactating women.
Reasons for Assessing Nutritional Status Among Lactating Women
In general, assessments of the nutritional status of lactating women and other groups have many applications—in research, in patient management, in public policy development, and in program planning and evaluation. The selection of the indicator of nutritional status to be used should consider its intended application (Habicht and Pelletier, 1990).
To date, there have been few efforts to develop indicators specifically for the assessment of nutritional status among lactating women (Rasmussen and Habicht, 1989). Most indicators are normative; that is, they reveal how an individual's value for that indicator compares to some standard, usually derived from a population of normal, healthy subjects. Values outside a range defined by designated cutoff points are called abnormal, but may or may not be associated with any particular functional consequence. An example of a normative indicator is the comparison of weight for height or blood nutrient values to a reference standard. As discussed further below, no standards for anthropometric or biochemical indicators have been established for nutritional status among lactating women. The usefulness of values obtained from nonpregnant, nonlactating women as a reference standard for lactating women requires evaluation.
There are few indicators of risk of undesirable outcomes for lactating women. Instead, the risk is usually related to the health of the nursing infant. An example of such an indicator is an abnormally low concentration of riboflavin in milk, which is associated with the likelihood of nutritional deficiency in the nursing infant (Bates et al., 1982). Another is the classic association of low thiamin concentrations in the milk of mothers in a rice-eating population with a high incidence of infantile beriberi among breastfed babies (Kinney and Follis, 1958). In contrast, indicators of poor nutritional status with respect to certain micronutrients (e.g., iron) are well understood in lactating women and can be used for the targeting of nutrient-specific interventions.
Indicators of benefit (ways to identify lactating women who would benefit from a planned intervention) have yet to be developed. These would be the most useful indicators for targeting interventions. The theoretical work needed to develop indicators of benefit from interventions designed to ameliorate protein energy malnutrition has been started in studies of young children (Rothe, 1988). It is clear from a supplementation trial conducted in The Gambia (Prentice et al., 1983; see Chapter 5) that the indicators of poor nutritional status used (residence in a low-income community characterized by seasonal decreases in milk volume or low weight for height) are inadequate for predicting who will
benefit (at least in terms of increased milk volume) from a program of general nutritional supplementation.
Use of Biochemical Indicators
The few investigations in which biochemical measures have been used to assess the nutritional status of lactating women have used values for nonpregnant, nonlactating women as reference standards. This approach makes the assumption that the interpretation of levels of vitamins, minerals, hormones, and metabolites is unaffected by lactation. For this to be true, plasma volume in lactating women must be the same as that in nonlactating women and remain stable over the course of lactation. These ideas about plasma volume are difficult to evaluate with the currently available data. Unfortunately, few researchers have investigated changes in plasma volume post partum (Brown et al., 1947; Caton et al., 1951; Taylor and Lind, 1979), and it is impossible to tell whether the subjects in those studies were lactating. The results of those studies suggest that even in nonlactating women, plasma volume remains elevated for weeks to a few months after delivery. The only study that compared the plasma volume of lactating and nonlactating women post partum (Donovan et al., 1965) confirmed the decrease in plasma volume from 3 days to 6 weeks after delivery and established that the magnitude of these decreases was the same in both groups. At 6 weeks post partum, values for the lactating women (53.6 ml/kg of body weight) as well as the nonlactating women (50.1 ml/kg) remained above those reported earlier by the same authors (Donovan et al., 1964) for nonpregnant, nonlactating subjects (46.1 ml/kg). Plasma volume values were higher at both times in the lactating subjects, but this difference was not statistically significant.
Changes in plasma volume during lactation have also been reported for various other species. In cows (Reynolds, 1953), sows (Anderson et al., 1970), rabbits (Tarvydas et al., 1968), and rats (Bond, 1958), plasma volume is greater in lactating than in nonlactating animals.
The findings concerning plasma volume in lactating women and animals make it clear that plasma volume does not return rapidly to prepregnancy values. Thus, for this reason alone, it is probably inappropriate to assess the nutritional status of lactating women by comparing plasma nutrient values with reference values for a nonpregnant women, especially in the early postpartum period.
The assumption that blood values of vitamins, minerals, hormones, and metabolites are unaffected by lactation is known not to be correct. For example, insulin and glucose levels in lactating women respond quite differently to a test meal than they do in the same women after cessation of lactation (Illingworth et al., 1986). Protein metabolism also appears to change during lactation (Motil et al., 1989, 1990). Nitrogen balance among lactating women is lower than that among nonlactating postpartum and nulliparous women studied at similar
levels of nitrogen intake. Differences in nitrogen balance are not accounted for by nitrogen losses in milk; urinary 3-methyl histidine excretion (a measure of muscle protein breakdown) also is lower in lactating women. Some changes in blood concentrations of vitamins and minerals over the course of lactation are unrelated to changes in plasma volume. For example, serum zinc concentration increases while serum copper decreases between weeks 1 to 2 and 19 to 21 of lactation (van der Elst et al., 1986).
In summary, evidence suggests that, in principle, it is likely to be inappropriate to compare blood values of various nutrients or metabolites of lactating women with reference values for nonpregnant women. However, the degree to which this approach misclassifies women's nutritional status depends on the degree to which levels in lactating women differ from those of their nonpregnant, nonlactating counterparts. As will be evident from the data summarized and discussed below, too few lactating women have been studied to make a meaningful evaluation of the validity of this approach at present.
Inferences about maternal nutritional status also can be made from the nutritional status of the infant. For example, infants with evidence of vitamin B12 deficiency (that is, those with increased concentrations of methylmalonic acid in their urine) may have mothers with poor vitamin B12 status (Specker et al., 1988). The reverse is not necessarily true, however. For example, the nutritional status of breastfed infants of mothers with inadequate folacin (Salmenperä et al., 1986) or vitamin C (Salmenperä, 1984) status may remain optimal. This issue is discussed further in Chapter 7.
Uses of Anthropometric Indicators
Tables developed by the Metropolitan Life Insurance Company have generally been used as normative standards for weight, height, and weight for height (MLI, 1959, 1983). For women in the United States, values derived from recent data from the National Center for Health Statistics (NCHS) (NRC, 1989) also could be used. There are drawbacks for both sets of values for studies of lactating women (Rasmussen, 1988). The use of such normative standards is fraught with all the problems discussed in Chapter 4 of Nutrition During Pregnancy, Part I: Weight Gain (IOM, 1990) as they relate to pregnant women. In particular, it is difficult to obtain accurate measurements without extensive training and monitoring, and comparison of a woman's values with either of these standards does not provide the information needed to make inferences about either the risk of adverse outcomes or the potential benefit from a nutritional intervention for the mother or the infant.
Many anthropometric indicators of nutritional status change continuously during lactation (Butte et al., 1984) and, even at 6 months post partum, may still differ from prepregnancy values (Sadurskis et al., 1988). The rate at which a woman (lactating or not) returns to her prepregnancy weight after delivery is
affected by many factors. These include edema during pregnancy and the route of delivery (Dennis and Bytheway, 1965); prepregnancy weight, postpartum weight, parity, and maternal age (Brewer et al., 1989); and weight gained during pregnancy (Greene et al., 1988).
There is a need for research to develop indicators of nutritional status, analogous to those for weight gain during pregnancy, that make use of either the pattern or the total magnitude of the changes. Further research is also needed to investigate the use of other anthropometric indicators (e.g., various skinfold thicknesses or circumference measurements) for assessing the nutritional status of lactating women. Other approaches (e.g., bioelectrical impedance or isotope dilution [Wong et al., 1989]) for the evaluation of changes in body composition also merit study in lactating women.
Biochemical and Anthropometric Data from Well-Nourished Lactating Women
Biochemical Measures of Nutritional Status
Table 4-1 provides the biochemical measures of nutritional status from the few studies that have been conducted in lactating women and compares them with values for nonpregnant, nonlactating women. Also included are compiled values from presumably well-nourished lactating women living in industrialized countries. It is evident from Table 4-1 that data on a variety of biochemical measures of nutritional status have been collected for lactating women, but that the sample sizes range from only 3 to 36. Where comparison was possible, there was remarkably little difference between values for lactating women and those for nonpregnant, nonlactating women.
Blood Lipids
The blood lipid profiles of lactating women at 6 weeks post partum have been compared with those of parturient women who were not lactating (Knopp et al., 1985). The lactating women maintained lower total triglyceride and higher total cholesterol values than those in the nonlactating group. There also were statistically significant differences between the two groups in values for various lipoprotein lipids and apoproteins (Table 4-2). In contrast, both plasma cholesterol and triglyceride concentrations were higher at 8 weeks post partum than they were before conception among 14 lactating Swedish women (Fåhraeus et al., 1985). These studies suggest that lactation causes changes in lipoprotein metabolism.
Change in Body Weight During Lactation
Table 4-3 provides anthropometric measurements of nutritional status for lactating women and for nonpregnant, nonlactating women in the United States.
TABLE 4-1 Biochemical Measures of Nutritional Status for Healthy Nonpregnant, Nonlactating Women and for Adults Not Receiving Supplements of the Nutrient Studied
|
|
Nonpregnant, Nonlactating Adults |
Lactating Women |
|
|
|
|
|
Measure of Nutritional Status |
Mean or Rangea |
Reference |
Mean Value |
Number of Subjects |
Duration of Lactation |
Reference |
|
Macrominerals |
||||||
|
Serum calcium, total (mg/dl) |
8.8–10.0 |
Young, 1987 |
8.60 ± 0.17 SEMb |
18; |
3 wk |
Greer et al., 1982 |
|
8.4–10.2 |
Tietz, 1986 |
9.59 ± 0.17 SEM |
14 |
26 wk |
|
|
|
Serum magnesium (mg/dl) |
1.8–3.0 |
Young, 1987 |
1.95 ± 0.06 SEM |
18; |
3 wk |
Greer et al., 1982 |
|
1.3–2.1c |
Tietz, 1986 |
2.15 ± 0.07 SEM |
14 |
26 wk |
|
|
|
Trace elements |
||||||
|
Plasma selenium (µg/liter) |
Levander, 1988 |
136 ± 5 SEM |
21 |
1 mo |
Levander et al., |
|
|
|
|
|
137 ± 5 SEM |
22 |
3 mo |
1987 |
|
|
|
|
138 ± 5 SEM |
22 |
6 mo |
|
|
|
|
|
97 ± 6 SEM |
10 |
4, 8 wk |
Mannan and Picciano, 1987 |
|
RBCf selenium (ng/g of hemoglobin) |
NAe |
|
470 ± 33 SEM |
20 |
1 mo |
Levander et al., |
|
|
|
450 ± 33 SEM |
21 |
3 mo |
1987 |
|
|
|
|
|
501 ± 31 SEM |
23 |
6 mo |
|
|
|
|
|
173 ± 6.4 SEM |
10 |
4, 8 wk |
Mannan and Picciano, 1987 |
|
Plasma zinc (µg/dl) |
88–123 |
NRC, 1978 |
79.1 ± 1.7 SEM |
23 |
1 mo |
Moser and |
|
|
65–140 |
Solomons, 1988 |
87.6 ± 2.2 SEM |
21 |
3 mo |
Reynolds, 1983 |
|
|
|
|
84.4 ± 2.4 SEM |
19 |
6 mo |
|
|
|
|
|
70 ± 11 SDg |
29 |
1 mo |
Krebs et al., 1985 |
|
|
|
|
79 ± 10 SD |
27 |
4 mo |
|
|
Serum zinc (µg/dl) |
75–120 |
Young, 1987, |
73 ± 4.8 SD |
10 |
5–75 days |
Moore et al., 1984 |
|
|
70–150 |
Tietz, 1986 |
|
|
|
|
|
RBC zinc (µg/g) |
NA |
|
12.9 ± 0.2 SEM |
23 |
1 mo |
Moser and |
|
|
|
|
12.0 ± 0.2 SEM |
21 |
3 mo |
Reynolds, 1983 |
|
|
|
|
10.7 ± 0.4 SEM |
19 |
6 mo |
|
|
|
Nonpregnant, Nonlactating Adults |
Lactating Women |
|
|
|
|
|
Measure of Nutritional Status |
Mean or Rangea |
Reference |
Mean Value |
Number of Subjects |
Duration of Lactation |
Reference |
|
Water-soluble vitamins |
||||||
|
Erythrocyte transketolase activity coefficient |
NA |
|
1.07 ± 0.07 SD |
10 |
5–10 wk |
Dostálová, 1984 |
|
Urinary thiamin (mg/day) |
NA |
|
0.90 ± 0.46 SD |
6 |
6 mo |
Thomas et al., 1980 |
|
Erythrocyte glutathione reductase activity coefficient |
NA |
|
1.05 ± 0.14 SD |
10 |
5–10 wk |
Dostálová, 1984 |
|
Urinary riboflavin (mg/day) |
NA |
|
0.44 ± 0.23 SD |
6 |
6 mo |
Thomas et al., 1980 |
|
Erythrocyte oxaloacetate transaminase activity coefficient |
1.69 |
NRC, 1978 |
1.75 ± 0.16 SD |
10 |
5–10 wk |
Dostálová, 1984 |
|
Plasma vitamin B6 (ng/ml) |
3.6–18 |
Tietz, 1986 |
4.9 ± 2.4 SD |
11 |
5–10 wk |
Dostálová, 1984; |
|
|
5–23 |
McCormick, 1988 |
8.4 ± 3.2 SD |
NR |
2 mo |
Andon et al., 1989 |
|
Erythrocyte glutamic pyruvic transaminase activity coefficient |
1.19h |
NRC, 1978 |
1.17 ± 0.19 SD |
6 |
6 mo |
Thomas et al., 1980 |
|
Serum folate (ng/ml) |
4.7–8.2 |
NRC, 1978 |
13.0 ± 3.13 SD |
6 |
6 mo |
Thomas et al., 1980 |
|
|
1.8–9 |
Tietz, 1986 |
3.8 ± 0.5 SEM |
30 |
1 mo |
Ek, 1983 |
|
|
5–16 |
Herbert and |
4.1 ± 0.3 SEM |
29 |
3 mo |
|
|
|
|
Colman, 1988 |
4.3 ± 0.3 SEM |
46 |
6 mo |
|
|
|
|
|
4.8 ± 0.3 SEM |
42 |
9 mo |
|
|
|
|
|
4.6 ± 0.2 SEM |
45 |
12 mo |
|
|
|
|
|
8.6 ± 4.5i |
8 |
5–10 wk |
Dostálová, 1984 |
TABLE 4-2 Lipoprotein Lipids and Apoproteins for Lactating and Nonlactating Women 6 Weeks Post Partuma
|
|
Mean Value, mg/dl ± SDb |
|
|
Type of Lipoprotein |
Lactating Women (N = 56) |
Nonlactating Women (N = 16) |
|
Total |
||
|
Triglyceridesc |
92 ± 71 |
112 ± 56 |
|
Cholesterolc |
207 ± 31 |
188 ± 29 |
|
Phospholipids |
227 ± 29 |
217 ± 32 |
|
Apoprotein B |
79 ± 29 |
69 ± 20 |
|
Very low density lipoprotein |
||
|
Triglyceridesc |
54 ± 67 |
78 ± 52 |
|
Cholesterol |
14 ± 14 |
17 ± 11 |
|
Phospholipidsc |
16 ± 17 |
24 ± 16 |
|
Apoprotein B |
3 ± 3 |
4 ± 2 |
|
Low-density lipoprotein |
||
|
Triglycerides |
26 ± 12 |
24 ± 9 |
|
Cholesterol |
129 ± 31 |
121 ± 30 |
|
Phospholipids |
70 ± 21 |
70 ± 26 |
|
Apoprotein B |
76 ± 28 |
66 ± 20 |
|
High-density lipoprotein |
||
|
Triglycerides |
12 ± 5 |
10 ± 4 |
|
Cholesterolc |
65 ± 15 |
51 ± 8 |
|
Phospholipidsc |
141 ± 22 |
123 ± 20 |
|
Apoprotein A-Ic |
142 ± 23 |
126 ± 19 |
|
Apoprotein A-IIc |
34 ± 6 |
31 ± 3 |
|
a From Knoop et al. (1985) with permission. b SD = Standard deviation. c Significant difference (p < .05) between lactating and nonlactating subjects. |
||
Not all the lactating women studied lost weight post partum; for example,
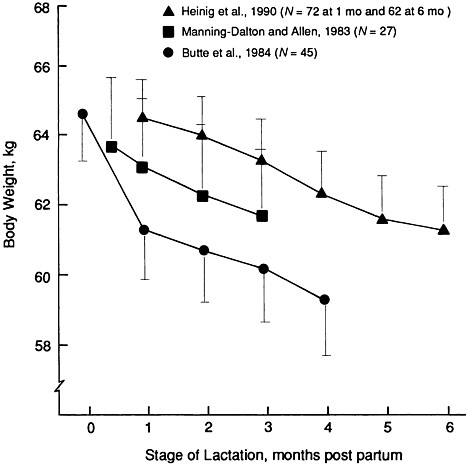
FIGURE 4-1 Change in maternal body weight during lactation. Means with standard error of the mean are illustrated.
in the study of Manning-Dalton and Allen (1983), 22% actually gained weight during breastfeeding. In an investigation of weight change in the 12 months after delivery among 1,423 Swedish women who attended maternity clinics, Öhlin and Rössner (1990) observed that lactation score (a measure of the intensity and duration of breastfeeding) was only very weakly (R = -.09) but significantly (p < .01) correlated with weight loss in this period. A stronger relationship between lactation score and weight loss was found between 2.5 and 6 months post partum. The authors concluded that ''lactation has no general clinical importance for post partum weight loss for the majority of women, and cannot be practically used as a predictor for weight development after delivery" (Öhlin and Rössner, 1990, p. 172).
TABLE 4-3 Anthropometric Measures of Nutritional Status for Healthy Nonpregnant, Nonlactating Women and for Lactating Women in the United States
|
|
Nonpregnant, Nonlactating Women |
Lactating Women |
||||
|
Measure of Nutritional Status |
Mean |
Reference |
Mean ± SDa |
Number of Subjects |
Stage of Lactation |
Reference |
|
Overall body size |
||||||
|
Weight (kg) |
62b |
Frisancho, 1984 |
63.7 ± 10.1 |
27 |
2 wk |
Manning-Dalton and Allen, 1983 |
|
|
|
|
63.1 ± 10.1 |
|
4 wk |
|
|
|
|
|
62.3 ± 10.3 |
|
8 wk |
|
|
|
|
|
61.7 ± 9.8 |
|
12 wkc |
|
|
|
|
|
61.3 ± 9.5 |
45 |
1 mo |
Butte and Garza, 1986 |
|
|
|
|
60.7 ± 10.0 |
|
2 mo |
|
|
|
|
|
60.2 ± 10.4 |
|
3 mo |
|
|
|
|
|
59.3 ± 10.5 |
|
4 mo |
|
|
Height (cm) |
163 |
Najjar and Rowland, 1987 |
163.0 ± 6.3 |
45 |
NA |
Butte and Garza, 1986 |
|
Body mass index (kg/m2) |
23.1 ± 4.7 SD |
Najjar and Rowland, 1987 |
23.0 ± 2.6 |
45 |
1 mo |
Butte and Garza, 1986 |
|
|
|
|
22.8 ± 2.8 |
|
2 mo |
|
|
|
|
|
22.5 ± 3.0 |
|
3 mo |
|
|
|
|
|
22.2 ± 3.0 |
|
4 mo |
|
|
Skinfold thickness (mm) |
||||||
|
Triceps |
23 |
Frisancho, 1984 |
19.8 ± 6.6 |
27 |
2 wk |
Manning-Dalton and Allen, 1983 |
|
|
|
|
21.1 ± 6.7 |
|
12 wkc |
|
|
|
|
|
16.9 ± 4.6 |
|
1 mo |
Butte and Garza, 1986 |
|
|
|
|
17.0 ± 4.7 |
45 |
2 mo |
|
|
|
|
|
17.3 ± 5.3 |
|
3 mo |
|
|
|
|
|
17.2 ± 5.2 |
|
4 mo |
|
|
Biceps |
NAd |
|
8.3 ± 5.2 |
27 |
2 wk |
Manning-Dalton and Allen, 1983 |
|
|
|
|
8.0 ± 4.9 |
|
12 wkc |
|
|
|
|
|
6.9 ± 3.2 |
45 |
1 mo |
Butte and Garza, 1986 |
|
|
|
|
6.9 ± 3.3 |
|
2 mo |
|
|
|
|
|
7.3 ± 4.6 |
|
3 mo |
|
|
|
|
|
6.8 ± 3.4 |
|
4 mo |
|
|
Subscapular |
16 |
Frisancho, 1984 |
20.6 ± 7.4 |
27 |
2 wk |
Manning-Dalton and Allen, 1983 |
|
|
|
|
18.0 ± 7.2 |
|
12 wkc |
|
|
|
|
|
16.8 ± 6.4 |
45 |
1 mo |
Butte and Garza, 1986 |
|
|
|
|
16.4 ± 7.4 |
|
2 mo |
|
|
|
|
|
15.7 ± 7.2 |
|
3 mo |
|
|
|
|
|
15.1 ± 7.3 |
|
4 mo |
|
|
Suprailiac |
NA |
|
29.4 ± 8.9 |
27 |
2 wk |
Manning-Dalton and Allen, 1983 |
|
|
|
|
25.3 ± 8.4 |
|
12 wkc |
|
|
|
|
|
25.7 ± 6.9 |
45 |
1 mo |
Butte and Garza, 1986 |
|
|
|
|
25.2 ± 7.6 |
|
2 mo |
|
|
|
|
|
23.1 ± 8.1 |
|
3 mo |
|
|
|
|
|
22.2 ± 8.0 |
|
4 mo |
|
|
Umbilical |
NA |
|
25.3 ± 7.4 |
27 |
2 wk |
Manning-Dalton and Allen, 1983 |
|
|
|
|
21.3 ± 6.9 |
|
12 wkc |
|
|
Circumference (cm) |
||||||
|
Upper arm |
27.7 |
Frisancho, 1981 |
27.4 ± 3.3 |
27 |
2 wk |
Manning-Dalton and Allen, 1983 |
|
|
|
|
28.1 ± 3.3 |
|
12 wkc |
|
|
|
|
|
26.7 ± 2.6 |
45 |
1 mo |
Butte et al., 1984 |
|
|
|
|
26.8 ± 3.2 |
|
2 mo |
|
|
|
|
|
26.6 ± 2.9 |
|
3 mo |
|
|
|
|
|
26.7 ± 2.6 |
|
4 mo |
|
|
Mid-thigh |
NA |
|
52.3 ± 5.3 |
27 |
2 wk; |
Manning-Dalton and Allen, 1983 |
|
|
|
|
52.6 ± 5.5 |
|
12 wkc |
|
|
Umbilical |
NA |
|
89.0 ± 8.3 |
27 |
2 wk |
Manning-Dalton and Allen, 1983 |
|
|
|
|
82.2 ± 9.1 |
|
12 wkc |
|
|
a SD = Standard deviation. b The 50th percentile for white women with medium frames, 64-in. tall, aged 25 to 54, derived from the combined data sets from the first and second National Health and Nutrition Examination Surveys (NHANES). c A total of 18% of subjects had ceased lactating at this time. d NA = Nationally representative data not available. |
||||||
Change in Skinfold Thickness Measurements During Lactation
In contrast to body weight, mean triceps skinfold thickness remained the same or increased only slightly in the U.S. women studied during lactation (Butte et al., 1984; Heinig et al., 1990; Manning-Dalton and Allen, 1983) (Table 4-3 and Figure 4-2) but was reported to increase dramatically in recent studies of Australian (Dugdale and Eaton-Evans, 1989) and Swedish (Forsum et al., 1989) women. The reason for this increase in triceps skinfold thickness while body weight is decreasing is not known. In Australian women, the increase was transient; it was greatest at 4 to 5 months post partum and decreased toward the 1-month post partum value thereafter. In Swedish women, the maximum had not been reached by 6 months post partum. This was not true for the other skinfold thicknesses examined in U.S. women; biceps, subscapular, and suprailiac skinfold thicknesses all decreased during the first 4 months post partum (see Figure 4-2). The relationship between the anthropometric changes that occur during lactation and long-term maternal health is discussed in Chapter 8.
USUAL DIETARY INTAKE DURING LACTATION
It is important to determine the usual dietary intake of lactating women because it is a major determinant of nutritional status and because most interventions designed to improve nutritional status try to improve dietary intake. The subcommittee reviewed the nationwide data on dietary intake among lactating women in the United States as well as data on dietary intake among less representative groups of lactating women. Its goal was to establish a firm basis for developing recommendations about future collection of dietary intake data on lactating women.
Several limitations were considered. First, dietary intake is but one of a number of determinants of nutritional status during lactation. Second, estimates of dietary intake in all free-living subjects are difficult and, depending on the method used, may be quite imprecise. Increasing either the number of records per subject or the number of subjects may improve the accuracy of the estimate. However, the studies found by the subcommittee had small sample sizes, and most of the studies were based on single 24-hour recalls or, at most, 7-day dietary records. Third, dietary intake estimates are only as accurate as the food composition data used. For nutrients such as folate, vitamin B6, and many trace elements, such data have often been unavailable or inaccurate. Thus, the subcommittee focused on identifying patterns of dietary intakes in groups of lactating women.
As is the case during pregnancy, one cannot assume a priori that dietary intake remains static during lactation. In fact, there are good reasons to assume that dietary intake changes because of various cultural beliefs, advice from
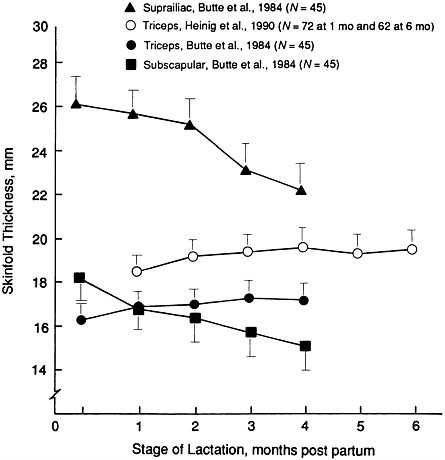
FIGURE 4-2 Change in maternal skinfold thickness during lactation. Means with standard error of the mean are illustrated.
health care providers or others, and changing energy requirements and appetite (related in part to changing needs of the infant and changes in activity patterns). Very few investigators have tried to examine the stability of dietary intake during lactation, and most such studies have lacked the statistical power to distinguish among intakes at various stages.
The extent of lactation (whether the infant is breastfed exclusively, most of the time, or only once or twice a day) may have a greater impact on dietary intake than the stage of lactation does. For example, at 4 months post partum, an exclusively breastfeeding woman has much greater energy and nutrient needs than a woman at the same stage of lactation who is only partially breastfeeding. Except for those studies expressly limited to exclusively breastfeeding women,
most investigators have neither commented upon nor adjusted for differences among their subjects in the extent of breastfeeding.
Current Recommendations for Dietary Intake Among Lactating Women
Lactating women in the United States receive nutritional advice from a variety of sources. The Recommended Dietary Allowances (RDAs) may reach women through their health care providers or through publications in the lay press. Other kinds of nutritional advice may also come from the lay press, organizations interested in promoting successful breastfeeding, or from friends and family members. Although all these sources of information may have an impact on the food intake by individual women, the subcommittee chose to focus on the RDAs.
The RDAs "are the levels of intake of essential nutrients that … are … adequate to meet the known nutrient needs of practically all healthy persons" (NRC, 1989, p. 10). For some nutrients, they are based partially on body size; the reference weights used in the 1989 edition are the medians for the U.S. population of the designated age and sex. The RDAs are to be achieved over time—"at least 3 days for nutrients that turn over rapidly" (NRC, 1989, p. 22) and longer for nutrients that turn over more slowly. Separate allowances have been established for the first and second 6 months of lactation, reflecting differences in the amount of milk produced (estimated to average 750 and 600 ml, respectively) (see Table 4-4).
Extent to Which Lactating Women in the United States Meet Current Recommendations
Data from Nationally Representative Samples
Only one study of food and nutrient intake has provided data on a nationally representative sample of lactating women in the United States (Krebs-Smith and Clark, 1989). Data from the basic survey portion of USDA's 1977-1978 Nationwide Food Consumption Survey were used to validate a nutrient adequacy score for women and children. Three days of food intake information (a 24-hour recall and a 2-day food record) were obtained in four seasons from a stratified area probability sample of households in the 48 conterminous states and the District of Columbia. All 85 lactating women in the Nationwide Food Consumption Survey sample were included in this analysis; the stage of lactation of these women was not reported. Using the 1980 RDAs (NRC, 1980), the authors calculated a dietary score as well as nutrient adequacy ratios1 for
selected nutrients and then used these to calculate two mean adequacy ratios,2 one for overall nutrient adequacy and the other to represent what the authors called "problem nutrients" (calcium, iron, magnesium, and vitamins A and C). Only 19% of the lactating women had both high nutrient adequacy ratios and high mean adequacy ratios.
Data from Nonrepresentative Samples
The subcommittee identified relatively recent studies (published since 1976) that presented dietary intake data on intakes of nutrients for which there is an RDA by lactating women in the United States. The characteristics of the study groups are summarized in Table 4-4, and the observed dietary intake values are summarized in Tables 4-5 and 4-6. Energy and nutrients commonly included in tables of food composition are presented in Table 4-5. All but one of the studies covered in Table 4-5 reported intake of energy and protein in addition to that of micronutrients. In most cases, studies reported in Table 4-6 were more limited in their overall assessment of nutrient intake. The values shown in Table 4-6 represent the intake of nutrients obtained from food sources only; in many cases, these are underestimates of total nutrient intake, because many of the women were ingesting various kinds of nutrient supplements. Dietary intake usually was quantified through food records kept by the subjects for 2 to 7 days.
The subcommittee's compilation shows that a disappointingly small number (only 361) of presumably well-nourished lactating women have been studied, and nearly all of them were well-educated Caucasians. Furthermore, there has been no consistency across studies in the stages of lactation at which the women were studied, and very few investigators collected longitudinal data on dietary intake. The longitudinal data reported are generally limited to the first few months of lactation. In no studies were dietary intake values from the same women compared during the first and second 6 months of lactation.
The mean values reported for intake of all nutrients shown in Table 4-5 were at least 80% of the 1989 RDAs and, in many cases, substantially exceeded these RDAs. However, there was considerable variability of nutrient intake within studies: most standard deviations ranged from one-half of the mean to more than the mean value, indicating large differences in intake among the women. The relatively high mean reported intakes of most of these nutrients were achieved despite fairly low reported energy intakes: at their highest (early in lactation), they were about 86% of the RDA. In general, "presumably well-nourished" women in these studies do, on average, appear to be receiving adequate intakes of the nutrients shown in Table 4-5. The high degree of
TABLE 4-4 Studies of Dietary Intake Among Lactating Women in the United States
|
Population Group and Reference |
Characteristics of Group Studied |
Number of Subjects |
Stage of Lactation |
Dietary Intake Method |
|
Well-nourished, adult women |
||||
|
Blackburn and Calloway, 1976 |
Mature women, mixed ethnic backgrounds, average socioeconomic status |
12 |
8–12 wk |
3-day record |
|
Sims, 1978 |
Mean age, 28 yr; 97% white; mean duration of education, 15.5 yr |
61 |
1–26 mo |
3-day record by mail survey |
|
Thomas and Kawamoto, 1979 |
Healthy women |
17 |
4–7 days and 42–45 days |
Initial 24-h recall, 3-day record |
|
Thomas et al., 1980 |
Permission obtained from their physician; no routine medication or recent use of oral contraceptives; no need for vitamin supplements |
12 |
6 mo |
4-day record |
|
Manning-Dalton and Allen, 1983 |
Age 23 to 27 yr, white, middle income, well educated |
27 |
2–12 wk |
24-h recall at each of five interviews |
|
Stuff et al., 1983 |
All married, Caucasian, non-Hispanic, nonsmoking, on no medications, healthy by history |
40 |
3 wk–6 mo |
7-day record |
|
Levander, et al., 1987 Moser and Reynolds, 1983 Reynolds et al., 1984 |
Healthy, upper middle class |
23 |
1 mo, 3 mo, 6 mo |
Duplicate plate food and drink composites, 3-day record |
|
Butte et al., 1984 |
Mean age, 28 yr; 91% Caucasian; mean duration of education, 15.4 yr |
45 |
1–4 mo |
Four 3-day records |
|
Song et al., 1985 |
Age, 20 to 35 yr; all Caucasian |
26 |
2 wk and 3 mo |
2-day record (checked with 24- and 48-h recalls) |
|
Strode et al., 1986 |
Mean age, 30 yr |
14 |
6–24 wk |
Two 7-day records (1 wk apart) |
|
Teenagers |
||||
|
Lipsman et al., 1985 |
Age, 14 to 20 yr; mixed ethnic backgrounds; 56% WICa participants; 72% receiving AFDCb |
25 |
1–6 mo |
24-h recall, one to nine recalls per subject |
|
Vegetarians |
||||
|
Finley et al., 1985 |
Mean age, 29 yr; 60% college graduates |
29 (those who consumed no meat or poultry) |
2–18 mo |
24-h recall and 2-day record; food frequency questionnaire administered twice |
|
American Indian |
||||
|
Butte et al., 1981 |
Navajos on reservation; mean age, 22.4 yr; mean duration of education, 10.6 yr |
23 |
1 mo |
24-h recall, food habits and beliefs questionnaire |
|
Low-income women |
||||
|
Sneed et al., 1981 |
Recruited from WIC program; low socioeconomic status determined subjectively from home visits and personal information; age, 18 to 32 yr; no recent use of oral contraceptives |
7 |
5–6 days and 43–45 days |
4-day record |
|
a WIC = Special Supplemental Food Program for Women, Infants and Children. b AFDC = Aid to Families with Dependent Children. |
||||
TABLE 4-5 Reported Mean Daily Intake of Energy and Selected Nutrients by Lactating Women in the United States Compared with Recommended Dietary Allowances (RDAs)a
|
|
|
|
Mean Daily Intake |
|||||||||
|
RDA, Population Group, and Reference |
Months Post Partum |
Sample Size |
Energy, kcal ± SDb |
Protein, g ± SD |
Calcium, mg ± SD |
Phosphorus, mg ± SD |
Iron, mg ± SD |
Vitamin A, IUc ± SD |
Thiamin, mg ± SD |
Riboflavin, mg ± SD |
Niacin, mg ± SD |
Ascorbic acid, mg ± SD |
|
RDAs |
||||||||||||
|
NRC, 1989 |
0–6 |
NAd |
65 |
1,200 |
1,200 |
15 |
1,200g |
1.6 |
1.8 |
20 |
95 |
|
|
|
6–12 |
NA |
2,700 |
62 |
1,200 |
1,200 |
15 |
1,200 |
1.6 |
1.7 |
20 |
90 |
|
Well-nourished, adult women |
||||||||||||
|
Blackburn and Calloway, 1976 |
Mixed |
12 |
1,800 ± 454 |
85 NA |
NRh |
NR |
NR |
NR |
NR |
NR |
NR |
NR |
|
Sims, 1978 |
||||||||||||
|
Group 1i |
Mixed |
50 |
2,141 ± 578 |
94 ± 23 |
1,298 ± 478 |
NA |
14.4 ± 5.5 |
6,837 ± 5,686 |
1.56 ± 0.96 |
2.41 ± 0.86 |
17.6 ± 7.7 |
145 ± 84 |
|
Group 2j |
Mixed |
11 |
2,076 ± 525 |
86 ± 27 |
1,066 ± 627 |
NA |
12.2 ± 2.8 |
6,319 ± 4,389 |
1.55 ± 0.89 |
2.04 ± 1.09 |
16.3 ± 2.6 |
108 ± 45 |
|
Thomas et al., 1980j |
6 |
6 |
NR |
NR |
NR |
NR |
NR |
NR |
1.49 ± 0.96 |
1.87 ± 0.95 |
NR |
131 ± 88 |
|
Moser and Reynolds, 1983 |
1 |
23 |
1,945 ± 99k |
78 ± 4k |
NR |
NR |
NR |
NR |
NR |
NR |
NR |
NR |
|
|
3 |
20 |
1,919 ± 110k |
86 ± 5k |
NR |
NR |
NR |
NR |
NR |
NR |
NR |
NR |
|
|
6 |
19 |
1,838 ± 106k |
76 ± 4k |
NR |
NR |
NR |
NR |
NR |
NR |
NR |
NR |
|
ManningDalton and Allen 1983l |
0.5 |
12 |
2,165 ± 757 |
95 ± 20 |
NR |
NR |
NR |
NR |
NR |
NR |
NR |
NR |
|
|
1 |
12 |
2,337 ± 593 |
87 ± 20 |
NR |
NR |
NR |
NR |
NR |
NR |
NR |
NR |
|
|
2 |
12 |
1,951 ± 749 |
81 ± 30 |
NR |
NR |
NR |
NR |
NR |
NR |
NR |
NR |
|
|
3 |
12 |
2,171 ± 749 |
90 ± 27 |
NR |
NR |
NR |
NR |
NR |
NR |
NR |
NR |
|
Stuff et al., 1983 |
Mixed |
40 |
2,028 ± 357 |
84.5 ± 22.4 |
1,004 ± 413 |
1,385 ± 399 |
13.0 ± 3.0 |
NR |
NR |
NR |
NR |
NR |
|
Butte et al., 1984 |
1 |
43 |
2,334 ± 536 |
98 ± 28 |
1,219 ± 543 |
1,722 ± 553 |
16.2 ± 4.8 |
9,070 ± 5,920 |
1.9 ± 0.9 |
2.6 ± 1.1 |
23.6 ± 8.4 |
150 ± 90 |
|
|
2 |
44 |
2,125 ± 582 |
91 ± 23 |
1,030 ± 466 |
1,496 ± 456 |
14.1 ± 3.7 |
8,532 ± 5,341 |
1.5 ± 0.6 |
2.1 ± 0.7 |
20.3 ± 5.8 |
124 ± 89 |
|
|
3 |
40 |
2,170 ± 629 |
89 ± 25 |
1,024 ± 478 |
1,467 ± 459 |
13.9 ± 4.0 |
7,598 ± 4,807 |
1.5 ± 0.5 |
2.1 ± 0.8 |
20.5 ± 7.2 |
114 ± 81 |
|
|
4 |
40 |
2,092 ± 498 |
87 ± 20 |
1,009 ± 460 |
1,465 ± 434 |
13.5 ± 2.7 |
7,126 ± 3,775 |
1.5 ± 0.7 |
2.1 ± 0.8 |
20.2 ± 5.9 |
115 ± 56 |
|
Song et al., 1985 |
Mixed |
26m |
2,014 ± 620 |
79 ± 26 |
1,243 ± 595 |
1,446 ± 563 |
26 ± 24 |
9,627 ± 5,206 |
2.1 ± 1.1 |
2.8 ± 1.4 |
70 ± 90 |
199 ± 129 |
|
Strode et al., 1986 |
Mixed |
14 |
2,316 ± 240 |
108 ± 21 |
NR |
NR |
NR |
NR |
NR |
NR |
NR |
NR |
|
Teenagers |
||||||||||||
|
Lipsman et al., 1985 |
Mixed |
25 |
2,897 ± 699 |
115 ± 27 |
1,640 ± 601 |
2,005 ± 588 |
15.0 ± 3.8 |
5,995 ± 2,839 |
1.49 ± 0.44 |
2.88 ± 0.91 |
20.0 ± 5.0 |
156 ± 136 |
|
|
|
|
Mean Daily Intake |
|||||||||
|
RDA, Population Group, and Reference |
Months Post Partum |
Sample Size |
Energy, kcal ± SDb |
Protein, g ± SD |
Calcium, mg ± SD |
Phosphorus, mg ± SD |
Iron, mg ± SD |
Vitamin A, IUc ± SD |
Thiamin, mg ± SD |
Riboflavin, mg ± SD |
Niacin, mg ± SD |
Ascorbic acid, mg ± SD |
|
Vegetarians |
||||||||||||
|
Finley, 1985 |
Mixed |
29 |
2,158 ± 601 |
78 ± 28 |
1,303 ± 611 |
1,736 ± 605 |
16.8 ± 6.9 |
9,756 ± 6,149 |
1.80 ± 1.02 |
2.15 ± 0.91 |
15.4 ± 6.5 |
175 ± 137 |
|
American Indians |
||||||||||||
|
Butte and Calloway, 1981 |
1 |
23 |
2,190 ± 990 |
87 ± 38 |
718 ± 458 |
1,270 ± 559 |
15.2 ± 5.9 |
5,467 ± 10,002 |
1.39 ± 0.69 |
1.81 ± 1.07 |
20.1 ± 9.1 |
150 ± 165 |
|
a Nutrients listed in this table are those most commonly included in nutrient data bases. b SD = Standard deviation. c IU = International units. d NA = Not applicable. e Calculated as the recommended daily energy increment for lactation (500 kcal) plus the energy allowance for females 11 to 50 years of age (2,200 kcal). f Standard deviation not applicable to the RDA. g Units for the RDAs are micrograms of retinol equivalents (RE); this is equivalent to approximately 5 IU of vitamin A obtained from the typical U.S. diet in the form of retinol (from animal products) and carotenoids (from plants) (Olson, 1987). h NR = Not reported. i Women taking supplements; intake from food only. j Women taking no supplements. k Standard error of the mean. l Women in the study who averaged 95% lactation over the entire lactation period. m Given as N = 46 for 26 subjects studied twice. |
||||||||||||
variability is, however, of concern. Clearly, there were individuals within these samples whose dietary intake was either lower or much higher than the mean.
There is much less information concerning the adequacy of dietary intake of other micronutrients, as illustrated in Table 4-6. For example, iodine and vitamins E and K were omitted from the table because no relevant studies included them. Of the micronutrients reported in Table 4-6, vitamins B12, B6, and folate were the only ones studied by more than one group of investigators. The scant data do suggest closer examination of the adequacy of intake of folate and zinc, which were well below the 1989 RDAs in two studies, and of vitamin B6, which was consistently below the 1989 RDA. Clearly, research is needed to provide a more complete nutritional profile of lactating women.
Data from Various Population Groups
The subcommittee identified only two studies focusing on groups of lactating women defined by factors of culture, ethnic background, life-style, or religion. These were studies of American Indians (Butte and Calloway, 1981) and of vegetarians (Finley et al., 1985) (see Tables 4-5 and 4-6). Among American Indians, vitamin A intake was highly variable and intakes of calcium; magnesium; zinc; and vitamins D, E, and folate appeared to be low. Among all the studies for which results are shown in Table 4-5, mean protein intake was lowest in the vegetarian group but still exceeded the RDA. As expected, the mean vitamin A intake of the vegetarians was the highest. The subcommittee identified only one study of lactating teenagers (Lipsman et al., 1985) and none of lactating women over age 35. The teenagers were found to have mean dietary intakes that met or exceeded the 1989 RDAs (Table 4-5).
Data on the dietary intake of lactating women of low socioeconomic status were also difficult to find. The first national evaluation of the Special Supplemental Food Program for Women, Infants, and Children (WIC) included 179 postpartum women. Of these, less than 79% were breastfeeding at the time that dietary data were collected (at enrollment in WIC, approximately 12 weeks post partum; breastfeeding was a prerequisite for enrollment for most of these women); unfortunately, those maternal nutrient intake values were not presented separately by breastfeeding status (Edozien et al., 1976). In general, the dietary intakes of these women were much lower than the current RDAs. Dietary intake of vitamins B6, B12, and folate was assessed in seven low-income women recruited from a WIC program (Sneed et al., 1981) (Table 4-6). At two stages of lactation, their reported intakes of vitamin B6 were well below the RDA but were comparable to the values for the other groups included in these tables.
TABLE 4-6 Mean Daily Dietary Intakes of Selected Micronutrients by Lactating Women in the United States Compared with the Recommended Dietary Allowances (RDAs)a
|
|
|
Vitamin |
|
|
|
||||
|
Population Group and Reference |
Stage of Lactation |
D, µg ± SDb |
E, mg ± SD |
B6, mg ± SD |
B12, µg ± SD |
Folate, µg ± SD |
Magnesium, mg ± SD |
Zinc, mg ± SD |
Selenium, µg ± SD |
|
RDAs |
|||||||||
|
NRC, 1989 |
0-6 mo |
10c |
12 |
2.1 |
2.6 |
280 |
355 |
19 |
75 |
|
|
7-12 mo |
10 |
11 |
2.1 |
2.6 |
260 |
340 |
16 |
75 |
|
Well-nourished adult women |
|||||||||
|
Thomas and Kawamoto, 1979 |
4-7 days |
NRd |
NR |
1.69 ± 0.65 |
NR |
NR |
NR |
NR |
NR |
|
|
42-45 days |
NR |
NR |
1.11 ± 0.35 |
NR |
NR |
NR |
NR |
NR |
|
Thomas et al., 1980 |
6 mo |
NR |
NR |
1.13 ± 0.91 |
2.88 ± 2.29 |
194 ± 151 |
NR |
NR |
NR |
|
Levander et al., 1987; |
1 mo |
NR |
NR |
1.51 ± 0.11e |
NR |
NR |
NR |
9.4 ± 0.5e |
84 ± 4e |
|
Moser and Reynolds et al., 1983; |
3 mo |
NR |
NR |
1.55 ± 0.08e |
NR |
NR |
NR |
12.8 ± 1.8e |
84 ± 4e |
|
Reynolds et al., 1984 |
6 mo |
NR |
NR |
1.51 ± 0.11e |
NR |
NR |
NR |
9.6 ± 0.7e |
87 ± 4e |
|
American Indians |
|||||||||
|
Butte et al., 1981 |
NR |
136 ± 115f |
4.5 ± 3.8 |
1.44g |
7.96 ± 1.47 |
169 ± 139 |
221 ± 114 |
12.2 ± 5.3 |
NR |
|
Low-income women |
|||||||||
|
Sneed et al., 1981h |
5–7 days |
NR |
NR |
1.52 ± 0.40 |
7.0 ± 3.1 |
290 ± 100 |
NR |
NR |
NR |
|
|
43–45 days |
NR |
NR |
1.41 ± 0.56 |
5.2 ± 1.8 |
340 ± 200 |
NR |
NR |
NR |
|
a From NRC (1989). Details of the studies cited are given in Table 4-4. b SD = Standard deviation. c Standard deviation not applicable to RDA. d NR = Not reported. e Standard error of the mean. f Units are IU; 1 µg vitamin D = 40 IU. g Reported standard deviation is not included because of a suspected error. h Unsupplemented women. |
|||||||||
CONCLUSIONS
-
The nutritional status of lactating women in the United States has not been thoroughly or extensively studied; therefore, data are lacking on all aspects of this subject. The lactating subjects who have been studied (mainly Caucasian women with some college education) appear, in general, to be well nourished. Groups of U.S. women who are likely to have poor dietary intakes either tend not to breastfeed or if they do breastfeed, have not been studied extensively.
-
On average, lactating women who eat to appetite lose weight at the rate of 0.6 to 0.8 kg (1.3 to 1.6 lb) per month in the first 4 to 6 months of lactation, but there is wide variation in the weight loss experience of lactating women (some women gain weight during lactation). Those who continue breastfeeding beyond 4 to 6 months ordinarily continue to lose weight, but at a slower rate than during the first 4 to 6 months. Measurements of subscapular and suprailiac—but not triceps—skinfold thickness decrease during the first 4 to 6 months of lactation.
-
Until reference standards for nutritional status based on biochemical or anthropometric criteria have been developed for lactating women, there is not a sound basis for using standards derived from nonpregnant, nonlactating women in the routine care of healthy lactating women. If such standards are used in special situations, there is a risk of misclassification. To reduce misclassification, it would be appropriate to consider other factors (such as low socioeconomic status) that might increase the risk of an adverse outcome or factors (such as low weight for height) that might predict the likelihood of a benefit.
RECOMMENDATIONS FOR CLINICAL PRACTICE
-
Women who plan to breastfeed or who are breastfeeding should be given realistic, health-promoting advice about weight change during lactation (see also Chapters 5 and 9).
-
In the opinion of the subcommittee, it is not necessary to obtain measurements of skinfold thickness or to conduct laboratory tests as a part of the routine assessment of the nutritional status of lactating women because of the difficulty of obtaining accurate skinfold thickness measurements and the high expense of both types of measurements relative to the likelihood of identifying nutritional problems.
REFERENCES
Ala-Houhala, M., T. Koskinen, R. Mäki, and S. Rinkari. 1988. Serum vitamin A levels in mothers and their breastfed term infants with or without supplemental vitamin A. Acta Paediatr. Scand. 77:198-201.
Anderson, D.M., F.W.H. Elsley, and I. McDonald. 1970. Blood volume changes during pregnancy and lactation of sows. Q. J. Exp. Physiol. 55:293-300.
Andon, M.B., R.D. Reynolds, P.B. Moser-Veillon, and M.P. Howard. 1989. Dietary intake of total and glycosylated vitamin B6 and the vitamin B6 nutritional status of unsupplemented lactating women and their infants. Am. J. Clin. Nutr. 50:1050-1058.
Bates, C.J., A.M. Prentice, M. Watkinson, P. Morrell, B.A. Sutcliffe, F.A. Foord, and R.G. Whitehead. 1982. Riboflavin requirements of lactating Gambian women: a controlled supplementation trial. Am. J. Clin. Nutr. 35:701-709.
Blackburn, M.W., and D.H. Calloway. 1976. Energy expenditure and consumption of mature, pregnant and lactating women. J. Am. Diet. Assoc. 69:29-37.
Bond, C.F. 1958. Blood volume changes in the lactating rat. Endocrinology 63:285-289.
Brewer, M.M., M.R. Bates, and L.P. Vannoy. 1989. Postpartum changes in maternal weight and body fat depots in lactating vs nonlactating women. Am. J. Clin. Nutr. 49:259-265.
Brown, E., J.J. Sampson, E.O. Wheeler, B.F. Gundelfinger, and J.E. Giansiracusa. 1947. Physiologic changes in the circulation during and after obstetric labor. Am. Heart J. 34:311-333.
Butte, N.F., and D.H. Calloway. 1981. Evaluation of lactational performance of Navajo women. Am. J. Clin. Nutr. 34:2210-2215.
Butte, N.F., and C. Garza. 1986. Anthropometry in the appraisal of lactation performance among well-nourished women. Pp. 61-67 in M. Hamosh and A.S. Goldman, eds. Human Lactation 2: Maternal and Environmental Factors. Plenum Press, New York.
Butte, N.F., D.H. Calloway, and J.L. Van Duzen. 1981. Nutritional assessment of pregnant and lactating Navajo women. Am. J. Clin. Nutr. 34:2216-2228.
Butte, N.F., C. Garza, J.E. Stuff, E.O. Smith, and B.L. Nichols. 1984. Effect of maternal diet and body composition on lactational performance. Am. J. Clin. Nutr. 39:296-306.
Caton, W.L., C.C. Roby, D.E. Reid, R. Caswell, C.J. Maletskos, R.G. Fluharty, and J.G. Gibson II. 1951. The circulating red cell volume and body hematocrit in normal pregnancy and the puerperium: by direct measurement, using radioactive red cells. Am. J. Obstet. Gynecol. 61:1207-1217.
Dennis, K.J., and W.R. Bytheway. 1965. Changes in body weight after delivery. J. Obstet. Gynaecol. Br. Commonw. 72:94-102.
Donovan, J.C., C.J. Lund, and L. Whalen. 1964. Simultaneous determinations of blood volumes using Evans blue and sodium radiochromate. Surg. Gynecol. Obstet. 119:1031-1036.
Donovan, J.C., C.J. Lund, and E.L. Hicks. 1965. Effect of lactation on blood volume in the human female. Am. J. Obstet. Gynecol. 93:588-589.
Dostálová, L. 1984. Vitamin status during puerperium and lactation. Ann. Nutr. Metab. 28:385-408.
Dugdale, A.E., and J. Eaton-Evans. 1989. The effect of lactation and other factors on post-partum changes in body-weight and triceps skinfold thickness. Br. J. Nutr. 61:149-153.
Edozien, J.C., B.R. Switzer, and R.B. Bryan. 1976. Medical Evaluation of the Special Supplemental Food Program for Women, Infants, and Children (WIC), Vol. II: Results. Department of Nutrition, School of Public Health, University of North Carolina, Chapel Hill, N.C. 436 pp.
Ek, J. 1983. Plasma, red cell, and breast milk folacin concentrations in lactating women. Am. J. Clin. Nutr. 38:929-935.
Fåhraeus, L., U. Larsson-Cohn, and L. Wallentin. 1985. Plasma lipoproteins including high density lipoprotein subfractions during normal pregnancy. Obstet. Gynecol. 66:468-472.
Finley, D.A., K.G. Dewey, B. Lönnerdal, and L.E. Grivetti. 1985. Food choices of vegetarians and nonvegetarians during pregnancy and lactation. J. Am. Diet. Assoc. 85:678-685.
Forsum, E., A. Sadurskis, and J. Wager. 1989. Estimation of body fat in healthy Swedish women during pregnancy and lactation. Am. J. Clin. Nutr. 50:465-473.
Frisancho, A.R. 1981. New norms of upper limb fat and muscle areas for assessment of nutritional status. Am. J. Clin. Nutr. 34:2540-2545.
Frisancho, A.R. 1984. New standards of weight and body composition by frame size and height for assessment of nutritional status of adults and the elderly. Am. J. Clin. Nutr. 40:808-819.
Greene, G.W., H. Smiciklas-Wright, T.O. Scholl, and R.J. Karp. 1988. Postpartum weight change: how much of the weight gained in pregnancy will be lost after delivery? Obstet. Gynecol. 71:701-707.
Greer, F.R., R.C. Tsang, R.S. Levin, J.E. Searcy, R. Wu, and J.J. Steichen. 1982. Increasing serum calcium and magnesium concentrations in breastfed infants: longitudinal studies of minerals in human milk and in sera of nursing mothers and their infants. J. Pediatr. 100:59-64.
Habicht, J.-P., and D.L. Pelletier. 1990. The importance of context in choosing nutritional indicators. J. Nutr. 120:1519-1524.
Heinig, M.J., L.A. Nommsen, and K.G. Dewey. 1990. Lactation and postpartum weight loss. FASEB J. 4:362 (abstract).
Herbert, V.D., and N. Colman. 1988. Folic acid and vitamin B12. Pp. 388-416 in M.E. Shils and V.R. Young, eds. Modern Nutrition in Health and Disease. Lea & Febiger, Philadelphia.
Illingworth, P.J., R.T. Jung, P.W. Howie, P. Leslie, and T.E. Isles. 1986. Diminution in energy expenditure during lactation. Br. Med. J. 292:437-441.
IOM (Institute of Medicine). 1990. Nutrition During Pregnancy: Weight Gain and Nutrient Supplements. Report of the Subcommittee on Nutritional Status and Weight Gain During Pregnancy, Subcommittee on Dietary Intake and Nutrient Supplements During Pregnancy, Committee on Nutritional Status During Pregnancy and Lactation, Food and Nutrition Board. National Academy Press, Washington, D.C. 468 pp.
Kinney, T.D., and R.H. Follis, Jr., eds. 1958. Nutritional disease. Fed. Proc., Fed. Am. Soc. Exp. Biol. 17 Suppl. 2:1-56.
Knopp, R.H., C.W. Walden, P.W. Wahl, R. Bergelin, M. Chapman, S. Irvine, and J.J. Albers. 1985. Effect of postpartum lactation on lipoprotein lipids and apoproteins. J. Clin. Endocrinol. Metab. 60:542-547.
Krebs, N.F., K.M. Hambidge, M.A. Jacobs, and J.O. Rasbach. 1985. The effects of a dietary zinc supplement during lactation on longitudinal changes in maternal zinc status and milk zinc concentrations. Am. J. Clin. Nutr. 41:560-570.
Krebs-Smith, S.M., and L.D. Clark. 1989. Validation of a nutrient adequacy score for use with women and children. J. Am. Diet. Assoc. 89:775-783.
Levander, O.A. 1988. Selenium, chromium, and manganese. (A) Selenium. Pp. 263-267 in M.E. Shils and V.R. Young, eds. Modern Nutrition in Health and Disease. Lea & Febiger, Philadelphia.
Levander, O.A., P.B. Moser, and V.C. Morris. 1987. Dietary selenium intake and selenium concentrations of plasma, erythrocytes, and breast milk in pregnant and postpartum lactating and nonlacting women. Am. J. Clin. Nutr. 46:694-698.
Lipsman, S., K.G. Dewey, and B. Lönnerdal. 1985. Breastfeeding among teenage mothers: milk composition, infant growth, and maternal dietary intake. J. Pediatr. Gastroenterol. Nutr. 4:426-434.
LSRO (Life Sciences Research Office). 1989. Nutrition Monitoring in the United States: An Update Report on Nutrition Monitoring. Prepared for the U.S. Department of Agriculture and the U.S. Department of Health and Human Services. DHHS Publ. No. (PHS) 89-1225. U.S. Government Printing Office, Washington, D.C.
MLI (Metropolitan Life Insurance). 1959. New weight standards for men and women. Stat. Bull. Metrop. Life Insur. Co. 40:1-4.
MLI (Metropolitan Life Insurance). 1983. 1983 Metropolitan height and weight tables. Stat. Bull. Metrop. Life Found. 64:3-9.
Mannan, S., and M.F. Picciano. 1987. Influence of maternal selenium status on human milk selenium concentration and glutathione peroxidase activity. Am. J. Clin. Nutr 46:95-100.
Manning-Dalton, C., and L.H. Allen. 1983. The effects of lactation on energy and protein consumption, postpartum weight change and body composition of well nourished North American women. Nutro. Res. 3:293-308.
McCormick, D.B. 1988. Vitamin B6. Pp. 376-382 in M.E. Shils and V.R. Young, eds. Modern Nutrition in Health and Disease. Lea & Febiger, Philadelphia.
Moore, M.E.C., J.R. Moran, and H.L. Greene. 1984. Zinc supplementation in lactating women: evidence for mammary control of zinc secretion. J. Pediatr. 105:600-602.
Moser, P.B., and R.D. Reynolds. 1983. Dietary zinc intake and zinc concentrations of plasma, erythrocytes, and breast milk in antepartum and postpartum lactating and nonlactating women: a longitudinal study. Am. J. Clin. Nutr. 38:101-108.
Motil, K.J., C.M. Montandon, D.L. Hachey, T.W. Boutton, P.D. Klein, and C. Garza. 1989. Whole-body protein metabolism in lactating and nonlactating women. J. Appl. Physiol. 66:370-376.
Motil, K.J., C.M. Montandon, M. Thotathuchery, and C. Garza. 1990. Dietary protein and nitrogen balance in lactating and nonlactating women. Am. J. Clin. Nutr. 51:378-384.
Najjar, M.F., and Rowland, M. 1987. Anthropometric Reference Data and Prevalence of Overweight, United States, 1976-80. Vital and Health Statistics. Series 11, No. 238. DHHS Pub. No. (PHS) 87-1688. Public Health Service. U.S. Department of Health and Human Service, Government Printing Office, Washington, D.C.
NRC (National Research Council). 1978. Laboratory Indices of Nutritional Status in Pregnancy. Report of the Committee on Nutrition of the Mother and Preschool Child, Food and Nutrition Board. National Academy of Sciences, Washington, D.C. 195 pp.
NRC (National Research Council). 1980. Recommended Dietary Allowances, 9th ed. Report of the Committee on Dietary Allowances, Food and Nutrition Board, Division of Biological Sciences, Assembly of Life Sciences. National Academy Press, Washington, D.C. 185 pp.
NRC (National Research Council). 1989. Recommended Dietary Allowances, 10th ed. Report of the Subcommittee on the Tenth Edition of the RDAs, Food and Nutrition Board, Commission on Life Sciences. National Academy Press, Washington, D.C. 284 pp.
Öhlin, A., and Rössner. 1990. Maternal body weight development after pregnancy. Int J. Obes. 14:159-173.
Olson, J.A. 1987. Recommended dietary intakes (RDI) of vitamin A in humans. Am. J. Clin. Nutr. 45:704-716.
Prentice, A.M., S.B. Roberts, A. Prentice, A.A. Paul, M. Watkinson, A.A. Watkinson, and R.G. Whitehead. 1983. Dietary supplementation of lactating Gambian women. I. Effect on breast-milk volume and quality. Hum. Nutr.: Clin. Nutr. 37C:53-64.
Rasmussen, K.M. 1988. Maternal nutritional status and lactational performance. Clin. Nutr. 7:147-155.
Rasmussen, K.M., and J.P. Habicht. 1989. Malnutrition among women: indicators to estimate prevalence. Food Nutr. Bull. 11:29-37.
Reynolds, M. 1953. Measurement of bovine plasma and blood volume during pregnancy and lactation. Am. J. Physiol. 175:118-122.
Reynolds, R.D., M. Polansky, and P.B. Moser. 1984. Analyzed vitamin B-6 intakes of pregnant and postpartum lactating and nonlactating women. J. Am. Diet. Assoc. 84:1339-1344.
Rothe, G.E. 1988. Determinants of response to supplementation in malnourished Guatemalan children. M.S. Thesis. Cornell University, Ithaca, N.Y. 178 pp.
Sadurskis, A., N. Kabir, J. Wager, and E. Forsum. 1988. Energy metabolism, body composition, and milk production in healthy Swedish women during lactation. Am. J. Clin. Nutr. 48:44-49.
Salmenperä, L. 1984. Vitamin C nutrition during prolonged lactation: optimal in infants while marginal in some mothers. Am. J. Clin. Nutr. 40:1050-1056.
Salmenperä, L., J. Perheentupa, and M.A. Siimes. 1986. Folate nutrition is optimal in exclusively breastfed infants but inadequate in some of their mothers and in formula-fed infants. J. Pediatr. Gastroenterol. Nutr. 5:283-289.
Sims, L. 1978. Dietary status of lactating women. I. Nutrient intake from food and from supplements. J. Am. Diet. Assoc. 73:139-146.
Sneed, S.M., C. Zane, and M.R. Thomas. 1981. The effects of ascorbic acid, vitamin B6, vitamin B12, and folic acid supplementation on the breast milk and maternal nutritional status of low socioeconomic lactating women. Am. J. Clin. Nutr. 34:1338-1346.
Solomons, N.W. 1988. Zinc and copper. Pp. 238-262 in M.E. Shils and V.R. Young, eds. Modern Nutrition in Health and Disease. Lea & Febiger, Philadelphia.
Song, W.O., B.W. Wyse, and R.G. Hansen. 1985. Pantothenic acid status of pregnant and lactating women. J. Am. Diet. Assoc. 85:192-198.
Specker, B.L., D. Miller, E.J. Norman, H. Greene, and K.C. Hayes. 1988. Increased urinary methylmalonic acid excretion in breastfed infants of vegetarian mothers and identification of an acceptable dietary source of vitamin B12. Am. J. Clin. Nutr. 47:89-92.
Strode, M.A., K.G. Dewey, and B. Lönnerdal. 1986. Effects of short-term caloric restriction on lactational performance of well-nourished women. Acta Paediatr. Scand. 75:222-229.
Stuff, J.E., C. Garza, E.O. Smith, B.L. Nichols, and C.M. Montandon. 1983. A comparison of dietary methods in nutritional studies. Am. J. Clin. Nutr. 37:300-306.
Tarvydas, H., S.M. Jordan, and E.H. Morgan. 1968. Iron metabolism during lactation in the rabbit. Br. J. Nutr. 22:565-573.
Taylor, D.J., and T. Lind. 1979. Red cell mass during and after normal pregnancy. Br. J. Obstet. Gynaecol. 86:364-370.
Thomas, M.R., and J. Kawamoto. 1979. Dietary evaluation of lactating women with or without vitamin and mineral supplementation. J. Am. Diet. Assoc. 74:669-672.
Thomas, M.R., S.M. Sneed, C. Wei, P.A. Nail, M. Wilson, and E.E. Sprinkle III. 1980. The effects of vitamin C, vitamin B6, vitamin B12, folic acid, riboflavin, and thiamin on the breast milk and maternal status of well-nourished women at 6 months postpartum. Am. J. Clin. Nutr. 33:2151-2156.
Tietz, N.W. 1986. Textbook of Clinical Chemistry. W.B. Saunders Company. Philadelphia. 1919 pp.
van der Elst, C.W., W.S. Dempster, D.L. Woods, and H. de V. Heese. 1986. Serum zinc and copper in thin mothers, their breast milk and their infants. J. Trop. Pediatr. 32:111-114.
Wong, W.W., N.F. Butte, E.O. Smith, C.Garza, and P.D. Klein. 1989. Body composition of lactating women determined by anthropometry and deuterium dilution. Br. J. Nutr. 61:25-33.
Young, D.S. 1987. Implementation of SI units for clinical laboratory data. Style specifications and conversion tables. Published errata appear in Ann. Intern. Med. 1987 Aug;107(2):265 and 1989 Feb 15;110(4):328. Ann. Intern. Med. 106:114-129.


