
Appendix H
Expert Judgment Technique
The method chosen by the committee to corroborate its findings is a rating technique based on expert judgments. This process functioned as an aid in finalizing the committee's conclusions, encouraging committee members to synthesize disparate information and make difficult choices. The committee already had reached general agreement on the preferred designs and the justifications, but the rating process provided a means of clarifying these ideas and offered a degree of quantitative support for the overall consensus.
The rating, it must be emphasized, represents a compilation of the committee members' individual conclusions and a check on the consensus. It was not a decision-making tool, but rather illustrative of the process. Fortunately, the ratings results generally reflected the same general conclusions indicated by the pollution-effectiveness study (detailed generally in Chapter 5): No one design is clearly superior, and none is a panacea for the oil spill problem.
METHODOLOGY OVERVIEW
The rating method made use of a matrix, which relates the alternative designs and design combinations (plus the reference or base case design) to important performance attributes. Ten attributes were used, including performance in four major accident scenarios, susceptibility and containment of fires/explosions, structural failure, salvageability, personnel safety, and cost. A typical expert-judgment rating matrix is shown in Figure H-1.
Each committee member (''expert") contributed a set of ratings, assigning a value for each attribute of each design. Each committee member also
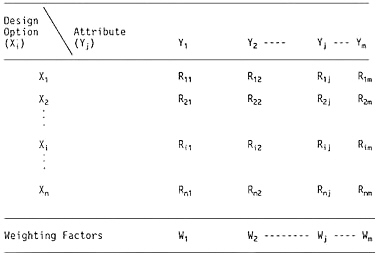
FIGURE H-1 Typical rating matrix.
assigned a weighting factor to each attribute, according to its judged importance; the same set of weighting factors was used for all design options. For each expert, attribute ratings then were combined, to estimate an overall rating for each design option. Finally, all of the expert judgments were aggregated, by arithmetic averaging. The computing process was facilitated by use of spreadsheet software.
To provide additional perspective, a sensitivity analysis was conducted, using ratings values and methodology that were identical in every way except that all of the attributes were assigned equal weighting factors (importance).
RULES FOR THE EXPERT JUDGMENTS
The first step was to design the rating matrix, which includes the important performance attributes discussed by the committee. The matrix, which was designed during a committee meeting, is shown in Figure H-2. The nine design options (X1, X2, … X9) and 10 attributes (Y1, Y2, … Y10) are described in Table H-1. (All of the options and attributes have been discussed previously in this report.) Each expert thus provided a total of 90 ratings, or best estimates.
The rules for the rating system were as follows:
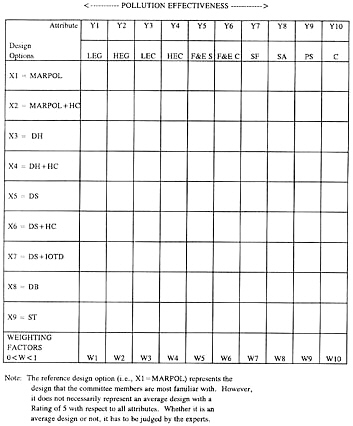
FIGURE H-2 Rating matrix used in the decision analysis.
-
Ratings could be any whole number from 1 to 9, where 1 was the least desirable (lowest rated) design option with respect to the attribute in question, and 9 was the most desirable (most highly rated). Thus, for the cost attribute, 1 represents the most costly design option, and 9 the least expensive. For personnel safety, 1 represents the least safe option, and 9 the safest.
-
For each attribute, at least one option had to be assigned a 1, and at least one option had to be assigned a 9. This ensured a broad range of ratings, such that any differences among the design alternatives would stand out.
TABLE H-1 Descriptions of Design Options and Attributes
|
Design Option Descriptions: |
|
X1 = MARPOL Ship |
|
X2 = MARPOL + HC = MARPOL ship & hydrostatic control |
|
X3 = DH = double hull |
|
X4 = DH + HC = double hull & hydrostatic control |
|
X5 = DS = double sides |
|
X6 = DS + HC = double sides & hydrostatic control |
|
X7 = DS + IOTD = double sides & intermediate oil-tight deck |
|
X8 = DB = double bottom |
|
X9 = ST = small tanks |
|
Attributes Descriptions: |
|
Y1 = LEG = low-energy groundings |
|
Y2 = HEG = high-energy groundings |
|
Y3 = LEC = low-energy collisions |
|
Y4 = HEC = high-energy collisions |
|
Y5 = F&E S. = fires and explosions (susceptibility) |
|
Y6 = F&E C. = fires and explosions (containment) |
|
Y7 = SF = structural failures |
|
Y8 = SA = salvageability |
|
Y9 = PS = personnel safety |
|
Y10 = C = cost |
-
If attributes were judged to be of unequal importance, then an estimated weighting factor between 0 and 1 (a fraction) was assigned to each attribute. The higher the weighting factor, the more important the attribute, relative to the others listed. If attributes were judged equal in importance, then no weighting factor was assigned. The conditions are:
In summary, for the design options, 1 represents the worst rating, 2-4 poor ratings, 5 an average rating, 6-8 good ratings, and 9 the best rating. For each attribute, a weighting factor at or near zero indicates low relative importance, while a higher weighting factor indicates greater importance.
Two important assumptions were made regarding the double-bottom, double-side, and double-hull designs: 1) mandatory minimum outside hull thickness, and 2) mandatory minimum/maximum spacing between hulls. The significance of these factors was discussed in Chapter 4.
DATA ANALYSIS METHOD
The expert judgment estimates for each rating, Rijk (for ith design option, jth attribute, and kth expert), and each weighting factor, Wjk (for jth at
tribute given by kth expert), were entered into a PC-based spreadsheet. The ratings for various attributes were combined, to estimate each expert's overall rating for each design option. Mathematically, this process is expressed as:
m = number of attributes
Finally, the expert judgment estimates were aggregated, to find order in the series of collective ratings for the various designs. The arithmetic averaging method was used. Mathematically, this can be expressed as:
K = number of experts
This process produced the combined final results. For sensitivity analysis, all of the calculations were repeated with equal weighting factors of 0.1.
The range of the 12 expert inputs on ratings and weighting factors, for each attribute for all of the design options, is shown in Table H-2.
As part of the learning process for committee members unfamiliar with the expert judgment rating method, and to achieve some consistency in methodology, the entire rating process (inputs and calculations) was conducted three times. The third round of inputs, the results of which are included here, was provided independently by each committee member.
RESULTS AND CONCLUSIONS
The individual average ratings given by all 12 experts were averaged to produce aggregate ratings for the various design options. The first analysis included the weighting factors assigned by each expert, and the sensitivity analysis was conducted with equal weighting factors of 0.1. Based on the aggregate ratings, the design options were ranked with respect to desirability. The results are shown in Table H-3 (with weighting factors) and Table H-4 (with equal weighting factors). The rank order changed only slightly in the sensitivity analysis. The principal conclusions are as follows:
-
The design options tended to cluster into three groupings. The most desirable overall (from Table H-3) were the double hull with hydrostatic control, the double hull, double sides with intermediate oil-tight deck and double sides with hydrostatic control. The other four options were deemed somewhat less desirable.
-
The differences within each grouping should be viewed as marginal. However, with the help of the weighting factors, the experts expressed a slight preference for the two double-hull options. Of these, the double-hull with hydrostatic control was viewed as the most desirable.
TABLE H-2 Range of Inputs to Rating Matrix by Experts
-
None of the designs was judged to be clearly superior. This seems to corroborate the results of the pollution-effectiveness study detailed in Chapter 5.
-
The lowest rated design was the reference design, the existing MARPOL vessel. This appears to confirm that existing design standards should be upgraded.
NOTES ON THE RATING METHOD
The results of the matrix rating method confirmed what committee members already sensed, apparently fulfilling the stated purpose of clarifying and corroborating the conclusions. However, several limitations of the process, which of course reflect judgment rather than fact, should be noted.
First, as stated earlier, the ratings represent expert estimates, rather than precise actual values. The credibility of the ratings rests on the expert qualifications of committee members and on the information provided and available to the committee.
Second, committee members may have arrived at their ratings by different routes. Some may have assigned values in a more systematic way, and the degree to which their minds were made up may have varied. As the same directions were given to each committee member, this is a reflection of personal style. The differing degrees of expertise in some areas was surely a factor, and differences in interpretation likely contributed as well. At the same time, the diversity of the committee may have been a positive influence on the overall outcome; the committee was structured deliberately to provide a balance of viewpoints, with the aim of arriving at a collective opinion that was as close to objective as possible.
BACKGROUND MATERIAL
Electric Power Research Institute. 1986. Seismic Hazard Methodology for the Central and Eastern United States, Vol. 1: Methodology. Palo Alto, Calif.: EPRI. NP-4726.
Keeney, R.L., and D. Von Winderfeldt. 1988. Probabilities are Useful to Quantify Expert Judgments. Reliability Engineering and System Safety 23(4):293-298.
National Research Council. 1981. Reducing Tankbarge Pollution. Washington, D.C.: National Academy Press.
Ortiz, N. R., T. A. Wheeler, R. L. Keeney, and M. A. Meyer. 1989. Use of Expert Judgment in NUREG-1150. Paper presented at American Nuclear Society/European Nuclear Society International Topical Meeting on Probability, Reliability, and Safety Assessment, Pittsburgh, Pennsylvania, April 1989.


