


Below is the uncorrected machine-read text of this chapter, intended to provide our own search engines and external engines with highly rich, chapter-representative searchable text of each book. Because it is UNCORRECTED material, please consider the following text as a useful but insufficient proxy for the authoritative book pages.
v INORGANIC S^e ~ ITS. TRACE METALS Trace metals may be present in natural groundwater or surface water. The sources of these trace metals are associated with either natural processes or man's activities. Two important natural processes contribut- ing trace metals to natural water are chemical weathering and soil leaching. The factors affecting the release of trace metals from primary materials and soil and their solution and stability in water are solubility, pH, adsorption characteristics, hydration, coprecipitation, colloidal dispersion, and the formation of complexes. Decaying vegetation can also affect the concentration of trace metals in water. Many plants are known to concentrate various elements selectively. As a result, trace metals may become available during the decay of the plants. Thus, the penetration and movement of rainwater through soil may pick up these available trace metals and affect the groundwater resource. Likewise, runoff resulting from rainfall may transport trace metals to surface-water. Mining and manufacturing are other important sources of trace metals in natural waters. Several operations associated with the mining of coal and mineral ores can lead to the discharge of wastewater contaminated with trace metals or to the accumulation of spoiled material, which may be leached of trace metals by rainfall and reach either surface or groundwater. The discharge of industrial wastewater, such as that generated by plating and metal-finishing operations, may also be the source of trace metals in natural water. 205
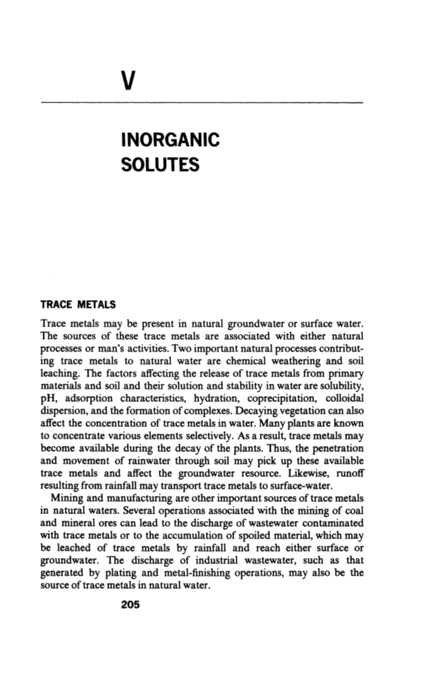
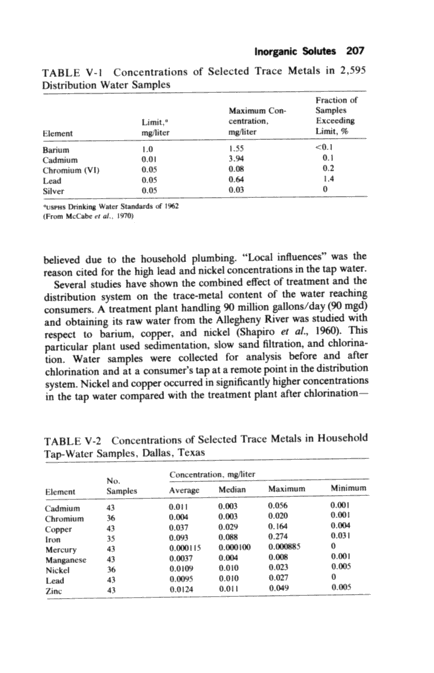
206 DRINKING WATER AND H"LTH The treatment of raw surface or groundwater to make it acceptable for public consumption may include the removal of trace metals. However, trace metals may be added to water as a result of the treatment and the subsequent distribution throughout a community. Depending on the quality of the raw water and the quality desired in the finished (treated) water, treatment may involve the use of chemicals, such as alum (aluminum sulfate), lime, and iron salts. The chemicals used are usually of commercial or technical grade with no exact composition, although the American Water Works Association has established standards for most chemicals used in the treatment of water supplies. Because of the possibility of impurities in the chemicals, it is conceivable that trace metals may be added to the water during treatment. A chemical itself, such as alum, may also contribute to the trace metal content of the finished water, depending on its solubility and the characteristics of the water. The occurrence of corrosion in the distribution system may also add trace metals to finished water before it reaches the consumer. Common piping materials used in distribution systems are iron, steel, cement (reinforced concrete), asbestos cement, and plastic. Lead, copper, zinc, aluminum, and such alloys as brass, bronze, and stainless steel may also be used in addition to ferrous metals in pumps, small pipes, valves, and other appurtenances. Trace metals may be contributed to the water through corrosion products or simply by solution of small amounts of metals with which the water comes in contact. 1 0 1 ~ ~ - ~ Trace Metals in Water Samples Collected in the Distribution System or at Household Taps The concentration of trace metals in water collected in the distribution system or at household taps is more relevant with respect to the quality of water being consumed by the public than is the raw water. The data in Table V-1, taken from the community water supply survey involving 969 public water supplies, indicate the levels of several selected elements in water samples collected in distribution systems. Chromium and silver were present in microgram quantities, while cadmium, lead, and barium were found to be in the milligram range (McCabe et al., 1970~. The results of analyzing a number of tap-water samples, collected at homes in Dallas, Texas, for trace metals are given in Table V-2. In the unpublished report from which these data were taken, it was speculated that the high iron concentration was due to the use of steel water mains in the distribution system, whereas the high manganese concentration was the result of accumulation of sandy sediment in the distribution system. The high copper and zinc concentrations in the water samples were
Inorganic Solutes 207 TABLE V-1 Concentrations of Selected Trace Metals in 2,595 Distribution Water Samples Fraction of Maximum Con- Samples Limit,a centration, Exceeding Element mg/liter mg/liter Limit, No Barium 1.0 1.55 <0.1 Cadmium 0.01 3.94 0.1 Chromium (VI) 0.05 0.08 0.2 Lead 0.05 0.64 1.4 Silver 0.05 0.03 0 aUSPHS Dnnking Water Standards of 1962 (From McCabe et al., 1970) believed due to the household plumbing. "Local influences" was the reason cited for the high lead and nickel concentrations in the tap water. Several studies have shown the combined eject of treatment and the distribution system on the trace-metal content of the water reaching consumers. A treatment plant handling 90 million gallons/day (90 mad) and obtaining its raw water from the Allegheny River was studied with respect to barium, copper, and nickel (Shapiro et al., 1960~. This particular plant used sedimentation, slow sand filtration, and chlor~na- tion. Water samples were collected for analysis before and after chlorination and at a consumer's tap at a remote point in the distribution system. Nickel and copper occurred in significantly higher concentrations in the tap water compared with the treatment plant after chlorination TABLE V-2 Concentrations of Selected Trace Metals in Household Tap-Water Samples, Dallas, Texas N Concentration, mg/liter Element Samples Average Median Maximum Minimum Cadmium 43 0.011 0.003 0.056 0.001 Chromium 36 0.004 0.003 0.020 0.001 Copper 43 0.037 0.029 0.164 0.004 Iron 35 0.093 0.088 0.274 0.031 Mercury 43 0.000115 0.000100 0.000885 0 Manganese 43 0.0037 0.004 0.008 0.001 Nickel 36 0.0109 0.010 0.023 0.005 Lead 43 0.0095 0.010 0.027 0 Zinc 43 0.0124 0.011 0.049 0.005
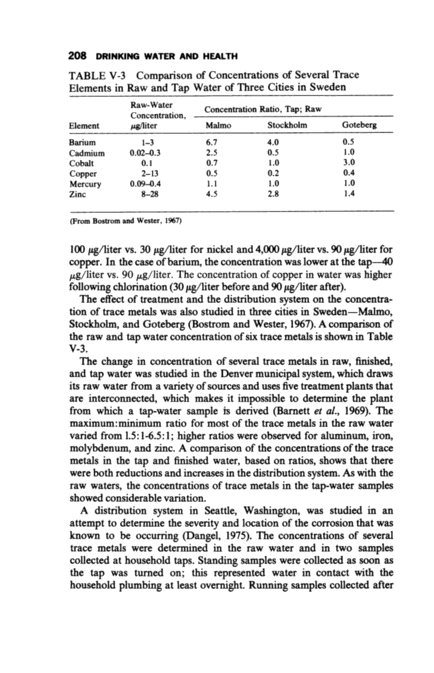
208 DRINKING WATER AND H"LTH TABLE V-3 Comparison of Concentrations of Several Trace Elements in Raw and Tap Water of Three Cities in Sweden Raw-Water Concentration, Element Halites Malmo Concentration Ratio, Tap; Raw Stockholm Goteberg Barium 1-3 6.7 4.0 0.5 Cadmium 0.02~.3 2.5 0.5 1.0 Cobalt 0.1 0.7 1.0 3.0 Copper 2-13 0.5 0.2 0.4 Mercury 0.09~.4 1.1 1.0 1.0 Zinc 8-28 4.5 2.8 1.4 (From Bostrom and Wester, 1967) 100 ,ug/liter vs. 30 ,ug/liter for nickel and 4,000 ,ug/liter vs. 90 ,ug/liter for copper. In the case of barium, the concentration was lower at the tap 40 ,ug/liter vs. 90 ,ug/liter. The concentration of copper in water was higher following chlorination (30 ,ug/liter before and 90 ,ug/liter after). The effect of treatment and the distribution system on the concentra- tion of trace metals was also studied in three cities in Sweden Mahno, Stockholm, and Goteberg (Bostrom and Wester, 1967~. A comparison of the raw and tap water concentration of six trace metals is shown in Table V-3. The change in concentration of several trace metals in raw, finished, and tap water was studied in the Denver municipal system, which draws its raw water from a variety of sources and uses five treatment plants that are interconnected, which makes it impossible to determine the plant from which a tap-water sample is derived (Barrett et al., 1969~. The maximum: minimum ratio for most of the trace metals in the raw water varied from 1.5: 1-6.5: 1; higher ratios were observed for aluminum, iron, molybdenum, and zinc. A comparison of the concentrations of the trace metals in the tap and finished water, based on ratios, shows that there were both reductions and increases in the distribution system. As with the raw waters, the concentrations of trace metals in the tap-water samples showed considerable variation. A distribution system in Seattle, Washington, was studied in an attempt to determine the severity and location of the corrosion that was known to be occurring (Danger, 1975~. The concentrations of several trace metals were determined in the raw water and in two samples collected at household taps. Standing samples were coldected as soon as the tap was turned on; this represented water in contact with the household plumbing at least overnight. Running samples collected after
Inorganic Solutes 209 bleeding the line for 30 s represented water from the distribution main. The corrosiveness of the system was recognized by the low phi and hardness of the water. A comparison of the concentrations of iron, copper, zinc, lead, and cadmium in the raw water with those in the standing water confirmed the corrosiveness of the water. However, after a comparison of the concentrations of the same trace metals in the standing and running samples, it was concluded that most of the metal pickup was occurring in the service lines connecting the distribution main to the buildings and in the inside plumbing. It was also noted that the corrosion products tested the trace metals correlated well with the materials in contact with the water. Trace Metals in Finished Water Supplies A survey of the mineral content of the water served to customers (finished water) in the 100 largest U.S. cities was made in 1962 (Durfor and Becker, 1964~. The highest, median, and lowest concentrations are listed in Table V-4. The raw water used by these cities was either groundwater (wells and infiltration galleries) or surface water (streams, reservoirs, and lakes). The chemical quality of most groundwater supplies is stable, compared with TABLE V-4 Maximum, Minimum, and Median Concentrations of Constituents of Finished Water in Public Water Supplies of 100 Largest Cities in United States Concentration, mg/liter ConstituentHigh Median Low Iron1.3 0.02 0.00 Manganese2.5 0.00 0.00 Magnesium120 6.25 0.00 Silica72 7.1 0.00 ,ug/liter Silver7.0 0.23 ND Aluminum1,500 54 3.3 Barium380 43 1.7 Chromium35 0.43 o 2 Copper250 8.3 <0.61 Molybdenum68 1.4 ND Nickel34 <2.7 ND Lead62 3.7 ND Vanadium70 <4.3 ND ND, not detected. (From Durfor and Becker, 1964)
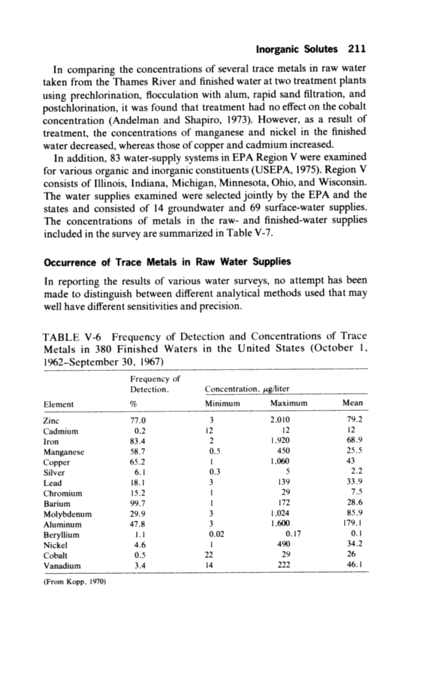
210 DRINKING WATER AND HEALTH TABLE V-5 Frequency of Detection and Concentrations of Dissolved Trace Metals in 1,577 Raw Surface Waters in the United States (October 1, 1962-September 30, 1967) Frequency of Detection, Concentration, ,ug/liter Element AS MinimumMaximum Mean Zinc 76.5 21,183 64 Cadmium 2.5 1120 9.5 Iron 75.6 14,600 52 Molybdenum 37.7 21,500 68 Manganese 51.4 0.33,230 58 Aluminum 31.2 12,760 74 Beryllium 5.4 0.011.22 0.19 Copper 74.4 1280 15 Silver 6.6 0. 138 2.6 Nickel 16.2 1130 19 Cobalt 2.8 148 17 Lead 19.3 2140 23 Chromium 24.5 1112 9.7 Vanadium 3.4 2300 40 Barium 99.4 2340 43 (From Kopp, 1970) that of streams, whose quality often varies seasonally and during flood periods. The mineral content of impounded water is generally less than that of water in streams. In addition to the quality of the raw water, it is important to recognize that water-treatment practices can affect the concentration of trace metals in finished water. This can be seen from the data in Tables V-5 and V-6. The concentrations of several trace metals in surface water of the United States are summarized in Table V-5. Table V-6 gives values for finished municipal water after treatment. This summary of analyses performed on raw surface water and finished water indicates higher mean concentrations of iron, zinc, lead, copper, and aluminum in finished water. This broad comparison points to the possibility that trace metals are added to water during treatment. Barnett et al. (1969) cited such an instance in which the use of aluminum sulfate at a treatment plant increased the aluminum concentration in the finished water by a factor of 5. Shapiro et al. (1962) observed, in a study of Pittsburgh tap water, a considerable increase in the copper content between samples at the water-treatment plant and those taken in the distribution system. Nickel also showed a tendency to be higher in the distribution water samples than at the treatment plant; however, the opposite was true for barium.
Inorganic Solutes 211 In comparing the concentrations of several trace metals in raw water taken from the Thames River and finished water at two treatment plants using prechlor~nation, flocculation with alum, rapid sand filtration, and postchlorination, it was found that treatment had no eject on the cobalt concentration (Andelman and Shapiro, 1973~. However, as a result of treatment, the concentrations of manganese and nickel in the finished water decreased, whereas those of copper and cadmium increased. In addition, 83 water-supply systems in EPA Region V were examined for various organic and inorganic constituents (USEPA, 1975~. Region V consists of Illinois, Indiana, Michigan, Minnesota, Ohio, and Wisconsin. The water supplies examined were selected jointly by the EPA and the states and consisted of 14 groundwater and 69 surface-water supplies. The concentrations of metals in the raw- and finished-water supplies included in the survey are summarized in Table V-7. Occurrence of Trace Metals in Raw Water Supplies In reporting the results of various water surveys, no attempt has been made to distinguish between different analytical methods used that may well have different sensitivities and precision. TABLE V-6 Frequency of Detection and Concentrations of Trace Metals in 380 Finished Waters in the United States (October 1, 1 962-September 30, 1967) Frequency of Detection. Concentration.,ug/liter Element No MinimumMaximum Mean Zinc 77.0 32.010 79.2 Cadmium 0.2 1212 12 Iron 83.4 21,920 68.9 Manganese 58.7 0.5450 25.5 Copper 65.2 11,060 43 Silver 6.1 0.35 2.2 Lead 18.1 3139 33.9 Chromium 15.2 129 7.5 Barium 99.7 1172 28.6 Molybdenum 29.9 31,024 85.9 Aluminum 47.8 31,600 179.1 Beryllium 1.1 0.020.17 0.1 Nickel 4.6 1490 34.2 Cobalt 0.5 2229 26 Vanadium 3.4 14222 46.1 (From Kopp, 1970)
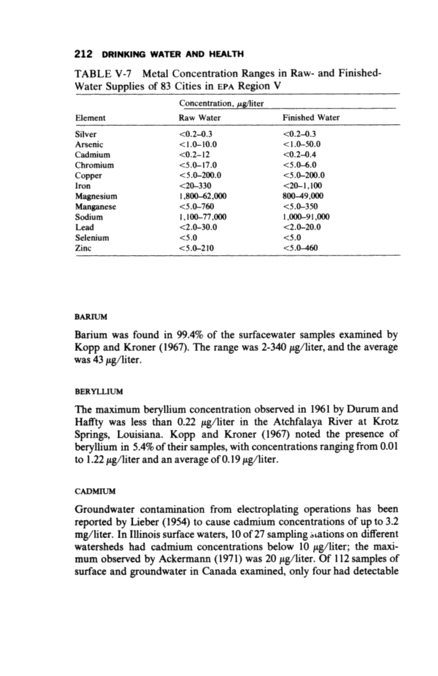
212 DRINKING WATER AND HEALTH TABLE V-7 Metal Concentration Ranges in Raw- and Finished- Water Supplies of 83 Cities in EPA Region V Concentration, ,ug/liter Element Raw Water Finished Water Silver Arsenic Cadmium Chromium Copper Iron Magnesium Manganese Sodium Lead Selenium Zinc <0.2~.3 ~ 1 .0-10.0 <0.2-12 <5.0-17.0 <5.0-200.0 <20-330 1 ,800~2,000 <5.0-760 1, 100-77,000 <2.0-30.0 <5.0 <5.~210 <0.2~.3 < 1 .0-50.0 <0.2~.4 <5.0~.0 <5.0-200.0 <20-1, 100 800~9,000 <5.0-350 1,000 91,000 <2.0-20.0 cS.O <5.0~60 BARIUM Barium was found in 99.4% of the surfacewater samples examined by Kopp and Kroner (1967~. The range was 2-340 ,ug/liter, and the average was 43,ug/liter. BERYLLIUM The maximum beryllium concentration observed in 1961 by Durum and Haffty was less than 0.22 ,ug/liter in the Atchfalaya River at Krotz Springs, Louisiana. Kopp and Kroner (1967) noted the presence of beryllium in 5.4%of their samples, with concentrations ranging from 0.01 to 1.22,ug/liter and an average of 0.19,ag/liter. CADMIUM Groundwater contamination from electroplating operations has been reported by Lieber (1954) to cause cadmium concentrations of up to 3.2 mg/liter. In Illinois surface waters, 10 of 27 sampling s rations on different watersheds had cadmium concentrations below 10 ,ug/liter; the maxi- mum observed by Ackermann (1971) was 20 ,ug/liter. Of 112 samples of surface and groundwater in Canada examined, only four had detectable
Inorganic Solutes 213 concentrations of cadmium, i.e., 10 ,ug/liter (Procter and Gamble, 1974~. Kopp and Kroner (1967) reported that 2.5% of the surface-water samples examined in their study contained cadmium at 1-120 ,ug/liter, with a mean of 9.5 ,ug/liter. In a comprehensive study of U.S. rivers in 1974 (USGS, 1974), a maximum dissolved concentration of cadmium of 42 ,ug/liter was reported for the Tanana River in Alaska. Durum et al. (1971) reported cadmium concentrations of 1-10 ,ug/liter in 42% of the surface- water samples examined, with only 4% above 10 ,ug/liter; the maximum concentration was 130 ,ug/liter. High concentrations were reported to occur in densely populated areas. Durum (1974) reported a distinct regional pattern: areas with many pollution sources and higher rainfall were higher in cadmium. CHROMIUM Durum and Hasty (1961) reported a range of concentrations for chromium in U.S. rivers of 0.7 to 84 ,ug/liter Kopp and Kroner (1967) detected chromium in 24.5% of the samples examined, with concentra- tions ranging from 1 to 112,ug/liter and averaging 9.7,ug/liter. In a study of surface and groundwater in Canada, all but two of 240 samples examined were below 50 ,ug/liter (Procter & Gamble, 1974~. In 1974, a maximum dissolved chromium concentration of 30,ug/liter was recorded in water from the Pecos River, New Mexico; the Los Angeles River; and the Columbia River, Oregon (USGS, 1974~. In a 1970 survey, 11 of 700 samples had chromium concentrations of 6 to 50 ,ug/liter, with none exceeding 50 ,ug/liter (Durum et al., 1971~. Ackermann (1971) reported chromium concentrations below 5 ,ug/liter for 18 of 27 river stations in Illinois; the maximum was 50,ug/liter. COBALT The limit of solubility of cobalt in normal river water is approximately 5 ,ug/liter, according to Durum et al. (1971), who reported that 37% of the river-water samples examined contained cobalt at 1-5 ,ug/liter, with less than 1% exceeding 5 ,ug/liter. A 1961 study showed a maximum of 5.S ,ug/liter in the Mississippi River at Baton Rouge (Durum, 1961~. A recent survey detected a maximum of 17 ,ug/liter in the Kentucky River at Lockport (USGS, 1974~. Kopp and Kroner (1967) found cobalt in 2.~% of surface-water samples examined; the concentration ranged from 1 to 48 ,ug/liter, with a mean of 17,ug/liter.
214 DRINKING WATER AND HEALTH COPPER Copper has been observed to adsorb to colloidal material at alkaline pH (McKee and Wolf, 1963~. Durum and Hasty (1961) found the maximum copper concentration in the Susquehanna River to be 105,ug/liter. Kopp and Kroner (1967) detected copper in 74.4% of the surface-water samples examined; the concentration ranged from 1 to 280 ,ug/liter, with a mean of 15 ,ug/liter. A recent survey detected a maximum of 40,ug/liter in the North Platte River (USGS, 1974~. Analysis of 13 Canadian surface and groundwaters including wells, rivers, and lakes-showed copper at 20- 860 ,ug/liter, the maximum being recorded in Lake Ontario (Proctor & Gamble, 1974~. Copper in excess of 100 ,ug/liter was reported in 8 of 27 Illinois streams, with a maximum of 260 ,ug/liter (Ackermann, 1971~. LEAD Pickering and Henderson (1966) reported a maximum solubility of lead of 500 ,ug/liter in soft water and 3 Igniter in hard water. Durum and Hasty (1961) reported a maximum lead concentration of 55 ,ug/liter in the St. Lawrence River at Levis, Quebec. In a more recent sampling of 727 U.S. sites, lead was found, at 1-50 ,ug/liter in 63% of the surface- water samples examined (Durum et al., 1971~. However, lead was detected less frequently at U.S. Geological Survey benchmark stations than at locations in more developed areas. In 1974, the Mississippi River at Vicksburg showed a maximum lead concentration of 29 ,ug/liter (USGS, 1974~. Of 52 surface and groundwa- ters examined in Canada, 50 were found to have less than 10,ug/liter; the concentrations in the other two samples were 22 and 25,ug/liter (Procter & Gamble, 1974~. In Illinois surface water, 25 of 27 river stations were found to have lead below 50 ,ug/liter the other two had concentrations greater than 50 ,ug/liter (Ackermann, 1971~. Kopp and Kroner (1967) found lead at 2-140 ,ug/liter, with a mean of 23 ,ug/liter in 19.3%oftheir surface water samples. Durum (1974) reported that the concentration of lead in water, like that of cadmium, can be correlated with urbanization and runoff. MANGANESE Durum and Haffty (1961) observed a maximum manganese concentra- tion of 181-185 Igniter in two different surface waters. The median for all samples was 20 ,ug/liter. Kopp and Kroner (1967) detected manganese in 51.4% of surface-water samples; the concentration ranged from 0.3 to
Inorganic Solutes 215 3,230 ~g/liter, with a mean of 59 ,ug/liter. A maximum of 1,200 ,ug/liter was detected in two different surface waters in 1974 (USGS, 1974~. MERCURY Durum et al. (1971) found dissolved mercury ranging from 0.1 to 4.3 ,ug/liter in 7% of the surface-water samples examined; in some cases, total mercury exceeded 5 ,ug/liter. According to a survey performed by Jenne (1972), only 4% of the surface waters examined showed mercury in excess of 10 ,ug/liter most of these were small lakes and reservoirs. The same study reported that groundwater samples were below the limit of detection for mercury. In 1974, the Rio De La Plata, Puerto Rico, was observed to have a maximum dissolved mercury concentration of 2 g/liter, and the James River in Virginia showed 1.6 ,ug/liter (USGS, 1974~. MOLYBDENUM Durum and Hasty (1961) detected a maximum molybdenum concentra- tion of 6.9 ,ug/liter in the Colorado River, Yuma, Arizona. In a more extensive survey, Kopp and Kroner (1967) found molybdenum in 32.7% of their surface-water samples; the concentration ranged from 2 to 1,500 ,ug/liter, with a mean of 68,ug/liter. NICKEL A maximum nickel concentration of 71 ,ug/liter was observed in the Hudson River at Green Island, New York (Durum and Hasty, 1961~. Kopp and Kroner (1967) found nickel in 16.2% of surface-water samples: the concentration ranged from 1 to 130 ,ug/liter, with a mean of 19 ,ug/liter. In a study of 13 Canadian surface and groundwater resources, only one sample was found to have nickel above the detection limit of 100 ,ug/liter (Procter & Gamble, 1974~. In a study of Illinois surface-waters, 24 river stations had nickel concentrations below 50 ,ug/liter, and 3 had concentrations of 50-530,ug/liter (Ackermann, 1971~. SILVER Samples containing silver at approximately 1 ,ug/liter were noted by Durum and Hasty (1961) in the St. Lawrence River, Levis, Quebec, and in the Colorado River, Yuma, Arizona. Of the surface-water samples examined by Kopp and Kroner (1967), only 6.6% contained detectable
216 DRINKING WATER AND HEALTH amounts of silver; the concentration ranged from 0.1 to 38,~Ag/liter, with an average of 2.6,ug/liter. VANADI~ A high vanadium concentration of 6.7 ,ug/liter has been reported in the Sacramento River, Sacramento, California (Durum and Haffty, 1961~. Kopp and Kroner (1967) observed detectable concentrations in 3.4% of the samples analyzed; the concentration ranged from 2 to 300 ,ug/liter, with an average of 40,ug/liter. ZINC The early studies of Durum and Hasty (1961) showed a maximum zinc concentration of approximately 144 ,ug/liter in the St. Lawrence River, Levis, Quebec. Kopp and Kroner (1967) found zinc in 76.5% of their surface-water samples: the concentration ranged from 2-1,183 ,ug/liter, with an average of 64 ,ug/liter. Durum et al. (1971) reported that zinc concentrations as high as 50 mg/liter could be found in surface water in mining areas, but that most samples had a concentration ranging from 10 to 50 ,ug/liter. Lazarus et al. (1970) reported the average concentration of zinc in rainfall of about 107 ,ug/liter IN 1974, a zinc concentration of 730 ,ug/liter was found in the North Platte River, Lisco, Nebraska (USGS, 1974~. In a variety of surface and groundwater sources in Canada, the zinc concentration was found to be 20-110 ,ug/liter (Procter & Gamble, 1974~. In a study of 27 Illinois surface-water sources, a maximum concentration of 2,000 ,ug/liter was observed (Ackermann, 1971~. Durum (1974) reported that the concentration of zinc in surface water, like those of lead and cadmium, could be correlated with urbanization and runoff. Geographical and Local Factors Durum and Hasty (1961) studied 15 stations on various rivers. Considering 13 of the trace metals pertinent to this review, 3 of the 15 stations had the maximum concentrations of more than 1 element. The St. Lawrence River at Levis, Quebec, had the maximum concentrations of silver, lead, and zinc; the Colorado River at Yuma, Arizona, had the maximum concentrations of silver and molybdenum; and the Mississippi River at Baton Rouge, Louisiana, had the maximum concentrations of cobalt, iron, and manganese. Kopp and Kroner (1967) presented data for 5 years for 16 major river basins in the United States. Table V-8 summarizes the basins in which the
Inorganic Solutes 217 highest and lowest 5-yr means were reported. The variability between the high and low means is shown as a ratio; for example, the ratio for manganese shows more variability than that for any of the other trace metals for which there was a detectable minimal concentration. Table V- 9 shows the highest and lowest observed concentrations of various trace metals in different surface and groundwaters, as reported in the references cited here. The possible frequency of detection is also given. For example, zinc will, in all probability, be found in 75% of all water samples examined for zinc from various locations, and its concentration will range from 2 to 50,000 ,ug/liter. Removal Of Metals By Water-Treatment Processes Beyond health considerations, the necessity of removing metals from drinking water is primarily a function of adequate surveillance and the development of analytical procedures capable of detecting trace concen- trations. The need to remove metals raises the question of how elective the current water processes are in removing metals from a water supply. Most treatment processes in use today were not developed to remove trace concentrations of metal. Chemical coagulation-flocculation, for example, is used primarily to remove turbidity and color from raw water; and any significant removal of lead through coagulation with alum is secondary to the original objective. -Even treatment plant that uses alum coagulation will vary with respect to its potential for removing lead, owing to differences in water characteristics and operating procedures. Table V-10 indicates the potential of several different treatment processes for removing barium, cadmium, chromium, cobalt, copper, lead, magnesium, manganese, mercury, methylmercury, molybdenum, nickel, silver, tin, vanadium, and zinc. The treatment processes consid- ered include chemical coagulation (alum and ferric chloride), lime softening (low lime and excess lime), the application of activated carbon, reverse osmosis, and ion exchange. Removal efficiencies have been rated semiquantitatively as "poor" (<307O removal), "fair" (30-60% removal), "good" (60-90% removal), and "very good" (>90% removal). Unfortu- nately, some studies have been performed whose published reports did not give percentage values for removal efficiencies. In these cases, efficiency was assigned on the basis of the written description. CHEMICAL COAGULATION Salts of trivalent aluminum and iron have long been used to remove color and turbidity from water. Two mechanisms for the removal of trace
218 o ._ C~ o Ct o C~ x cd Ct ._ ~; oo m U' . Ct m ._ c ~C 04 ._ · C;S o 3 o ~ o 04 - ._ Ce Ct a~ _ _ os . _ ·- oo ~: Ct 3 - o os C. C ~(_ _ _ ~ ~ ~ ·~ ~ ·~ ~ ~ o 8 3 o U) ~3 ~o ._ ~ . ~Cd ~ {_ d ~ ~ o c o C o o Y "C _ C - ° e ~c .~ 3 ~d ~o o ~ G o o ~ ~ ~ ~ oo _ ~ crx ~O O U~ _ O O ~ oo -, O r~ _ _ ~-, ~.= ·E ~c E ~
219 . _ vet cat cat ._ ~._ 3 3 o o C O Y a y O _ 0 3 cat Le ~ c: cat E m cat cat - .. rot~ 3 3 ~ ~ C ~ C (~ C C 33 en' C C ~ t ~At C ~C 3 ~ 3 ~ 3 ~ 3 ~ v' 3 ~ 3 3 3 ~1 ° 3\ \0 00 = ~t~ ~_ Q rot ~l- ~ O ~O ~O Vat _ =~ ~D ~O ~.c E o _ .z ~
220 DRINKING WATER AND H"LTH TABLE V-9 Overall Minimum and Maximum Metal Concentrations in Groundwater and Surface Water and Probable Frequency of Detection Highest Ob- Lowest Ob served Con- served Con- Probable Frequency centration, centration, of Detection,a ,ug/liter ,ug/liter ~ Barium340 299 + Beryllium1.22 0.0180 Cadmium130 15~0 Chromium112 0.725 66 Cobalt48 15~0 Copper860 175 Lead140 125~6 Manganese3,230 0.350 Mercury10 0.110 Molybdenum1,500 230 Nickel530 125 66 Silver38 0.110 Vanadium300 25 Zinc50,000 275 aEstimated upward from the best values reported in the literature, on basis of current analytical methods. metals by aluminum and ferric salts have been proposed: chemisorption to insoluble A1(OH)3 and Fe(OH)3, and by association with organic matter and clays, which are normally removed in the coagulation- flocculation process (Singer, 1974~. Symons et al. (1975) used jar tests with Cincinnati tap water to which trace amounts of various metals were added and reported very good removal of cadmium with ferric sulfate when the pH of the solution was above 7.5. Removal of cadmium with alum was reported as only poor to fair. Removal of barium was expected because of the formation of insoluble barium sulfate. However, only poor results were achieved with ferric sulfate and alum, presumably because of the supersaturation of barium sulfate. Ferric sulfate and alum concentrations between 20 and 100 mg/liter removed only small amounts of inorganic mercury (II) and methylmercury. Slightly better results were obtained in removing inorganic mercury with ferric sulfate than with alum. Increased removal of inorganic mercury was observed when the suspended solids in the test water were increased. It was speculated that this increase was due to the adsorption of mercury to the particulate matter (Logsdon and Symons, 1973~. Using samples of tap water and wastewater with added doses of
Inorganic Solutes 221 various metals, Nilsson (1975) found that lead and copper were removed very electively by alum doses of 100 mg/liter when the pH was 6.5-7.0. Zinc, nickel, and cobalt were only slightly removed under those conditions. These results were explained by the insolubility of the metals at neutral pH. Lead and copper were suspected to be present as insoluble hydroxides, oxides, and carbonates, which are readily flocculated by alum. Nordell (1961) noted that coagulation of colloidal oxides of iron and manganese with ferric salts may give favorable results. However, the preferred method of removal consists of aeration followed by settling and filtration if reduced species of iron and manganese are present, which is usually the case. Removing dissolved silica by treating surface waters with ferric sulfate may be elective. Aluminum removal to approximately l mg/liter may be achieved by coagulation with alum when the pH of the water is 5.5-6.5. Poor removal of radiosotopes of chromium, molybdenum, and cobalt by chemical coagulation with A1(III) and Fe(III) salts has been reported by Straub (1964~. Coagulant doses of approximately 20-100 mg/liter at neutral pH values were used in jar tests. Increased removal was demonstrated when artificial turbidity was added to the test water, indicating adsorption to the particulate matter. LIME SOFTENING The major objective of lime softening is the removal of hardness from water. Two types of softening processes are used: when the alkalinity of water is sufficiently high, the low-lime process is used, and the pH of the water is raised to approximately 9.5-10.5; when the alkalinity of water is low, excess lime may be used to remove hardness not associated with alkalinity, and the pH of the water may be raised to around 10.5-11.5. Removal of trace metals during either process may be due to precipita- tion as hydroxides at the increased pH or to chemisorption of the metals to calcium carbonate and magnesium hydroxide precipitates. Symons et al. (1975) showed that, although removal of barium by coagulation was poor, good to very good results could be obtained with lime precipition. Cadmium removal with both the low- and excess-lime processes was in excess of 907. The removal of methylmercury was described as poor and the removal of inorganic mercury was fair to good in studies of both lime processes with the jar test procedure. Additional results presented by the authors indicated that significantly better results were obtained for the removal of both methylmercury and inorganic mercury in a pilot-plant operation.
222 /1) ,,, N N ~ _ ~ 8 o o so 8 o 8 o 8 To ~ ~ C) · ~ 4- o. ~ _ ~ 4 ~r ~Or . ~ U. ~o o o V o o o o , o ~;, JO 8 Cal V, Cal o 4- 4 - L4 4 - C. ;^ D Cal - C. o - Ct o So - LU m . ~0 V, a~ .S - ca o ~ _ X ~ =' o - V) 3 c~ o ~ . ~ Ct C) ~ .E ·4O" ~ o: .e V _ ~o o ~_ N C4 O O O O ~) ;> N O _ O _ C) O N - o o - _ ~_ 8 ~ 8 ': 8 - o o 8 o o I ~S -" o o o o ~o o - o o Ct m v - o o N - o o - - · _ 0o ~O - o C ~O ~0, :> ~ 00 - _ cd 0 1 o C: o ~ I ~ I ~ =: ~C ~C~ -~- ~ ~Oo ~C, ~ ~ ~ ~ C) l V V V ~
223 8 g o o-~S ~ ~ ;> - o o 4,,' o ~ C: C. C. o o ~, C1 C: ~° ;> C: ~ ~ ~ - - o ~o o o o o ,= o ~o o po ~C) O L, O l l ', ~ o o o o ~o P" P4 ~ P~ ~P~ _ ~ oa b4 oo o ~ ~ . - - cq e e ~: V) ~ _ ~ ' ~ ~ . c~ ~ _ =- E-_ ~ ~ _ ~ ~- E ~ . a ~e ~ . ~ ~ - ~ ~ ~e ' ~ e P EE a ;= ~ ~ :, ~ 8! . . . _ ~4 ~ _ _ _ . . . . . . . . . _ ~ r-~ ~ ~ \0 ~ X C~ O - C C ~0 o A 11 11 o o 8 ~ C) :> _ _ C ;,. .~ a~ ~ ~ ~ ~L · o o ~ r~ ~ ~ Vo ~ 11 11 E o.- ~ o Ct
224 DRINKING WATER AND H"LTH Lime precipitation of municipal secondary effluent with added trace metals at a pH of 11 was shown to remove silver (50 ,ug/liter) and cadmium (10 ,ug/liter) in excess of 95% (Lindstedt et al., 1971~. Removal of chromium (SO ,ug/liter) was very poor. At a pH of 11, silver and cadmium were found to be present as insoluble hydroxides, and chromium as the soluble chromate, CrO4-2. Nilsson (1971) demonstrated that- although cobalt, nickel, and zinc were poorly removed by chemical coagulation lime precipitation at a pH of 9.S was very elective in removing these metals from samples of tap water and wastewater to which they were added. In a review of the chemistry of lime precipitation, Dye and Tuepker (1971) emphasized that the removal of magnesium was most elective with the excess-lime process. The removal of magnesium by the low-lime process is usually poor, because of the dissociation of magnesium hydroxide [Mg(OH)2] at pH values below 10. Removal of iron by the low- and excess-lime processes and removal of manganese by the excess-lime process were reported to be incidental, because of the high pH associated with each process (Nordell, 1961~. Naylor and Dague (1975) found that the excess-lime process with pH greater than 10.5 was unable to remove lead, either becuase of the physical character of the lead oxides or because of the presence of soluble lead hydroxide Pb(0H)3. Very good removal of lead by the low-lime process was noted. The presence of suspended matter increased the removal of lead with both the low- and excess-lime processes. ACTIVATED CARBON Activated carbon is normally used to remove substances that cause taste, odor, and color in water. The use of activated carbon for removal of organic matter in general has been recognized. The removal of metals by activated carbon may be due to several mechanisms. Impurities in activated carbon, especially oxygen and sulfur, may play a significant role. Also surface oxides may act as weak-acid cation-exchange sites or sulfide groups may interact strongly with some metals resulting in chemisorption. Activated carbon may also act as a nucleation site for the precipitation of metals. On the other hand, trace metals associated with organic matter may be removed by interactions between the activated carbon and the organic matter. Activated carbon can also act as a reducing agent. Reduction of metal oxyanions-e.g., Cr2O7-2 and MnO4-2 to Cr(III) and Mn(II) may result in the precipitation of the reduced species as oxides or hydroxides Cr(OH)3 and MnO2 (Singer, 1974~.
Inorganic Solutes 225 Logsdon and Symons (1973) and Symons et al. (1975) have reported that trace amounts of inorganic mercury and methy~mercury can be removed effectively by activated carbon. The superior removal of methylmercury, compared with inorganic mercury, was attributed to interactions between the activated carbon and the methyl functional group. Poor removal of barium with activated carbon was reported. Lindstedt et al. (1971) reported removal of silver, cadmium, and chromium (in excess of 95~0) from municipal secondary effluents with activated carbon. The high degree of removal was attributed to a combination of mechanisms. Sigworth and Smith (1972) extrapolated several years of data on removal of several metals from paper mill waste solutions by activated carbon to obtain what they felt to be reasonable removal efficiencies that may be expected in the treatment of drinking water. The data were collected for solutions having very high concentrations of metals and low pH values. The authors concluded that the removal of zinc would be poor under the extrapolated conditions, the removal of vanadium and nickel would probably be fair, and the removal of cobalt, iron, lead, and tin would probably be good. REVERSE OSMOSIS Reverse osmosis is used as a desalination or demineralization process. The ionic strength of water is reduced by forcing it to disuse through a cellulose acetate membrane against the high osmotic pressure caused by ionic imbalance. Furokawa (1973) has reported the rejection (separation) of cadmium, chromium, copper, aluminum, iron, magnesium, nickel, and silver by reverse osmosis to be in excess of 98%. ION EXCHANGE Ion exchange involves the reversible exchange of ions between a solution and an exchange resin. Exchange resins are available to exchange either anions or cations. The for specific ions over other ions, according to the ionic charge, the hydrated ionic radius of the ions, and their concentra- tion in solution. Lindstedt et al. (1971) demonstrated the removal of silver and cadmium from municipal secondary effluents by a cation-exchange bed. Chromium VI was removed effectively by an anion-exchange bed when present as the metal oxyanion HCrO4-. Semmens (1975) has observed very good removal of barium and lead by clinoptilolite, a cation-exchange resin. Very good removal of barium,
226 DRINKING WATER AND H"LTH methylmercury, and inorganic mercury have been reported by Logsdon and Symons (1973~. Bowers (1971) noted the efficient removal of magnesium by ion exchange. Although ion-exchange treatment can be designed for the removal of iron, manganese, and aluminum, the presence of these metals in water may impair the exchange capacity of a resin designed for the removal of other metals. Nordell (1961) stated that some removal of dissolved silica with a strongly basic anion resin is possible. Analysis of Drinking Water for Trace Metals The literature on chemical analyses of trace metals in natural fresh water is voluminous. Only the most pertinent publications will be discussed here. Brown et al. (1970) have prepared a comprehensive manual that contains methods used by the U.S. Geological Survey to collect, preserve, and analyze water samples for dissolved mineral and gas content. Among the topics discussed are the selection of sampling sites, frequency of sampling, sampling equipment, sample preservation, laboratory equip- ment and techniques, accuracy and precision of the analysis, and reporting of results. The methods of analysis are applicable to a wide range of water, from that with trace concentrations of dissolved metals to that with high concentrations. The National Environmental Research Center of the EPA at Cincin- nati, Ohio, has published methods of chemical analysis of water and wastes (USEPA, 1971~. The atomic-absorption method is suggested for the determination of aluminum, cadmium, chromium, copper, lead, magnesium, manganese, silver, and zinc; and the flameless atom~c- absorption method is suggested for mercury. Method selection was based on the following criteria: 1. The method should measure the desired constituent with precision and accuracy sufficient to meet data needs in the presence of the interferences normally encountered in polluted water. 2. The method should utilize the equipment and skills normally available in the typical water-pollution control laboratory. 3. The method should be in use in many laboratories or have been sufficiently tested to establish its validity. 4. The method should be sufficiently rapid to permit routine use for the examination of a large number of samples. Guidelines establishing test procedures for analysis of various pollu
Inorganic Solutes 227 tents in water were published in the Federal Register on October 16, 1973. They included references to 71 test procedures for measurement of pollutants for which limitations were specified under the Federal Water Pollution Control Act Amendments of 1972. Several professional associations have recommended procedures for analysis of water samples for various trace metals. Such publications are Standard Methods for the Examination of Water and Wastewater (Ameri- can Public Health Association, 1976), and Annual Book of ASTM Standards (American Society for Testing Materials, 1970~. In addition, many symposium volumes and handbooks have summa- rized the state of the art for the analysis of trace metals in aqueous solution. Those reviews can be found in Hume (1967), Boettner and Grunder (1968), Hemphill (1973), Cosgrove and Bracco (1973), and others. Recent developments dealing with analytic methods for trace metals in waters are reviewed biannually in Analytical Chemistry and annually in Journal of Water Pollution Control Federation (Minear, 1975~. SAMPLE TREATMENT For the determination of trace metals in fresh water, large volumes of sample are required. Caution must be exercised in the proper collection and treatment of water samples, if the analytic results are to reflect the actual conditions of the water sampled. Water samplers sometimes introduce serious contamination. In selecting sample containers, care must be taken to avoid containers whose interior surfaces contain active metal-binding sites or that may release contaminating metals into the water sample. Inert plastic containers are usually preferred to glass. Polyethylene bottles are generally satisfactory. Ediger (1973) recom- mended a cleaning procedure of soaking containers in a 2% nitric acid solution for 24 h and then rinsing several times with metal-free water. Rapid changes may occur in the chemical composition of water samples during storage, owing either to the introduction of contaminants from the containers or to selective adsorption of metals onto the walls of containers. Trace metals in water are also subject to change because of biologic activity. Water samples are usually stabilized by the addition of dilute acid. The EPA recommends the addition of 3 ml of 50EYO nitric acid to each liter of filtered sample. For unfiltered samples, 5 ml of concentrated nitric acid is recommended. Other preservatives have been recommended for metals known to be unstable in aqueous solution, such as silver (West et al., 1967) and mercury (Oman", 1971~.
228 DRINKING WATER AND H"LTH ANALYSIS A general requirement in analytic chemistry is standardization of methods. Some methods that serve today as the legal standards in drinking-water quality control for trace metals are not sufficiently sensitive and accurate. The establishment of a method, moreover, does not guarantee that it will produce the same results when used by different analysts in different laboratories. A strong effort is required in evaluating and improving the analytic methods used in drinking water quality control. The analysis of trace metals is intimately related to the setting and enforcement of drinking-water standards. The reliability and detectabil- ity of analytic methods may be the limiting factors in defining standards and maintaining surveillance. Methods must be reliable and provide a measurement of the species under consideration. Furthermore, in the case of effective monitoring programs, methods must be rapid and must have a reasonable cost. In any trace analytic method, the first consideration is sensitivity. Because of the very low concentrations of some trace metals in natural water, methods should have sensitivities of a nanogram or less. Such methods may involve concentrating the sample; this should be avoided if possible. The stated sensitivity value for a particular method is generally not an exact figure. "Sensitivity" is sometimes defined as the concentra- tion that yields a reading of 1% of full scale of the instrument; it is used in this manner in atomic absorption. The detection limits are usually defined as twice the background. The specificity of an analytic method indicates the degree to which the method detects one element with no interferences from other elements that are present. Ideally, one would like methods that are specific for each element to be analyzed with few or no interferences. Accuracy and precision of the procedures are important, but results will be less accurate and less precise as concentrations move into the micrograms-per-liter region. Each procedure should be checked for precision on real samples, and the data reported with respect to the standard deviation. In selecting a method of water analysis for trace metals, sensitivity, speed, ease of operation, and relative lack of chemical interferences make the conventional and nameless atomic-absorption spectrophotometers instruments of choice. All analytic procedures recommended by the EPA and the U.S. Geological Survey for determining trace metals in water samples are based on atomic-absorption spectrophotometry. These instruments are generally available in analytic laboratories.
Inorganic Solutes 229 For general information on atomic-absorption analysis, books by Elwell and Gidley (1966), Slavin (1968), Ramirez-Munoz (1968), L'vov (1970), Price (1972), Reynolds and Aldous (1970), Kirkbridge and Sargent (1974), and Robinson (1975) are recommended. Barium OCCURRENCE Barium, one of the alkaline earth metals, occurs naturally in almost all (99.4~O) surface waters examined, in concentrations of 2-340,ug/liter, with an average of 43 ,ug/liter (Kopp and Kroner, 1967~. The drainage basins with low mean concentration of barium (15 ~g/liter) occur in the western Great Lakes, and the highest mean concentration of 90 ,ug/liter is in the southwestern drainage basins of the lower Mississippi Valley. Finished water of public systems frequently (99.7% of supplies examined) contains barium, at 1-172 ,ug/liter, with a mean of 28.6 ,ug/liter. The 100 largest cities (Durfor, 1964) of the United States had a median concentration of 43 ~g/liter, with a maximum of 380 ,ug/liter, but 94% of all determina- tions were less than 100,ug/liter. Drinking water at the tap, as determined in 2,595 samples, had a maximum of 1,550 ,ug/liter; the maximum was found in one of only two samples that exceeded the interim standard of 1,OOO,ug/liter(McCabe, 1970~. CHEMICAL CHARACTERISTICS Barium is slightly rarer than strontium in the earth's crust. It may replace potassium in some of the igneous rock minerals, especially feldspar. Barium sulfate (barite) is a common barium mineral of secondary origin. In stream water and most groundwater, only traces of the element are present. The reason for the small amount of barium in solution is the low solubility of barium sulfate. Because natural water usually contains sulfate, only trace amounts of barium will dissolve. Barium sulfate is soluble in pure water at 20°C barium at 1.6 mg/liter and sulfate at 1.1 mg/liter. The solubility of barium sulfate increases considerably in the presence of chloride and other anions. However, water containing sulfate at more than a few parts per million will not carry barium at more than a few parts per million (USGS, 1959~.
230 DRINKING WATER AND H"LTH METABOLISM The metabolism of barium has been traced by radioisotope techniques and shown to be similar to that of calcium (Seaber, 1933; Bauer et al., 1956~. The digestive system is extremely permeable to barium, allowing for rapid transfer to and from the bloodstream (Batter, 1957~. The metal is transported in the plasma and disappears from the blood completely within 24 h. Excretion of barium is different from that of calcium, in that the rate is greater in feces than in urine. In feces, 20970 of barium is excreted in 24 h compared with 6% of calcium; in urine 7% of barium is excreted in 24 h compared with 0.9% of calcium. HEALTH EFFECTS No vital metabolic function has yet been found for barium, although it is believed to be beneficial for rats and guinea pigs under specific dietary conditions (Underwood, 1971~. Barium is highly toxic when soluble salts are ingested. Fatalities have occurred from mistaken use of barium salt rodenticide. The fatal dose of barium chloride for man has been reported to be about 0.8-0.9 g, or 550- 600 mg of barium (Sollman, 1957~. Industrial exposure to barium oxide and sulfate dusts produces a benign pneumonoconiosis called "baritosis." Although barium poisoning is rare in industry, the potential from the more soluble forms is real. The American Conference of Governmental Industrial Hygienists set an airborn threshold limit value (TLV) for barium of 0.5 mg/m3. The limit was based on several years of observation of workers at Los Alamos exposed to barium nitrate. Acute barium poisoning exerts a strong, prolonged stimulant action on all muscles, including cardiac and smooth muscle of the gastrointestinal tract and bladder. Barium is capable of causing nerve block (deNo, 1946) and in small or moderate doses produces a transient increase in blood pressure by vasoconstriction (Gostev, 1944~. There has been no determination of the chronic ejects of barium administered repeatedly over a long period, either in food or drinking water. ANALYSIS Conventional flame atomization does not have sufficient sensitivity to determine barium in most water samples; however, a barium detection
Inorganic Solutes 231 limit of 10 ,ug/liter can be achieved, if a nitrous oxide flame is used. Renshaw et al. (1973) described a concentration procedure for barium that uses thenoyltrifluoroacetone-methylisobutylketone extraction at a pH of 6-8. With a tantalum liner insert, the barium detection limit of the flameless atomic absorption procedure can be improved to 0.1 ,ug/liter (Renshaw, 1973). CONCLUSIONS AND RECOMMENDATIONS A drinking-water guideline was derived from the 8-h weighted maximum allowable concentration (TLV) in industrial air of 0.5 mg/m3 set by the American Conference of Governmental Industrial Hygienists. It was assumed that, with an 8-h inhalation of 10 me of air, the daily intake would be 5 mg of barium, of which 75% was absorbed in the bloodstream and 90% transferred across the gastrointestinal tract. Based on the above assumptions, it was reasoned that a concentration of about 2 mg/liter of water would be safe for adults. To provide added safety for more susceptible members of the population, such as children, a level of 1 mg/liter was recommended (Stockinger, 1958~. There have been no long- range feeding studies to confirm the safety of this barium intake. The limit set in the USSR is 4 mg/liter of water. International and European standards do not list barium upper limits, because available information is insufficient. It is rare to find sources of water that exceed a barium concentration of 1 mg/liter, although a concentration of 1.55 mg/liter has been recorded in drinking water. The 1975 Analysis of Interstate Carrier Water Supply Systems showed none exceeding the 1 mg/liter standard. Small numbers of people are known to be consuming well waters in Illinois, Kentucky, Pennsylvania, and New Mexico that are at, or exceed by 10 times, the standard for barium. It would be desirable to study any risk that might be associated with this chronic ingestion of barium. Animal studies should be undertaken at least, to determine the toxic effects of long-term ingestion of barium at low concentrations. Beryllium OCCURRENCE A relatively rare element, found chiefly in the mineral beryl (beryllium aluminum silicate), beryllium is not likely to occur in natural water in appreciable concentrations. Although the chloride and nitrate are very
232 DRINKING WATER AND H"LTH soluble and the sulfate moderately so, the carbonate and hydroxide are almost insoluble in cold water (McKee and Wolf, 1963~. Beryllium is used primarily in metallurgy to produce special alloys, in the manufacture of X-ray diffraction tubes and electrodes for neon signs, and in nuclear reactors (Browning, 1961~. It is also used in rockets and in missile fuels. Cralley (1972) presented an extensive discussion of the many modern uses of beryllium metal, be~llium-copper alloys, berylli- um oxide, and minor beryllium compounds. The consumption of beryl increased from 1,200 short tons in 1941 to 8,483 tons in 1969. Using emission spectroscopy, Durum and Haffty (1961) measured beryllium in 59 samples of surface water from 15 rivers in the United States and Canada. The highest concentration observed was less than 0.22 ,ug/liter. Kopp and Kroner (1967) noted the presence of beryllium in 85% of their samples from the 15 major river basins of the conterminous United States; the concentration ranged from 0.01-1.22 ,ug/liter, with an average of 0.19 ,ug/liter. According to Standard Methods (APHA, 1976), beryllium has been reported to occur in U.S. drinking water at 0.01-0.7 ,ug/liter, with a mean of 0.013,ug/liter. In a study of many groundwater samples from the western United States, beryllium was detected in only three highly acid mine waters. Beryllium discharged to ground water will not travel far in neutral solution, because it is rapidly adsorbed by the clay in the soil. In the eastern United States and in Siberia, surface water was reported to contain beryllium at 0.1-0.9 ,ug/liter. Pacific Ocean water contains 2-9 ,ug/liter (Griffitts et al., 1976~. According to the NAS-NAE report on water-quality criteria (NAS, 1973), the concentration of beryllium in seawater is only 6 x 10 4 ,ug/liter. Food does not appear to be a significant source of human exposure to beryllium. According to Griffitts et al. (1976), "there is no evidence at present that beryllium is moving from soils into food or feed plants in the United States in amounts that are detrimental to plants, animals, or people." Furthermore, "the forms of beryllium in plants and their digestibility by animals have not yet been determined." CHEMICAL CHARACTERISTICS Although beryllium is in the same group of elements as the alkaline earth metals, it shares few properties with them. Beryllium replaces silica in the structure of some igneous rock minerals and is present as independent beryllium minerals in pegmatites, the most important of which is beryl. In the weathering process, beryllium (like aluminum) is concentrated in
Inorganic Solutes 233 hydrolysates and does not go into solution to any appreciable degree. Beryllium is not likely to be found in natural water in greater than trace amounts, because of the relative insolubility of beryllium oxides and hydroxides at the normal pH range of such water. The solubility of the oxide is reported as about 2~70 ~g/1 in pure water at about 28°C. The sulfate and chloride of beryllium are very soluble, but would hydrolyze and lower the pH. In the presence of sodium hydroxide (high pH), beryllium hydroxide is soluble, probably because of the formation of anion complexes. The ejects of other ions or cations on the solubility of beryllium are not known (USGS, 1959~. Some data on adsorption of trace quantities of beryllium in water by glass and plastic containers have been reported. At a pH of 3.5, there was no adsorption of beryllium by the container. However, at a pH of 7 and 8, there was considerable adsorption. Adsorption of beryllium by naturally occurring minerals is probably an important cause of the low concentra- tions in water, inasmuch as such adsorption seems to proceed electively at pH values common in natural water. METABOLISM Absorption of beryllium from the digestive tract is slight (about 0.006% of that ingested), and excretion is fairly rapid (Browning, 1961). HEALTH EFFECTS In a comprehensive review, Pomelee (1953) reported that there was no indication that beryllium in any form is harmful when taken orally. Inhalation of particles is by far the major hazard to humans from this metal. Beryllium has been incriminated in pulmonary ailments of workers exposed to beryllium dusts (Browning, 1961). Since the develop- ment, in about 1947, of spectrochemical techniques for detecting beryllium in air, there has been a substantial increase in the number of reported cases of beryllium poisoning. No information was uncovered to indicate that beryllium is a beneficial or necessary component of human nutrition. Rats were healthy after 2 yr on a diet that included beryllium sulfate at about 6.0 mg/day, equivalent to beryllium at 1.0 mg/kg of body weight per day. Four dogs showed no ill ejects after 19 months of daily ingestion of beryllium sulfate at 10 mg/kg of body weight; 1 dog lost weight after 9- months and was killed for examination. No evidence of tissue damage was found (Pomelee, 1953~. When mice were fed beryllium at 5.0 mg/liter
234 DRINKING WATER AND H"LTH in drinking water for life, slight ejects on the body weight of females (but not males) were disclosed, and there were no ejects on the life span and survival of either sex. These studies with mice indicated that beryllium is poorly absorbed through the gut and that ingestion is not a hazard (Schroeder and Mitchener, 1975~. According to Stokinger (1972), the dietary LD50 of beryllium sulfate in rats after 172 days was 2,750 mg/kg of body weight per day. The beryllium metal in beryllium oxide eaten in the diet at 5.0% is so poorly absorbed that no effect on growth occurred over long periods of feeding. Beryllium sulfate did not interfere with growth until a concentration of 1.4% (14,000 mg/kg of diet) was reached. With the data for 10 of the 15 river basins studied by Kopp and Kroner (1967), Berg and Burbank (1972) attempted to establish correlations between carcinogenic trace metals in water supplies and cancer mortali- ty 8 metals compared with 34 types of cancer, for a total of 272 comparisons. At the 0.05 level of significance, they expected about 14 comparisons to show positive correlations. In fact, 28 positive correla- tions were found, 5 of which were associated with beryllium. When they studied these findings in further detail, however, especially with respect to bone cancer, the 5 correlations were not meaningful. Berg and Burbank concluded that the correlations were not consistent with a waterborne pattern and could be explained by other known factors. The inclusion of beryllium in the work of Berg and Burbank (1972) was prompted by the fact that beryllium was the first metal to produce cancers in animals with any substantial frequency away from the site of administration. Stokinger (1972) noted that soluble beryllium sulfate is about equally toxic (in milligrams per kilogram of body weight) to rats, mice, dogs, monkeys, and rabbits, whether administered by inhalation, intratracheally, intravenously, or subcutaneously. When beryllium is transported via the bloodstream from its initial site of deposition, a significant part of the administered dose ends up in the skeleton, irrespective of the mode of administration. In the bones of animals, it has been shown to produce osteosarcoma; but this has been demonstrated only in animals and not yet in humans who have beryllium lung disease from inhaling beryllium dust (IARC, 1973~. According to Sterner and Eisenbud (1951), acute pneumonitis among human beings has been caused by exposures to beryllium in the atmosphere at concentrations of less than 1.0 to over 100 ,ug/m3 of air. The symptoms of beryllosis include skin and lung diseases of variable severity. The reactions of people to a given exposure are said to vary widely, but apparently any person will show a reaction if time and degree of exposure are great enough. It became apparent by 1947 that many cases of what was then thought
Inorganic Solutes 235 to be pulmonary sarcoidosis were appearing among beryllium production workers as a result of inhalation of beryllium compounds and metallic dust. On the recommendations of an ad hoc advisory committee, the Atomic Energy Commission (AEC) established strict in-plant limits for beryllium in the atmosphere and much stricter limits for neighborhoods near AEC plants (Stokinger, 1972~. Apparently, beryllosis is confined to the lungs, and beryllium is not translocated to other parts of the body. Any sputum that might be swallowed would get into the digestive tract, where beryllium has been shown to be relatively harmless. No unusual incidence of lung cancer has yet been found among workers exposed to beryllium, although sizable numbers had exposures more than 20 years ago. This experience indicates that, if beryllium proves to be carcinogenic in humans, it is of low potency (Stokinger, 1972~. ANALYSIS According to Standard Methods (USEPA, 1976), atomic-absorption spectrophotometry and calorimetry are equally suitable for the determi- nation of beryllium. Direct flame atomization offers a detection limit of 2 ,ug/liter. Sachdev and West (1969) have described a concentration procedure that uses solvent extraction with an oxine-acetylacetone- dithizone combination at a pH of 6.0. The detection limit can be lowered to 0.03 ,ug/liter when the graphite furnace is used for atomization. Chapman et al. (1974) have used flameless atomic absorption for beryllium analysis. CONCLUSIONS AND RECOMMENDATIONS Beryllium is relatively harmless when ingested in food and water, except at very large continuing dosages. It is present in natural surface water at concentrations generally less than 1.0 ,ug/liter, with averages of less than 0.2 ,ug/liter; hence, it presents no hazard in drinking water. The USSR has set a limit of 0.2 ,ug/liter, but the World Health Organization has not established any limit (Stoefen, 1973~. The EPA has not promulgated any limit for beryllium in its National Interim Primary Drinking Water Regulations ( 1975~. Beryllium is known to cause cancer in various species of laboratory animals, but to date has not been associated with human cancer. Because of the strong association of beryllium with cancer in animals a continuing effort should be made to study both through epidemiology and chronic low-level feeding studies the toxicology of beryllium.
236 DRINKING WATER AND HEALTH Cadmium The sources, distribution, metabolism, and toxicology of cadmium have been reviewed by Friberg et al. (1971,1974, 1975), Underwood (1971), Nordberg, (1976), and Copenhaver et al. (1973~. OCCURRENCE The principal industrial uses of cadmium are in electroplating, in pigment manufacture, and as a plasticizer, chiefly in polyvinylchioride. Cadmium occurs in zinc ores and is an important by-product in the metallurgy of zinc. Because cadmium is an impurity in zinc, cadmium should possibly receive some consideration when poor grades of zinc are used for galvanizing. The use of cadmium-plated containers in food- and beverage-handling materials is now prohibited by the Food and Drug Administration because acute cadmium poisoning has been recognized in man after consumption of food and particularly acidic beverages stored in cadmium-plated containers. Except where stated, estimates of intake and critical renal concentration are taken from Cadmium in the Environment, II and III (1974, 1975J. In streams and rivers, the concentration of cadmium tends to be higher in sediment than in filtered running water. From studies in Japan (Friberg, 1974) and upstate New York (Kubota et al., 1974; Durum, 1974), it appears that most fresh water contains cadmium at less than 1 ,Ag/liter. The U.S. Geological Survey reported that about 46% of samples contained detectable amounts 1 ,ug/liter or more. Regional differences are noted within the United States, with the higher concentrations found in runoff water in the Northeast, in some urbainzed areas in the South, and in the central states. This distribution pattern suggested to Durum that pollution sources and rainfall may be the major contributors of cadmium in river water. Carbonate content and pH influence the stability and solubility of cadmium in water. It is least soluble at a pH of approximately 8-9 and becomes increasingly soluble as the pH decreases. But, the median concentration in surface water in most areas is less than the detection limit (~1 ,ug/liter of water). Durum used filtered samples and found that 4% of surface waters in the United States exceeded the 1962 USPHS drinking-water standard of 10 ,ug/liter. However, the USPHS National Community Water Supply study indicated that the dnnking-water standard for cadmium was exceeded by only 0.1% of 969 water-supply systems tested, which served an estimated 18 million people. Craun and McCabe (1975) reported data on the interaction between soft water and
Inorganic Solutes 237 accumulation of cadmium in the distribution systems for Boston and Seattle. This survey indicated that 13% of samples obtained in Boston showed a higher concentration at the tap than at the treatment plant. In Seattle, which has more acidic water, 51% of the sample showed an increase. Both running and standing samples were obtained. In Seattle, 7% of the samples exceeded the 10 ~g/liter drinking-water standard; in the Boston area, none exceeded this standard. There is a wide consensus that the cadmium content of food is the major source of cadmium for the general population. Friberg et al. (1974) estimated that the average daily intake for adults is approximately 50 ,ug. If this estimate is adjusted on a caloric basis for children consuming a similar diet, the intake at 2-3 years of age would be about one-third to one-half of the adult intake. There is a rather wide range in the estimates of cadmium intake in food. This may be due largely to difficulties in the measurement of trace amounts of cadmium. Because cadmium is a contaminant of superphosphate fertilizers and because of current plans to use sewage sludge for agricultural purposes, it is the consensus of most experts that the food supply should be carefully monitored for cadmium and other trace metals. Although air cadmium concentrations may be high near lead, zinc, and cadmium smelters and refineries, it is generally about 1 ng/m3 elsewhere. Cigarette tobacco contains cadmium at about 1 ppm. Friberg (1974) has estimated that the smoking of one pack of cigarettes a day can contribute 2-4 ,ug of cadmium a day. The best-described accident related to discharge of cadmium into water is the occurrence of Itai-Itai disease among residents along the Jintsu River in Japan (Friberg et al., 1971~. These residents were apparently exposed not only through the drinking of water, but also through the ingestion of rice grown in the contaminated water. CHEMICAL CHARACTERISTICS Elemental cadmium is present in rocks in much lower quantities than those reported for zinc. Only traces are likely to be found in natural water, but cadmium may be introduced in amounts significant from a health standpoint by solution from containers or tubing or by waste disposal. Cadmium probably could be present only in small amounts in water with the normal alkaline pH, because of the low solubility of the carbonate and hydroxide. Cadmium hydroxide is soluble at about 1 mg/liter at 25°C. Exact data regarding solubility of the carbonate are not
238 DRINKING WATER AND H"LTH available. At a pH below about 4.5, the solubility of cadmium would be controlled by other factors and would probably be greater (USGS, 1959~. METABOLISM The total daily intake of cadmium from air, water, food, and cigarettes is estimated to range between 40 Payday (for nonsmoking rural residents who have negligible air exposure and consume a low-cadmium diet) and 190 ,ug/day (for smokers living in industrialized cities and consuming a high-cadmium diet). Absorption from the digestive tract is thought to average about logo. However, a number of factors, including dietary calcium, protein, and age, may have an important bearing on this. For the digestive-tract route of assimilation the major organs of cadmium storage are the liver and renal cortex. The renal cortex may contain one-third of the total cadmium body burden. The biologic half-life of cadmium in these organs is variously estimated at 13 to 38 yr. Urinary excretion is low, from 1 to 9 ,ug/day. Because cadmium tends to accumulate, a more useful way of looking at the question is to consider the rate of accumulation. The human placenta is apparently highly impermeable to cadmium. The total body burden is estimated at 1 ng at birth and at 15-50 mg at the age of 50 years. This is consistent with an average accumulation of 0.9-1.8 ,ug/day. There is a major need for a more reliable estimate of the rate of cadmium accumulation. The renal cortex is considered to be the critical organ for accumulation of cadmium from low-level dietary exposures, and the critical concentra- tion for renal cortex is approximately 200 ,ug/g of tissue (wet weight) (Friberg et al., 1974; Nordberg, 1976~. At greater concentrations, irreversible renal injury may occur. In the outbreak of Itai-Itai disease on the Jintsu River, renal cortical cadmium concentration was estimated at 600-1,000 ,ug/g of tissue (wet weight) in those most severely (and irreversibly) affected. With an assumed water consumption of 1.5 liters/day, the average cadmium intake from water was estimated at 5 ~g/day, or less than 10% of the total intake. HEALTH EFFECTS In industry, after overexposure to cadmium at high concentrations (50 ,ug/m3) well in excess of that for the general population, bronchitis, emphysema, anemia, and renal stones have been found. Among the general population, gastrointestinal upsets similar to "food poisoning" have been reported in association with consumption of food or beverages
Inorganic Solutes 239 conveyed in cadmium-plated vessels. Sporadic outbreaks of this sort occur when cadmium-plated vessels not intended for food are used to prepare lemonade and other acidic beverages for picnics and similar outings. For the general population, the major route of absorption is through the gastrointestinal tract. The major erects are likely to be on the kidney. There is an extensive literature reviewed by Friberg(1971, 1974, 1975), Nordberg (1976), and Sandstead (1974) on this problem. Experimental data indicate that the zinc: cadmium ratio in the organs is an important determinant of cadmium toxicity (in most foodstuffs, the dietary ratio of cadmium to zinc is 1: 100; it is highest in meat products and lowest in dairy products), and there is some evidence that the intake of sodium may also influence cadmium toxicity. There are no dose-response data. Limited autopsy data suggest that average renal cortical concentrations of cadmium in American and European populations are generally less than 50 ,ug/g of tissue (wet weight) less than the projected critical concentration by a factor of 4 or more. In addition to the suspected interactions between cadmium, zinc, and calcium, recent experimental studies indicate that cadmium at very high doses can interfere with the activation of vitamin D in both liver and kidneys to the final active 1,25-dihydroxycholecalciferol (Nordberg, 1976; Sandstead, 1974~. There is also evidence from animal studies that cadmium is implicated in the etiology of hypertension (Schroeder, 1965~; the thresholds and dose-response relationships are unknown. There is some evidence that cadmium is carcinogenic in the rat, but no substantial evidence to implicate it with human cancer (IARC, 1973~. Cadmium is known to be teratogenic in the rat following rather high (2-13 mg/kg) doses on specific days of gestation (Chernobyl, 1973~. Another erect observed at high doses in rats is ease of producing testicular and ovarian necrosis when cadmium is given by injection. This same effect can be seen in rats (who can not vomit) with high oral doses. There are no identified hypersusceptible segments of the human population. Although victims of Itai-Itai disease were predominantly multigravid, postmenopausal women, this does not mean that these alone are predisposing conditions. It should, however, be noted that, on a body weight basis, infants may have a higher intake of cadmium. If, in fact, calcium intake is an important protective factor, it is well to note that a significant proportion of the population from school age up is lactose- intolerant and may voluntarily reduce milk intake and hence calcium intake on this account. If, as appears likely from experimental studies, zinc is an important protective factor against cadmium toxicity, it is worth noting that preliminary evidence indicates that those with
240 DRINKING WATER AND H"LTH hemoglobin SS or SC have shown signs of zinc deficienyv. Further studies in these groups appear warranted. ANALYSIS o Direct flame atomization has a cadmium detection limit of 2 ,ug/liter. Most reported analyses, however, involve some form of concentration. The U.S. Geological Survey procedure (Brown et al., 1970) recommends extracting the cadmium as an ammonium pyrrolidine dithiocarbamate at a pH of 2.8 with methylisobutylketone. Other concentration procedures have been described for fresh water (USEPA, 1971; Traversy, 1971; Kaminski, 1974; Kinrade and Van Loon, 1974; Kubota et al., 1974; Korkisch and Sorio, 1975; Aldous et al., 1975~. The sampling boat and Delves cup techniques have cadmium detection limits of 0.1 and 0.05 ,ug/liter, respectively. Using the graphite furnace to atomize the sample can improve detection to 0.005 ,ug/liter. Paus (1971) has used the graphite furnace to determine cadmium in lake water at concentrations of 0.5-2.5 ,ug/liter. Other methods have been reported by Dolinsek and Stupar (1973), Surles et al. (1975), and Rattonetti (1974~. Barnard and Fishman (1973) have critically evaluated the use of the graphite furnace for cadmium determinations in fresh water. For all types of biologic samples, the available data indicate that either background correction or extraction is essential when determinations are made by atomic-absorption spectrophotometry, owing to the enhancing eject of sodium on the cadmium signal. Although it has not been fully explored, it appears that electrochemical techniques may be more suitable, although somewhat less sensitive, because such measurements may be influenced, to a lesser degree, by matrix effects. Except on a large- group basis, it appears that the measurement of cadmium in blood and spontaneously voided urine is of relatively little value, because these measurements are not reliable indicators of the concentrations of cadmium in the organs, particularly in the renal cortex. For the reasons stated above, one should scrutinize data carefully. It is likely that data obtained during the early years of atomic-absorption spectrophotometry are not reliable, because the background eject, particularly of sodium, was not appreciated at the time. CONCLUSIONS AND RECOMMENDATIONS There should be a comparison of the intakes of cadmium in various industrial and geographic regions and an attempt to correlate them with specific diseases. These kinds of correlations should also be done on
Inorganic Solutes 241 autopsy samples. There is a need to analyze, particularly in soft-water areas, the accumulation of cadmium in drinking water at the tap. There is also a need for certified reference samples, such as the NBS bovine liver and orchard leaves. Interlaboratory comparisons, exchange of standards, and establishment of a reference method are also warranted. The possible effect of cadmium on vitamin D metabolism needs investigation. The available data do not suggest any need to change the present drinking- water standard of 10 ,ug/liter, although there is a clear need for data on soft, aggressive water areas. Chromium The NAS-NRC has recently (1974) completed an extensive review of the medical and biologic effects of chromium, which has been reviewed and excerpted for this report. Additional material has also been included when necessary. OCCURRENCE Durum and Haffty (1961) reported a range of concentrations for chromium in U.S. rivers of 0.7-84 ~g/liter. Kopp and Kroner (1967) detected chromium in 24.5% of the samples examined, with concentra- tions ranging from 1-112 ~g/liter and averaging 9.7 ~g/liter. In a study of surface and groundwaters in Canada,~all but two of 240 samples examined were below 50 ~g/liter (Procter & Gamble, 1974~. In 1974, a maximum dissolved chromium concentration of 30,ug/liter was recorded in water from the Pecos River, New Mexico; the Los Angeles River; and the Columbia River, Oregon (USGS, 1974~. In a 1970 survey, 11 of 700 samples had chromium concentrations of ~50 ,ug/liter, with none exceeding 50 ,ug/liter (Durum et al., 1971~. Ackermann (1971) reported chromium concentrations below 5 ~g/liter for 18 of 27 river stations in Illinois; the maximum was 50,ug/liter. CHEMICAL CHARACTERISTICS The element chromium is amphoteric and can exist in water in several different states. It is present in minor amounts in igneous rocks and is much more abundant in basic and ultrabasic types than in the more silicic types of rocks. In attack by weathering, chromium in cationic form Cr(III) behaves somewhat like iron and is largely retained in resistates and hydrolysates. Very little chromium goes into solution. Natural water,
242 DRINKING WATER AND H"LTH therefore, would be expected to contain only traces of chromium as a cation, unless the pH were very low. Chromium, under strongly oxidizing conditions, may be converted to the hexavalent state and occur as chromate anions. Natural chromates are rare and, when CrO4-is present in water, it is usually the result of pollution by industrial wastes. Fairly high concentrations of chromate anions are possible in water with normal pH (USGS, 1959~. A study by Schroeder and Lee (1975) indicated that the oxidation state of chromium may be altered in natural water. Because of the possibilities for oxidation of Cr(III) and reduction of Cr(VI), they concluded that water-quality standards should be based on total chromium, rather than on hexavalent chromium. METABOLISM Because of analytic problems related to the determination of chromium, data on the absorption and metabolism of chromium must be interpreted with caution. Trivalent chromium affects glucose metabolism, binds strongly with plasma albumin, and interacts with manganese in glucose metabolism(Hambridge, 1971~. In a study in which rats were administered trivalent chromium for a short time, there was no glucose metabolism erect, whereas administra- tion for 15-120 days markedly affected glucose metabolism. Oversupply is reported to be no problem, and there appears to be a homeostatic mechanism for trivalent chromium involving a hepatic or intestinal transport system that rejects excessive accumulation. Oral ascorbic acid converts hexavalent chromium to trivalent chromi- um, and, when given within an hour or two, reduces gastrointestinal tract injury from hexavalent chromium (Hambidge, 1971~. Glucose tolerance in man declines with age; as many as two-thirds of an elderly population sampled in the United States had an abnormal glucose tolerance test. Tissue chromium in the United States also declines with age (Streeten et al., 1965~. The average daily intake of chromium in the United States varies widely due to diet and geography. Estimates range from 5 to 115 ~g/day with an average of 60~5 ,ug/day (NAS, 1974) to 5-500 ~g/day, with an average of 280,ug/day (Schroeder, 1970~. It has been reported that, regardless of dietary history or amount administered, only 0.5-3% of a given dose of trivalent chromium is available to the organism. The degree of absorption depends on the chemical form of the chromium and ranges from 0.1 to 1.2% of trivalent chromium salts to about 25% of the glucose tolerance factor.
Inorganic Solutes 243 Chromium is excreted in urine and feces with the urinary pathway accounting for 80%. Nearly all chromium in urine is present in the form of low-molecular-weight complexes: very little protein bound chromium is excreted. Estimates of excretion also vary between wide extremes. Mean 24-h urinary chromium excretion of 20 young adults was 8.4 ,ug with a range of 1.6 - 21,ug (NAS, 1974~. Other estimates have shown an average urinary excretion from 3 to 160, ~g/day with an average of 138 ,ug/day (Schroeder, 1970~. It is possible that pH plays a role in the physiologic distribution of hexavalent and trivalent chromium; the trivalent precipitates at physio- logic pH and forms chromic hydroxide. Trivalent chromium may also precipitate with proteins (IARC, 1973~. According to Schroeder (1974), the background body burden of chromium in Americans is low and declines between the ages of 34 and 44. Body burdens of Africans, New Easterners, and Orientals are much higher. Thais had higher tissue chromium concentrations than any other group. Organ distribution studies have been inconclusive. Results in rats given doses of chromium chloride showed the ovaries and spleen to have the highest uptake and, the kidneys and liver the next highest, with the lungs, heart, pancreas, and brain lower. But when chromium was given in the form of glucose tolerance factor, the results were different; the liver accumulated most, followed by the uterus, kidneys, and bone. In autopsies of humans, the highest accumulation has been in lungs; this suggests that humans are accumulating most chromium from the air, rather than from water or food (NAS, 1974~. HEALTH EFFECTS Acute systemic poisoning from chromium may result from accidental exposures, from therapeutic uses of chromium, and from suicide attempts. Principal damage to the body is tubular necrosis of the kidney. Cats fed 5~1,000 mg/day of chromic phosphate for 80 days were not affected. Rats fed trivalent chromium at 25 ppm for 1 yr or 5 ppm for a lifetime were also not affected (NAS, 1974~. Hexavalent chromium chemicals can be tolerated by animals in low concentra- tions, especially when they are administered in feed or drinking water, in which the degree of absorption is a factor. For example, rats tolerated hexavalent chromium in drinking water at 25 ppm for a year, and dogs showed no eject of chromium as potassium chromate at 0.45-11.2 ppm over a 4year period. Even higher concentrations have been reported by some investigators. However, larger doses of hexavalent chromium are highly toxic and may cause death, especially
244 DRINKING WATER AND H"LTH when injected intravenously, subcutaneously, or intragastncally (NAS, 1974, p. 82~. Chronic toxicity can be observed In several mammalian species with hexava- lent chromium in the drinking water In concentrations of more than 5 mg/liter. At this concentration, the element was found to accumulate In rats, but it caused no changes in growth rate, food intake, or results of blood analysis. Even 25 mg/liter in the drinking water failed to produce changes In these characteristics or in the histologic appearance of the tissues after 6 months. Dogs tolerated Hexavalent chromium In the water at up to 11.2 mg/liter for 4 years without ill effects. The minimal lethal dose in dogs is approximately 75 mg of chromium as sodium chromate, when injected intravenously. The salt causes acute hypertension, hypocholesterolem~a, and hypoglycemia. Growing chickens showed no detnmen- tal symptoms when they were fed 100 ,~g/g In diet (NAS, 1974, p. 29~. Although Hexavalent chromium has long been recognized as a toxic substance, trivalent chromium is considered by most investigators to be relatively innocuous and even (in microgram amounts) essential to human health. Hexavalent chromium produces hemorrhage of the gastrointestinal tract after ingestion. Inhaled chromate may cause cancer of the respiratory tract in occupationally exposed individuals (IARC, 1973~. It also produces ulceration on dermal exposure. The chronic adverse ejects most often considered in chromium toxicity are respiratory and dermatologic. It now appears that investiga- tors agree on several points: 1. People who work with Hexavalent chromium can develop cutaneous and nasal mucous-membrane ulcers, whereas exposure to trivalent chromium does not produce these effects. 2. People who work with Hexavalent chromium compounds can develop contact dermatitis from these agents, and they react to patch and intracutaneous tests with nonirritant concentrations of potassium bichromate. 3. Hexavalent chromium in tissue is reduced to the trivalent form. 4. Hexavalent chromium has greater diffusibility and solubility In tissue than trivalent chromium. 5. Hexavalent chromium can readily penetrate membranes. 6. Trivalent chromium can readily bind with some proteins to form complexes (NAS, 1974, p. 72~. Atherosclerosis in relation to chromium has been of interest. Studies have indicated that atherosclerosis can be induced in animals by chromium-deficient diets (Hambridge, 1971~. With regard to carcinogenicity, intraosseous, Intramuscular, subcuta- neous, intrapleural, and intraperitoneal injections of chromium com- pounds have been reported to cause the development of sarcomas in rabbits, mice, and rats. There is some evidence that calcium chromate in the form of a pellet attached to the bronchial mucosa in rat lung may be .
Inorganic Solutes 245 carcinogenic, but there is no support for the view that it constitutes a carcinogenic hazard in human food (Sunderman, 1971~. An IARC working group (1973) concluded "there is no evidence that non-occupa- tional exposure to chromium constitutes a cancer hazard." ANALYSIS Both hexavalent and total chromium concentrations are commonly determined in water. Direct aspiration of samples into a flame is used to determine the total chromium content with a detection limit of 3 ,ug/liter. The U.S. Geological Survey (Brown et al., 1970) has suggested a procedure for the determination of hexavalent chromium by extraction with ammonium pyrrolidine dithiocarbamate at a pH of 2.8. The same procedure is also used for the determination of total chromium after oxidation of any trivalent chromium present to the hexavalent state with potassium permanganate. Nix and Goodwin (1970) have used diethyldi- thiocarbamate for extraction of chromium. Fernandez and Manning (1971), Barnard and Fishman (1973), and Surles et al. (1975) have used the graphite furnace to increase sample vaporization for the determination of total chromium; the detection limit is 0.1,ug/liter. CONCLUSIONS AND RECOMMENDATIONS The NAS chromium report offered recommendations for research. These were among the most pressing: 1. At present, only two analytic techniques can be successfully used for accurate quantitative determination of chromium at the low concentrations that exist in many environmental media, especially in plant and animal tissue-neutron activation and shielded-arc emission spectrography. Both methods are expensive and time-consuming and require considerable experience and thus are not applicable to large-scale environmental studies. Laboratory research, using the latest analytic instrumentation, is needed for the development of sensitive, accurate, and precise methods for the analysis of chromium that could be used by most laboratory investigators. . . . 2. Accurate background information on normal concentrations of chromium in various media is necessary for predicting trends. 3. The potential toxicity of chromium depends on its valence state. There are no techniques for estimating the concentration of chromium in relation to its valence state, especially in animal and plant tissue. Data of this type also would be extremely useful for understanding the biologic function and availability of chromium. 4. Research is needed to ascertain the relation between exposure to airborne chromium and chromium concentrations in urine, blood, and other biologic
246 DRINKING WATER AND H"LTH media, such as hair. If any relation is demonstrated, biologic standards for exposure may become possible. (WAS, 1974, pp. 112-113~. There is a strong link between airborne chromium and lung cancer, but there is no firm evidence to establish a relationship between non- occupational exposure by any other route. There is also evidence that chromium has an important role in maintaining glucose metabolism and may also be a factor in atherosclerosis. It is therefore possible that with the exception of occupational exposure a deficiency of chromium may be more of a problem. The present interim drinking-water standard of 0.05 mg/liter is less than the no-observed-adverse-health-e~ect level. Consideration should be given to setting the chromium limit in terms of the hexavalent form. Extensive work is urgently needed to establish the role of dietary chromium with regard to atherosclerosis and glucose metabolism as well as its possible carcinogenic ejects at low levels in lifetime feeding studies. Cobalt OCCURRENCE Cobalt and its salts are used for making alloys, in nuclear technology, as pigments in the china and glass industry, and as binders in the tungsten- carbide tool industry. Cobalt may be divalent or trivalent. Solutions containing Cobaltous ions (Co+2) are relatively stable, but cobaltic ions (Cr+3) are powerful oxidizing agents and are thus unstable in natural water. Cobaltous chloride, Cock, is a highly soluble salt that is used in the manufacture of sympathetic ink, barometers, and hydrometers, as well as in galvanoplating, ceramics, and (as a feed supplement) salt licks for ruminant animals. Cobaltous nitrate, Co(NO3~2, is used in the manufacture of cobalt pigments and sympathetic ink and in decorating porcelain. Cobaltous sulfate, CoSO4, a red crystalline substance that is readily soluble in water, is used in decorating and plating and for remedying cobalt deficiencies in cattle and sheep (McKee and Wolf, 1963~. Durum et al. (1971) examined more than 720 river-water samples during low flows in October 1970 in the 50 states and Puerto Rico; 37% contained traces of cobalt, in the range of 1.(~5.0 ,ug/liter; 54% contained cobalt below the detection limit, i.e., less than 1.0 ~g/liter; 21 samples (2.9~o) contained 6-9 ,ug/liter; 20 samples (2.8~o) contained 10-19 g/liter; 17 samples (2.45370) contained 20-39 ,ug/liter; and 6 samples (0.8~o) contained 40-99 ,ug/liter.
Inorganic Solutes 247 In an earlier report, using emission spectroscopy on 59 samples of water from 15 rivers in the United States and Canada, Durum and Hasty (1961) found a maximum cobalt concentration of 5.8 ,ug/liter in the Mississippi River at Baton Rouge, Louisiana. Kopp and Kroner (1967) noted the presence of cobalt in only 2.8% of their samples from the 15 major river basins of the conterm~nous United States, with concentra- tions ranging from 1.0 to 48,ug/liter and a mean of 17,ug/liter. In Russia, Barabannik et al. (1961) measured cobalt in two artesian supplies used for drinking water at Kiev. These wells vary from 89. 261.5 m in depth. In the shallower wells, cobalt concentrations varied from 0.61 to 2.41 ~g/liter, with an average of 1.32 ~g/liter; in the deeper, the range was 0.43-1.4,ug/liter, with an average of 0.94,ug/liter. Green leafy vegetables are the richest and most variable sources of cobalt in human diets; dairy products and refined cereals are among the poorest. Typical concentrations in food are 0.4{).6 mg/kg (dry weight) in spinach, 0.2 in cabbage and lettuce, 0.01 in cornseed, and 0.003 in white flour. These figures indicate that the diet contributes far greater amounts of cobalt than are ever likely to be obtained from water. CHEMICAL CHARACTERISTICS Cobalt and nickel are very similar in chemical behavior. Both are present in igneous rocks in small amounts and are more prevalent in the basic and ultrabasic types than in silicic rocks. In the process of weathering, cobalt may be taken into soluton more readily than nickel, but it is adsorbed to a great extent by the hydrolysate or oxidate sediments. Cobalt may be taken into solution in small amounts through bacteriologi- cal activity similar to that causing solution of manganese. METABOLISM Cobalt is part of the vitamin BE molecule and as such is an essential nutrient. Ruminants can synthesize their own vitamin BE if they are given cobalt orally. A wide margin of safety (well over 100) exists between the required and toxic doses for sheep and cattle (NAS, 1973~. Nonruminants, such as humans, require preformed vitamin Bit, in which the one cobalt atom per molecule accounts for only 4.34% of the total molecular weight of the vitamin. The requirement of humans for cobalt in the form of vitamin BE is about 0.13 ~g/day (USFDA, 1975~.
248 DRINKING WATER AND H"LTH HEALTH EFFECTS According to Underwood (1973), cobalt has a low order of toxicity in ad species studied. Daily doses of 3 mg/kg of body weight (about 1,000 times normal) can be tolerated by sheep for many weeks without harmful effects. Using the data on 10 of the 15 river basins studied by Kopp and Kroner (1967), Berg and Burbank (1972) examined correlations between potentially carcinogenic trace metals in water supplies and cancer mortality among humans. Cobalt showed no correlation with any of the 34 different types of cancer studied. Cobalt has been severely indicted as a toxicant when added to beer to promote the formation of foam (USFDA, 1975~. Clusters of congestive heart failure deaths were observed in Quebec, Canada; Omaha, Nebras- ka; and Leuven, Belgium among heavy beer drinkers about 1965. Cobalt salts had been added to the beer at cobalt concentrations of 1.2-1.5 mg/liter (Underwood, 1973~. At such concentrations, the consumption of 24 pints a day would supply only about 15 mg of cobalt sulfate well below the amount that can be taken with impunity by normal people. In fact, cobalt salts have been used therapeutically at up to 300 mg/day without cardiotoxic effects. The episodes were clearly attributed to the cobalt: the toxicity was no longer observed when the cobalt was removed. Research has since shown that the addition of cobalt to ethanol results in toxicity which is greater than the additive effects of feeding the materials separately (USFDA, 1975b). In an attempt to provide additional evidence to validate the USSR requirement for cobalt in water, Krasovskii and Fri~yand (1971) performed experiments on 380 white mice, albino rats, and guinea pigs, with various oral doses of cobaltous chloride, nitrate, sulfate, and acetate. The LD50 of cobaltous chloride was 80 mg/kg of body weight for albino rats and 55 mg/kg for guinea pigs. Aqueous solutions of cobalt at 2.5, 0.5, and 0.05 mg/kg of body weight were administered orally for 6 days/week for 7 months. Cobalt poisoning at 2.5 mg/kg was manifested in disturbed conditioned reflexes and alterations in hematopoiesis. The effects on other metabolic processes and overall resistance were less pronounced. The animals treated with 0.5 mg/kg exhibited only mild and transient polycythemia and a decrease in phagocytic activity of leukocytes. At 0.05 mg/kg, there were no effects on the characteristics investigated. According to the FDA report (USFDA, 1975), acute cobalt toxicity in some animals has been demonstrated only at very high doses e.g., in chickens at 50 mg/kg of diet per day and in sheep at 6 mg/kg of body weight per day. At doses under 5 mg/kg of diet (or under 2 mg/kg of
Inorganic Solutes 249 body weight) no adverse effects were noted. At higher dosages, a loss of appetite, loss of weight, and debilitation were observed. However, intravenous injection of cobalt (at less than 1.0 mg/kg of body weight) causes death. The mechanisms of cobalt's toxic action are not well understood. Long-term toxicity in humans was observed primarily in children when cobalt was given to correct anemia (USFDA, 1975~. Between 1955 and 1961, more than four incidents involving more than 10 children were reported. Children between the ages of 3 months and 12 years became ill as a result of cobalt administration with iron in a commercial prepara- tion. The most common observations were the development of goiter and decreased thyroid function. Increased cardiac rate, increased respiration rate, skin changes, and blood lipid changes were also noted. All symptoms were reversed when cobalt therapy was discontinued. The dosages at which.these conditions were observed were between 1 and 6 mg/kg of body weight per day. ANALYSIS With detection limits at 10 ,ug/liter, cobalt in fresh water is not normally detectable by direct flame atomization; a concentration step is usually required for cobalt determination in water. The U.S. Geological Survey (Brown et al., 1970) uses the APDC solvent extraction procedure, in which the cobalt-APDC complex is extracted at a pH of 2.8 with methylisobutylketone. Similar procedures with APDC have been report- ed (Brooks et al., 1967; Traversy, 1971; Kinrade and Van Loon, 1974; Aldous et al., 1975~. Extractions with diethyldithiocarbamate (Nix and Goodwin, 1970) and dithizone (Sachdev and West, 1969) have also been described. Paus (1971) has used the graphite furnace to enhance atomization of the cobalt in fresh water; the detection limit is 0.4,ug/liter. CONCLUSIONS AND RECOMMENDATIONS Cobalt in natural and treated water has been observed only in trace concentrations one-hundredth or less of the amounts occurring natural- ly in foods. It is an essential element for ruminants, in that it allows them to take vitamin B12 internally. Apart from its content in vitamin B12, it provides no known nutritional benefit to humans. In doses in excess of 1 mg/kg of body weight it may pose a health hazard to humans, especially children and older people suffering from other ailments. Cobalt acts with alcohol to produce severe cardiac effects at concentrations as low as
250 DRINKING WATER AND H"LTH about 1.2-1.5 mg/liter of beer. The USSR has set a limit of 1.0 mg/liter of water(Stoefen, 1973~. The Interim Primary Drinking Water Regulations do not limit cobalt, nor has the WHO recommended a limit on its International or European Standards. Because the maximum no-adverse-health-e~ect concentration is more than an order of magnitude greater than that found in any natural-water or drinking-water supply, there appears to be no reason at present to regulate the concentration of cobalt in drinking water. Copper OCCURRENCE Copper is frequently found in suface water and some groundwater. Copper was detected in 74.4% of over 1,500 river- and lake-water samples in the United States at concentrations up to 280 ~g/liter (Kopp and Kroner, 1970~. A recent survey detected a maximum of 40,ug/liter in the North Platte River (USGS, 1974~. Analysis of 13 Canadian surface and groundwaters, including wells, showed copper at 20-860 ~g/liter, the maximum in Lake Ontario (Procter & Gamble, 1974~. Copper in excess of 100 ~g/liter was reported in eight of 27 Illinois streams, with a maximum of 260 ~g/liter (Ackerman, 1971~. Where higher concentrations of copper are found in raw water, pollution from industrial sources can be suspected. The effect of treatment and the pipe material in the distribution system can sometimes produce higher concentrations of copper in finished and tap water than found in the raw-water source. For example, copper tends to increase with the chlorination of water (Shapiro et al., 1962~. In Sweden, on the other hand, some water systems actually show a decrease in copper at the tap, compared with raw water (Bostrom and Wester, 1967~. This may be a reflection of corrosion control or of the degree to which corner has replaced galvanized iron nine in household Plumbing in 1 1 1 ~ r r ~ r - - 0 . ~ ~ T · . ~ ~ . . · ~ ~ ~ ~ ~ ~ . ~ ~ ~ ~ , · . · · . ~ the United Imitates since 195(). the survey of the 1W largest cities In the United States showed finished-water copper at less than 0.61-250 g/liter, with a median of 83 ~g/liter. In Denver (Harnett et al., 1969), the metropolitan water system five water plants with varying raw-water sources and treatment processes-showed a relationship between raw- versus finished-water copper concentration, in micrograms per liter, as follows: 25 and 7.6, 67 and 10.6, 4.8 and 4.2, 4.4 and 8.0, and 3.0 and 3.0. The process that almost doubled its copper content consisted of
Inorganic Solutes 251 chlorination only. The copper concentration at the consumer tap averaged ~12 ~g/liter. In Washington County, Maryland, 669 copper determinations at the tap were made for both public and private water systems. Efforts were made to sample running water, rather than standing water in contact with plumbing systems overnight, because the latter has been shown to have greatly increased trace-metal concentrations in systems without corrosion control. The correlation coefficients of copper concentration with pH, with hardness, and with conductivity were 0.369, 0.162, and 0.173, respectively; all were significant to p = 0.01 (Oliver, 1974~. The principal anodic and cathodic reactions involving copper in fresh water are known (Camp, 1974~. The cold-water corrosion rate of copper tubing as a function of pH is also known; corrosion decreases with increasing pH. Copper in brass, pipe, and domestic utensils could provide a source of copper in water. Soft, low-pH water could raise the intake of copper by as much as 1,400 ,ug/day, whereas hard water would reduce the intake (Schroeder et al., 1966~. The copper content of soils varies considerably with the parent rock, weathering, drainage, pH, and organic content. Copper uptake by plants depends on species and is generally quite low in highly organic alkaline soils. The copper concentration in commonly consumed vegetables and leafy plants seldom exceeds 25 ppm and usually is 1~15 ppm. Grains and seeds are good sources of copper, containing about 20~0 ppm. Oysters, clams, crustacea, and the liver and kidneys of animals may contain 20()400 ppm. The human intake of copper in food is estimated to be 2-5 mg/day. CHEMICAL CHARACTERISTICS Copper salts, such as the sulfates and chlorides, are highly soluble in water with a low pH, but hydrolyze and possibly precipitate copper in water of normal alkalinity. In the normal pH range of natural water containing carbon dioxide, copper might be precipitated as carbonate. This copper salt is soluble at 1.5 ppm in the absence of carbon dioxide. Copper hydroxide, Cu(OH)2, is soluble to the extent of copper at about 1.9 ppm at 25°C. Copper is more soluble than ferric iron and more copper should remain in solution than ferric iron during the weathering and disintegration of rocks under oxidizing conditions. Copper, however, is dissolved and transported less readily than ferrous iron (USGS, 1959~.
252 DRINKING WATER AND H"LTH METABOLISM Copper is recognized as an essential element for both plants and animals. It is a component of several enzymes that perform important physiologic functions. These involve the metabolism of iron and the rate of cell synthesis in the bone marrow. Copper deficiency has been observed in both man and other animals. It is characterized by anemia, loss of hair pigment, reduced growth, and loss of arterial elasticity. Copper deficiency is not a problem in the United States. The absorption of copper, like all essential elements, from the gastrointestinal tract is limited. Of a daily intake of 2.5 ma, 32% is absorbed. The net absorption is about 5% after fecal and urine excretion. Storage of copper is highest in the liver, kidneys, and intestines. HEALTH EFFECTS Copper is a gastrointestinal tract irritant and can be highly toxic. There have been reports (Chuttani et al., 1965) of suicide with gram quantities of CuSO4. Less severe acute episodes have been reported from the ingestion of carbonated beverages that had been in contact with copper tubing or vessels (Hopper, 1958; Semple et al., 1960; Wyllie, 1957; Nicholas, 1968~. The doses were 4~50 mg of copper. There is a report of an infant fatality associated with the drinking of water that contained copper at 6.75 mg/liter for 14 months. Whether the child was genetically intolerant to copper is not known (Walker-Smith and Blomfield, 1973~. Copper sulfate has been recommended as an emetic at doses (as CuSO4) of 500 mg for adults and 37-50 mg for children (Karlson and Noren et al., 1965~. If vomiting does not occur, these doses are considered to be toxic in children (Holtzman and Haslam, 1968; Decker et al., 1972~. The available evidence does not support chronic toxicity in normal human beings attributed to long-term intake of low (< 1 ma) concentra- tions of copper by mouth (USFDA, 1975~. Unlike most animals, sheep are especially sensitive to copper, and a chronic dietary intake of 20-80 ppm is known to be fatal (Todd, 1969; Adamson et al., 1969; Doherty et al., 1969~. The hazard to the general population from dietary copper up to 5 mg appears to be small. A few people are adversely affected by even normal amounts of copper in the diet. This disorder of copper metabolism, Wilson's disease, is inherited as an autosomal recessive trait and leads to hepatic cirrhosis and to necrosis and sclerosis of the corpus striatum
Inorganic Solutes 253 (Scheinbert and Sternlieb, 1965~. Wilson's disease, formerly fatal within a few years, now can be arrested with chelating agents. There is some concern that any substantial increase in dietary copper intake will result in the conversion of latent cases to overt disease. In addition, there may be a few people who share with sheep the deficiency of glucose-6- phosphate dehydrogenase that is believed to cause hypersensitivity to copper (Salvido et al., 1963~. The only teratogenic effects that may be attributed to copper in mammals are from a deficiency during pregnancy in sheep. It appears that a deficiency or excess of copper has significant consequences for developing embryos (Ferm, 1972~. The interim copper limit of 1 mg/liter of drinking water is based on consideration of taste, rather than toxicity. Depending on individual acuity, the threshold of taste varies from 1-5 mg/liter (Cohen et al., 1974~. The European standards for drinking-water are also set on the basis of taste and discoloration of fixtures: 0.05 mg/liter at the pumping station and 3 mg/liter after 16 h of contact with plumbing. The international standard sets 0.05 mg/liter as the acceptable limit, with a maximum of 1.5 mg/liter. The USSR also sets 0.05-mg/liter as the acceptable limit. This standard for copper in drinking water is only one-twentieth of the current interim standard. Only 81% of the systems surveyed in the 1975 Interstate Carrier Water Supply System Analysis could have met the 0.05 mg/liter international standard. ANALYSIS Copper content of fresh water can be determined by direct flame atomization, with a detection limit of 2 Mg/liter Copper is extracted with little difficulty by a wide variety of chelate-solvent systems. The U.S. Geological Survey (Brown et al., 1970) uses the APDC-methylisobutylke- tone extraction of copper from samples at a pH of ~.8. Several other concentration procedures for fresh water have been described (USEPA, 1971; Paus, 1971; Traversy, 1971; Ichinose, 1974; Aldous et a/., 1975~. Dethyldithiocarbamate can also be used as a chelating agent (Nix and Goodwin, 1970~. The graphite furnace has been used to increase sample atomization by Fernandez and Manning (1971), Paus (1971), Dolinsek and Stupar (1973), Barnard and Fishman (1973), and Surles et al. (1975) to implement the determination of copper in fresh water, with a detection limit of 0.05,ug/liter.
254 DRINKING WATER AND H"LTH CONCLUSIONS AND RECOMMENDATIONS At the copper levels found in several extensive water surveys, the potential for toxicity is virtually nonexistent for humans. The current recommended secondary interim standard of 1 mg/liter was only exceeded by 1.6% of 2,595 tap water samples taken in the Community Water Supply Study (USEPA, 19701. This value would appear adequate to protect the health of persons from toxicity due to copper in drinking water. Lead OCCURRENCE . The natural lead content of lake and river water worldwide has been estimated at 1-10 ,ug/liter (Livingstone, 1963~. Kubota et al. (1974) studied concentrations of zinc, cadmium, lead, copper, and cobalt in rural streams in upstate New York as a model of their distribution under natural geochemical conditions and soil weathering. For lead, average distributions were as follows: soluble lead, 0.12,ug/liter (range, 0.05-0.93 g/liter); lead in suspended particulate matter, 484 ppm; lead in soil, 7.0 ppm. These and other data suggest that much of the lead in natural water ends up in sedimentary deposits. There is, however, a distinct regional pattern of lead distribution in the United States. A survey of the mineral content of finished water in the 100 largest cities in the United States was made by Shapiro (1962~. For lead, the following values were found: maximum, 62 ~g/liter; median, 3.7 ~g/liter; minimum, not detectable. In another study of raw and finished water in the United States, covering the period 1962~1967, Kopp and Kroner (1967) reported the following data: frequency of detection, 18.1%; minimum, 1 ~g/liter (minimum detectable amount); maximum, 139 g/liter; mean, 33.9 ~g/liter. The corresponding values for raw water were as follows: frequency of detection, 19.32%; minimum, 2 ~g/liter; maximum, 140 ~g/liter; mean, 23 ,ug/liter. The increment in the mean value for finished water suggests that lead is picked up from the plumbing system. Water samples collected at the tap serviced by 969 water systems throughout the United States indicated an average lead concentration of 13.1 ,ug/liter (McCabe, 1970~. Of the 2,595 samples, 1.4% contained more than the 1962 drinking-water standard of 50 ~g/liter, with a maximum of 64 ~g/liter. Important local variations occur, apparently in relation to the use of
Inorganic Solutes 255 soft "aggressive" water of slightly acidic pH and the use of lead pipe in service and domestic water lines. Craun and McCabe (1975) have used data from Seattle and Boston to illustrate the eject of"corrosive" water of slightly acidic pH. Both cities use impounded surface-water. Chlorina- tion is the only treatment. Comparison between finished-water and tap- water samples showed that in Seattle 95% of the tap-water samples had higher concentrations, with 76~o exceeding the limit of 50 ,ug/liter. In Boston, analyses similarly indicated that lead was being "picked up" in the distribution system; 65~o of the tap-water samples exceeded the 5 g/liter limit for lead. Karalekas et al. ( 1975) have made further studies in the metropolitan Boston area by collecting multiple water samples from 383 households in Boston, Cambridge, and Somerville, Massachusetts. These cities were selected for study mainly because of the wide use of lead pipe in service lines. Lead concentrations at the tap ranged from < 13 to 1,510 ~g/liter, with an overall mean of 30 ~g/liter. Of the samples collected, 15.4% exceeded the EPA interim drinking-water standard of 50 g/liter. In all cases, the lead content of drinking water was higher at the tap than at the treatment plant. Highest concentrations were found in early-morning samples, with the lowest mean concentrations in running water and intermediate values in standing water and in composite samples obtained throughout the day. The mean concentration for composite samples was 93 ~g/liter; for this type of sample, 26.7% exceeded the standard of 50 ~g/liter. The percentage of households exceeding the standard was greater in the Boston (25.5~o) and Somerville (30%) areas than in Cambridge (14.5~o). This was attributed to some differences in the overall composition of the different water-supply systems. Available data generally indicate that the addition of lead to drinking water occurs chiefly in the distribution system, including household plumbing, and that this is most likely to occur in areas with soft "aggressive" water. Craun and McCabe (1975) have reported that the average intake of lead from drinking-water by adults may be estimated at 26 ,ug/day, using the following assumptions: the average lead concentration in tap water is 13 ~g/liter and the daily water consumption by adults is 2 liters. In children, water intake is related to caloric requirements, water absorbed from food, and the need to maintain a dilute urine. On the basis of body weight, water requirements are 2-3 times higher in children than in adults. If one assumes a heavy use of dehydrated powdered food and beverages for infant feeding, with reconstitution entirely with tap water, then lead intake from tap water in a 6-month-old infant may be as high as half the adult intake as estimated above, or 13 ,ug/day. Generally, for ~ 7 , .
256 DRINKING WATER AND H"LTH children under 3 yr of age who receive either a mixed diet or concentrated liquid formula, the amount of tap water used may be estimated at up to 500 ml/day, which would provide a lead intake of up to 6 ~g/day, if one uses the average figure of 13 ,Ag/liter of drinking water at the tap. For young children, this is small, in comparison with food lead. For the general adult population, the lead content of foods is the major source of exposure. Kehoe (1961) estimated from fecal lead data in studies carried out primarily in men that daily dietary lead intake is approximately 300 ~g/day. More recently, Tepper and Levin (1975) concluded that in women, 100 ,ug/day is a closer approximation of current dietary intake. For the adult, balance studies have indicated that absorption of dietary lead is approximately 5-10%. Koybye et al. (1974) used "market basket" data and other information available to the FDA and estimated for 2-yr-old children that dietary intake is approximately 100 ,ug/day. Limited balance data (Alexander et al., 1973) indicated an average intake of 9-10 ,ug/kg or 10~150 ,ug/day for 2-3-yr-old children. More important, these balance data in children are consistent with those in young growing animals and indicate that approximately 4~50~o of dietary lead is absorbed and that 2~25% is retained. Although the distribution of retained lead between bone and soft tissue cannot be determined from these balance studies, autopsy data (Barry, 1975) show a steady increase in bone lead throughout the first 15- 20 yr of life. For children, ingestion of soil and exposure to household dust in old houses are important additional sources of lead intake (Ter Haar and Aronow, 1975; Sayre et al., 1974~. Residents near stationary point sources also constitute special lead- exposure groups (Landrigan et al., 1975~. In summary, it appears that, at an average drinking-water-lead concentration of 13 ,ug/liter, lead intake from drinking water constitutes about one-tenth or less of that obtained from an ordinary diet. CHEMICAL CHARACTERISTICS Lead occurs in rocks primarily as the sulfide (galena) and in the form of oxides. It may replace some ions, such as calcium. Lead also occurs in potassium feldspar, where it replaces potassium. Lead carbonate is common in the oxidized zone of lead ores. Lead sulfate is reported to be soluble in water to the extent of 31 ppm at 25°C. In natural water, this concentration is not approached, however, because a pH of less than 4.5 would probably be required to prevent the formation of lead hydroxide and carbonate. In natural water containing bicarbonate and carbonate alkalinity, the concentration of lead is usually
Inorganic Solutes 257 limited by the solubility of lead carbonate. It has been reported that at 13°C water free of carbon dioxide will dissolve the equivalent of lead at 1.4 ppm; the solubility is increased nearly fourfold by the presence of carbon dioxide at 2.8 ppm. The presence of other ions may increase the solubility of lead. It is likely that lead is adsorbed by minerals in sediments and soils, so that the observed concentrations rarely reach the theoretical limit (USGS, 1959~. Lead may be dissolved from water pipes most readily by water that is low in hardness, bicarbonate, and pH and high in dissolved oxygen and nitrate. The chemical forms and physical states in which lead and other trace metals occur in raw water are not well known. Recent reports (Guy and Chakrabarti, 1975a; Ramamoorthy and Kushner, 1975) suggested that the problem is complex and may well vary from one body of water to another. It has been demonstrated that some aquatic organisms can convert inorganic mercury and arsenic to aLkyl compounds. Recent preliminary data (Won" et al., 1975) suggested that under rather unnatural experimental conditions it is possible to alkylate lead. Wood (1976) has summarized basic conditions for the alky~lation and reductive dealkylation of heavy metals in aquatic systems. He noted that the vitamin BE found in microorganisms holds a unique position in aqueous systems for the alkylation of heavy metals. Conversely, cytochromes may be important in the reduction of metal ions to elemental form. These considerations are not cause for alarm, but they do indicate the need for research in this field. Progress may well depend on improved analytic techniques, if the total metal content is to be fractionated into its various constituents. METABOLISM The absorption of dietary lead is 5-10~o in the adult (Kehoe, 1961) and 4~50YO in children 2-3-years old (Alexander et al., 1973~. No data are available for very young infants, but animal data indicate that the percentage absorbed is age-related and may be higher in early infancy (NAS, 1976~. Absorbed lead is excreted through both the kidneys and the intestinal tract. Long-term balance studies by Kehoe (1961) in adults suggested that adults are in balance. However, these data derived front a few people must be weighed against autopsy data, which indicate that, although soft-tissue lead concentrations remain stable in adults, bone lead content may increase with age, at least to the age of 40 or 50 yr (Barry, 1975; Gross et al., 1975~. Bone is the storage site for at least 90~o
258 DRINKING WATER AND H"LTH of the total lead body burden in adults and approximately 70% in growing children. HEALTH EFFECTS No beneficial elects of lead have yet been found. Acute lead poisoning is extremely rare, if it occurs at all in the general population. One child was estimated to have consumed approximately 1 g of lead per day in fruit juice during the 5 weeks immediately before his death (Klein et al., 19704. In one adult, estimated to have consumed approximately 2 mg of lead per day, at least a year and a half elapsed before the onset of acute symptoms of plumbism (Harris and Elsea, 19671. Lead apparently does not cause gastrointestinal symptoms within a few hours, as is the case of acute poisoning due to ingestion of cadmium, iron, or other heavy metals and metalloids (such as arsenic). The induction of renal tumors with lead has been demonstrated in rats but not in other species. Similarly, mutagenic and teratogenic effects have been reported in experimental systems (NAS, 1972~. However, none of these elects have been documented in man. The main chronic adverse effects of lead are those produced in the hematopoietic system, central and peripheral nervous system, and kidneys. Although disturbance in heme synthesis is considered to be the critical or first adverse effect of lead (Nordberg, 1976), measures of comparable sensitivity for the detection of disturbances in nervous system metabolism are not available. Zielhuis (1975a,b) has summarized available data on dose-response relationships for lead in man. Currently, the most sensitive effect is that on heme synthesis. There is a detectable and statistically significant increase in red-cell protoporphyrin in women and children, as blood-lead concentration increases above about 25-30 ~g/dl (Roels, 1975; Zielhuis, 1975a,b). In men, increase in red-cell protoporphyrin apparently does not occur until blood-lead concentration exceeds about 35~0 ~g/dl of whole blood. Zielhuis (1975a,b) and Albert et al. (1974) reviewed clinical data and suggested that the no-e~ect concentration of lead in the developing human nervous system is approximately 55~0 ~g/dl of whole blood as judged by clinical outcome. However, animal data have suggested that this value may be lower (Brown, 1975; Carson et al., 1974~. In addition, Lancranjan et al. (1975) reported evidence of disturbance in reproductive function in occupationally exposed men with blood-lead concentrations in excess of about 50 60 ~g/dl of whole blood. These disturbances included alterations in spermatogenesis (asthenospermia, hypospermia. teratospermia) through a direct toxic effect of lead on the gonads. Comparable data for women are not available.
Inorganic Solutes 259 Preliminary clinical data from soft-water areas in Boston and in Scotland are now available and suggest a relationship between lead in tap water and blood-lead concentration. The consumption of soft water from the acidic moorlands of Scotland and northern England has been associated with clinical cases of lead poisoning (Bacon et al., 1967; Beattie et al., 19721. In these cases, it appears that soft well water or rainwater was not only conveyed in lead pipes, but also stored in lead- lined cisterns. In these clinical cases, the lead concentration in tap water ranged between 570 and 3,136 ~g/liter. Such water had apparently been consumed over a number of years; those involved were adults. This led Moore et al. (1975) to make a more intensive study in Glasgow, Scotland. In a study of 23 Glasgow households, significant associations were found between water-lead content, length of lead piping, and use of a lead-lined storage tank. Studies in Edinburgh, although showing a relationship between blood lead and tap-water lead, did not fully confirm the data from Glasgow. In Edinburgh, households with copper plumbing were compared with households with lead plumbing. The early-morning sample of water was drawn to clear the lines and then discarded, and a sample drawn later in the day was used. Water-lead concentration in homes with copper plumbing was less than that in homes with lead plumbing, and blood-lead content could be correlated with water-lead content. In the Boston area, Craun and McCabe (1975) reported preliminary data indicating that, when household water-lead content in the sample obtained during the day exceeded 100 ,ug/liter and the data were controlled for proximity to traffic density, a significantly increased frequency of blood-lead concentrations in excess of 35 ~g/dl was found. These human studies although they involved a small number of subjects and were not controlled for sex, age, and smoking habits suggested that drinking-water with a lead content greater than lOO,ug/liter may be sufficient to raise and sustain blood-lead concentrations at above 25 ,ug/dl whole blood. This is the blood level that has been shown to be the apparent threshold for the increased red-cell protoporphyrin. In a provocative retrospective study, Beattie et al. (1975) investigated 77 2-5-yr-old mentally retarded children and 77 nonretarded healthy control children, matched for age, sex, and geographic location in the city of Glasgow, Scotland. They did not have blood-lead data obtained at an earlier, more vulnerable period of development. They concluded that a child exposed during gestation and early infancy to a water-lead content greater than 800 Igniter "is at least 1.7 times (and probably a much greater factor) more likely to be mentally defective than a child whose exposure to water-lead is completely unknown."
260 DRINKING WATER AND H"LTH Experimental data strongly indicate that among human populations the fetus and young child, particularly under 3 yr old, are at increased risk of adverse ejects due to lead. This is based on both a higher rate of intestinal absorption and a high rate of brain growth and maturation. Animal data further suggest that absorption and other dietary compo- nents play a very prominent role in this susceptibility (NAS, 1976~. In addition, people with chronic renal insufficiency and metabolic distur- bance in bone homeostasis and possibly those with zinc deficiency may be at increased risk. There are, however, no data on humans to substantiate these latter hypotheses. ANALYSIS The analysis of lead in biologic samples is fraught with difficulties. The great variations in comparisons between and within laboratories are well known (Lauwerys et al., 1975~. The detection limit with direct flame atomization is 10 ~g/liter. As for most trace metals in water, solvent extraction is the method of choice for concentration. The U.S. Geological Survey (Brown et al., 1970) uses APDC-methylisobutylketone extraction at a pH of 2.8, and this proce- dure has been used by other investigators (Brooks et al., 1967; USEPA, 1971; Paus, 1971; Traversy, 1971; APHA, 1971; Everson and Parker, 1974; Kinrade and Van Loon, 1974~. Diethyldithiocarbamate has also been used to extract lead (Nix and Goodwin, 1970~. Specialized aspiration procedures may be used to improve lead detection limits. The sampling boat and Delves cup have a limit of 1 ,ug/liter (they use 1- and 0.1-ml samples, respectively) and have been applied to water analyses by Kerber and Fernandez(1971), Paus (1971), and Mains et al. (19751. The graphite furnace will increase sample atomizaton and can be used to increase detection to as little as 0.05 ,ug/liter and has been used for fresh water analyses by Paus (1971), Fernandez and Manning (1971), Dolinsek and Stupar (1973), Barnard and Fishman (1973), Rattonetti (1974), and Surles et al. (1975~. CONCLUSIONS AND RECOMMENDATIONS If one uses the critical toxic eject approach to preventive medicine, then a water-lead content of 100 ~g/liter at the household tap is probably not acceptable. "The critical toxic effect is defined as the most sensitive and specific biological change which is outside of acceptable physiological variation" (Nordberg, 1976~. Preliminary data suggest that the present
Inorganic Solutes 261 limit of 50 ,ug/liter may not, in view of other sources of environmental exposure, provide a sufficient margin of safety, particularly for fetuses and young growing children. Although further studies will be necessary to arrive at a reasonable limit, it is suggested that the limit be lowered. This recommendation is made with the assumption that analytical methodology will be sufficient to detect this value above background. 1. A further elucidation of the neurochemical disturbance caused by lead is a basic research need, which should be worked out in appropriate animal models and followed with confirmatory clinical and epidemiolog- ic studies, where possible. Much experimental evidence points to significant interactions between lead, copper, zinc, iron, calcium, and magnesium. These interactions are high-priority items, although their significance may pertain more to nutrition and genetic susceptibility than to drinking water itself. 2. Definitive studies in soft-water areas in relation to the influence of lead contents in the distribution system and measures for its control deserve the highest priority, insofar as drinking-water quality is con- cerned. 3. The question of whether or not lead can be alkylated by aquatic organisms in relation to drinking-water deserves high priority. 4. There are no data on illness of human infants between birth and 1 yr of age as related to lead. Dose-response data for this group, as well as for pregnant women, are urgently needed, to provide a base for estimating overall safe levels of lead exposure for these highly susceptible population groups. Dose-response data are also needed throughout the preschool years; there are very few data that satisfy both epidemiologic and toxicologic criteria for dose-response data in this group. 5. The needed data depend heavily on the availability of precise and accurate analytical measurements. Substantial improvements in methods are needed. Electrochemical approaches appear to be the most promising in this regard, including anodic stripping voltammetry and differential pulse polarography. Magnesium OCCURRENCE In view of the geologic abundance, high solubility, and numerous industrial uses of magnesium, it is not surprising that seawater contains about 1,350 mg/liter. The average for natural fresh water is about 4 mg/liter. In a survey of finished water in public supplies of the 100 largest
262 DRINKING WATER AND H"LTH cities in the United States, Durfor and Becker (1964) reported a median concentration of 6.25 mg/liter, a maximum of 120 mg/liter, and a minimum of nil. The USPHS drinking-water standards of 1925 included a maximum recommended magnesium concentration of 100 mg/liter. This limit was raised to 125 mg/liter in the 1942 and 1946 standards, but it was deleted in the 1962 standards. According to Stoefen (1973), the USSR has not set a limit on magnesium; however, the World Health Organization (WHO) has established European and International desirable limits ranging from 30 to 125 mg/liter, depending on the sulfate concentration. If the sulfate exceeds 250 mg/liter, the magnesium is limited to 30 mg/liter. The WHO specifies an absolute maximum of 150 mg/liter for magnesium in drinking water. Several categories of foods are rich in magnesium e.g., nuts, about 1,900 mg/kg; cereals, about 800 mg/kg; seafoods, about 350 mg/kg; meat, about 260 mg/kg; legumes, about 240 mg/kg; vegetables, about 170 mg/kg; and daily products, about 150 mg/kg. Fruits, refined sugars. and fats are low in magnesium (Schroeder et al., 19699. CHEMICAL CHARACTERISTICS _ a ~7 Magnesium is one of the most common elements in ores, minerals, rocks, and soil. It constitutes about 2.1% of the earth's crust and ranks eighth among the elements in order of abundance. Because it is very active chemically, it is not found in the elemental state in nature. Most of its salts are very soluble; even the carbonate will dissolve to tire extent of 100 300 mg/liter at 20°C. On the basis of the solubility product of magnesium hydroxide at 18°C, magnesium ions theoretically can be present in the following amounts: 28,000 g/liter at pH 7, 28.8 mg/liter at a pH of 10, and 0.288 mg/liter at a pH of 11. This solubility phenomenon is useful in treatment processes to remove magnesium from water; but, insofar as natural waters are concerned, it is described here merely to show that at common pH values magnesium ions may be present at concentrations of many grams per liter in dissolved form (McKee and Wolf, 1967~. METABOLISM Magnesium is an essential element in human and animal nutrition and also in plants, where it is a component of all types of chlorophyll. It is the most abundant intracellular divalent cation in both plants and animals. It is an activator of many mammalian enzymes. Magnesium deficiency in
Inorganic Solutes 263 humans and animals depends on many factors. It occurs in alcoholics, persons performing hard labor in hot climates, those with some endocrine disturbances, and patients using potent diuretics. Excessive magnesium in the body (hypermagnesemia) occurs in humans primarily as a result of severe kidney disease. The average adult American ingests between 240-480 mg/day of magnesium in food and water. Magnesium intakes of 3.6 4.2 mg/kg/day are thought to be adequate to maintain magnesium balance in normal adults (Jones et al., 1967~. The recommended dietary allowances for magnesium are 300 mg/day for women, 350 mg/day for men, and 150 mg/day for children (Coussons, 1969~. The nutritional value of magne- sium supplements beyond these levels has not been established. According to Szostak (1961), magnesium is one of the most important electrolytes in the body. In adults, the body content averages about 25 g (or about 350 mg/kg of body weight) and can vary from 21-28 g. The tissues contain 98% of the body content of magnesium, with the other 257O found in extracellular fluids. The concentration of magnesium in plasma averages 21.6-25.2 mg/liter, with a normal range of 16.8-30 mg/liter. The greatest amount of magnesium is found in the skeleton, which contains more than half the magnesium stored in the body. For normal people on regular diets, the average daily absorption of available magnesium from the gastrointestinal tract is about 3()~0%. Aikawa et al. (1958) administered magnesium-28 orally to 26 human subjects. They found that fecal excretion within 120 h accounted for 59- 88% of the administered dose. Less than 10% of the radioactivity was recovered in the urine within 72 h. The low renal excretion was thought to be due to poor gastrointestinal absorption. Normally, the kidney is the major excretory pathway for magnesium, once it is absorbed. Hence, the kidney is the organ primarily responsible for regulating the total human body content of magnesium. According to Consolazio et al. (1963), when men were exposed to desert temperatures for several days, 1~15% of the total output of magnesium occurred in perspiration. Under extreme conditions, sweat can account for 25% of the daily magnesium excretion; this could lead to hypomagnesemia. HEALTH EFFECTS Magnesium salts at levels over 700 mg/liter (especially magnesium sulfate) have a laxative effect, particularly on new users, although the human body can adapt to the elects of magnesium with time (McKee and Wolf, 1963~. The most sensitive people are affected by MgSO~ at
264 DRINKING WATER AND H"LTH about 400 mg/liter, and the average person, at about 1,000 mg/liter (Kehoe, 1953~. Magnesium salts (principally magnesium hydroxide) are used extensively as antacids and laxatives. The usual therapeutic doses are 5-15 ml of a 7-8.5% solution of magnesium hydroxide and at least 250 mg of magnesium oxide (Goodman and Gilman, 1975~. Magnesium in water is not considered a public-health hazard, because the taste becomes quite unpleasant before toxic concentrations are reached (Negus, 1938~. The taste threshold for magnesium has been reported by Lockhard et al. (1955) as 100 mg/liter in sensitive persons and about 500 mg/liter for the average person (Kehoe, 1953~. A thorough discussion of the role of magnesium in the human body is presented by Szostak (1961) but such detail is beyond the scope of this report. It is sufficient to note here that magnesium is an essential element in human nutrition, that most diets contain adequate amounts of magnesium, that hypomagnesemia occurs frequently in ruminant animals and occasionally in humans under stress, and that hypermagnesemia occurs in humans only as a result of kidney malfunction. ANALYSIS According to Standard Methods (APHA, 1971), three methods are used for the determination of magnesium in water. A gravimetric method can be used, but only after the removal of calcium salts. Magnesism in water can also be determined by atomic-absorption spectrophotometry, with a sensitivity of 15 ~g/liter, and by photometry with a sensitivity of 100 ~g/liter. CONCLUSIONS AND RECOMMENDATIONS Magnesium is an essential element in human, animal, and plant nutrition. Excess magnesium in the diet is seldom harmful, for it is generally excreted in the feces. High concentrations of magnesium sulfate in drinking-water may have a cathartic effect on new users, but persons usually adapt to these levels with time. Excessive magnesium in body tissues and extracellular fluids occurs only as a result of severe kidney malfunction. Magnesium deficiency in humans may occur in alcoholics, persons performing hard labor in hot climates (because magnesium is excreted in sweat), those with some endrocrine disturbances, and patients using potent diuretics. Such deficiencies can best be overcome by oral administration of magnesium compounds. The National Interim Primary Drinking Water Regulations contain no limit for magnesium, nor did the 1962 USPHS Drinking-Water Stan
Inorganic Solutes 265 cards. The USSR has set no limit, but the WHO has recommended a maximum of 150 mg/liter. In view of the fact that concentrations of magnesium in drinking water less than that that impart astringent taste pose no health problem and are more likely to be beneficial, no limitation for reasons of health is needed. Manganese The NAS-NRC (1973) has reviewed the medical and biological ejects of manganese; that work has been reviewed and evaluated for this report, and some sections are quoted here. The EPA has also discussed (1975) manganese, and portions of its review are cited. OCCURRENCE Durum and Haffty (1961) observed a maximum manganese concentra- tion of 181-185 ,ug/liter in two different surface waters. The median for all samples was 20,ug/liter. Kopp and Kroner (1967) detected manganese in 51.4% of surface-water samples; the concentration ranged from 0.3- 3230 ,ug/liter, with a mean of 59 ,ug/liter. A maximum of 1,200 ,ug/liter was detected in two different surface waters in 1974 (USGS, 1974~. CHEMICAL CHARACTERISTICS In chemical behavior and occurrence in natural water, manganese resembles iron. However, manganese is much less abundant in rocks. As a result, the concentration of manganese in water generally is less than that of iron. Manganese occurs in more than one oxidation state. The oxidation states of manganese to be expected in water are Mn+2 and Mn+4. Manganese can also occur in more highly oxidized states (such as permanganate, MnO4-), but is not normally encountered in those forms in natural water. Under reducing conditions, manganese goes into solution in water containing carbon dioxide as manganous ion. Manganous ion is more stable in water in the presence of oxygen than is ferrous ion under similar conditions.-~e presence of organic matter in water stabilizes manganous solutions, perhaps owing to formation of complex ions by organic compounds. "Total" and "dissolved" manganese are reported separately in most water analyses. The difference between the two is likely to be less significant for manganese than for iron, but the same problem exists in determining actual conditions in the aquifer on the basis of"dissolved"
266 DRINKING WATER AND H"LTH manganese values. The "total" manganese values are better for determin- ing these conditions, even though the manganese may be partly in the form of colloidal oxide and hydroxide by the time it is determined. Manganese concentrations greater than 1 mg/liter may result where manganese-bearing minerals are attacked by water under reducing conditions or where some types of bacteria are active. METABOL ISM The divalent manganese ion activates many enzyme reactions involved in carbohydrate breakdown and in the metabolism of organic acids, nitrogen, and phosphorus. Manganese metabolism is regulated by the adrenal glands. Ingested manganese is absorbed through the intestine and is concentrated in the liver. Although manganese may be distributed to the tissues, most of the excess is discharged via the bile or by other gastrointestinal routes, thereby keeping the manganese concentration in various tissues relatively stable (USEPA, 1975~. A small percentage of the manganese excreted into the intestines is reabsorbed and transported in the plasma in its trivalent form. Fast and slow components of the manganese disappear- ance curves have been identified that have respective half times of 4 days and 39 days in humans (USEPA, 1975~. Inorganic manganese excretion is almost exclusively fecal. However, the organic form is excreted in both feces and urine (USEPA, 1975~. Manganese is found in minute concentrations in the cells of all living things and has been established as essential to a wide variety of organisms, including bacteria, plants, and mammals. Manganese is widely distributed throughout the body; concentrations are characteristic for the various organs and vary little within or among species. Higher concentrations of manganese are generally associated with pigmented portions of the body including retina, pigmented conjunctive, dark hair, and dark skin. The pituitary gland, pancreas, liver, kidney, and bones normally have higher concentrations of manganese, and skeletal muscle has a very low concentra- tion . . . . The storage capacity of the liver for manganese is limited and offers a contrast in this regard with iron and copper .... Human livers from healthy people of all ages contain manganese at about 6 8 ppm (dry-weight basis). In contrast with many other trace metals, manganese does not accumulate significantly in the lungs with age, averaging about 0.22 ppm in aged man (WAS, 1973, pp. 8~811. In foods consumed by humans, the highest concentrations of manga- nese are found in nuts, tea, and spices (USEPA, 1975~. The average daily
Inorganic Solutes 267 consumption of manganese for man is from 3 to 7 mg (NAS, 1973~. Of the trace metals, manganese is third in the proportion of intake from water as compared to food (Craun and McCabe, 1975~. HEALTH EFFECTS Manganese is an essential trace nutrient for microorganisms, plants, and animals, including all species of mammals and birds that have been investigated. Manganese deficiency has been observed in many mammalian species, both under field conditions and in the laboratory. It is therefore reasonable to conclude that man also has a nutritional requirement for manganese. The incidence of human manganese deficiency has not been investigated, nor has it been determined whether such a deficiency is a health hazard to man. Moreover, minimal human nutritional requirements have not been established. It will be necessary to determine such requirements if desirable limits of exposure to dietary and environmental manganese are to be established (NAS, 1973, p. 91~. Manganese is a coenzyme in many mitochondrial reactions. Examples of non-specific manganese-activated enzymes include hydrolases, kinas- es, decarboxylases, and transferases. Some enzymes such as succinic dehydrogenase have an absolute requirement for manganese (NAS, 1973). Acute manganese poisoning is extremely rare. Chronic exposure is seldom fatal but may result in permanent crippling. Diagnosis is difficult unless a history of exposure of at least three months is present. The symptoms are sleepiness, muscular twitching, leg cramps, increased tendon reflexes, a peculiar character~s- tic spastic gait, emotional disturbances, and a fixed mask-like expression (USEPA, 1975, p. 6 1~. The toxicity of specific manganese compounds appears to depend upon the type of manganese ion present and the oxidation state of the manganese; the divalent manganese cation is reported to be 2~/~3 times more toxic than the trivalent cation (USEPA, 1975, p. ~2~. Manganese has a very low order of acute oral toxicity. When rats are given 2,000 ppm in their diets growth is unaffected, and hens can tolerate 1,000 ppm without ill effects, but 4,800 ppm is toxic to young chickens (NAS, 19731. Chronic manganese poisoning almost always is the result of inhaling high concentrations of manganese dust. The symptoms appear after several months and are often reversible if exposure is terminated. Even with an inhalation exposure there is some evidence that a large amount of manganese enters the body through intestinal absorption (EPA, 1975~. Chronic manganese poisoning is characterized by progressive deteriora- tion of the central nervous system; the effects are not completely reversible.
268 DRINKING WATER AND H"LTH There is currently no evidence that human exposure to manganese at the levels commonly observed in the ambient atmosphere results in adverse health effects. The only human health effects attributable to manganese in ambient air were found in persons living in the immediate vicinity of two major point sources in Norway and Italy. Manganese pollution is presently a local problem, but the widespread use of manganese fuel additives would make man-made emissions more ubiquitous. There is no evidence that predicted manganese concentrations resulting from the use of methylcyclopentadienyl manganese tricarbonyl would result in adverse health effects; however, respiratory irritant elects from long- term or frequent exposure to low concentrations have not been thoroughly investigated. Most effects from manganese in humans appear to result from prolonged inhalation. Manganese pollution of water does not appear to be a problem except possibly in isolated cases of waste disposal. Atmospheric concentrations of manganese observed in urban areas can be attributed primarily to man-made sources. The principal source of atmospheric emissions is metallur- gical processing (USEPA, 1975, p. 2-31. Chronic exposures to high levels of manganese increase hemoglobin values and erythrocyte counts, which indicates that manganese stimulates production of erythrocytes, as does iron-deficiency anemia. Recovery from anemia caused by improper nutrition is much prompter following the administration of ferrous sulfate and manganese chloride than of ferrous sulfate alone, which demonstrates the relationship between the effect of manganese on erythrocyte production and the intestinal absorption of manganese in anemic individuals (USEPA, 1975, p. 6 2~. The necrologic manifestations of manganese poisoning appear to be caused mainly by inhalation of dust or fumes, with ingestion as an additional factor. An acute waterborne epidemic was reported in Japan in 1941. An encephalitis-like disease occurred in six members of a family. All had the same symptoms, including loss of appetite, constipation, and a mask-like facial expression, with running saliva. Tonicity of muscles was decreased; the leg joints were painful and rigid; the arm muscles showed rigidity and tremors; there was temporary double vision; tendon reflexes were increased; and there was some mental disturbances, memory loss, and melancholia . . .. One victim had died, two were hospitalized, and three were up and about. Blood and spinal fluid samples were sterile, with normal cellular counts. Histologic examination of the autopsy material from brain and spinal cord showed no signs of encephali- tis . Symptoms pointed strongly to some form of intoxication . . . . It was learned that the family maintained a bicycle-repair shop and that many old dry cells for bicycle lamps had been buried near a well that supplied water for the family. It was presumed that the intoxication was caused by manganese, which, with zinc, is a principal constitutent of the cells. [Well-water] analysis showed unusually high concentrations of manganese and zinc in the water from this and several other wells. Manganese and zinc were found in large quantities in the viscera of the autopsied victims and in the blood and urine of survivors. Ten more patients were
Inorganic Solutes 269 discovered among the neighbors of the family; all had drunk the contaminated water (WAS, 1974, pp. 109-110~. Both acute and chronic ejects of manganese poisoning are similar to Parkinson's disease. There appear to be some similarities between the clinical features of the extrapyramidal disease of manganism and those of Parkinsonism. There is some indirect evidence that chronic manganism and Parkinsonism may have similar biochemical abnormalities with respect to the extrapyramidal system. It has been shown that levels of dopamine, one of the chemicals that functions in transmission of nervous impulses, are reduced in discrete areas of the brain in Parkinson's disease. Europa, the precursor of dopamine, can cross the blood-brain barrier and be converted to dopamine in the brain. Europa has proved to be quite beneficial in Parkinson's disease. It has has also been successfully used as therapy in persons with chronic manganism, which has been associated with decreased brain dopamine (NAS, 19741. ANALYSIS The manganese detection limit by direct flame atomization is 2 ,ug/liter. However, solvent extraction is used for many determinations. Analytic conditions are more critical for the extraction of manganese than for most other metals, because many manganese-chelate complexes are unstable in solution. With pH control and immediate analysis after extraction, accurate determinations are possible. The U.S. Geological Survey procedure (Brown et al., 1970; Aldous et al., 1975) uses the extraction of the manganese-APDC complex with methylisobutylketone at a pH of 6.0 with immediate aspiration of the extract. Yanagisawa et al. (1969) and Jenne and Ball (1972) have studied the stability of manganese chelates. When the graphite furnace is used to increase sample atom~za- tion, the detection limit is lowered to 0.01 ~g/liter. Fernandez and Manning (1971), Barnard and Fishman (1973), Surles et al. (1975), and Shigematsu et al. (1975) have described its application to freshwater analysis. CONCLUSIONS AND RECOMMENDATIONS Manganese is an essential trace element for man. It plays an important role in many enzyme systems. Manganese toxicity has been associated with airborne exposure, but chronic toxicity from drinking water has not been reported. With surface water averaging less than 0.05 mg/liter in
270 DRINKING WATER AND H"LTH several surveys, the potential for harm from this source is virtually nonexistent. The main problem with manganese in drinking water has to do with undesirable taste and discoloration of the water. The WHO (1970) suggests that such problems may arise at concentrations of manganese greater than 0.05 mg/liter, the same limit recommended by the USPHS (19621. The manganese report from NAS (1973) suggested several research priorities for gaining a better understanding of manganese toxicity. Some of the questions which need answers include the following: 1. Is there individual human susceptibility to excessive or deficient concentra- tions of manganese? If so, how can it be detected, and how can it be predicted? Are the differences due to diet, genetic makeup, concomitant stress, variations In absorpton, disease, or interactions with drugs and chemicals? Are there also group differences? 2. What are the effects on pregnant women and infants of chronic excessive exposure to manganese? Is the fetus at risk? 3. What controls the metabolism and turnover of manganese? 4. What accounts for the time course of the symptoms in manganism? Why do the psychiatric symptoms precede the necrologic? 5. With few exceptions, manganese pollution does not occur in isolation from pollution from other substances. How do these pollutants interact? Are their ejects merely additive, or do some combinations create special hazards to health? 6. Are the so-called lower exudative states more toxic than the higher ones? This has often been reported but has not been proved. Indeed dose-response relations have not been established for any manganese compound. Does the toxicity of manganese depend on its physical form? 7. Further research is needed to determine the clinical value of present tests of blood, urine, and hair as indices of recent absorption of excessive manganese. Does increased manganese content of any of these samples correlate with later features of manganese toxicity? (NAS, 1973, pp. 137-138~. Mercury OCCURRENCE Mercury is one of the least abundant elements in the earth's crust, being seventy-fourth in a list of ninety. Greater than trace amounts are found in at least thirty ores, but in only one, the sulfide cinnabar, does the concentration justify commercial extraction. A major use of mercury has been as a cathode in the electrolytic preparation of chlorine and caustic soda; this accounted for 33% of total demand in the United States in 1968. Electrical apparatus (lamps, arc
Inorganic Solutes 271 rectifiers, and mercury battery cells) accounted for 27%, and industrial and control instruments (switches, thermometers, and barometers) and general laboratory applications accounted for 14% of demand. Use of mercury in antifouling and mildewproofing paints (into) and mercury formulations used to control fungal diseases of seeds, bulbs, plants, and vegetation (by) were other major sources of demand. The remainder (by) was for dental amalgams, catalysts, pulp and paper manufacture, pharmaceuticals, and metallurgy and mining (Wallace et al., 1971~. Because of associated environmental hazards, the EPA in February 1976 canceled registrations for all pesticide products containing mercury used as bactericides and fungicides in paints and coatings, on turf, for seed treatment, and for any other use not specifically permitted (USEPA, 1976). According to data published by the U. S. Geological Survey in 1970 (USGS, 1970), mercury concentrations in broad categories of rocks ranged from 0.01 to 20 ppm. Igneous rocks generally contain less than 0.2 ppm and sedimentary rocks generally average less than 0.10 ppm, except for organic rich shales, which may have concentrations of 10 ppm or more. Seawater contains 0.03-2.0 ,ug/liter, depending on the sampled area, the depth, and the analyst. In a study of Pacific waters, mercury concentrations were found to increase from surface values of near 0.10 ,ug/liter to 0.15-0.27 ,ug/liter at greater depths. In an area seriously affected by pollution (Minamata Bay, Japan), values ranged from 1.~3.6 ,ug/liter. Oceanic mercury is generally present as an anionic complex (HgCl3-), which does not have as pronounced a tendency to bind to particulate substances and then settle out as do mercury compounds found in fresh water (Wallace et al., 1971~. Little attention was paid to mercury in water in the United States before 1970. A 5-yr summary (1962-1967) of trace metals in rivers and lakes of the United States prepared by the U.S. Department of the Interior, Federal Water Pollution Control Administration, did not include mercury among the trace elements reported (Kopp et al., 1967~. The Department of the Interior carried out a nationwide reconnaissance of mercury in U.S. waters in the summer and fall of 1970 (Jenne et al., 19724. Of the samples from the industrial wastewater category, 30% contained mercury at greater than 10,ug/liter; nearly 0.5% of the samples in this group contained more than 1,000 ~g/liter. Only 4% of the surface- water samples contained in excess of 10 ~g/liter. The higher mercury concentrations were generally found in small streams. About half the 43 samples from the Mississippi River contained less than 0.1 ,ug/liter. The
272 DRINKING WATER AND H"LTH mercury content of lakes and reservoirs was between 0.1 and 1.8 ,ug/liter. With few exceptions, the mercury content of groundwater samples was below detection (0.1 ,ug/liter). In a survey done by the EPA Division of Water Hygiene, 273 community, recreational, and federal installation water supplies were examined. Of these 261 or 95.5% showed either no detectable mercury or less than 1.0 ,ug/liter in the raw and finished water. Eleven of the supplies had mercury concentrations of 1.0~.8 ,ug/liter and one supply exceeded 5.0 ,ug/liter. When this one supply was extensively reexamined the mercury concentration was found to be less than 0.8 ,ug/liter (Hammerstrom et al., 19721. The combined ejects of treatment and distribution on trace elements, including mercury, were investigated in the municipal water systems of three cities in Sweden. The concentration range for mercury was 0.09~.4 ,ug/liter in raw water, and it remained unchanged in tap water in the three systems (Andelman, 19741. All vegetable materials naturally contain traces of mercury, the actual amount depending on the locality from which the sample was taken, the species, and other factors. The mercury concentrations in plant materials generally range from 0.10 ppm down to 0.01 ppm or even less; but higher concentrations are found and may be caused by naturally high concen- trations of mercury in the soil. Background concentrations of mercury in animals are difficult to assess, particularly for terrestrial samples, because former agricultural uses of mercury products were so widespread and uncontaminated sources so rare. Data from the literature suggest that normal values for eggs and the flesh of birds and animals are generally less than 0.02 ppm. Marine fish have mercury concentrations usually below 0.10 ppm and nearly always below 0.15 ppm, but this depends very much on species as swordfish may contain more than 1 ppm. Concentrations of 0.20 ppm or less are assumed normal for freshwater fish, but once again this depends on species and region. The higher background concentrations in fish as compared to other animals, fruits, and vegetables are due to the marked ability of fish to accumulate methylmercury ~lallace et al., 1971~. Of particular significance with regard to assessing the potential health hazard of mercury is the fact that the mercury in freshwater fish flesh is predominantly in the form of methylmercury compounds, despite the fact that most mercu~released-into rive - lakes, and oceans is in the form of the inorganic salt or the metallic element (Goldwater and Clarkson, 1972~. Methylmercury becomes available in the fish food chain through the transformation of inorganic mercury into the organic methylmercury form by microorganisms or other biologically derived alkylating systems present in the sediments of lakes, rivers, and estuaries. These systems are
Inorganic Solutes 273 capable of forming methylmercury and dimethylmercury from inorganic mercury, under both aerobic and anaerobic conditions. Although environmental mercury had been a matter of concern and under intensive investigation for many years elsewhere, notably in Sweden and Japan, it was not until 1970 that the problem received noteworthy attention in the United States. In March 1970, a Norwegian investigator working in Canada reported high concentrations of mercury in fish from Lake St. Clair. This triggered extensive investigations of mercury in fish from both Canada and the United States (Goldwater, 19711. The USFDA established a mercury concentration of 0.5 ppm in fish tissue as a guideline for evaluating results of the fish investigations. By September 1970, 18 states had taken specific actions, ranging from general warnings to closure of fishing in designated waters. Attention was focused on mercury-containing waste discharges from chlor-alkali plants. The operators of these plants took prompt action to reduce mercury discharges. The reductions were monitored by the Department of the Interior, which found that the overall extent of mercury emission dropped 86%, from 287 lb/day in July to 40 lb/day in September (Wallace et al., 1971~. CHEMICAL CHARACTERISTICS 0 1 ~- ' Metallic mercury is regarded as virtually insoluble in water. Mercury forms two series of salts, traditionally considered as being univalent and divalent. However, it has been shown that the "univalent" compounds contain the group Hg2+2 (or +Hg=Hg+), with two mercury atoms covalently bound to each other, so this series is actually divalent. Univalent (mercurous) salts are mostly insoluble, and the divalent (mercuric) series is mostly soluble, except the iodide and sulfide. Mercury has a remarkable ability among metals to form compounds with organic radicals, normally linking covalently to a carbon atom. Organic mercury compounds can be conveniently classified into two types, RHgX and R2Hg, where R is an organic radical and X an inorganic (radical) ion. RHgX compounds in general are crystalline solids whose properties depend on the nature of X. When X is chloride, bromide, iodide, cyanide, thiocyanide, or hydroxyl, the compound is a covalent nonpolar substance more soluble in organic liquids than in water. When X is a sulfate, nitrate, phosphate, or perchlorate radical, the substance is saltlike, that is, ionic. R~Hg compounds are nonpolar, volatile, toxic liquids or low-melting- point solids. All are thermally unstable and light sensitive (Wallace et al., 1971).
274 DRINKING WATER AND HEALTH METABOLISM Investigations of the metabolism of mercury and its various compounds, particularly the comprehensive studies in Japan and Sweden, have been reported on extensively. Takeuchi ( 1970) has summarized Japanese investigations of the biologic reactions and pathologic changes in human beings and animals caused by organic mercury contamination. Specific data on human excretion of methylmercuric nitrate were derived from studies with orally administered labeled compound. Three male volunteers were given an oral dose of [203Hg~methylmercuric nitrate. Over 90% was absorbed; maximum blood content was reached 3- 6 h after ingestion. The liver contained 55% of the total radioactivity, with 12970 in the head. The biologic half-life was determined to be 70 74 days (Ekman et al., 1968; Aberg et al., 1969; Falk et al., 1971~. Methylmercury and other short-chain alkylmercury compounds exert their main toxicologic effects on the nervous system. In man, methylmer- cury concentrations in blood cells and hair provide the best index of exposure of the nervous system to methylmercury compounds. If exposure to other mercury compounds is minor, compared with exposure to methylmercury, analysis of total mercury mall be used instead. Blood concentrations of mercury reflect more accurately the intake from recent exposure to methylmercury; hair concentrations reflect the average intake over a long period. The mercury concentrations in successive segments of hair over the period of its formation can indicate the degrees of past absorption of mercury compounds. The factors that determine the biotransformation of mercurials, their passage through barriers in the body, and the ultimate action on cellular mechanisms are only beginning to be understood. The amount of a particular compound present in the body is the result of a balance between intake and excretion. When the same amount is taken in each day, the body content rises progressively to a plateau at which excretion equals intake. The time to reach a steady state in the body is determined by the half-time of excretion. Taking the half-time of excretion in man as 70 days, a steady state in a person will be reached in approximately a year. Once attained, the steady state concentration of mercury is proportional to the daily intake. Studies of methylmercury in humans support this conclusion (Goldwater et al., 1972~. HEALTH EFFECTS Exposure to metallic mercury via routes other than inhalation is infrequent. Oral doses of 100 500 g have been given to man with little
Inorganic Solutes 275 effect, because of poor absorption, although they occasionally resulted in diarrhea. The comparative toxicity of inorganic mercury salts is related to their absorption. Thus, insoluble mercurous salts, such as calomel (mercurous chloride), are relatively nontoxic. In man, some data are available on accidental or intentional overdosage with mercuric chloride. The immediate elects of acute poisoning are due to irritation, coagula- tion, and superficial corrosion of exposed tissues. Chronic effects include kidney damage, as intestinal hemorrhage, and ulceration. Investigation of laboratory technicians subject to inhalation exposure to mercuric chloride (0.2~.3 mg/m3) showed high urinary concentrations of protein, considered suggestive of early renal tubular dysfunction. From these considerations, it appears that metallic mercury and inorganic mercury salts themselves are not significant contributors to the current problem concerning environmental contamination. The problem appears to be related mainly to methylmercury compounds in the environment, particularly in fish, and to accidental ingestion, either of treated seed grain or of meat from animals that had been fed grain treated with alkylmercury compounds (Lu et al., 19721. Two major outbreaks of environmentally related methylmercury intoxication have occurred in recent years in Japan in the Minamata Bay area (1953-1961) and in Niigata (1964 1965~. Of the 121 cases recorded in the Minamata Bay episode, there were 46 deaths. About half the adult victims, one-third of the children, and one-eighth of the fetal victims died. In Niigata, 30 cases, including five deaths, were reported in 1965. Thereafter, 17 cases, including one death and one fetal case, were reported from 1966-1970. In both outbreaks, industrial pollution of waters, with later contamination of fish and shellfish by mercury as methvlmercurv. was shown to be the cause (Beralund. 19711. There was J J. no indication in the report that drinking water was considered as a possible contributor to the outbreaks. There have been many reports of poisoning after accidental ingestion of methylmercury compounds. In Pakistan, in 1961, several families became ill after eating wheat seed treated with phenylmercuric acetate and ethylmercuric chloride, and 5 of 34 hospitalized patients died. A similar episode occurred in Guatemala in 1965, when there were 20 deaths among 45 people who displayed typical symptoms of mercury poisoning after eating wheat seed treated with methylmercury dicyan- diamide. In Iraq, 331 cases of poisoning with 36 fatalities resulted between 1956 and 1960, owing to ingestion of seed treated with ethylmercuric-p-tolylsulfanilide. In Ghana, in 1967, 17 of 65 persons died after ingestion of stolen maize that had been treated with Merkuran, a product containing 2% ethylmercuric chloride (Lu et al., 19721. Members
276 DRINKING WATER AND H"LTH of a family in Alamogordo, New Mexico, were victims of mercury intoxication in 1969 from eating meat from animals that had been fed grain treated with alkylmercury compounds. This episode is particularly significant, because it demonstrated the effects of methylmercury on the fetal nervous system: There was a case of mercury poisoning during a pregnancy. The patient's mother ate mercury-contaminated pork, proba- bly during the second trimester of her pregnancy. The full-te'~' boy who was born had severe tremors at birth, which persisted for several days.- His urinary mercury concentration during the first day of life was 2.7 ,ug/liter, 100 times the quoted normal adult concentration. By 6 weeks of age, the infant was noted to be hypertonic and irritable; mercury could not be detected in his urine. By 8 months of age, he had myochon~c seizures and was hypotonic, irritable, grossly retarded, and probably cortically blind. He had never been breast fed; this fact provided evidence that this was a case of intrauterine poisoning. The mother was asymptomatic, despite having documented increased urinary mercury concentrations during the third trimester of her pregnancy (Scanlon, 1975~. The frequency of occurrence of various symptoms and signs in Minamata disease (methylmercury poisoning) among adults, children, and infants as recorded in the Japanese studies is presented in Table V- 11. The amount of methylmercury needed to produce Minamata disease is TABLE V-l I Frequency of Occurrence of Various Symptoms and Signs In Minamata Disease (~o) Symptoms Infants" ChildrenAdults Mental disturbance 100 10071 Ataxia I 00 10094 Impairment of the gait 100 10082 Disturbance in speech 100 9488 Hearing impairment 4.5 6785 Constriction of visual fields 100?100 Disturbance in chewing and swallowing 100 8994 Brisk and increased tendon reflex 82 7234 Pathological reflex 54 5012 Involuntary movement 73 4027-76 Primitive reflex 73 00 Impairment of superficial sensation ? ?100 Salivation 72 5624 Forced laughing 27 29 (From Takeuchi, 1970) "Exposed in utero.
Inorganic Solutes 277 not known, nor is there a specific biochemical test available as a diagnostic aid in mercury poisoning (Goldwater et al., 1972~. Establish- ment of exact relationships between the dose of a mercurial taken into the body and the health effects expected presents a number of difficulties. The nature of the mercury compound has a marked effect on absorption and metabolism, and therefore on toxicity. Data that refer only to the amount of elemental mercury are not of much help. Methods of analysis have not been very sensitive, so the effects of small doses continued over long periods cannot be followed accurately. In a report issued in 1970, the Swedish Commission on Evaluating the Toxicity of Mercury in Fish set forth its recommendation related to allowable intakes of methylmercury (Berglund, 1971~. It recommended the use of the "allowable daily intake" (ADI) as a method of warning consumers so they could restrict their intake of mercury-contaminated foods. On the basis of available information, they concluded that it appeared "justifiable" to assume that clinically manifest poisoning of adults sensitive to methylmercury may occur with a concentration in whole blood down to 0.2 Agog, which seems to be reached on exposure to about 0.3 mg of mercury (as methylmercury) per day, or about 4 ,ug/kg/day. It was pointed out, however, that concentrations of 0.2 Gag or higher in the blood cells had been measured in some 20 persons and concentrations exceeding 0.4 ,ug/g in four persons without any clinical symptoms of methylmercury poisoning in Sweden and Finland, and even concentrations of 50 ,ug/g or more in the hair of at least 130 persons in Japan who were not considered to be poisoned. They cited a number of elements of uncertainty that must be considered in further evaluation of these conclusions, including the acknowledgment that the data on prenatal poisoning are particularly limited. A safety factor of 10 was applied to the lowest mercury exposure that was assumed to cause the necrologic symptoms of clinically manifest intoxication. It was conclud- ed that the "acceptable daily intake" of methylmercury through fish would correspond to about 0.03 mg of mercury (as methylmercury), or about 0.4 ~g/kg of body weight. ANALYSIS Mercury in fresh water is below the detection limit of 250 ,ug/liter by conventional flame atomization. Issaq and Zielinski (1974) observed a 5~ fold mercury signal enhancement when hydrogen peroxide was added to the aqueous mercury solution. Solvent extraction with APDC or dithizone may be used, but the preferred method of analysis is the cold- vapor technique of Hatch and Ott (1968~. By this procedure, mercury
278 DRINKING WATER AND H"LTH vapor is formed by reduction of mercuric ions in solution by stannous chloride and passed through an absorption cell situated in the light path of a spectrophotometer. Detection limits better than 0.1 ~g/liter are easily obtainable for water samples. Most other published procedures also use stannous chloride as the reducing agent (USEPA, 1 97 1; Omang, 1 97 1; Traversy, 1971; Baltisberger and Knudson, 1974~. Mercury in organic matter can be oxidized by persulfate; the resulting solution is analyzed for mercury by flameless atomic absorption (Alberta et al., 1974; Feldman, 19741. Methylmercury can be extracted with benzene and then subjected to flameless atomic-absorption analysis (Bisogni and Lawrence, 1974~. CONCLUSIONS AND RECOMMENDATIONS The current problems concerning mercury contamination of the environ- ment appear to be related mainly to methylmercury compounds. As far as humans are concerned, the presence of these compounds in foods (principally fish) and the accidental ingestion of treated seed grain or the ingestion of meat from animals that had been fed grain treated with alkylmercury compounds are the major problems. Drastic limitations imposed or being imposed by official agencies on the industrial discharge of mercury-containing wastes that contribute to methylmercury contami- nation of fish, on the allowable mercury content in fish used for human consumption, and on the use of mercurial fungicides should minimize the mercury hazard to man from these sources. There is no indication that mercury compounds in the concentrations and forms found in the ambient atmosphere or in drinking-water supplies contribute significantly to methylmercury intoxication in humans. European drinking-water standards (WHO, 1970) do not contain a standard for mercury. The international standards for drinking water (WHO, 1971) recommend that the tentative upper limit for mercury in drinking-water be I ~g/liter. The USSR has a standard of 5 ~g/liter (inorganic compounds only) (Stofen, 1973~. The EPA-proposed drinking- water standard for mercury is 2 ~g/liter (total mercury). Drinking water containing mercury at this concentration will contribute a total of 4 leg to the daily intake. According to the EPA, only a small fraction of the mercury in drinking water is in alkyl form, and the contribution of methylmercury to the daily intake will be less than 4 ng (0.004 ~g)- approximately 0.01 % of the ADI for methylmercury recommended by the Swedish commission. At this level, the potential hazard to humans from mercury in U.S. water supplies is inconsequential, compared with the contribution from food.
Inorganic Solutes 279 In light of this and the fact that nearly all drinking-water supplies in the United States are already in compliance with the current interim regulation, there is serious question as to whether a standard is needed or serves any useful purpose. There is however, a lack of firm data on the ratio of organic mercury to total mercury in drinking water supplies, although it is Generally accented that mercurY in drinking water is ° °- ~ ~~ ~ -~---r-~ ---I --- ~ me, .~ _ · · .. · · · ~ .. ·. · . · . . . . . . . . .. ~ . principally in 1norgamc form. onto it 1S demonstrated that tills belle! 1S universally applicable to water supplies' it appears desirable to limit the concentration of mercury in drinking water as if it were methylmercur,y. There is a need for specific investigations to validate or modify the prevailing opinion that mercury in drinking water is principally in the . . ,% inorganic form. Molybdenum OCCURRENCE Molybdenum metal and its salts are used primarily in metallurgy and for electric and electronic apparatus. Other uses are in the glass and ceramics industries, for the production of pigments, and as a constituent of fertilizers for leguminous crops (McKee and Wolf, 1963; NAS, 1973; Davis, 1974~. Molybdenum salts can reach surface and groundwater as a result of the mining of molybdenum sulfide. They are also by-products of the mining and milling of uranium. The burning of fossil fuels and natural weathering processes are other sources of molybdenum in the environment. Transport can be by air and water (Chappell, 1973~. Molybdenum is present in surface water and groundwater at very low concentrations. With emission spectroscopy, Durum and Haffty ( 1961 ) measured molybdenum in 59 samples of surface water from 15 rivers in the United States and Canada. The maximum concentration observed was 6.9 ~g/liter, in the Colorado River at Yuma, Arizona. Kopp and Kroner (1967) noted the presence of molybdenum in 32.7% of their surface-water samples from the 15 major river basins of the coterminous United States, with concentrations ranging from 2.0 to 1,500 ~g/liter. The overall mean was 60 ~g/liter, and 26 stations had means greater than 50 g/liter. Of the 4 stations recording the highest values, 3 were in Colorado and I was just across the border on a stream draining from Colorado (Chappell, 1973~. Chappell (1973) reported tap-water concentrations as high as 580 ,ug/liter. In the finished-water supplies of the 100 largest cities in the United States, Durfor and Becker ( 1964) reported the maximum molybdenum concentration as 68 ~g/liter, the median as 1.4 u~/1iter. and 1 ~
280 DRINKING WATER AND H"LTH the minimal as not detectable. In a survey of 380 finished waters in the United States between 1 October 1962 and 30 September 1967, Kopp (1970) reported that 29.9% had measurable concentrations of molybde- num, with a maximum of 1,024 ~g/liter, a minimum of 3 ,ug/liter, and a mean of 85.9 ~g/liter. According to Hadjimarkos (1967), the mean drinking-water concentration was 8 ~g/liter. Kehoe et al. (1944) reported that the concentrations of molybdenum ranged from nil to 270,ug/liter in groundwater and from 0.1 to 0.5 ,ug/liter in seawater. Wells used for watering livestock and irrigated forage at Canon City, Colorado, had up to 25,000,ug/liter and resulted in molybdenosis (Chappell, 1973~. Barnett et al. (1969) studied several trace metals in raw, treated, and tap water for the Denver municipal system. This system draws its supplies from three watersheds (one being Dillon Reservoir) and treats them in four filter plants, one of which is an old, slow sand filter. Distributed water was sampled at four carefully selected locations in residences. On 15 September 1966, water from Dillon Reservoir reached 530,ug/liter of molybdenum, but it was blended with water from the South Platte River before filtration. Unlike copper and manganese, molybdenum is not removed sig- nificantly by treatment processes and not changed by distribution. At one tap, for example, a sample collected in May 1966 (when very little water from Dillon Reservoir was being used) contained 8 ,ug/liter; by 16 September 1966, the concentration in water from this tap was 190 ,ug/liter. Distribution and plumbing have very little, if any, measurable erect on molybdenum concentration. The USSR has established a limit of 0.5 mg/liter for Mo+6 in surface water (Stoefen, 1973~. Konovalov et al. (1966) reported the concentration of suspended and dissolved molybdenum in four major drainage basins of European USSR. In 32 samples, molybdenum was detected in only 4, with a maximum concentration of 14.8,ug/liter and a minimal concentra- tion of 0.1 ~g/liter. High concentrations occurred in rivers draining molybdenum mining and milling operations. The atmospheric transport of molybdenum may be significant, but human ingestion of airborne molybdenum is unlikely to constitute a major pathway of intake. Kaakinen and Jorden (in Chappell, 1973) studied the fate of molybdenum in a coal-fired electric power plant in Colorado. Their results showed that molybdenum from coal is definitely enriched in fly ash leaving a coal-fired power plant in stack gases (even after treatment with electrostatic precipitators and wet scrubbers), but significantly decreased in bottom ash. Enrichment in fly ash appears to be related to the volatility of molybdenum and its adsorption on fine particles. Molybdenum that escapes in particulate matter in stack gases
Inorganic Solutes 281 may be expected to settle to earth and enrich the soil, plants, and water, thereby possibly contributing to molybdenosis of livestock. It is concluded that molybdenum in drinking-water, except possibly from highly contaminated molybdenum-mining wastewater, is not likely to constitute a significant portion of the total human daily intake of molybdenum. For example, according to Hadjimarkos ( 1967), the average drinking water provides only 1.6% of the daily human intake of molybdenum. CHEMICAL CHARACTERISTICS Molybdenum occurs in nature in a IV oxidation state in the sulfide molybdenite (the commercial source) and in a VI oxidation state in molybdate salts. It is uniformly distributed among igneous rocks, with a slight concentration in basaltic rocks. It makes up approximately 2 mg/kg of the continental crust (Davis, 1974~. About 60970 of the molybdenum mined in the United States is taken from the world's largest deposit of molybdenum sulfide, near Climax, Colorado (Chappell, 1973~. According to Asmangulyan (1965), molybdenum sulfide is sparingly soluble in water, but is fairly readily oxidized to form more soluble molydates (salts of molybdic acid), which are stable in water in the absence of a reducing agent. Organoleptic tests showed that ammonium molybdate imparted a slightly astringent taste to water, starting at a molybdenum concentration of 10 mg/liter. A concentration of 100 mg/liter produced a marked inhibitory elect on the biochemical oxygen demand (BOD) of water, but 10 mg/liter had no effect on the total number of bacteria in water. METABOLISM Schroeder et al. (1970) estimated that the daily intake of molybdenum was 390 ,ug. Hadjimarkos ( 1967) estimated the human intake of molybdenum in food at 1,000 ~g/day. On the basis of very limited data, Tipton et al. (1966) calculated the total dietary intake of molybdenum by adults to be approximately I 00 ~g/day. The mean daily dietary intake of molybdenum is so small (about 1 mg/day) and of such minor importance that its role in human nutrition and metabolism has been studied very little (Davis, 1974~. Miller et al. (1959) did balance studies on 24 girls, 7-9 years old, who were fed molybdenum at an average of 75 mg/day; most of this appeared in the urine. The higher the protein intake, the less molybdenum was retained.
282 DRINKING WATER AND H"LTH Molybdenum concentrations are normally very low in animal tissues. Davis (1974) presented the following concentrations for adult man: Tissue Molybdenum Concentration, mg/kg (dry weight) 3.2 1.6 0.20 0.15 0.14 0.14 Liver Kidney Spleen Lung Brain Muscle The molybdenum content of food varies greatly. In general, legumes, cereal grains, leafy vegetables, liver, and kidney are good sources; fruits, root and stem vegetables, muscle meats, and dairy products are among the poorest. Molybdenum is excreted primarily in the urine, probably as molybdate anion (Davis, 1974~. According to Asmangulyan (1965), molybdenum is fairly rapidly eliminated from animals, but it has some slight cumulative properties, especially in the bones, kidneys, and liver. HEALTH EFFECTS Molybdenum is recognized as an essential mineral for both man and other animals. It is an integral part of at least two mammalian enzymes, xanthine oxidase and aldehyde oxidase (USFDA, 19751. In man, molybdenum poisoning has rarely been observed. High intakes in Armenia (USSR) have been associated with high incidences of gout. In India, a bone-crippling disease occurs in areas where sorghum contains high amounts of molybdenum; it has been postulated that molybdenum increases the toxicity of fluoride in producing this disease. Both these human-related incidents are speculative and await more definitive information to establish cause-and-effect relationships (USFDA, 19751. Although it is known that molybdenum is an essential trace element (Browning, 1961), excessive dosages in laboratory animals and in the forage of herbivores, such as cattle, have been deleterious. Molybdenum is picked up by forage crops from the soil moisture and concentrated in the foliage. Water-soluble molybdates in herbage cause cattle to scour severely-i.e., to have diarrhea which sometimes results in death. Soil moisture from pastures in which cattle had scoured contained moly~de
Inorganic Solutes 283 num at 20-100 mg/liter, whereas noninjurious fields contained less than 5 mg/liter. The herbage content of molybdenum varied with plant species on the same soil (McKee and Wolf, 1963, citing several references). Animals vary greatly in their sensitivity to molybdenum. Cattle appear to be the most sensitive, with severe diarrhea occurring at intakes as low as about 20-100 mg/kg of forage. Pigs tolerate 1,000 mg/kg of diet without discernible ill erects. In young chickens, dietary supplements of 200, 2,000, and 4,000 mg/kg of food induced growth suppression and anemia. In rats being fed a copper-deficient diet, molybdenum at 10 mg/kg of food produced a reduction in the rate of weight gain, but if copper at 3 mg/kg of diet was present, no elect was observed when molybdenum was added at 100 mg/kg. High sulfate or sulfate-forming components, such as methionine, exacerbated the molybdenum toxicity (USFDA, 1975~. The toxicity of molybdenum in animals is related to a number of dietaIy factors, including copper, sulfate, endogenous sulfate-producing substances, and other trace metals that affect copper metabolism. The mechanisms by which these components ameliorate or intensify molyb- denum toxicity are largely unknown, owing to the complexity of the interrelationships of these nutrients. Signs of toxicity in most species are similar to those of copper deficiency and often include reduced growth, loss of appetite, anemia, hair loss, bone defects, and loss of hair color (USFDA, 19751. The daily food intake of animals is appreciably lower on molybdenum- containing diets than on control diets. Rejection of the diet may be a conditioned response caused by sensory detection of the presence of molybdate ion or its interaction with unidentified constituents of the diet (Monty, 1960). Rats fed toxic dosages of molybdate showed a reduction in liver sulfide oxidase activity. Significantly, rats were unable to discriminate between the molybdate-containing diet and the control diet for the first 5 days after molybdate was added to the diet. If diets that had been "aged" for at least 5 days were offered to rats, they were able to discriminate against the molybdate-containing diet within 2 days. It has been postulated that molybdate interacts with some dietary constituent over a period of 5 days to produce a change that permits the rats to discriminate (Anon., 1962~. According to Asmangulyan (1965), who introduced various doses of molybdenum into the diets of young rabbits, chronic poisoning by molybdenum gives rise to marked functional changes, including an increase of sulfl,ydryl groups in the serum and liver and a decrease in vitamin C in the liver, at dosages as low as 0.5 mg/kg of diet. The fact that a rise in the content of biologically active sulfLydryl groups has been
284 DRINKING WATER AND H"LTH shown to be caused by molybdenum may assist in elucidating the mechanism of the "molybdenum gout" that is found in Armenia. The inactive dose of molybdenum for rabbits was 0.025 mg/kg of diet (or approximately 0.5 mg/liter in drinking-water). As a result, Asmangulyan recommended a maximum permissible concentration of molybdenum in open bodies of water of 0.5 mg/liter. This recommendation may well have been the evidence on which the USSR limit was based. ANALYSIS With atomic-absorption spectrophotometry, a detection limit of 20 ,ug/liter is attainable by direct aspiration into the flame, necessitating concentration for ordinary determinations. Chau and Lum-Shue-Chan ( 1969) have studied extraction systems for molybdenum and recommend- ed an oxine-methylisobutylketone system, with extraction at a pH of 2- 2.4. When the graphite furnace is used to increase sample atomization the detection limit is lowered to 0.5 ~g/liter. CONCLUSIONS AND RECOMMENDATIONS Soluble molybdate ions are present in trace concentrations in many surface waters, primarily as a result of industrial waste, but also as a product of natural weathering of molybdenum-bearing soils. Both suspended insoluble molybdenum sulfide and soluble molybdates are present in streams that drain areas where molybdenum ore is mined and processed, especially in Colorado and New Mexico. Typical diets contain molybdenum at around 100 1,000 Gay, whereas typical surface water (except that draining mining areas) contains nil to about 100 ,ug/liter, with mean or median of about 10 ,ug/liter. Hence, it is evident that water is a minor factor in the total molybdenum intake in most locations. In humans, molybdenum poisoning has rarely been observed. A1- though it has been implicated in gout in Armenia and in a bone-crippling disease in India, these involvements are speculative and await more definitive information to establish cause-and-effect relationships. Molybdenosis in livestock, however, is a significant toxicologic problem in many areas. Consumption of molybdenum-rich forage by cattle and sheep causes severe diarrhea (scouring) that sometimes results in death. It can be prevented or ameliorated by the administration of copper, but the relationship of molybdenum, copper, and sulfate-forming compounds in animal metabolism needs further study. The USSR has established a molybdenum limit of 0.5 mg/liter in open
Inorganic Solutes 285 water, but the WHO has not yet promulgated a limit (Stoefen, 1973~. The National Primary Drinking Water Regulations USEPA, 1975) do not set any limit for molybdenum. Nickel The National Academy of Sciences has recently completed an extensive review of the medical and biologic enacts of nickel (1975~. This section includes excerpts from that publication, Nickel (with appropriate page numbers shown). OCCURRENCE Kopp and Kroner reported that nickel was found in U.S. waters with a frequency of 16% and at an overall mean concentration of 19 ,ug/liter. The detection limit for nickel in water with total dissolved solids of 400 ~g/liter was 20 ,ug/liter. If the dissolved solids amounted to 200 ,ug/liter, the detection limit would be 10 ,ug/liter (P. 91. The Missouri River and Western Gulf basins had the lowest frequency of nickel detection and among the lowest mean concentrations, at 5 and 3 ,ug/liter, respectively. The highest mean concentration was 130 ~g/liter, in the Cuyahoga River at Cleveland, Ohio (p. 9~. It was concluded that most of the nickel in surface water and groundwater originates from man's activities. This conclusion was strengthened by data on nickel concentrations determined by spectro- graphic analysis of evaporated residue of selected samples taken in 1962 of public water supplies of the 100 largest cities in the United States. On the basis of analyses of nickel concentrations of 969 water supplies in the United States during 1969-1970, . . . the average concentration of nickel in water samples taken at the consumer's tap was 4.8 ,ug/liter. With an estimated daily intake of 2 liters of water, an adult would consume approximately 10 ,ug of nickel per day in drinking water (p. I 1~. Man's exposure to nickel in food derives from the natural occurrence of nickel in food ingredients and from man-made sources, such as alloys, food-processing equipment, and fungicides, which may increase the amount of nickel in food substances beyond that naturally present .... With the exception of some preliminary studies in plants, nothing is known about the chemical form of nickel in foods. Detailed information of this type needs to be developed for consider- ation of possible differences in bioavailability and biotoxicity of nickel in foods. However, the available information indicates that the concentrations of nickel in foods are low and do not pose any toxicity problem (p. 51~. The usual oral intake of nickel by American adults thas been calculated] at 30 600 ,ug/day. Nickel ingestion may vary widely. [It has been calculated] that a
286 DRINKING WATER AND H"LTH person who ingests a 2,300-cal diet containing 100 g of protein, 250 g of carbohydrates, and 100 g of fat and who consumes meat, milk, fruit, refined white bread, wheatena, butter, and corn oil would takein3-lO~gofnickelperday.At the other extreme, a diet that has the same calorie value and the same proportions of protein, carbohydrate, and fat might contain 70~900 leg of nickel per day, if the person consumes oysters, meat, milk, eggs, oats, whole-wheat or rye bread, some vegetables, potatoes, and legumes, with little added fat. 1 he wide range of oral intake of nickel may also result from variable ingestion of beverages such as tea, coffee, beer, and red wine-that contain more than lOO~g of nickel per 100 g (p. 62-631. CHEMICAL CHARACTERISTICS With the exception of carbonates, rocks low in silica are high in nickel, and those high in silica are relatively low in nickel. Farm soils of the world contain nickel at 0.0003-~.1%. The average farm soil in the United States contains nickel at more than 0.003%. Soils with less than 0.0003% are too acidic to support normal plant growth (p. 51. The nickel content of seawater ranges from 0.1{).5 ,ug/liter. In most groundwa- ters, nickel has not been identified; and in instances where it has been detected, analysts theorize that it is probably in colloidal form (p. 8~. It has been determined that, in the rock-weathering process, nickel goes into the insoluble minerals of the hydrolysates. Therefore, any nickel in surface or groundwaters is likely to be in small amounts, unless its presence is due to industrial pollution (p. 8~. METABOLISM Most of the nickel that is ingested in food remains unabsorbed within the gastrointestinal tract and is excreted in the feces . . . . Fecal excretion of nickel by healthy human subjects thas been reported to be] 100 times greater than urinary excretion .... There appears to be a mechanism that limits the intestinal absorption of nickel in mammals, despite the relatively large amount of nickel present in their food (p. 63~. Inhalation from the atmosphere and tobacco smoke provides a mode of entry of nickel into the body: The reported mean nickel content of cigarettes have ranged from 2.(K.2 ,ug/cigarette. Analyses . . . have shown that 1~20~o of the nickel in cigarettes is released into the mainstream smoke. Of that nickel 84% is in the gaseous phase and only 16% in the particulate phase. [There is suggestive evidence] that gaseous nickel in mainstream smoke occurs in the form of nickel carbonyl (pp. 178-179~. 1 [It has been] calculated that a cigarette smoker would inhale a maximum of 14.8 ,ug of nickel per day from 40 cigarettes. [The estimated] actual retention of inhaled
Inorganic Solutes 287 nickel within the body is probably only 75% of the calculated intake . . 63-64). · (PP There is wide variation in the average concentrations of nickel in urban atmospheres. Of urban areas of the United States that were surveyed during 1964 and 1966, the cleanest with respect to atmospheric nickel were Boise, Idaho; Albuquerque, New Mexico; and Moorhead, Minnesota. No nickel was detected in those three areas . ... In comparison, the cities with the highest atmospheric concentrations of nickel were New York City (1966 average, 0.118 ,ug/m3 of air) and East Chicago, Indiana ( 1964 average, 0.69 ,ug/m3) . . . . The daily inhalation of nickel by residents of New York City and East Chicago [was estimated], assuming that 20 m3 calf air (24.1 kid is inhaled daily. . . . at 2.36 u of nickel per day and . respectively] (p. 63~. ~ 0, J ~ O 13.8 leg of nickel per day [for the two cities, The metabolism of nickel that enters the body by the pulmonary route is similar to that of nickel compounds that are adminstered parenterally. Inhaled nickel carbonyl is excreted primarily in the urine and to a minor degree in the feces .... A correlation of atmospheric concentrations of nickel in a nickel smelting plant with the concentrations of nickel in the urine of exposed workmen thas been reported] (pp. 64-65~. It has also been shown that measurements of nickel in serum and urine can serve as biologic indexes of environmental exposure to nickel. HEALTH EFFECTS Man is not naturally exposed to the inhalation of atmospheric nickel, with the possible exception of nickel from volcanic emanations. The available evidence indicates that the natural concentrations of nickel in waters, soils, and foods do not constitute a biologic threat. Indeed, nickel may be an essential trace element for the nutrition of man and animals (p. 191~. Recent evidence suggests that nickel partially satisfies the criteria for essentiality of trace elements as micronutrients: presence of the element in the fetus or newborn, presence of homeostatic regulation of the metabolism of the element, demonstration of a metabolic pool of the element that is specifically influenced by hormonal substances or pathologic processes, demonstration of a metalloenzyme of which the element is an integral part, and demonstration of a deficiency syndrome that can be prevented or cured by trace amounts of the element (p. 89~. Nickel is probably essential for animal nutrition, but there has not yet been unequivocal demonstration that nickel deprivation produces consistent abnormalities in experimental animals that can be prevented or cured by the administration of nickel. Toxicity studies have demonstrated that nickel and nickel salts have relatively low toxicity in various species of animals when administered orally. However, parenteral injections of nickel salts are much more toxic. Major signs of acute
288 DRINKING WATER AND H"LTH nickel toxicity consist of hyperglycemia and gastrointestinal and central nervous system effects. Ingested nickel is excreted primarily in the feces, whereas parenterally administered nickel is excreted mostly In the urine. Little informaion is available on animals relative to the acute ejects of inhaled nickel compounds, except for nickel carbonyl, which is extraordinarily toxic .... Several n~ckel- containing substances including nickel dust, nickel subsulfide, nickel oxide, nickel carbonyl, and nickel biscyclopentadiene have been demonstrated to be carcinogenic in experimental animals after inhalation or parenteral adm~n~s- traion. There is no evidence that nickel compounds are carcinogenic in animals after oral or cutaneous exposure. There is veer little information on the teratogen~city or mutagenicity of nickel compounds in experimental animals (p. 192~. Epidemiologic studies of workmen in nickel smelters and refineries have revealed a significantly increased incidence of cancers of the lungs and nasal cavi- ties .... Respiratory cancers in nickel workers have usually developed after long latent periods, such as are typical of occupational cancers .... There is only scanty evidence of an increased incidence of respiratory cancers among workmen who have other types of occupational exposure to nickel, such as nickel electroplating and grinding. Nickel is a common cause of chronic dermatitis in man, as a result of industrial and other exposures [and] use of n~ckel-conta~n~ng alloys In jewelry, coinage, clothing fasteners, . . . utensils, [and] implanted therapeutic devices and prostheses . . . (p. 193~. Berg and Burbank (1972) found nickel in drinking water to be poorly correlated with mortality from oral or intestinal cancer. There was no correlation between nickel and mortality from nasal or pulmonary cancer, even though these are the types of cancer usually associated with industrial exposure to nickel. ANALYSIS Conventional flame atomization has a nickel detection limit of 2 ~g/liter. Extraction procedures are usually used to concentrate the nickel before analysis. The APJ)C-methylisobutylketone extraction at a pH of 2.8 is used by the U.S. Geological Survey (Brown et al., 1970~. Others have used similar procedures for freshwater analysis (USEPA, 1971; Paus, 1971; Traversy, 1971; Kinrade and Van Loon, 1974; Aldous, 1975~. Jenne and Ball (1972) have studied the stability of the nickel-APDC complex. Diethyldithiocarbamate has also been used as a chelating agent (Joyner et al., 1967; Nix and Goodwin, 1970~. Paus (1971) and Surles et al. (1975) have used the graphite furnace to increase sample atomization for
Inorganic Solutes 289 freshwater analysis; this procedure has a nickel detection limit of I g/liter with direct sampling into the furnace. CONCLUSIONS AND RECOMMENDATIONS Because of the low toxicity of nickel and nickel compounds in food and drinking water, the low concentrations present in drinking water, and the small daily intake of nickel in drinking water (compared with food), there is no present need to establish nationwide limits for nickel in drinking water. The USEPA National Interim Primary Drinking Water Standards and the WHO European standards for drinking water do not include standards for nickel. There is no pressing need for research with regard to nickel in drinking water. In this regard, however, research to clarify the role of nickel in nutrition appears to be desirable, particularly as to its dietary essentiality. Silver OCCURRENCE The intentional addition of silver to drinking water for disinfection is one possible source of silver in public water supplies. The silver ion has bactericidal characteristics at concentrations of 15-50 ,ug/liter (don Nageli, 1893~. As a result the Katadyn process and others have been promoted for treatment of drinking and swimming-pool water. She bactericidal action is slow, especially in cold water, and silver is neither viricidal nor cysticidal in the concentration used (Renn et al., 1955~. Dosages in excess of 150 fig/ I iter have been used in swimming pools, but, because of cost and the opalescence caused by colloidal silver chloride, the method is not practical or recommended for public supplies. Data from 1,577 samples of well and surface water from 130 points in the United States showed detectable concentrations (0.1 ~g/liter or more) of silver in only 104 samples. The concentration ranged from 0.1-38 ,ug/liter, with a median of 2.6 ~g/liter (Kopp, 1969~. The highest concentrations were noted in the St. Lawrence and Colorado Rivers (Durum and Hafty, 1961~. The examination of finished water in public supplies of the 100 largest cities in the United States revealed trace quantities of silver as high as 7 g/liter, with a median of 2.3 ,ug/liter (Durfor and Becker, 1964~. Another survey of finished water found silver in 6.1% of 380 samples, with concentrations of 0.3-5 ,ug/liter (mean, 2.2 ,ug/liter) (Kopp, 1973~.
290 DRINKING WATER AND H"LTH Chemical Analysis of Interstate Carrier Water Supply Systems (USEPA, 1975) reported nondetectable silver (<0.1 ,ug/liter) in 45% of the analyses; 99.5% of all determinations were equal to or less than 50 ,ug/liter, the interim standard. The community water-supply survey (McCabe, 1970) found that none of the 2,595 samples from household taps exceeded the standard. The maximum concentration was 30 ,ug/liter. Unless lime softening in the water-treatment process results in a high pH, very little difference in silver concentration may be expected between raw and finished water. When water containing silver is used for culinary purposes, it is reasonable to assume that vegetables belonging to the family Brassicaceae-such as cabbage, turnips, cauliflower, and onions would combine with the residual silver in the cooking water. The silver content of 2 or 4 liters of water could thus be ingested, but rarely by one person. Soil contains only small amounts, but humus from decaying plants may contain up to 5 ppm. Some foods, such as bran and wheat flour, contain trace quantities (less than 1 ppm), but mushrooms have unusually high concentrations-up to several hundred parts per million (Ramage, 1930~. CHEMICAL CHARACTERISTICS Trace amounts of silver are found in natural and finished water originating from natural sources and from industrial waste. Silver is a rather rare element with a low solubility of 0.1-10 mg/liter, depending on pH and chloride concentration (Hem, 1970~. Water-soluble silver compounds include the acetate, chlorate, nitrate and sulfate. METABOLISM For reasons still unknown, individuals and individual organs absorb silver selectively. Tissues of animals and humans do not often contain silver. About 10% of tissues and samples contain silver, and the concentrations rarely exceed 0.01 ma/ 100 grams (Kehoe et al., 1940~. The cases of generalized argyria prove that silver can be absorbed from the gastrointestional tract, by inhalation of dust, and after medication with silver compounds. Excretion of silver is almost entirely in the feces, with only a trace to be found in the urine. There is little retention of silver in general, but, when it occurs the greatest concentrations are found in the reticuloendothelial organs. After intravenous injection in animals (Gammill, 1950), the order of silver concentration is spleen, liver, bone marrow, lungs, muscle, and
Inorganic Solutes 291 skin. The balance between intake and elimination is inconclusive, but evidence suggests that ingested silver is only slightly stored. HEALTH EFFECTS Large single doses of colloidal silver can be fatal. A dose of 500 mg was lethal in a dog in 12 h (Shouse and Whipple, 1931~; death was due to pulmonary edema and was preceded by anorexia and anemia. In addition to hyperplasia of the bone marrow, repeated injection of silver has caused anemia (Shouse and Whipple, 19311. It was suggested that long-term feeding of animals with silver salts may cause vascular hypertension, hypertrophy of the right ventricle, and thickening of the glomerularmembranes(Olcutt, 1950~. The chronic effects in man usually have taken the form of an unsightly permanent blue-gray discoloration of the skin, mucous membranes, and eyes known as "argyrosis" or "argyria." Although this is considered only a cosmetic defect, with no significant physiologic effect, some observers maintain that deposition in the kidney is associated with arteriosclerotic changes, and deposition in the eye, with poor night vision (Gettler, 1927; Velhagin, 19531. Local and generalized argyria, rarely seen today, has been caused by medical use of silver by ingestion or injection. Topically applied silver ointments have been shown not to pass the dermal barrier; this ensures safety on contact with bathing water treated with silver preparations (Norgaard, 19541. Industrial poisoning is a more likely cause of argyria, which develops slowly after 2-25 yr of exposure. Estimates from industrial exposure show that the gradual accumulation of 1-5 g of silver will lead to generalized argyria (Hill and Pillsbury, 1939~. The exact quantities of silver stored are not known. A safe assumption would be that 50% of the intake is retained in the body. Thus, the interim drinking- water level of 50 ,ug/liter would be equivalent to a retention of 50 fig of silver per day and would result in an accumulation of 1 g in 55 yr, to give a probable borderline argyria. However, the maximum measured silver concentration in drinking water was 30,ug/liter, which would mean 91 yr to retain the quantity believed to produce argyria. The usual silver concentrations in public water supplies are even lower about 2-3 ,ug/liter. Some states have more stringent standards, such as California (10 ~g/liter) and Illinois (0.5 ,ug/liter). The Water Quality Criteria (1972) concluded that, "Because silver in waters is rarely detected at levels above 1 ,ug/liter, a limit is not recommended for public water supply sources." There is no evidence of any beneficial effect to be derived from the ingestion of silver in trace quantities.
292 DRINKING WATER AND H"LTH ANAI Y,SIS Silver ions in solution are unstable under many conditions, but the addition of ethylenediaminetetraacetic acid to collected natural-water samples has been found to be an adequate preservative (West et al., 19671. Nitric acid is used by the USEPA ( 1971 J for stabilization. With direct flame atomization, the detection limit for silver is 2 ~g/liter. At the silver concentrations normally found in fresh water, some form of concentration is required for conventional atomization. An APDC- methylisobutylketone extraction at a phi of 2.8 is used by the U.S. Geological Survey (Brown et al., 1970~; similar procedures have been reported by others (Chao et al., 1969; USEPA, 1971; Traversy, 1971; Kinrade and Van Loon, 1974~. When a graphite furnace is used to increase sample atomization the silver detection limit is lowered to 0.005 /liter with direct sampling. Rattonetti (1974) determined silver in fresh water with flameless atomic absorption. The sampling boat and Delves cup methods over detection limits of 0.2 and 1 ~g/liter, respectively. CONCLUSIONS AND RECOMMENDATIONS There seem to be no pressing research needs with regard to silver in drinking water. There seems to be little possibility that the addition of oligodynamic silver will have any place in public water supplies, and natural concentrations are so low that consideration should be given to taking silver on the list of substances included in primary drinking-water standards. Tin OCCURRENCE Tin is seldom measured in natural water, in treated-water supplies, or at the tap. It is not indexed or mentioned in the NAS report on water- quality criteria in 1972 (USEPA, 1973), nor was it included by Durum et al. (1971) in their reconnaissance of selected minor elements in Up. surface waters. It is not listed in the National Interim Primary Drinking Water Regulations (USEPA, 1975), nor in the USSR, European, or international drinking-water standards (Stoefen, 1973~. Indeed, there are serious reservations about its valid determination, as noted below, and it is not included in Standard Methods (USEPA, 1976~.
Inorganic Solutes 293 According to Beeson et al. (1976) public water supplies in 42 U.S. cities contained tin at 1.1-2.2 ~g/liter, and water from 175 natural sources in west-central Arizona contained 0.8-30 ~g/liter. Seawater contains 0.2~.3 g/liter. With emission spectrography, Durum and Hasty (1961) analyzed 59 samples of water from 15 rivers in the United States and Canada, of which 56 values were reported as zero, i.e., below the detection limit. The other three values were 1.3, 1.4, and 2.1 ,ug/liter. Although tin is present in natural water only in traces, it may occur in industrial waste when water is stored for any length of time in tin-coated metal containers. Stannic and stannous chlorides are used as mordants for reviving colors and dyeing of fabrics, weighting of silk, and tinning of vessels. Stannic chromate is used in decorating porcelain. Stannic oxide is used in glassworks, in dye houses, and for fingernail polishes. Stannic sulfide is used in some lacquers and varnishes. Tin compounds are also used in fungicides, insecticides, and anthelmintics (McKee and Wolf, 19631. Finally, it should be noted that stannous fluoride is used in many toothpastes and consequently reaches municipal sewers. From various industrial processes and from municipal sewage, tin salts are bound to reach surface water or groundwater; but, because many of the salts are insoluble in water, it is unlikely that much of the tin will remain in solution or suspension. The major source of human intake of tin is canned foods and beverages. It is usually present in canned foods and drinks at levels less than 100 mg/kg, but much higher concentrations (greater than 1,000 mg/kg) may be present in some products after prolonged storage in closed nonlacquered cans or after some days of storage in open cans (Monier-Williams, 1949~. Schroeder et al. (1964) reported that natural foods, many from garden soils, contained tin ranging from zero to 8.5 mg/kg on a fresh-weight basis or up to 40 mg/kg in dry material. These values are considerably lower than those observed for canned food and beverages, but both sets are three or more orders of magnitude greater than the concentrations in water. Very little information is available on airborne tin, but there may be danger to industrial and agricultural workers from the inhalation of atmospheric organic tin compounds, e.g., triphenyltin acetate, used in fungicides and insecticides (Klimmer, 19681. Needless to say, the use of such pesticides increases the potential for intake of tin by ingestion of the pertinent crops as food. Dust sediments from industrial regions of Europe were reported by Morik and Morlin (1959) to contain tin at 1~10,000 mg/kg of dust.
294 DRINKING WATER AND H"LTH CHEMICAL CHARACTERISTICS In nature, tin is a decidedly minor rock component; it would not be expected to be found in natural water, except in very minor traces. Stannous hydroxide, Sn(OH)2 is soluble in water at 25°C at about 1.6 ppm. At a pH considerably below that normally found in natural water, a much nigher concentration may be possible; at a high pH, above the normal for natural water, tin may be part of an anion complex and dissolve in greater concentrations (USGS, 1959~. . . ~ , 1_ 1 · ~ . . METABOLISM According to the FDA (USFDA, 1975), "tin is poorly absorbed from the alimentary tract and most ingested tin is excreted via the feces. The tin that is absorbed is found mainly in the liver and lung with small traces in other tissues." In contrast, Kent and McCance (1941) found that at least half the dietary tin was excreted in urine. With a tin intake of 14.4 mg/day for 7 days, their subject excreted 7.2 mg/day in urine and 6.6 mg/day in feces. Hence, almost all the ingested tin was excreted. It has been reported that the average human diet contains tin at 17.14 mg/day and that people can apparently tolerate 850-1000 mg/day (McKee and Wolf, 1963~. In contrast, Schroeder et al. (1964) stated that the daily oral intake of tin by a man in the United States is between 1 and 30 mg/day, with typical intakes near 3 4 mg/day. Even the highest value (30 mg/day) is considerably lower than the 5-7 mg/kg of body weight at which toxic symptoms may appear (WHO, 1973~. Tipton et al. (1969) reported that the daily intake of tin in the United States ranged from 0.1~100 ma, with an average of 5.8 ma. Again, such values are below those that might cause toxicity. Higher concentrations of tin are found in tissue from people in wealthier countries, probably as a result of greater use of canned foods (Schroeder et al., 1964~. HEALTH EFFECTS There is no conclusive evidence that tin plays an essential biologic role in human nutrition (Browning, 1961~. However, in rats maintained on purified amino-acid diets in trace elements, Schwarz et al. (197(~) found that trimethyltinhydroxide, dibutyltinmaleate, stannic sulfate, and potas- sium stannate enhanced growth at tin dosages of 0.5-2.0 mg/kg of diet. Although the use of animal data to determine optimal intakes for people is subject to many possible errors, one might calculate that a 70-kg person
Inorganic Solutes 295 would require tin at about 7.0 mg/day. Before tin can be conclusively considered as an essential trace element, ejects should be demonstrated in several generations of various animals. inorganic tin is relatively nontoxic. DeGroot et al. (1973) fed inorganic tin compounds to rats for 13 weeks and found no toxic effects at tin concentrations of 450-650 mg/kg of diet. Indeed, some inorganic tin compounds had no effect on rats at three times that concentration. Organic tin compounds, however, have demonstrated toxicities and have been used as fungicides, bactericides, insecticides, and anthelmintics (i.e., against intestinal worms). These compounds are generally of the type R3snx' where R is an alkyl group (especially ethyl or propyl) and X is an anion, such as chloride. The toxicities of organotin compounds have been reviewed by Barnes and Stoner ( 1 959) and Poller (19701. According to the FDA (USFDA), the "symptoms of acute tin toxicity" (to humans) "are nausea, abdominal cramping, diarrhea, and vomiting." These symptoms have often followed consumption of canned fruit juices containing 1,400 ppm tin, canned salmon containing 650 ppm tin, and vodka punch containing 2,000 ppm tin. The latter had been held in a tin can. Due to low intestinal absorption of tin, the acute toxic symptoms are probably due primarily to local irritation of the gastrointestinal tract. "One hundred deaths in France resulted from capsules known as 'Stalinon,' used for treatment of staphylococcal skin infections. The capsules contained diethyltindiiodide (15 mg/capsule) and linoleic acid and were contaminated with mono- and triethyl tin." (USFDA, 1975) ANALYSIS Beeson et al. (1976) expressed serious reservations about the analytic determination of tin, especially at low concentrations. Many foreign substances in a sample interfere with the determination of tin by atomic absorption. Dry ashing is also subject to several errors, especially for most organotin compounds. As a result, many, or all, of the data reported on tin in water, food, and air can be accepted only with some reservations. Direct flame atomization offers a tin detection limit of 10 ~g/liter; however, tin can be determined to quite low concentrations by special- ized atomization devices. With sodium borohydride as a reductant, Fernandez (1973) detected tin at 0.2 ~g/liter in 20-ml sample. The acidity of the solution is critical and appears to be optimal near 0.2 N in hydrochloric acid. When the graphite furnace is used to increase sample atomization a detection limit of 0.1 ~g/liter is possible (Everett et al., 19741.
296 DRINKING WATER AND H"LTH CONCLUSIONS AND RECOMMENDATIONS inorganic tin is relatively nontoxic, but organotin compounds can be toxic at very high concentrations. Indeed, they are used as fungicides, insecticides, and anthelm~ntics. Tin has seldom been determined in natural or municipally treated water. The few available data generally show concentrations about 1 or 2 ,ug/liter. In contrast, tin is present in most natural foods, and especially in canned products, up to 30 mg/day. This is three or more orders of magnitude higher than the probable amount in a liter of tap water. The EPA has not set a maximum containment level for tin in its National Interim Primary Drinking Water Regulations. No maximum containment level is recommended or needed. Perhaps the foremost research need with respect to tin is the development of a rapid accurate method of determination at the low concentrations expected in drinking water. Until such a method is available, reliable data for natural or treated water cannot be expected. Vanadium The NAS has recently (1974) completed an extensive review on the medical and biologic ejects of vanadium, which has been used in preparing this report. OCCURRENCE A high vanadium concentration of 6.7 ,ug/liter has been reported in the Sacramento River, Sacramento, California (Durum and Hasty, 1961~. Kopp and Kroner (1967) observed detectable concentrations in 3.4% of the samples analyzed; the concentration ranged from 2 to 300 ~g/liter, with an average of 40 ~g/liter. One kind of pollution from vanadium must be noted when considering water. Residues from the milling and mining of vanadium are often heaped on the ground or used as landfills, thus being exposed to rainfall and groundwater drainage, which could result in water pollution for many miles around. CHEMICAL CHARACTERISTICS Vanadium does not occur naturally in highly concentrated forms. This is true despite the fact that it is as abundant in the earth's crust as zinc and nickel and occurs in at least 50 different mineral species. It usually occurs in some oxidized form usually as a metal vanadate. Vanadium
Inorganic Solutes 297 can also be found in trace amounts in fossil fuels. The solubility in water of vanadium pentoxide and sodium metavanadate are 0.07 and 21.1 gilOO ml, respectively. Vanadium can also form covalent bonds with organic molecules to yield organometallic compounds (NAS, 1974~. METABOLISM It has been reported that absorption of vanadium through the skin occurs from an approximately saturated (kilo) solution of sodium metavana- date. Even with exposure to vanadium particles, the skin absorption appears to be of minor importance (NAS, 19744. In an experimental study in which humans were exposed to vanadium oxide dust - with tests being run, before, during, and after exposure the greatest amount of vanadium was found in the urine 3 days after exposure; none was detectable after a week. Fecal vanadium was at a maximum of 0.003 mg/g; none was detected after 2 weeks. All reactions to the exposure were respiratory. Coughing, mucus formation, rates, and expiratory wheezes were present, but did not last (NAS, 1974~. Vanadium concentrations in human tissues have been found to be less than 1 ~g/g of ash, except in the lungs, where up to 108 mg/g (ashed material) has been reported after extremely high exposure. Vanadium pentoxide is readily absorbed from the lungs into the bloodstream (USEPA, 1975~. It would have to be concluded that absorption in the human body is extremely low; and it must be kept in mind that vanadium has not been proved to be essential to humans (Shakman, 1974~. Evidence seems to indicate that the excretion pathway of vanadium is through the kidney, regardless of the form administered. Rats, rabbits, and man all excrete sodium metavanadate via the urinary pathway. Man also excretes ammonium vanadyl tartrate in the urine (USEPA, 1975~. HEALTH ASPECTS A relatively large amount of vanadium (some 30,000 metric tons/yr) enters the environment from man's activities, but no widespread detrimental ejects have been identified. Presumably, man and other animals do not store or accumulate vanadium in hazardous amounts. The degree of vanadium toxicity depends largely on the dispersion and solubility of vanadium aerosols in biologic media. Toxicity also depends on the valence; i.e., it increases with increasing valence, with pentavalent vanadium being most toxic. In addition, vanadium is toxic both as a cation and as an anion.
298 DRINKING WATER AND H"LTH The oral LD50 of vanadium trioxide for albino mice is 130 mg/kg, while the LD50 for vanadium pentoxide and vanadium bichloride is 23 mg/kg (Roshchin et al., 19659. The major signs and symptoms of acute vanadium toxicity in man are primarily respiratory. Aside from its acute inflammatory eject on the · . . . . . lungs, it appears to act mainly on various enzyme systems. Chronic respiratory exposure to vanadium may decrease cholesterol synthesis, uncouple oxidative phosphorylation in liver mitochondria, and decrease urinary excretion of 5-hydroxyindoleacetic acid, with transient bilirubinemia and albuminuria. Another symptom is the appearance of scattered allergylike eczema- tous skin lesions. These are found, for the most part, on exposed skin. This allergic syndrome has been seen in workers and experimental animals. A persistent complication is a slight to moderate change in the mucous membranes of the upper respiratory tract, particularly the pharnyx; but no chronic bronchitis or changes in the lung have been reported. Permanent damage to the target organs, including the lungs, has never been conclusively established. There is no evidence of chronic oral toxicity (NAS, 1974~. ANALYSIS With a vanadium detection limit of 40 ,ug/liter, conventional flame atomization lacks sensitivity for direct determination in most samples. Crump-Wiesner and Purdy (1969) have studied various extraction systems and found that both vanadium (IV) and vanadium ~ are extracted from an aqueous solution at a pH of 3.8 with a cupferron- methylisobutylketone system. With direct sampling, the graphite furnace can be used to increase sample atomization with a detection limit of 5 g/liter. CONCLUSIONS AND RECOMMENDATIONS A limit of 0.1 mg/liter has been suggested in the USSR as a maximum permissible limit for water basins (USEPA, 1975~. The lack of data on acute or chronic oral toxicity is not surprising because of the extremely low absorption of vanadium from the gastrointestinal tract. Inhaled vanadium can produce adverse health ejects, but the available evidence does not indicate that vanadium in drinking water is a problem.
Inorganic Solutes 299 Zinc Zinc is considered an essential trace element in human and animal nutrition. This topic has been recently reviewed in Clinical Chemistry (1975) in a special issue on trace elements, by Sandstead (1974), by Underwood (1971), and in Toxicants Occurring Naturally in Foods ~AS, 1972~. The recommended daily dietary allowances for zinc recently recommended by the NAS (1974) are as follows: adults, 15 mg/day; growing children over a year old, 10 mg/day; and additional supplements during pregnancy and lactation. As far as human health in the general population is concerned, the major concern is not with toxicity, but rather with marginal or deficient zinc intake. The available data indicate that the contribution of drinking water to the daily nutritional requirement for zinc is negligible under most circumstances. OCCURRENCE In general, in streams and rivers, zinc is concentrated in sediments, but concentrations are quite low in running filtered water. It is reported that approximately 22,000 tons of zinc are used in fertilizers each year in the United States. The extent to which this may run on into rivers and streams is not known. Likewise, no significant body of data relative to the runoff into streams from dumps and metallurgic wastes has been found. Craun and McCabe's (1975) recent summary indicates that concentra- tions of zinc in finished water at the treatment plant are well below the 1962 drinking-water standard of 5 mg/liter. However, in areas of soft acidic water in Seattle, Washington, and Boston, Massachusetts pickup in the distribution system was noted in comparing water samples from the treatment plant with samples at the tap. In the Boston study, 35% of 108 samples showed pickup, but both mean and maximum concentrations in running water were well within the current limit (mean, 223 ,ug/liter; maximum, 1,625 ~g/liter). In the more acidic water in Seattle, pickup of zinc was noted in 95% of samples, and 10% were in excess of the standard of 5 mg/liter. The maximum concentration found in the study was 5.46 mg/liter. In rocks, zinc is most commonly present in the form of the sulfide sphalerite, which is the most important zinc ore. Zinc may replace iron or magnesium in certain minerals. It may be present in carbonate sediments. In the weathering process, soluble compounds of zinc are formed and the presence of at least traces of zinc in water probably is common. Concentrations of 40 ppm impart a strong astringent taste to water. Food is the major source of zinc. This topic has been reviewed
300 DRINKING WATER AND H"LTH elsewhere (Sandstead, 1974; Underwood, 1971~. Regarding industrial exposures, the acute metal fume fever generally attributed to zinc is a brief self-limited disease and is well known. In other types of industrial smelting operations, zinc, lead, and cadmium frequently occur together; the latter two are much more toxic than zinc. Where accidental discharge in water has been identified, it has been related to smelting and refining operations and has involved combined exposures to zinc, cadmium, and lead (Friberg et al., 1974~. Airborne zinc is generally not considered significant, as far as the general population is concerned. CHEMICAL CHARACTERISTICS Zinc chloride and sulfate are very soluble in water, but hydrolyze in solution and reduce the pH. If the pH is maintained by the presence of an excess of bicarbonates and other anions normally present in natural water, the solubility of zinc is likely to be controlled by the solubility of its carbonate and hydroxide. Zinc carbonate is soluble in pure water at 25°C to the extent of zinc at 107 mg/liter. The hydroxide is soluble only to the extent of zinc at 0.2 mg/liter. The pH at which zinc might precipitate as hydroxide is probably not reached in the presence of excess carbon dioxide in solution. At a very high pH, zinc may form anion complexes, but such conditions are not likely in natural water (USGS, 1959) METABOLISM An earlier NAS committee (Sandstead, 1974) identified zinc balance data in humans as an area needing much more research. In general, animal studies indicate that, although zinc is distributed throughout the body, including bone, there is a small labile pool with a rather rapid turnover. The urinary excretion of zinc is generally less than 1 mg/day. HEALTH EFFECTS Diets grossly deficient in zinc have been found in Iran and Egypt. These have been associated with growth failure, loss of taste, and, in the postpubertal male, hypogonadism and decreased fertility. It is likely that factors in addition to zinc may also be involved. With the exceptions of diminution of taste discrimination and appetite, such conditions have not been identified in the United States, although there is a suspicion that some segments of the population are marginally zinc-deficient. Of interest is the recent finding that patients with sickle-cell disease may be zinc- deficient, owing at least in part to an increased loss of zinc in the urine.
Inorganic Solutes 301 Acute adverse ejects of zinc include acute metal fume fever by the inhalation of fumes. There appears, on the basis of animal studies, to be a rather wide margin of safety between tap-water zinc content and oral doses that will produce toxicity (NAS, 1973~. There have been reports of human cases of zinc poisoning associated with the prolonged consump- tion of water from galvanized pipes. In two adults, irritability, muscular stiffness and pain, loss of appetite, and nausea were reported when the water contained zinc in a concentration of 40 mg/liter, which is well above the current secondary drinking-water standard of 5 mg/liter. There is no evidence that zinc in excess is carcinogenic, mutagenic, or teratogenic. Zinc interacts with other trace metals (Sandstead, 1974, 1976~. It clearly has a protective action against cadmium and lead. Animal data suggest that the zinc: copper ratio in the diet may be important. As noted above, there may be an interaction between zinc and iron. If these experimental observations are, in fact, important for human health, then it is possible that the ratio of zinc to these other metals in drinking water may be of some importance. This problem has not been explored. ANALYSIS Most freshwater analyses may be made by using atomic-absorption spectrophotometry with direct aspiration, with a zinc detection limit of 1 ,ug/liter. She EPA (1971) and the U.S. Geological Survey (Brown et al., 1970) procedures are typical. For low concentrations in fresh water, solvent extraction may be used. Mulford (1966), Paus (1971), Kinrade and -Van Loon (1974), and Aldous et al. (1975) have found that the APDC-methylisobutylketone system extracts zinc at a pH of 2.6. Diethyldithiocarbamate (Joyner et al., 1967; Nix and Goodwin, 1970), dithizone (Sachdev and West, 1969), and dibenzyldithiocarbamate (Ichinose, 1974) are among other chelating agents used for concentrating zinc. The Delves cup and sampling boat (Paus, 1971) have been used for zinc analysis, with detection limits of 50 and 30 ,ug/liter, respectively. Fernandez and Manning (1971) and Surles et al. (1975) have demon- strated the use of the graphite furnace to increase sample atomization for fresh-water analysis, with a zinc detection limit of 0.001 ,ug/liter. Background correction appears to be essential in atomic-absorption spectrophotomet~y. In recent years, since the introduction of background correction, normal plasma zinc concentrations have consistently de- creased.
302 DRINKING WATER AND H"LTH CONCLUSIONS AND RECOMMENDATIONS Research needs have been proposed previously by an NAS committee (Sandstead, 19741. These are related primarily to the zinc content of foods, the need to determine whether a significant proportion of American diets are either deficient or marginal in zinc, and whether specific segments of the population are genetically susceptible to zinc deficiency. The recommendations include: 1. Assessment of the availability of zinc in food to man. 2. Determination of human zinc requirements in relation to age and physiologic state. 3. Evaluation of the possible implications of the zinc: cadmium ratio for health. 4. Determination of the zinc status of various well-defined populations and relation of these findings to other measures of nutritional status. 5. Assessment of the eject of zinc supplementation and enrichment on the health status of well-defined populations. In addition, animal data suggest that zinc is also protective against lead toxicity. This possibly significant interaction needs further investigation. As far as drinking water is concerned, the present drinking-water standard, assuming an adult water consumption of 2 liters/day, would permit the intake from drinking water of up to 10 mg/day, which is less than the estimated adult dietary requirement for zinc. The available data on drinking water, however, suggest that the amounts in drinking water are far lower than this. Another area requiring further investigation is related to the zinc content in the presence of soft water and the use of galvanized pipes. The present recommended primary interim drinking- water standard of 5 mg/liter appears adequate for acceptable taste and appearance of drinking water. Summary-Trace Metals The Interim Primary Drinking Water Regulations list maximum allow- able concentrations for six metallic elements barium, cadmium, chro- mium, lead, mercury, and silver. Ten additional metals were reviewed in this study-beryllium, cobalt, copper, magnesium, manganese, molybde- num, nickel, tin, vanadium, and zinc. Sodium, which is also a metallic constituent, is considered in a separate section because the problems it poses are quite distinct from those associated with the other metallic substances.
Inorganic Solutes 303 Eight of these selected metals are known to be essential to human nutrition: chromium, cobalt, copper, magnesium, manganese, molybde- num, tin, and zinc. Nickel and vanadium probably are essential also, and it is possible that barium can be beneficial under certain conditions. The toxic metals, lead, mercury, and cadmium are believed not to be essential to humans. Beryllium and silver also are not known to be essential. Elements that are beneficial in small quantities very often exhibit toxic properties when ingested in excessive amounts or concentrations. In assessment of the adverse health effects of such materials it is important not to overlook the deficiency problems that might be enountered if the substances were to be completely eliminated from water supplies. Trace metals, usually in the form of ions, occur in water both as a result of natural processes and as a consequence of man's activities. Groundwa- ters, because of long contact with rocks and mineralized soils, usually contain greater concentrations of trace metals than surface waters. There is considerable temporal and spatial variation in concentrations of trace metals in surface waters. Generally, the trace metal concentrations of rivers tend to increase from source to mouth and to vary inversely with discharge, which dilutes the natural and industrial contaminations. Of the 16 metals studied the relative contribution of man's activities to the concentrations found in water supplies can be rated roughly as follows: very great cadmium, chromium, copper, mercury, lead, and zinc; high silver, barium, molybdenum, tin; moderate beryllium, cobalt, manganese, nickel, and vanadium; low magnesium. Other important sources of trace metals in drinking water are water treatment processes and pickup of metallic ions during storage and distribution. Although a large fraction of the United States continues to receive water from ground sources or from impounded upland sources without treatment other than disinfection, most large surface supplies are subjected to treatment that includes coagulation, sedimentation, filtra- tion, and disinfection. Should trace metals occur in the raw-water supply, these normal water-treatment processes have either no eject or an uncertain one on removing the usual low level concentrations of these metals. Moreover, probable trace metal impurities in the technical-grade chemicals used may introduce additional concentrations into the treated water. Control of the corrosive properties of the finished water is important to prevent increase in trace metal concentrations during storage and distribution. A wide variety of materials, including several metals, alloys, cements, plastics, and organic compounds, are used in the pumps, pipes, fittings, and reservoirs of distribution systems and home plumbing. Reactions, particularly of soft, low-pH waters, with materials of the
304 DRINKING WATER AND HEALTH distribution system very often have produced concentrations of iron, copper, zinc, lead, and cadmium at the tap much greater than those in the raw or treated waters at the plant. The positive correlations between "hard" water supplies and reduced cardiovascular disease is discussed in detail elsewhere in this report. Adverse health effects associated with trace metals depend upon the total intake from all sources water, air, and food. As a general rule concentrations of trace metals in foodstuffs greatly exceed those found in drinking waters. Because the diet of most of the U.S. population is increasingly varied and comes from diverse geographical sources as a result of modern food distribution practices that counterbalance local excesses or deficiencies, the dietary intake of trace metals exhibits relatively small variation throughout the United States. This factor is helpful in evaluation of maximum no-adverse-health-e~ect concentra- tions for drinking water. Airborne exposure to trace metals is largely occupational through the inhalation of industrial dusts or fumes, except for lead, to which there is more general exposure from motor exhaust fumes. Most evidence for acute and chronic health ejects is derived from data on occupational exposures; caution must be observed in extrapolation of these data to the general public. All of the trace metals studied' are letdown to exhibit toxic effects at some level of intake. Many of these, however, are at levels greater than the maximum concentrations found in drinking water. To include such materials in primary drinking-water standards with a requirement for mandatory surveillance does not confer any health benefit. Adverse health ejects from trace metals that are not found in excessive concentration in delivered water supplies can be avoided most readily by preventing the discharge of such contaminants into water in quantities that might increase concentrations to the maximum no-observed-ad- verse-health-effect level. The following sections summarize the findings on individual trace metals. Barium It is rare to find barium in drinking water at a concentration in excess of 1 mg/liter because of the low solubility of barium sulfate. Natural and treated waters usually contain sufficient sulfate so that more than 1 to 1.5 mg/liter of barium cannot be maintained in solution. Acid-soluble barium salts are very toxic, whereas insoluble compounds are benign. There has been no determination of the chronic effects of low
Inorganic Solutes 3~)5 levels of barium ingested over a long period of time. The chronic phase of poisoning is an occupational disability following prolonged exposure to barium dust. It is recommended that animal studies involving long-term low-level ingestion of barium salts in water be carried out to determine possible health ejects. The Interim Primary Standard of 1 mg/liter for barium has been based on extrapolation from ejects of industrial exposure to dusts of soluble barium salts. Insufficient data are available to estimate maximum no- adverse-health-e~ect levels on the basis of water intake. The limit of 4 mg/liter of the USSR is based on organoleptic factors. International and European standards of the World Health Organization do not list barium. Beryllium Beryllium is not likely to be found in natural waters in greater than trace amounts because of the relative insolubility of beryllium oxides and hydroxides in the usua! pH range of drinking waters. The sulfate and chloride are very soluble, but they hydrolyze quickly to the insoluble hydroxide. Beryllium produces acute or chronic toxicity in animals when ingested continuously as beryllium sulfate in food or water only at 1~. els in excess of 1~20 n~g/kg of body weight per day or at concentrations greater than 5 mg/liter. Soluble beryllium has been shown to be transported in the bloodstream to bone where it has been found to induce bone cancer in animals, but the data are insufficient to allow estimation of risk. Prolonged inhalation of dusts containing beryllium is known to produce findings similar to pulmonary sarcoidosis. However, increased incidence of lung cancer among workers exposed to beryllium-containing dusts has not been found. No maximal allowable concentration for beryllium has been listed in the Interim Primary Drinking Water Regulations, nor has the WHO recommended a maximum limit. The USSR, however, has set a limit of 0.2 ~g/liter. Until now the maximum concentration of beryllium found in U.S. surface waters has been 1.2 ~g/liter and in finished U.S. drinking waters has been 0.17 ~g/liter. Only 1.7% of drinking-water supplies examined have been found to contain any detectable beryllium. Additional studies of the frequency of occurrence and concentration levels of beryllium in natural waters are needed to determine the extent to which it presents a hazard to health.
306 DRINKING WATER AND H"LTH Cadmium Cadmium is not known to be an essential or beneficial element. It has been found in 2-3% of U.S. surface waters, generally in concentrations not exceeding a few milligrams per liter due to the low solubilities of cadmium carbonate and hydroxide at pH greater than 6. Only 0.2% of the supplies in the Community Water Supply Survey showed cadmium in excess of 0.01 mg/liter. In addition to its geological sources, cadmium enters water from the discharge of plating wastes and by the action of corrosive waters on distribution piping and home plumbing. Food is the primary source of cadmium intake. Total daily intake from air, water, food, and tobacco ranges from 40 ,llg/day for the rural nonsmoker on a low cadimum diet to 190 ~g/day for the urban smoker on a high cadmium diet. Drinking water conributes only a small fraction (<5~O) to this total intake. Chronic ingestion of cadmium at levels greater than 600 ~g/day in combination with several other necessary predisposing factors was found to be responsible for the onset of Itai-Itai disease in Japan. Dietary intake of amounts in excess of a milligram per day is needed for appearance of acute toxicity. Major toxic ejects are on the kidney; data indicate that the toxicity of cadmium is related to the zinc: cadmium ratio within the organs. Both zinc and calcium may be protective against cadmium toxicity. Persons deficient-in these elements, and especially lactose- intolerant persons who are likely to be calcium-deficient, may constitute a high risk group toward cadmium. There have been some indications of carcinogenic and teratogenic ejects of cadmium in animal studies, but dose-response relationships are unknown. Cadmium has also been implicated as a factor in hypertension. Insufficient data are available for establishment of a maximum no- observed-adverse-health-e~ect value. It may be noted, however, that at a concentration level of 10 ,ug/liter in water, cadmium contributes only about 20% of the normal total daily adult intake with water consumption at 2 liters/day. Both the WHO and the USSR have set the maximum allowable limit for cadmium at 10 ~g/liter. Chromium Microgram amounts of chromium, derived primarily from food, are essential for maintenance of normal glucose metabolism. Chromium (VI) is known to be toxic, principally on the basis of information from respiratory occupational exposures. Increased risk of lung cancer among
Inorganic Solutes 307 those exposed occupationally to chromium (VI) has been established. Although inhaled hexavalent chromium may cause cancer of the respiratory tract, the IARC working group concluded "there is no evidence that non-occupational exposure to chromium constitutes a cancer hazard." Concentrations of chromium found in natural waters are limited by the low solubility of chromium (III) oxides. A study of more than 1,500 surface waters showed a maximum chromium content of 0.1 1 mg/liter, with a mean of 0.01 mg/liter. Little information is available on average total daily intake of chromium in the United States, although it appears to be in the range of 6(}280 ,ug/day. It has been suggested that diets containing mostly processed foods may be chromium-deficient. Tissue chromium in U.S. adults has been shown to decline with age. In addition to the beneficial eject of chromium on glucose metabolism, there have been indications from animal studies that chromium deficiency may induce atherosclerosis. Toxicity of chromium depends on the valence. No toxic ejects were observed in rats when drinking water contained 25 mg/liter of trivalent chromium for a year or 5 mg/liter for life. Acutely toxic doses of trivalent chromium fall in the range of grams per kilogram of body weight. nexava~ent chromium was also tolerated at the 25 mg/liter level for a year by rats. Dogs showed no effects with 11 mg/liter over a 4-yr period. Higher doses are toxic, however, producing erosion of the gastrointestinal tract and kidney lesions. The maximum limit of the Interim Primary Drinking Water Standards, 0.05 mg/liter, is only one-hundredth of the maximum no-observed- adverse-health effect concentration. The European standards of the WHO and Japanese standards give the same acceptable limit, but set it in terms of hexavalent chromium only. The USSR has limits of 0.1 mg/liter chromium (VI) and 0.5 mg/liter total chromium, based on organoleptic factors. More information is needed on the carcinogenic potential of ingested chromium (VI) and chromium (III). If it becomes clear that highly toxic or carcinogenic ejects occur only with chromium (VI) and a suitably sensitive analytical technique is available, then the standard might be set for chromium (VI) alone. In view of the U.S. trend toward dietary chromium deficiency and the suggestion that chromium protects against atherosclerosis, it seems advisable to investigate whether greater allowed concentrations are without adverse health ejects, as some animal experiments suggest. ,, ~. ~
308 DRINKING WATER AND H"LTH Cobalt Cobalt is an essential element as a component of vitamin Bin. This is its only known nutritional function. Excessive intake of cobalt may be toxic with the most notable instance being the association of congestive heart failure with the consumption of beer containing about 1.5 mg/liter of cobalt. Cobalt has been observed in natural waters only in trace amounts. Most waters have no detectable cobalt and values greater than 10 ~g/liter are rare. The maximum recorded value in any of several broad studies was 99 ~g/liter. The major source of cobalt is food; concentration in green, leafy vegetables may be as great as 0.5 mg/kg dry weight. Normally, less than 1% of total intake of cobalt is derived front aqueous sources. Acute toxic ejects in animals have been observed only with daily cobalt doses greater than several mg/kg of body weight. Chronic cobalt toxicity has been observed in children taking cobalt preparations to correct anemia at daily doses of 1 6 mg/kg body weight. T he Interim Primary Drinking Water Standards do not list cobalt, nor has the WHO recommended a limit in its International or European standards. The USSR has set a limit of 1.0 mg/liter. Because the maximum no-observed-adverse-health-effect level is more than an order of magnitude greater than the concentration found in any natural-water or drinking-water supply, there appears to be no reason at present to regulate the concentration of cobalt in drinking water. Copper Copper is an essential element for both plants and animals; it is a component of several enzymes that perform important physiological ~ . {unctions. Copper is a minor constituent of natural waters, the concentration ranging from 1 to 280 ~g/liter in a survey of 1,600 surface waters of the United States. Concentrations may be increased in drinking waters to several mg/liter by corrosion of copper piping in distribution systems, particularly with soft, nonalkalinc waters. Copper may also be released into water in industrial discharges and has been used for algal control in reservoirs at concentrations of a few tenths of a milligram per liter. Average total intake of copper is about 2.5 mg/day, so that when water contains more than 1 mg/liter of copper, the intake from water may equal or exceed that from food. The general health hazard from excess copper intake at a level of a few
Inorganic Solutes 309 milligrams per liter appears to be small, but few people are adversely affected by ingestion of even trace amounts of copper. This disorder of copper metabolism, called Wilson's disease, can be arrested by the use of chelating agents. Individuals with deficiency of glucose-6-phosphate dehydrogenase may be sensitive to copper. The USPHS Drinking Water Standards (1962) recommended a limit for copper of 1 mg/liter based on organoleptic rather than health effects. Because no general adverse-health-e~ects have been observed at the organoleptic limit and because the few individuals with metabolic deficiency are at the mercy of total copper intake rather than copper in water, there is no hygienic reason to impose a limit lower than the presently accepted secondary standard. Lead No beneficial ejects of lead on human or animal development have yet been found. Although acute lead poisoning is rare, chronic lead toxicity is severe and occurs even with low daily intake of lead (~1 ma) because of its accumulation in bone and tissue. The natural lead content of surface waters is generally small. In a survey of nearly 1,600 raw surface waters 20~o were found to contain detectable concentrations of lead and these had a mean concentration equal to 0.023 mg/liter. The lead concentration in municipal supplies at the tap may be much greater, however, for soft, low pH (agressive) waters will dissolve lead from service connections, lead-lined household piping or soldered joints. Lead concentrations in excess of the interim standard of 0.05 mg/liter were found in 1.4% of the water systems tested in the Community Water Supply Survey. The maximum value was 0.64 mg/liter. The mean concentration of lead in U.S. drinking waters has been estimated to be 0.013 mg/liter. Consumption of 2 liters/day per capita gives a mean daily intake of 26 fig. Lead intake from food varies greatly with mean daily values estimated at 100 300 leg per capita for adults. Average water intake is considerably less than that from food, but when the concentration in water is close to or exceeds the interim standard of 0.05 mg/liter, water intake approaches that from food. Absorption of lead from dietary sources, either food or water, is estimated to be about logo for adults. Daily lead absorption from food is, then, 1~30 ,ug, while absorption from water ranges from an average of 3 ,ug to 10 fig or more, when water having a lead concentration of 0.05 mg/liter or greater is ingested at 2 liters/day.
310 DRINKING WATER AND HEALTH The daily intake from air also ranges widely, and is greatest among city dwellers. For a daily inspiration volume of 20 ma for adults and a lead concentration of 3 ~g/m:` in urban air, the per capita daily intake is 60 fig. The absorption percentage from air is about 40~, however, so that the daily quantity absorbed is 24 fig, a value comparable with the dietary absorption. The sum of the estimated adsorptions from the various routes, 5~60 g/day, is already at the maximum no-observed-adverse-health-e~ect values of 50-60 ~g/day. Children, and especially inner-city urban children, are a special risk group with regard to lead toxicity. A primary reason is that absorption of lead from food and water is 4~50% for 2-3-yr-old children, rather than the 5 to low characteristic of adults. Also, water intake per kilogram of body weight is considerably greater for young children than for adults. Moreover, lead concentrations in urban air increase with proximity to the ground, so that urban children tend to have increased intake from this source. Young children also have the added risk of ingestion of flaking lead-based paints especially in depressed, older, urban areas. Dietary lead intake for a 2-yr-old child (12 kg) has been estimated to be 100 ~g/day (8.3 ~g/kg/day); with water at the present 0.05 mg/liter limit and a consumption of 1.4 liter/day' and with air intake about 18 ~g/day, the estimated total intake for a 2-yr-old would be close to 190 ~g/day, not including other possible sources. If the water contains 0.1 mg/liter of lead, the present allowable limits of the WHO European standards and of the USSR, then an intake of nearly 260 leg lead/day for a 2-yr-old child can be estimated. With this intake an overall absorption close to 100 ,ug/day can be estimated, a value suggesting that the allowable concentra- tions of the WHO European standards and the USSR may fail to provide adequate protection for children. Major chronic adverse effects of lead are produced in the hematopoiet- ic system, central and peripheral nervous systems, and kidneys. Distur- bance in heme synthesis is considered to be the most sensitive eject. There is a detectable increase in red-cell protoporphyrin in women and children with blood lead concentrations greater than about 25-30 ~g/dl. For men occupationally exposed, the maximum no-observed-adverse- health-effect level appears to be somewhat greater at 50 60 ~g/dl. Results of studies in the Boston area indicate that increased blood levels of lead will occur in children when the water supply contains 0.05- 0.1 mg/liter of lead. Thus, the interim limit of 0.05 mg/liter may not provide the margin of safety to safeguard the high-risk population in urban areas. Although satisfactory for a 70-kg adult, the WHO recommendation of 5 fig of lead per kg/day as a safe total daily intake
Inorganic Solutes 311 cannot be met for a 12-kg child when the water supply contains as much as 0.05 mg/liter. It is concluded that the no-observed-adverse-health- e~ect level cannot be set with assurance at any value greater than 0.025 mg/liter. Magnesium Magnesium is an essential element in human, animal, and plant nutrition. It is geologically ubiquitous and the industrial uses of its salts are legion. The average U.S. adult ingests between 240 and 480 mg of magnesium per day. Magnesium intake from 3.6~.2 mg/kg of body weight are believed to be adequate to maintain magnesium balance, which is closely regulated by normal kidneys. The median concentration of magnesium in the water of the 100 largest U.S. cities was reported at 6.26 mg/liter with a maximum of 120 mg/liter. It can be higher, especially in arid western states. An excess of magnesium in the diet is seldom harmful, for it is generally excreted promptly in feces. High concentrations of magnesium sulfate in drinking water have a cathartic effect on new users, but a tolerance is soon acquired. Excessive magnesium in body tissues and extracellular fluids occurs only as a result of severe kidney malfunction. Magnesium deficiency in humans may occur in alcoholics, persons performing hard labor in hot climates (because magnesium is excreted in perspiration), those with certain endrocrine disturbances, and patients using potent diuretics. Such deficiencies can best be overcome by oral administration of magnesium compounds. The National Interim Primary Drinking Water Regulations do not contain a limit for magnesium, nor did the 1962 USPHS drinking water standards. The USSR has set no limit, but the WHO has recommended a maximum of 150 mg/liter. In view of the fact that concentrations of magnesium in drinking water less than those that impart astringent taste pose no health problem and are more likely to be beneficial, no limitation for reasons of health appears needed. Manganese Manganese resembles iron in its chemical behavior and occurrence in natural waters, but is found less frequently and usually at lower concentrations than iron. Manganese, like iron, is an essential trace nutrient for plants and animals. It is not known whether human manganese deficiency occurs in the United States. The solubility of the several oxidation states of manganese (II, III, and IV) depends upon the
312 DRINKING WATER AND HEALTH pH, dissolved oxygen, and presence of complexing agents. Occasionally, deep lakes or impounding reservoirs that contain organic sediments under anerobic reducing conditions can distribute several mg/liter of Mn+2 throughout the water body during "turnover" mixing. Normally, however, manganese in natural surface waters is less than 20 ~g/liter. Manganese can be absorbed by inhalation, ingestion, and through the skin; the consequences of this have been recently reviewed in depth by the National Academy of Sciences. It has been known that the occupational inhalation of manganese dusts results in a disease of the central nervous system resembling Parkinsonism and a fount of pneumo- nia. Ingestion of manganese in moderate excess of the normal dietary level of 3-7 mg/day is not considered harmful. A reported outbreak of manganism in Japan was attributed to drinking well water containing about 14 mg/liter of manganese. The maximum concentration of manganese found in the 1975 Survey of Interstate Water Supply Systems was 0.4 mg/liter except for samples from two Alaskan airports which showed 1.0 and 1.1 mg/liter. A total of 669 supplies were examined. Similarly the maximum concentration found in the 1969 Community Water Supply Survey was 1.3 mg/liter from 969 supplies. Both these maximum concentrations are an order of magnitude less than minimum concentrations at which adverse health effects are observed. Moreover, even with manganese at 0.4 mg/liter the intake of manganese from water would be only about 15% of the normal total dietary intake of manganese. Because concentrations of manganese found in water supplies are much less than those at which adverse health effects have been observed and because the regulation of manganese for esthetic and economic reasons is also far more stringent than would be required for reasons of health, there seems little need to establish a maximum no-observed- adverse-health-effect value. Mercury Mercury is a comparatively rare element. It is relatively insoluble in the inorganic form and can exist only in extremely small quantities under natural conditions. Recent measurements show that only 4% of water supplies contain mercury at concentrations greater than 1 ~g/liter. Industrial use has resulted in increased environmental contamination. The health effects of populations occupationally exposed to mercury and mercury compounds has long been recognized, but the problem of contamination of the general environment is of recent origin.
Inorganic Solutes 313 Inorganic mercury in bottom sediments can be transformed biochemi- cally to injurious methylmercury or other organic mercurial compounds. The organic form readily enters the food chain with concentration factors as great as 3,000 in fish. Several investigators have estimated the blood levels of mercury at which the identifiable symptoms of mercury intoxication occur. These levels may be obtained with a steady mercury intake of from 4 14 g/kg/day. This would be 24~840 ~/dav for adults and 8C~280 u~/dav . .. . . ~ , . ~ , tor children. it Is estimated that the normal diet will contribute about 10 g/day of mercury. With daily intake of 10 lag from food and 4 lag from water it appears that there is considerable margin of safety. However, those individuals regularly consuming fish from contaminated areas may exceed the normal intake by a factor of three or more and thus constitute a high-risk population. There is no indication that concentrations of mercury in drinking water or air have contributed in any significant way to methylmercu~y intoxication of the general population. The interim standard limits the daily intake to 3 - ~,/day. Nearly all public water supplies in the United States contain less than 2 ~g/liter of mercury. The WHO has set no limit and the USSR has a maximum permissible concentration of 5 ~g/liter. Molybdenum Soluble molybdate ions are present in trace concentrations in many surface waters, primarily as a result of discharge of industrial wastes but also as a product of natural weathering of molybdenum-bearing soils. Both suspended ir~soluble molybdenum disulfide and soluble molybdates are present in streams draining areas where molybdenum ore is mined and processed, especially in Colorado and New Mexico. Typical diets contain on the order of 100 1,000 ,ug/kg, whereas typical surface waters (except those draining mining areas) contain less than 100 g/liter, with median values about 10 ~g/liter. Hence, water is a minor factor in the total molybdenum intake in most locations. Since some finished waters have been reported to contain as much as 1 mg/liter, some water intake may provide as much as 2,000 ~g/day of molybdenum. More information is needed about adverse ejects of molybdenum at these levels to deal properly with such supplies. Molybdenum poisoning has rarely been observed in humans. Although it has been implicated for gout in Armenia and for a bone-crippling disease in India, more information is needed to establish cause-and-e~ect relationships. Molybdenosis in livestock is a significant toxicological problem in
314 DRINKING WATER AND HEALTH many areas of the world. Consumption of molybdenum-rich forage by cattle and sheep causes severe diarrhea (scouring) that sometimes results in death. It can be prevented or ameliorated by the administration of copper, but the relationship of molybdenum, copper, and sulfate-forming compounds in animal metabolism needs further study. The USSR has established a limit for molybdenum of 0.5 mg/liter in open waters, but the WHO has not promulgated a limit. Nickel Nickel may occur in water from trace amounts of a few micrograms per liter to a maximum of 100 ~g/liter. At these levels the daily intake of nickel from water ranges from less than 10 ~g/day to a maximum of 200 g/day, as compared to a normal food intake of 30{~600 ~g/day. Available information indicates that nickel does not pose a toxicity problem because the absorption from food or water is low. The principle reason for considering nickel stems from epidem~ological evidence that occupational exposure to nickel compounds through the respiratory tract increases the risk of lung cancer and nasal-cavity cancer. There is difficulty in separating the eject of nickel from the simultaneous inhalation of other carcinogens including arsenic and chromium. Because of the generally low concentration of nickel in drinking water and its reported low oral toxicity, there is no present need to set primary health effect limits for nickel in water. WHO and the USSR have set no standards for nickel in drinking water. Silver Trace amounts of silver are found in some natural waters and in a few community water supplies. It has not been detected at levels exceeding the interim standard of 50 ~g/liter. Colloidal siver consumed in large doses several hundred mg/kg of body weight-can cause anemia and possibly death. The main chronic eject in man is "argyria." Argyria is a cosmetic defect once caused through medical or occupational exposure to silver preparations. It is rarely encountered now. Dosages of from 1 to 5 g of silver are sufficient to produce this syndrome. On the assumption of 50% absorption of silver, consumption of 2 liters/day of water containing 0.005 mg/liter of silver would result in an accumulation of I g of silver over 55 yr. Since silver ion has not been detected in water supplies in concentra
Inorganic Solutes 315 lions greater than half the no-observed-adverse-health-effect level, regulation of its concentration as a primary standard would appear to be unnecessary. T. In There is some indication that tin may be a beneficial micronutrient, although it has not been conclusively demonstrated that tin is an essential trace element in human nutrition. Inorganic tin is relatively nontoxic, but organotin compounds can be toxic at high concentrations. Indeed, they are used an fungicides, insecticides, and antihelminthics. Tin has seldom been determined in natural or municipally treated water. The few available data generally show concentrations of the order of one or two ~g/liter. In contrast, tin is present in most natural foods, and especially in canned products, to the extent that the normal human ingestion varies from 1-30 mg/day, which is three or more orders of magnitude higher than the probable concentration in a liter of tap water. EPA has not set a limit for tin in its National Interim Primary Drinking Water Regulations. In view of the foregoing considerations, no regulation seems necessary. Vanadium Vanadium is a trace metal that has been introduced into the environment in large quantities. Fresh surface waters show concentrations in the 2-300 g/liter range, but with low frequency of detection. The data are limited on levels in finished drinking waters, but vanadium concentrations up to 19 ~g/liter have been reported. Occupational exposure to pentoxides and trioxides of vanadium leads to ear, nose and throat irritation and generally impaired health. The consequences of exposure to vanadium in air, water and food have been reviewed recently. There is no evidence of chronic oral toxicity. Vanadium is considered a beneficial nutrient at ~g/liter levels, having been suggested as protective against atherosclerosis. zinc Concentrations of zinc in surface water are correlated with man's activities and with urban and industrial runoff. The solubility of zinc is variable, depending upon the pH of the water. In the same manner as
316 DRINKING WATER AND FILTH lead and cadmium, zinc is dissolved in concentrations as great as several mg/liter from galvanized pipes and tanks in soft-water systems. Concen- trations ranging from 2-1,200 ~g/liter were detected in 77~O of 1,577 surface water samples and 3-2,000 ~g/liter in 380 drinking waters. Zinc is relatively nontoxic and is an essential trace element with recommended minimum intake levels of 15 mg/day for adults and 10 mg/day for children over 1 yr of age. A wide margin of safety exists between normal intake from the diet and those likely to cause oral toxicity. Concentrations of 30 mg/liter or more impart a strong astringent taste and milky appearance to water. Some acute adverse ejects have been reported from consumption of water containing zinc at 4~50 ,ug/liter. There are no known chronic adverse ejects of low-level zinc intake in diet, but human zinc deficiency has been identified. The presently established standard (USPHS) for zinc in drinking water is a "recommended" or secondary standard based on the threshold of the metallic taste at about 5 mg/liter. The WHO recommends the same limit; however, the USSR has established a limit for zinc at 1 mg/liter for other than health reasons. OTHER INORGANIC CONSTITUENTS Arsenic OCCURRENCE Arsenic is widely distributed in low concentrations in the waters of the United States (Durum, 19744. In one study of selected minor elements in TABLE V-12 Regional Summary of Arsenic in U.S. Surface Waters Region Proportion, Proportion, Maximum Minimum. Median, < 10 ,ug/liter, > 10 ,ug/liter, ,ug/liter ,ug/liter ,ug/liter ~ New England and Northeast60 <10 <10 80 20 SoutheastI .1 10 < 10 < 10 70 30 Central140 < 10 < 10 75 25 Southwest10 < 10 < 10 87 13 Northwest30 < 10 < 10 86 14 (From Durum et al. . 197 1 )
Inorganic Solutes 317 728 samples of U.S. surface waters, the concentration of arsenic ranged from less than 10 to 1,100 ~g/liter (10-1,100 ppb). A study by the U.S. Geological Survey (USGS, 1970) of river waters revealed that the median concentration of arsenic was less than 10 ,ug/liter, the lower limit of detection, but 22% of the samples had concentrations of 1~20 ~g/liter (Table V-12~. In this survey, except for local anomalies where arsenic concentrations could be traced to urban waters or to industrial sources, no major regional differences could be detected in average values or in percentage of contaminated samples. The distribution of arsenic in waters and sediments of the Puget Sound region (Washington) has been studied by Crecelius and Carpenter (1974~. A large copper smelter in the area releases about 300 tons of arsenic per year into the atmosphere in stack dust and about the same amount in liquid effluent directly into Puget Sound. The concentrations of arsenic in Puget Sound waters are 1.5-2.0 ~g/liter, except for surface waters within a few miles of the smelter, where they may reach 1,000 ,ug/liter. Away from the immediate smelter area, the concentrations of arsenic in the Sound are not likely to rise above 1-2 g/liter because of the 1/2-yr replacement time for waters in Puget Sound. There have been a number of reports of isolated instances of higher than usual concentrations of arsenic in well waters. Lassen County, California (Goldsmith et al., 1972), was one such. area. It was examined because of arsenic in well water ranging from 0.1 mg/liter or less to 1.4 mg/liter well above maximal allowable standards. This compares with the 0.05 mg/liter recommenced by the U.S. Public Health Service as well as the WHO in its International and European drinking-water standards. The Lassen County study indicated that when the arsenic concentration in water was above 0.05 mg/liter, storage in hair increased, but there was no evidence of specific illness associated with concentrations up to 1.4 mg/liter. In Perham, Minnesota, a newly bored well was associated with illness in 13 people whose hair samples contained arsenic at37-1,680,ug/g. The well water serving these patients contained arsenic from 1 1,800 to 21,000 ,ug/liter; this was later determined to come from ground contamination by residual arsenical grasshopper bait (Feinglass, 1973). Antofagasta, a city of 130,000 in Chile, had a water supply containing high quantities of arsenic (800 ppb) between 1958 and 1970. The source of the high arsenic content was the Toconce River, whose waters come from the Andes Mountains at an altitude of 3,000 m and were brought 300 km to Antofagasta (Borgono and Greiber, 1972~. At the begining of
318 DRINKING WATER AND HEALTH the 1960's, the first cutaneous manifestations were noted in children. There were several severe cases, including a few fatal ones, of arsenism at the Calve Mackenna Hospital in Santiago. The principal finagling was the close relation between the prevalence elf cutaneous lesions (over 30 of the population) and the exposure to drinking water with a high arsenic content. The arsenic content of the hair and water supplies decreased markedly after action was initiated to clean up the water supply by opening a new water-treatment plant. Natural sources, including the erosion of surface rocks, probably account for a significant portion of arsenic found in surface water and groundwater. Fleisher (1973) noted that fumarolic gases associated with volcanism have been reported to contain arsenic at up to 700 ppb, and waters of hot springs contain up to 13,700 ppb. Otherwise, scattered data for arsenic in groundwater indicate low concentrations, often below the limit of detection and perhaps averaging around 1 ~g/liter (1 ppb). Isolated instances of arsenic in such concentrations which warrant surveillance have been reported. Arsenic is found in many foods; it occurs naturally in some and is introduced into others by way of feeds and pesticides. Crustaceans and other shellfish may contain up to 170 ppm (Frost, 1967~. Apples that have been sprayed with lead arsenate to control coaling moths might contain as much as 2 mg of residue. Wine and cider may contain arsenic, but it is usually removed during processing. Wine yeasts have been shown to contain arsenic in amounts up to 180 ppm, and baker's yeast up to 17 ppm. Meat may contain traces of arsanilic acid that has been used as a growth additive in cattle and poultry feeds. Theoretically, these additives are discontinued several days before marketing, and, in fact, the FDA allows an animal tissue arsenic content of 2.65 ~g/g. There has been considerable speculation about the addition of any arsenic to the diet of animals. Arsenic was found in 3.27 of samples of food items examined in the United States during a market-basket survey; residues ranged between 0.1 and 4.7 mg/kg (Cummings, 19661. The daily intake in the United States is calculated to be 0. 137~.330 mg (Duggan and Lipscomb, 1969). Arsenic occurs in the earth's crust in concentrations averaging 2 ppm (Fleischer, 19734. It is concentrated in shales, clays, phosphorites, coals, sedimentary iron ore, and manganese ores. In the United States, arsenic is produced (and distributed into the environment) largely as a result of smelting nonferrous-metal ores, particularly copper. Recent analyses of petroleum show a median arsenic concentration of 90 ppb, but there are few data. Superphosphate fertilizer made by treatment of phosphorite with sulfuric acid has been reported to contain as much as 0.1% arsenic.
Inorganic Solutes 319 IdETABOL ISM The metabolism of arsenicals by mammalian systems has been reviewed in detail by Frost (1967), Lisella et al. ~1972), Harvey (1975), and others. The present discussion summarizes the available information. Absorption Water-soluble arsenicals are readily absorbed through the gastrointesti- nal tract, lungs, and skin; some nonpolar organic forms are also absorbed from the intestine and skin (Hwang and Schanker, 1973; Tarrant and Allard, 19721. Arsenic trioxide is only slightly soluble in water and is not well absorbed. Pentavalent arsenic, Ast + V), whether inorganic or organic, is better absorbed than the trivalent form, because As(+V) is less reactive with membranes of the gastrointestinal tract. Arsenites are generally better absorbed through skin than arsenates, and absorption depends heavily on lipid solubility of the compound. Some of the selective toxicity of arsenic is explained by arsenates penetration of insect cuticle more rapidly than of human skin. Arsenite is more toxic to humans than arsenate and is more readily absorbed through human skin (Harvey, 19751. Distribution Arsenic is distributed primarily to the liver, kidneys, intestinal wall, spleen and lungs. The extent to which arsenic is taken up by these tissues depends on the rate of exposure and the chemical form. In guinea pigs, rabbits, apes, and humans, radioarsenite (74As) injected subcutaneously was distributed to muscles and other tissues (Hunter et al., 19424. Sodium arsenite (76As) that was injected intramuscularly to rabbits was found mainly in liver, kidneys, and lungs (Ducoff et al., 19484. Arsenic is immobilized by binding to sulftydryl groups in the keratin of hair and nails. Deposition begins within 2 weeks after administration, and the arsenic deposited may remain for the lifetime of the hair or nail. In this way deposition also serves as an excretory mechanism. Excretion There is a great deal of confusion in the literature regarding accumulation of arsenic. Rats (and possibly cats) appear unique, for they accumulate arsenic in the blood, bound to hemoglobin, whereas in other species there is no accumulation (Lanz et al., 1950; Hove et al., 1938; Peoples, 19644.
320 DRINKING WATER AND H"LTH Arsenate is rapidly excreted in the urine (Lanz et al., 1950; Ginsburg, 1965~. Arsenate, however, can be reabsorbed by the proximal tubule in the dog kidney and re-excreted as arsenite (Ginsburg, 1965~. Arsenite is excreted slowly in the urine, and it can take up to 10 days to completely excrete a single dose of parenterally administered trivalent arsenic (Hunter et al., 19421. It appears that arsenite is slowly oxidized to arsenate in the body and filtered into the urine in the pentavalent form. Mealy et al. (1959) suggested that arsenite is excreted by humans in three phases. More than 99% of radioactive sodium arsenite (74As) injected intravenously into five human volunteers was excreted in the first 15 h after administration, most of the balance was excreted at a constant low rate over the next 155 h, and the remainder was excreted at an even lower rate.- An alternative explanation for this observation is that the three phases are artifacts of the sampling time. Administration of arsenic to cows does not appear to influence arsenic concentrations in milk, although tissue concentrations increased (Peo- ples, 19641. Arsenic acid (Peoples, 1964), lead arsenate (Marshall et al., 1963), and arsenic trioxide (Fitch et al., 1939) given to cows are readily excreted as pentavalent arsenic in the urine. Transformation Little is known about the biotransformation of arsenic in man in spite of the long use of arsenicals as pharmaceuticals and pesticides. Arsenic inhibits the activity of many enzymes by reacting with sulfhydryl groups. In most cases the arsenical is converted to the trivalent form as an arsenite or arsenoxide (R - As = 0~. This active form of arsenic then combines with two sulfhydryl groups (often from two protein molecules) to form such products as R - As - (S-protein)c (Harvey, 1975~. Intramolecular reactions also occur when arsenic combines with both sulfhydryl groups of c~-lipoic (thioctic) acid to form a six-membered ring compound. Such reactions are considered responsible for much of the toxic action of arsenicals. HEALTH EFFECTS The toxicity of various arsenic compounds is extremely variable and depends on the species exposed, the formulation of the arsenical, the route of exposure, and the rate and duration of exposure. An assumption that all arsenic compounds are equally toxic is incorrect. Although man and other animals are susceptible to arsenic poisoning, there is a wide variation among species in susceptibility to a specific arsenic compound.
Inorganic Solutes 321 Similarly, there is a wide variation in toxicity of the various arsenical forrrlulations to a given species. Because of the many factors influencing the toxicity of arsenic, there is little point in attempting to state its toxicity in terms of milligrams per kilogram of body weight. It may be said, however, that the lethal oral dose of the more toxic arsenic compounds in most species appears to be 1-25 m~,/kg of body weight, whereas the lethal dose for the less toxic compounds may range from 10 400 times this amount (Buck et al., 1973; Penrose, 1974~. Groups of arsenic compounds can be listed as follows in decreasing order of toxicity (Penrose, 1974~: Arsines (trivalent, inorganic or organic) Arsenite (inorganic) Arsenoxides (trivalent with too bonds to oxygen) Arsenate (inorganic) Pentavalent arsenicals, such as arsonic acids Arsonium compounds (four organic groups with a positive charge on arsenic) Metallic arsenic Arsine gas is an indirect hemolytic agent due to its inhibition of red-cell catalase, which leads to accumulation of hydrogen peroxide which in turn destroys the red-cell membrane (Moeschlin, 1965~. Inorganic arsenite or its anhydride, arsenous oxide, are the most common commercial forms of arsenic. Their acute toxic ejects follow a short latent period and include rapid collapse, shock, and death. Arsenoxides and inorganic pentavalent arsenicals vary considerably in their toxicity. Although they are usually less toxic than the arsenites, their effects on biologic systems appear to be the same. In general, the phenylarsonic compounds are less hazardous for mammals than other arsenical compounds. The toxic effects of these compounds are manifested by incoordination, inability to control body and limb movements, and ataxia resulting from demyelination of the peripheral nerves (Ledet, 1973~. Arsonium compounds and metallic arsenic are quite stable and have relatively low toxicity (Schroeder and Balassa, 1966; Penrose, 1974~. Toxic Effects In Humans Human exposure to arsenic sufficient to cause severe toxicosis usually occurs through ingestion of contaminated food or drink. The signs and symptoms are variable in degree and timing and depend on the form and
322 DRINKING WATER AND H"LTH amount of arsenic, the age of the patient, and other factors (Willcox, 1922~. The major characteristics of acute arsenic poisoning are profound gastrointestinal damage and cardiac abnormalities. Symptoms may appear within 8 men if the arsenic is in solution, but may be delayed up to 10 h if it is solid and taken with a reseal. The signs include excruciating abdominal pain, forceful vomiting, cramps in the legs, restlessness, and spasms. "A feeble, frequent, and irregular pulse ushers in the other symptoms of collapse, the livid and anxious face, sunken eyes, cold and clammy skin. . . . A small proportion of the cases are classed as nervous or cerebral because . . . the . . . conspic- uous . . . phenomena are . . . prostration, stupor, convulsions, para- lysis, collapse, and death in coma" (Holland, 1904~. Only a small fraction of patients will develop any kind of skin reaction secondary to acute arsenic poisoning. Presumably, the arsenic is absorbed from the damaged gut and finds its way to the skin. The usual reaction in these circumstanc- es is acute exfoliative erythroderma, probably reflecting the fact that arsenic is a capillary poison (Harvey, 19651. Exposure to amounts of arsenic sufficient to cause symptoms is probably more common than that sufficient to produce systemic collapse. The patient may go for weeks with gradually increasing or variable signs and symptoms related to several organ systems and with the appearance of a progressive chronic disease. If death occurs, it may appear to have been the consequence of an obscure "natural" disease. Skin manifesta- tions of such victims are particularly prominent. In 1901, over 500 beer-drinkers afflicted with an unusual poisoning attributed to arsenic in one of the ingredients were studied by Reynolds (1901~. The symptoms appeared after many months of drinking 2-16 pints per day of beer which contained a fraction of"the quantity of arsenic which (would be prescribed for) an epileptic." Although Frost (1970) has refuted his conclusions and provided evidence that selenium may have been the contaminant, the clinical manifestations described were compatible with those produced by arsenic. The first symptoms to appear were digestive, especially vomiting and diarrhea. Within a few weeks, catarrhal symptoms appeared such as conjunctivitis, rhinitis, laryngitis, bronchitis as well as various skin eruptions. Hoarseness due to thickening of the vocal chords and hemoptysis were also mentioned. Insidious development of necrologic signs and symptoms began before the appearance of the classical skin lesions, but sometimes were so vague as to go undiagnosed for many weeks. Involvement of the nervous system began with sensory changes, including paresthesias, hyperesthesias, and neuralgias. There was marked muscle tenderness: motor weakness of all degrees (including paralysis with muscle atrophy, progressing from distal
Inorganic Solutes 323 to proximal groups) was a frequent observation. Left-side heart failure with severe peripheral edema was observed in one-fourth of the patients, and the 13 deaths in this series were all due to congestive heart failure. Reynolds also described the nail changes of subacute arsenic poisoning, observable some weeks after the intake of the poison was stopped. When normal nail grew out, it revealed "transverse white ridge across the nail; proximal to this the nail is normal, but distal to it the nail is whiter, cracked, thin, and towards the tip also papery and much flattened. In some cases there have been a series of parallel transverse ridges on the nail almost suggesting a series of weekend drinking bouts." This feature of arsenic exposure, commonly called "Mees lines" on the basis of a later description, has also been described by Aldrich ( 19041. Mitzuta et al. (1956) reported on 220 patients of all ages who had been poisoned by contaminated soy sauce, with an average estimated ingestion of roughly 3 mg of arsenic (probably as calcium arsenate) daily for 2-3 weeks. In this group, 85% had facial edema and anorexia; fewer than logo had exanthemata, desquamation, and hyperpigmentation; and about 20% had peripheral neuropathy. Except for headaches and fever, the findings in these patients appeared to be very similar to those reported by Reynolds (19011. The Japanese report offered additional information based upon modern diagnostic techniques. Although the majority of patients' livers were enlarged, relatively few abnormalities were found in liver-function tests; and the histopathologic description of five liver biopsies did not reveal severe degenerative changes. There were no findings suggestive of congestive failure, but electrocardiograms were abnormal in 16 of 20 patients, and this confirmed the reports of Josephson et al. (1951) and Nagai et al. (1956~. The Japanese patients' symptoms tended to diminish after 5 or 6 days, despite continued intake of arsenic, and necrologic symptoms became prominent as much as 2 weeks after arsenic ingestion was discontinued, at which time urinary arsenic content remained high. Hair was found to contain arsenic at 2.8- 13.0 ppm near the root, compared with 0-1.5 ppm near the end and 0. 2.8 ppm in hair from control patients. In the early 1960's, physicians in Antofagasta, Chile, noted dermato- logic manifestations and some deaths, particularly among children, that were traced to a water supply containing arsenic at 800 ppb. This water supply had been in operation only since 1958. In 1971, Borgono and Greiber (1972) reported on a series of studies of the inhabitants of this city. They compared 180 inhabitants of Antofasgasta with 98 people who lived in a city (Iquique) with a normal water supply. Most of the people studied were less than 10 yr old. Among the residents of Antofagasta the Primary symptoms reported were abnormal skin pigmentation (804370);
324 DRINKING WATER AND HEALTH chronic coryza (60cr%.,); hyperkeratosis (36%~; various cardiovascular manifestations, i.e., Raynaud's syndrome (alto); acrocyanosis (27S7~; abdominal pain (39!YO); chronic diarrhea (TWO); and lip herpes (into). The incidence of these symptoms in the control population was substantially lower or nonexistent. Two additional reports on the Antofagasta studies are worthy of note. Zaldivar (1974) further described a study on a total of 457 patients (208 males, 249 females) bearing cutaneous lesions (leukoderma, melanoder- ma, hyperkeratosis, squamous-cell carcinoma). Children (~15 yr of age) accounted for 69. z% of male cases, and for 77.5% of female cases. These patients exhibited high arsenic content in the hair. The mean concentra- tion of arsenic in drinking water in the period 1968-1969 was 580 ppb versus 80 ppb in 1971, differing by a factor of 7.2. Such difference was attributed to a new filter plant, which started operation in May 1970. The average incidence rates per 100,000 population for cases with cutaneous lesions in 1968-1969 were 145.5 for males and 168.0 for females. The incidence rates decreased in 1971 to 9.1 for males and 10.0 for females. Among the 337 registered children, 5 died showing thrombosis of brain arteries, thrombosis of mesenteric artery, restriction of lumen of coronary arteries, and/or myorcardial infarction. Of the 64 registered adult males, 2 developed multiple skin carcinomata with lymph node metastases. A number of questions are raised regarding this report. For example, the decrease in cutaneous lesions seemed to be too rapid, following installation of the water-treatment plant, suggesting other factors were involved. Protection of the 8-10-yr-old age group showed up in three years and adults exposed for more than 15 yr also had a decrease in incidence rate of cutaneous lesions. In a follow-up study, Borgono et al. (1976) investigated clinical and epidemiologic aspects of the cases first reported in 1971. The study was carried out through the examination of arsenic content in hair and nail clipping samples of the inhabitants of Antofagasta and the determination of this element in cultivated vegetables and carbonated beverages. Also a clinical study was made in school children, looking for cutaneous lesions attributed to arsenicism. Six years after the water treatment plant started to operate the problem had diminished considerably. Arsenic determina- tion of hair and nails of children 6 yr of age or less, born since the water treatment plant went into operation, indicated no cutaneous lesions in this age group. However, those over 6 yr of age still had significant arsenic residues in hair and nails. Although the clinical manifestations have improved, arsenic content of water, soft drinks, and in some foods are still considerably above safe levels and require additional sanitary . . . engineering Improvements.
Inorganic Solutes 325 The Raynaud's phenomenon and acrocyanosis in this population are reminiscent of the report from Taiwan by Tseng et al. (1968), suggesting that chronic arsenism affects the vasculature in a way similar to the more acute phenomena described by Reynolds and others as erythromelalgia and acrocyanosis. Tseng et al. surveyed a group of 40,421 (from a population "at risk" of 103,154) and found hyperpigmentation in 18.4%, keratotic lesions in 7.1%, and blackfoot disease (apparently secondary to arterial spasm in the legs) in 0.9%. All these phenomena were shown to increase with increasing arsenic concentration in the well water of the 37 villages studied. They also increased with age, but the earliest ages noted for specific findings were 3 yr for the characteristic hyperpigmentation and 4 yr for keratoses. The concentration of arsenic in the wells ranged from 17 to 1097 ppb. No cases of melanosis or keratosis were found in a group of 2,552 people living in an area where the wells contained almost no arsenic. Feinglass (1973) reported on 13 persons exposed for 2.5 months to well water contaminated with buried arsenical insecticide. Most patients were seen only once, and the most prominent features were intermittent gastrointestinal symptoms related to water ingestion. Two of the 13 had nail changes, and 6 to 8 had increased arsenic content of the scalp hair. The author did not mention edema, exanthema, hyperpigmentation, or hyperkeratosis. There are many scattered case reports of subacute to chronic arsenic poisoning in the literature. Silver and Wainman (1952) described a patient who ingested approximately 8.8 mg of arsenic trioxide as Fowler's solution daily for a total period of 28 months, as a remedy for asthma. Signs of arsenic poisoning, manifested as increased freckling and as darkening of the nipples, first appeared in association with gastrointesti- nal symptoms after 13 months; redness and puffiness about the eyes and hyperkeratoses developed at approximately 1.5 yr. Neurologic symptoms in the form of paresthesias and weakness were the last to be noted, occurring after 2 yr. When the arsenic intake was stopped, the pigmentation lightened, but the hyperkeratoses remained, and the asthma became more difficult to control. Perry et al. (1948) noted that all of a group of chemical workers handling inorganic arsenic compounds had pigmentary charlges and that one-third of them had "warts," although these were not well described. They reported that the cutaneous "changes were so evident that ithe examiner] could readily tell whether the man . . . was a chemical worker." All these workers had increased urinary arsenic compatible in degree with the extent of exposure; this indicates system~c absorption of the arsenic from dust, probably through the lungs and skin.
326 DRINKING WATER AND H"LTH Some clinical and experimental evidence suggests that arsenic has the capacity to suppress the immune response selectively. For many medical conditions for which arsenic was most popular, steroid drugs are now the treatment of choice. The high incidence of herpes zoster and herpes simplex in cases of subacute arsenic poisoning is reminiscent of patients who were deliberately immunosuF'~ressed to receive kidney transplants. Recurrent pulmonary infections in children in the Antofagasta episode is reminiscent of children with congenital immunodeficiency syndromes. Arsenic is reputed to reduce the lymphocyte count in leukemia which may reflect a selective sensitivity of this cell type, which again is analogous to the ejects of steroids (Borgono and Greiber, 19721. ~arcinogenicit:' A number of studies in man have linked the appearance of cancer to exposure to inorganic arsenic compounds. Evidence has come from the use of arsenicals as drugs. from geographic areas with high concentrations of arsenic in drinking water, and from arsenic-exposed industrial groups, such as miners and smelters, workers in factories manufacturing arsenic-containing pesticides, and vineyard workers. However, the association of cancer with a history of exposure to arsenic in one form or another must be carefully evaluated before arsenic is incriminated as the causative agent (NAS, 1976~. Evidence of the carcinogenicity of arsenic in man is based almost entirely on descriptive, retrospective, epidemiologic studies. Thus, a change in the rate for cancer in various population groups has been identified, suggesting the influence of carcinogens in the environment of . ~ A ~ . ~ ~ tne groups. Though case histories of persons in the afflicted groups have shown exposure to an arsenical, the many variables to which man is subject cannot be controlled in retrospective studies. In none of the human studies was there satisfactory control of exposure to known carcinogens (including cigarette smoke, asbestos, ionizing radiation, polycyclic hydrocarbons, pesticides, and ultraviolet light) or other unknown carcinogens in the environment. The clinical association of skin cancer with the therapeutic administra- tion of arsenic compounds began with a report by Hutchinson ( 1888~. Six patients in whom skin cancer occurred had suffered for very long periods from diseases of the skin (five with psoriasis, one with pemphigus). In five of the cases, arsenic was known to have been used for a long time. Neubauer (1947) summarized 143 published cases of therapeutic arseni- cal epitheliomas. Only a small, but undetermined, proportion of people treated with arsenicals developed cancers. Of the 143 patients, about 70% received arsenicals for skin disease; of these, half had psoriasis. Nearly all the 143 patients received arsenic in the inorganic trivalent form, the most
Inorganic Solutes 327 common drug being potassium arsenite as Fowler's solution. Multiple horn keratoses, especially of the punctate or warty form on the palms and soles, were commonly reported in patients who had received Fowler's solution. Keratoses occurred in about 90370 of the cases of cancer ascribed to treatment with Fowler's solution, about half the skin cancers were - squamous carcinomas arising in keratotic areas of the hands, heels, and toes. The rest were multiple superficial epitheliomas of the basal-cell variety localized on the trunk and proximal parts of the extremities. Only a few of the 143 cases arose in psoriatic patches. There was a substantial frequency of mixed types of epitheliomas. Of the 143 patients, 70970 had multiple lesions, with an average of two per case. The elapsed time from the beginning of administration of the arsenical drug to the beginning of the epitheliomatous growth was variable, but averaged 18 yr, regardless of the type of lesion. The latent period for the onset of keratosis was about 9 yr. In spite of the long latent period, skin cancers started when the patients were relatively young, 3C)% when they were 40 or younger and 70% when they were 50 or younger. There have been numerous reports of arsenic-related occupational cancer, such as those of lung-cancer mortality among Southern Rhode- sian gold miners (Osburn, 1957) and of concurrent lung and liver cancer and clinical arsenism among German vineyard workers exposed to lead arsenate dust (Braun, 1958; Roth, 19571. The association of cancer with arsenic has sometimes been based on the existence of palmer or planter keratoses (Sommers and McManus, 1953~. However, because of the increased concentration of arsenic in the lesions of Bowen's disease, arsenic has been considered as a possible cause of the disease and accompanying visceral tumors, without prior exposure to arsenicals (Graham en al., 19611. Hill and Faning (1948) compared the death records of workers in a British sheep-dip factory with those of other workers in the same district. Of the 75 factory-workers deaths, 22 (29%) were due to cancer; of the 1,216 other deaths, 157 ( 1 Who) were due to cancer. The sites of cancer were primarily the respiratory system and the skin in the factory workers, and there was a considerable incidence of cancer of digestive and abdominal organs in both factory workers and other occupational groups. The median air arsenic content for the chemical workers at the various operations ranged from 254 to 696 ~g/m3. As an upper limit, this represented inhalation of about 1 g of arsenic per year. The excretion of arsenic in the urine of 127 current employees was determined and varied widely. Some exposed workers excreted from 1 to nearly 2 mg/day, whereas many excreted less than 0.1 mg/day. A few of the persons in the control group had very high excretion rates, for no explained reason. It is
328 DRINKING WATER AND HEALTH important to note that 20 of 31 current factory workers had been exposed to airborne sodium arsenite for more than 10 yr, and 5 of them for 4~50 yr. Furthermore, the median age of the 31 exposed workers was 5' yr. None of these mends lungs had pathologic signs attributable to their exposure to sodium arsenite (radiographs, vital capacity, and exercise capacity were studied). The authors concluded that the study of factory workers had produced no concrete evidence to confirm the association of arsenic exposure to death from cancer. Lee and Fraumerli (1969) compared the mortality experience of 8,(~47 white male smelter workers exposed to arsenic trioxide and sulfur dioxide during 1938-1963 with that of the white population in the same state. There was a threefold greater total mortality from respiratory cancer In smelter workers, many of whom were also exposed to silica, ferromanga- nese dust, and and other fumes. Snegire~ and Lombard (1951! made a substantial study of cancer mortality in a metallurgic plant in which arsenic was handled and in a control plant in which "working conditions appro.mmate those of Plant A except that no arsenic is handled." We authors stated that total cancer mortality in the two plants was not significantly different from the figures for the state as a whole, and they concluded that handling of arsenic trioxide did not cause a significant change in cancer mortality. Their data demonstrated, however, evidence of a respiratory system carcinogen among workers of both plants, but arsenic may not have been involved. A study at the Dow Chemical Company was carried out to examine the incidence of respiratory cancer among 173 workers who were exposed primarily to lead arsenate and calcium arsenate and 1,890 workers who worked in the same plant but were not exposed to arsenic (Ott et al., 1974~. Data were presented on the relationship between cumulative arsenic exposure and the ratio of observed to expected deaths from lung cancer. The average exposure of each worker was calculated on the basis of records of job assignments and data on the arsenic content of the air in various parts of the plant. Deaths Mom respiratory malignancy were ~7 times greater than expected for total inhaled quantities of 10.3 mg and 2- 4 times greater for 4.84-8.1? ma. There was no association between the extent of exposure and the time from beginning of exposure to death; most of the respiratory cancers occurred 2~0 yr after initial exposure, regardless of total exposure. In contrast with the Dow Chemical Company workers, orchard workers who used lead arsenate had no evidence of increased cancer (Nelson et al., 19731. A mortality study involving a cohort of 1,231 workers in Wenatchee, Washington, who had participated in a 1938 morbidity survey of the ejects of exposure to lead arsenate insecticide
Inorganic Solutes 329 - spray was conducted in 1968-1969. Air concentrat.ions of arsenic during spraying averaged 0.14 mg/m3. She workers were grouped in three categories according to exposure and compared in terms calf standardized mortality ratios with the mortality experience of the State of Washington. There was no evidence of increased rr~ortality front cancer. heart disease, or vascular leslor!s. High incidences of skin cancer have been reported in several groups exposed to high concentrations of arsenic in drinking water, including people in the district of P~eiche-nstein in Silesia (Geyer, 1898), Cordoba Province in Argentina (Bergoglio, 1964), and Taiwan (Tseng et al., 1968~ The existence of arsenic in waters in an eastern area of the province of Cordoba, Argentina, has been known for many decades; it has been associated with tile occurrence of hyperpigmentation, keratosis, and skin cancer. A study Glade in 1949-1959 indicated a higher proportion of deaths from cancer in the arsenical region thank in the rest of the province 23.87 vs. 1 5.37 (Bergoglio, 19641. The excess was due mainly to cancer of the respiratory and digestive tracts in both men and women and was unrelated to socioeconomic differences. A study by Tseng et al. (1968) was done on the southwest coast of Taiwan, where there were artesian wells that had been used for mo e than 45 yr with high concentrations of arsenic. Most of the well water in the endemic area had an arsenic content of around 0.5 ppm. The total population of 'he area was approximately 100,000, and the survey encompassed the 40,421 inhabitants of 37 villages. The overall prevalence rates for skin cancer, hyperpigmentation, and keratosis were 10.~/1,000, 183.5/1,OOQ, and 71.0/1,0()0. respectively. The mare: female ratios were 2.9: I for skin cancer and 1.1: 1 for hyperpigmentation and keratosis. The prevalence of each of the three conditions increased steadily with age, although there was a decline for cancer and hyperpigmentation in women above 69. The prevalence rate for each condition varied directly with the arsenic content of the cell water. In a continuing survey and follow-up in, some villages of Taiwan, Tseng (1976) confirmed that the prevalence rates for skin cancer and blackfoot disease showed an ascending gradient according to the arsenic content of well water, i.e., the higher the arsenic content, the more patients with skin cancer and blackfoot disease. A dose-response relationship between blackfoot disease and the duration of water intake was also noted. Furthermore, the degree of permanent impairment of a patient was noted to be directly related to duration of intake of arsenical water and alternatively to duration of such intake at the time of onset. The most common cause of death in the patients with skin cancer and blackfoot disease was carcinoma of various sites. The S-yr survival rate after /
330 DRINKING WATER AND H"LTH blackfoot onset was 76.3%; 1()-yr survival rate, 63.3%; and 15-yr survival rate, 52.2%. The 50% survival point was 16 yr after onset of the disease. The more recent observations from Chile and from Taiwan emphasize the public health problems associated with arsenic in specific geographic areas. Recent reports from Sweden (Pershagen et al., 1976) are of interest. The study concerns mortality in an area surrounding an arsenic emitting plant. A metallurgic plant, founded in 1928, processed mainly nonferrous metals. Since the starting of operations it has been using ore with a high arsenic content that has resulted in environmental pollution of air and water with arsenic, as well as other metals and sulphur dioxide. The causes of death for the population of two parishes in the vicinity of the plant were listed from the National Swedish Register on Death Causes. A reference area in the same part of Sweden with similar degree of urbanization, occupational profile, and age distribution was chosen. The causes of death for the two populations were followed during a period of 14 yr. A markedly higher mortality rate for lung cancer was noted in men in the exposed area. Also when the occupationally exposed were excluded there remained indications of an increased mortality in men due to primary respiratory cancer. A continuation of this investigation in the form of a cohort study will consider both the mortality and cancer incidence. Tsuchiya (1976) has recently reported from Japan a number of incidents of arsenic poisoning associated with a variety of vehicles including powdered milk, soy sauce, well water, mines, and smelters. Ejects varied according to the dose, duration. and route of exposure. In the milk incident, infants were exposed to relatively high doses of arsenic in powdered milk and the victims developed acute symptoms of the gastrointestinal tract; in some cases, symptoms of the central nervous system, anemia, neuropathy, cardiovascular and skin changes, but no neoplasms. It is not clear whether the symptoms of the central nervous system were due to the stimulation of the cerebral membrane or to organic changes of the cerebral parenchyma. It is important to note that the development of some possible changes of the brain as indicated by BEG and possibly by the higher incidence of epilepsy occurred at a later stage as late as 15 yr after clinical changes had disappeared. No other study has reported the development of chronic encephalopathy among heavily exposed children or adults. Another important question after having reviewed these episodes is whether arsenic is related to the production of liver cirrhosis. In incidents reported in Japan, there is no increased prevalence of liver cirrhosis among those exposed to arsenic. In the well water incident, the married
Inorganic Solutes 331 couple who had been drinking water containing 0.125 ppm arsenic showed liver cirrhosis (the husband) and Banti syndrome (the wife). However, since no cases of either disease have been observed among those who suffered heavier exposure, the relationship between these diseases and arsenic is still open to question. In the soy sauce incident, it was noted that the symptoms improved even while the ingestion of the contaminated soy sauce was still in progress. The mechanism of this phenomenon should be further investigated. The report on the increased prevalence of abnormal EMG findings is also of interest since prolongation of electric conduction velocity has been reported in persons whose blood lead level was lower than 70 ,ug/100 ml. . Since there have been no other reports on the increased risk of lung cancer due to arsenic among occupationally exposed workers in Japan, and also since the induction of lung cancer by arsenic in animal experiments has not been successful, the direct relationship between arsenic and lung cancer is still open to question. In the Saganoseki copper smelter incident, attention was drawn to the fact that smelter workers had also been exposed rather heavily to substances other than arsenic, including polynuclear organic substances, sulfur dioxide and possibly to other chemical substances. Mutagenicity Petres and Berger (1972) and Petres and Hundeiker (1968) have reported chromosomal breakage in human leukocyte cultures after short-term in vitro exposure to sodium arsenate and in cultures obtained after long-term exposure to arsenical compounds in viva. The cytotoxic and mutagenic ejects of sodium arsenate were tested in vitro on phytohemagglutinin-stimulated lymphocyte cultures in concentrations of 0.05-30 ,ug/ml of culture medium. It was reported that 33% of metaphase plates were disrupted at 0.1 ~g/ml and 8~10047o at 2 ~g/ml or greater. The "mitosis index" and the "OH) thymidine labeling index" were decreased. Petres et al. (1976) did chromosome analyses of lymphocytes from patients who had been exposed to arsenic. They showed frequent structural and numerical aberrations even following an interval of decades since the last exposure. The in vitro addition of sodium arsenate induced the Dante chromosome changes in lymphocyte cultures from healthy subjects. Radioactive incorporation studies showed that arsenate was able to inhibit dose- dependently the incorporation of radioactively-labeled nucleotide in
332 DRINKING WATER AND H"LTH RNA and ONA. Beyond that, arsenic blocked the cells in the S- and G- phase. A general explanation for the inhibitory eject of inorganic arsenic on cell metabolism Is the known strong affinity of arsenic to enzymes, especially to those containing sulfhydryl groups. These studies require attention and further investigation. - The overall significance of these chromosomal studies is difficult to assess, because many unrelated compounds may cause similar ejects. The fact that arsenic compounds have caused chromosomal damage in a number of biologic systems, however, should alert toxicologists to a possible role of arsenic in chemically induced mutagenesis. In vivo studies were made on 34 patients at the University of Freiburg skin clinic (Petres et al., 19701. Thirteen of these patients had had intensive arsenic therapy for psoriasis, some more than 20 yr before the experiment. The control group (21 patients) consisted of 14 psoriasis patients and 7 with eczema, none of whom had had arsenic treatment. Phytohemagglutinin-stimulated lymphocyte cultures were prepared from each patient for evaluation of chromosomal aberrations. The incidence of aberrations was remarkably greater in the cultures of patients who had been treated with arsenic. Paton and Allison (1972) investigated the effect of sodium arsenate, sodium arsenite, and acetylarsan on chromosomes in cultures of human leukocytes and diploid fibroblasts. Sublethal doses of the arsenicals were added to leukocyte and fibroblast cultures at varous times between 2 and 48 h before fixation. In leukocyte cultures treated with sodium arsenite at 0.29-1.8 x 10⁻⁸ M for the last 48 h of the culture period, 60% of 148 metaphases examined were found to have chromatic breaks. No significant number of breaks were found in cultures treated with sodium arsenate at 0.58 x 10--8 M, the highest nontoxic concentration. Chromo- somal damage was observed in diploid fibroblasts to which sodium arsenite was added to the medium for the last 24 h of culture; chromatic breaks were found in 20% of 459 metaphases examined. However, treatment with acetylarsan at 6.0 x 10⁻⁸ M resulted in to chromatic breaks in 50 metaphases examined. Environmental exposure to arsenicals has been correlated with a high skin cancer risk among populations exposed to sunlight. These observa- tions suggest that arsenic might interfere with the repair of damage to DNA (mostly thymine dimers) resulting from the ultraviolet rays in sunlight. To test this hypothesis Rossman et al. (1976) have used strains of E. colt, differing from each other only in one or more repair Suctions, to study the interactions. Cultures of E. cold were exposed to UV light and then plated in the presence or absence of sodium arsenite. Survival after
Inorganic Solutes 333 irradiation of wild-type E. cold ~P) was significantly decreased by 0.5 mM arsenite. This eject was also seen in strains unable to carry out excision repair, suggesting that arsenite inhibits one or more steps in the postreplication repair pathways. This was confirmed by the finding that arsenite has no eject on the postirradiation survival of a recA mutant, which does not carry out postreplication repair. Mutagenesis after W-irradiation depends on the recA +and lex+genes. Arsenite decreases mutagenesis in strains containing these genes. In order to determine its mechanism of action, Rossman et al. studied dose- response relationships of arsenite on a number of cellular functions. The most sensitive cellular functions found were the induction of ,B-galacto- sidase and the synthesis of RNA. Since error-prone repair in E. cold is an inducible process, the inhibition of mutagenesis after W irradiation may be the result of inhibition of messenger RNA. Since arsenite inhibits DNA repair in E. colt, specifically post- replication repair, this may be a possible mechanism through which it influences the induction of cancer. Toxic Effects in Animals Arsenic appears to be second only to lead in importance as a toxicant in farm and household animals (Buck et al., 1973; Hatch and Funnell, 1969~. Some of the more common sources of arsenic poisoning include grass clippings from lawns that have been treated with arsenical crabgrass control preparations; grass, weeds, shrubbery, and other foliage that have been sprayed with arsenical herbicides (Buck, 1969~; dipping of animals in vats that even years before had been charged with arsenic trioxide; and soils heavily contaminated with arsenic, either from the burning of arsenic formulations in rubbage piles or through the application of arsenical pesticides to orchards and truck gardens (Clarke and Clarke, 1967; Radele~, 1970~. Arsenical compounds dissolved in water are much more readily absorbed, and thus more toxic than when incorporated into feed (Buck et al. 1973~. In practice, the most dangerous arsenical preparations are dips, herbicides, and defoliants, in which the arsenic is in a highly soluble trivalent form, usually arsenite. Animals often seek out and eat such materials as insulation, rodent bait, and dirt and foliage that have been contaminated with arsenic (Buck, et al., 1973~. Animals that are weak, debilitated, and dehydrated are much more susceptible to arsenic poisoning than normal animals, probably because renal excretion is reduced. Arsenic poisoning in most animals is usually manifested by an acute or
334 DRINKING WATER AND H"LTH subacute syndrome. Arsenic affects tissues that are rich in oxidative systems, primarily the alimentary tract, kidneys, liver, lungs, and skin. It is a potent capillary poison; although all capillary beds may be involved, the splanchnic area is most commonly affected. Capillary damage and dilatation result from transudation of plasma into the intestinal tract and from sharply reduced blood volume. The capillary transudation of plasma results in the formation of vesicles and edema of the gastrointesti- nal mucosa, which eventually lead to epithelial sloughing and discharge of the plasma into the gastrointestinal tract. (Radele~, 1970~. Blood pressure usually falls to the point of shock, and cardiac muscle becomes weakened; these ejects contribute to circulatory failure. Toxic arsenic nephrosis is more commonly seen in small animals and man than in farm animals. Glomerular capillaries dilate, allowing the escape of plasma; this results from the loss of fluid through other capillary beds, and the low blood pressure contributes to the oliguria that is characteristic of arsenic poisoning. The urine usually contains protein, red blood cells, and casts (Buck et al., 1973~. After percutaneous exposure, capillary dilatation and degeneration may result in blistering and edema, after which the skin may become dry and papery. The skin may then crack and bleed, providing a choice site for secondary bacterial invaders (Radeleff, 1970~. In subacute arsenic poisoning, animals may live for several days and show depression, anorexia, watery diarrhea, and increased urination followed by anuria, dehydration, thirst, partial paralysis of the rear limbs, trembling, stupor, coldness of extremities, and subnormal temperature. The stools may contain shreds of intestinal mucosa and blood. Characteristic gross effects associated with inorganic, aliphatic, and aromatic trivalent arsenic poisoning include localized or general redden- ing of the gastric mucosa, reddening of the small-intestinal mucosa (especially the first few feet of the duodenum), fluid and often foul- smelling gastrointestinal contents, a soft yellow liver, and red edematous lungs. Occasionally, in acute poisoning, no gross changes are noted post mortem. The inflammation is usually followed by edema, rupture of the blood vessels, and necrosis of the mucosa and submucosa. This necrosis sometimes progresses to perforation of the stomach or intestine. The gastrointestinal contents may include blood and shreds of mucosa. There may occasionally be hemorrhages on all surfaces of the heart and on the peritoneum (Clarke and Clarke, 19674. Histopathologic changes include edema of the gastrointestinal mucosa and submucosa, necrosis and sloughing of mucosal epithelium, renal tubular degeneration, hepatic fatty changes and necrosis, and capillary
Inorganic Solutes 335 degeneration in vascular beds of the gastrointestinal tract, skin, and other organs (Buck e! al., 1 973; Radeleff, 1 9701. The work of Schroeder et al. (1968) and Peoples (1964) indicates that the rat may be unique in its susceptibility to and metabolism of arsenic compounds. Schroeder et al. noted that, although rats consuming water containing arsenite at 5 ppm accumulated arsenic at 27-47 ppm in their body tissues, they developed no signs of toxicosis and survived a normal 3.5-yr life span. Peoples showed that the rat is unique in its low rate of excretion of arsenic. Both reported that the blood of rats tended to accumulate high concentrations (10~300 ppm) of arsenic. This is not observed in humans. The low rate of arsenic excretion by the rat is probably due to fixation of 8(}90~o in the hemoglobin, which must break down before arsenic is released. These experiments are sufficient to cast doubt on the extrapolation of data from arsenic experiments involving rats to man. Several phenylarsonic formulations have been used as feed additives for disease control and improvement of weight gain in swine and poultry since the mid-1940's. These phenylarsonic acids and their salts include arsanilic acid, 3-nitro-4-hydroxyphenylarsonic acid, 4-nitro-phenylarson- ic acid, and 4-ureido- 1 -phenylarsonic acid. There remains considerable controversy regarding the mode of action of the phenylarsonic compounds. However, they seem to have an action different from that of inorganic, aliphatic, and aromatic trivalent arsenic compounds. The arsenic incorporated in the feed additives is in the pentavalent form, and it is likely that the phenylarsonic compounds have their primary action as pentavalent arsenicals; this may account for their distinctive ejects in birds and animals. Some workers have suggested that both the toxicity and the efficiency of these compounds are due to their degradation and reduction to inorganic trivalent forms (Eagle and Doak, 1951; Harvey, 1965; and Voegtlin and Thompson, 1923~. Others have clearly established that these compounds are excreted unchanged by chickens and that there is no evidence that they are converted to inorganic arsenic (Moody and Williams, 1964a; Moody and Williams, 1964b; Overby and Fredrickson, 1963, 1965; and Overby and Straube, 1965~. Similar experiments by other workers with rats, rabbits, and swine indicate that the phenylarsonic compounds are for the most part excreted unchanged by the kidneys, although some apparently undergo a limited biotransformation (Moody and Williams, 1964b). Because pentavalent arsenic compounds do not readily react with sulf~ydryl groups and because the phenylarsonic acids are apparently excreted unchanged, one must conclude that the mechanism of their
336 DRINKING WATER AND H"LTH action is something other than interaction with sulfhyd~yl containing enzymes and proteins. Clinical signs of phenylarsonic toxicosis in swine and poultry include incoordination, inability to control body and limb movements, and ataxia. After a few days, swine and poultry may become paralyzed, but will continue to eat and drink. Arsanilic acid and its sodium salt may produce blindness but this is rarely seen when it is used as one of the most common feed additives. Erythema of the skin, especially in white animals, and sensitivity to sunlight may be present. The clinical signs are reversible up to a coins. Removing the excess arsenical will result in recovery within a few days, unless the clinical signs nave progressed to partial or complete paralysis due to irreversible peripheral nerve degeneration (Buck, 1969b; Oliver and Roe, 1957~. Chronic arsenic toxicosis has not been encountered significantly in animals. Gainer and Pry (1972) reported that virus-infected mice treated subcutaneously with large doses of arsenicals had higher mortality rates than unexposed controls. Viral diseases so affected by arsenic were pseudorabies, encephalomyocarditis, and St. Louis encephalitis. The elects were similar when 3-nitro-4-hydroxyphenylarsonic salt (75-100 ppm) was added to drinking water. Gainer (1972) reported that sodium arsenite inhibited the induction of interferon in rabbit kidney cell cultures. It was found, however, that, although high concentrations of arsenite inhibited the action of exogenous mouse interferon added to cultures of mouse embryo cells, low concentrations of arsenate increased the antiviral activity of low concentrations of interferon. Carcinogenicity Animal studies have not demonstrated carcinogenicity of arsenic compounds even when administered at near the maximal tolerated dosage for long periods. There are two exceptions, however. Halver (1962) reported the occurrence of hepatomas in trout fed a synthetic diet containing carbarsone at 480 mg/100 g of diet. The data were reviewed by Kraybill and Shimkin (19641. Of 50 trout exposed to carbarsone, 5 developed hepatomas. There were no hepatomas in a large control group fed the synthetic diet without carbarsone. Osswald and Goerttler (1971) reported that subcutaneous injections of sodium arsenate in pregnant Swiss mice caused a considerable increase in the incidence of leukemia in both the mothers and their offspring. A 0.005% aqueous sodium arsenate solution was injected daily during pregnancy for a total of 20 injections, each containing arsenic at 0.5 mg/kg of body weight. Some groups of offspring from the arsenic-treated females were given an additional 20 subcutaneous injections of sodium arsenate
Inorganic Solutes 337 (arsenic equivalent 0.5 mg/kg) at weekly intervals. Leukemia occurred in I I of 24 mothers (auto), 7 of 34 male offspring (214Yo), and 6 of 37 female offspring (ammo). In the offspring given the additional 20 injections, 17 of 41 males (41%) and 24 of 50 females (alto) developed leukemia. Leukemia developed in only three of 35 male (9~O) and in none of 20 female offspring of untreated control mice. Furthermore, 11 of 19 mice (58%) developed lymphoma after 20 weekly intravenous injections, each containing 0.5 mg/kg of arsenic as sodium arsenate. ~ ong-term studies of elects of arsanilic acid on chickens, pigs, and rats were reported by Frost et al. (1967~. No adverse effects were seen in the chickens and pigs after 4 yr of feeding, nor in pigs fed 0.01% arsanilic acid in their diets for three generations. Male and female weanling rats from the Fit generation of a six-generation breeding studio in which 0.0137 and 0.05% arsanilic acid was fed were held on the 0.01% arsanilic acid diet or on the control diet for 1 16 weeks. The overall tumor incidence was the same in all groups and resembled the historical incidence of tumors in the colony, 35 45%. Boutwell (1963) used female mice known to be highly susceptible to skin tumors in a test for cocarcinogenicity of potassium arsenite. It was tested as an initiator, both orally by stomach tube (a total of 2.4 mg in 5 days) and dermally (a total of 1.2 mg in eight applications during 5 days). The initiating exposure was followed by topical application of croton oil twice a week for 18 weeks. He also tested potassium arsenite as a promoter by daily applications (a total of 2.3 mg/week) after a single 75- ~g dose of dimethylbenzanthracene (DMBA). The prolonged skin applications of potassium arsenite were hyperkeratotic and ulcerogenic. Other experiments were done to determine whether arsenic would increase the yield of skin cancers caused by a suboptimal regimen of DMBA plus croton oil given either at the time of DMBA initiation or during the 24-week period of croton oil promotion. Under the latter condition, the mice were fed potassium arsenite at 169 mg/kg offood. In no case was there an effect of arsenite on skin carcinogenesis in these experiments. Many tumors developed in the positive control mice, beginning as early as 6 weeks after treatment began. Baroni et al. (1963) conducted similar studies with male and female Swiss mice, testing the oral elects of potassium arsenite (100 ppm in drinking water) as an initiator with croton oil promotion and as a promoter for DMBA and urethane initiation. Local skin applications of sodium arsenate were tested as a promoter after initiation with DMBA or urethane. The arsenicals had no elect on carcinogenesis, and only a very slight degree of keratosis was observed. Milner (1969) used three strains of mice that differed in susceptibility
338 DRINKING WATER AND H"LTH to the induction of skin tumors with the application of methycholan- threne-impregnated paraffin disks to the skin for 2-3 weeks. The treated site was transplanted syngeneically and observed for 8 weeks for tumor formation. Arsenic trioxide (100 ppm in drinking water) was adminis- tered either during methylcholanthrene exposure, after transplantation, or both. Arsenic exposure was associated with a small increase in papillomas in the low-susceptibi~ity strain, a small decrease in the high- susceptibility strain, and no eject in the intermediate-susceptibility strain. Byron et al. (1967) fed sodium arsenite at 15-250 ppm and sodium arsenate at 3~00 ppm to Osborne-Mendel rats in a 2-yr study. No carcinogenic activity of either material was found. These investigators also did a 2-yr arsenic feeding experiment on dogs, with negative results. This length of time, however, is not adequate for studying carcinogenesis in dogs. Hueper and Payne (1962) incorporated arsenic trioxide in the drinking water (either plain or with 12~o ethanol) of rats and mice. The initial concentration of 4 mg/liter was increased by 2 mg/liter each month, to a maximum of 34 mg/liter at 15 months. Thus, the daily intake of arsenic trioxide ranged from 0.1~.8 me. The administration of arsenic trioxide c, - O . - ~ ~ ~ ~ .1 _ T · .1 , ~ . .1 · 1 1 1 was continued tor Hi months. welder the rats nor Ine mice Developed any cancers in suspected target organs skin, lungs, and liver. Kanisawa and Schroeder (1967) and Schroeder et al. (1968) found no carcinogenic ejects of potassium arsenite at 5 ppm in drinking water in mice or rats exposed from weaning to senescence. Kroes et al. (1974) studied the carcinogenicity of lead arsenate and sodium arsenate with SPF-Wistar-derived male and female rats. In addition, some groups were intubated with a subcarcinogenic dose of diethylnitrosamine to determine synergistic action leading to lung tumors. Food intake and body weights were recorded, and complete gross and microscopic examinations were made on all animals. Lead arsenate that was incorporated in the diet at 1,850 ppm was toxic and caused increased mortality; one adenoma of the renal cortex and one bile duct carcinoma were found in this group. No carcinogenicity was associated with the feeding of lead arsenate at 463 ppm or sodium arsenate at 416 ppm. No synergism with the nitrosamine was observed. In summary, there is epidemiologic evidence of the carcinogenic action of arsenic on the skin and lungs of humans, on the basis of experience with the medicinal use of inorganic trivalent; arsenic, occupational groups exposed to inorganic trivalent or pentavalent arsenic dusts, and popula- tions exposed to high concentrations of arsenic in drinking water. In most instances, however, the exposures to arsenic have been concurrent with J ~
Inorganic Solutes 339 exposures to other agents, and the available data do not exclude the possibility that cofactors are important in the carcinogenic response to arsenic. Differences in the type and distribution of tumors, attributed to the ingestion of arsenic, raise serious questions with respect to a simple etiologic relation of arsenic to the various findings. There is no established procedure to demonstrate carcinogenicity of arsenic in experimental animals. This phenomenon remains an enigma. One must conclude either that arsenic is not a carcinogen for animals or that circumstances not yet understood are essential to demonstrate a role for . . . . . arsenic In exper~menta carc~nogenes~s. Mutagenicity Most of the research on mutagenesis of arsenic has centered on chromosomal reactions to sodium arsenate. There are no data based on the host-mediated assay or the dominant-lethal technique. Levan (1945) treated root meristem cultures of Allium cepa for 4 h with an unspecified arsenic salt at 10 concentrations, from lethal to no-e~ect. Chromosomal changes were observed, including spindle disturbances and metaphase arrests. Similar elects were observed after treatment with salts of 24 other metals. Arsenate has also been found to increase the total frequency of exchanged chromosomes in Drosophila melanogaster treated with seleno- cystine (Walker and Bradly, 1969), and several organic arsenicals have a synergistic elect on the number of abnormalities in barley chromosomes caused by ethylmethane sulfonate (Moutschen and Degraeve, 19654. Teratogenicity Franke et al. (1936) performed what might be called the first teratogenic study of an arsenic compound, when they tested the effect of sodium arsenite on the development of chick embryos. Injection of sublethal concentrations of arsenic into the eggs produced ectopic conditions, but no monstrosities, as are produced by selenium. Ridgway and Karnofsky (1952) found that injection of sodium arsenate into embryonate chicken eggs at 4 days in doses of 0.20 mg/egg caused no specific gross abnormalities in the resulting embryos 14 days later. Growth retardation, impaired feather growth, and abdominal swelling were noted. Recent studies have demonstrated teratogenic effects of intravenous administration of sodium arsenate in mice and hamsters (Ferm and Carpenter, 1968; Ferm et al., 1971~. Single doses (15-20 mg/kg) were administered on the eighth day of gestation, and the results were observed on the fifteenth day: there was a high incidence of anencephaly and other defects. Up to 80% of the embryos had anencephaly; up to 65%, rib malformations; up to 30%, exencephaly; and approximately
340 DRINKING WATER AND H"LTH 20%, genitourinary malformations. Incidences of renal agenesis and cleft lip and palate were lower. Further analysis of the teratogenic conse- quences of sodium arsenate by Holmberg and Ferm (1969) showed that sodium selenite injected at 2 mg/kg simultaneously with a teratogenic dose of sodium arsenate decreased the number of fetal resorptions and congenital malformations caused by the arsenical. in mouse studies, Hood and Bishop (1972) administered a single dose of sodium arsenate or arsenite by intraperitoneal injection on a specific day from the sixth to the twelfth day of gestation and observed the results on the eighteenth day. The injections given on the ninth day were most teratogenic; 60~ of 96 implantations were resorbed or dead, and 63% were grossly malformed. The defects included exencephaly, micrognat- hia, protruding tongue, agnathia, open eye, cleft lip, fused vertebrae, and forked ribs. Mice that received injections of distilled water served as controls. Although teratogenic erects were seen at 45 mg/kg, 25 mg/kg was without effect. Sodium arsenite was more elective, which indicated that the extent of fetal anomalies caused by sodium arsenite at 10 mg/kg was comparable with that caused by sodium arsenate at 45 mg/kg. Hood and Pike (1972) reported that BAL, when administered to mice at 50 mg/kg by intraperitoneal injection within 4 h of sodium arsenate at 40 mg/kg, prevented the arsenic-induced teratogenesis. Potassium arsenate was fed to four pregnant ewes at 0.5 mg/kg during most of pregnancy without elect (James et al. 1966~. Interactions Moxon (1938) first reported the protective effect of arsenic against selenium poisoning when he found that sodium arsenite (5 ppm) in drinking water reduced liver damage in rats on a diet containing selenium at 15 ppm in seleniferous wheat. Moxon and DuBois (1939) demonstrated that arsenic was unique in its ability to prevent selenium toxicity. The protective elect of arsenic against dietary selenium was not seen when the arsenic was added to the diet, instead of the drinking water (Ganther and Baumann, 1962~. Frost (1967) reported that selenium and arsenic are additive in toxicity if both are added to the drinking water. Ganther and Bauman (1962) reported that excretion of selenium into the gastrointestinal tract was markedly stimulated by arsenic when both elements were injected parenterally. Levander and Bauman (1966a,b) showed that this increased selenium excretion occurred through the bile. Sodium arsenite is the most elective in enhancing biliary excretion of selenium, but arsenate and the phenylarsonates were also somewhat effective. This leads one to question the role of phenylarsonic feed additives in exacerbation of selenium deficiency in animals. Surprisingly, Muth et al. (1971) reported that sodium arsenate (1 ppm) added to a
Inorganic Solutes 341 selenium-deficient diet significantly reduced the incidence of myopathy in lambs. This work has not been confirmed. Beneficial Elects A number of older publications suggested that small amounts of arsenic may have beneficial effects in human and animal health (Underwood, 1971~. Until recently, however, there has been no proof of the essentiality of arsenic in mammals. Hove et al. (1938) concluded that, if arsenic were essential to the rat, the requirement must be somewhere below 2 leg daily. Schroeder and Balassa (1966) reported that rats and mice grew well when they received only 0.26 ,ug of arsenic per 100 g of body weight per day in food (0.026 mg/kg). In a recent preliminary report, Nielsen et al. (1975) presented evidence that rats require arsenic at about 30 ppb in a synthetic diet. The deficiency signs were rough hair coat, retarded growth, splenomegaly, reduced hemato- crit, and increased red-cell fragility. The phenylarsonic compounds have been used as feed additives for disease control and improvement of weight gain in swine and poultry since the mid-1940's (Bird et al., 1949; Frost, 1967; Morehouse, 1949~. ANALYSIS Much difficulty has been experienced with chemical analyses for arsenic, especially in biologic samples. Improvements in instrumentation, espe- cially atomic-absorption spectrophotometers, have facilitated such ana- lyses somewhat. In most cases, arsenic determinations on drinking-water samples are less complicated than those on biologic samples. Determination of Arsenic in Drinking Water The current National Interim Primary Drinking Water Regulation for arsenic, 50 ,ug/liter, is 5 times as great as that for selenium. As was the case for selenium, the 1975 Chemical Analysis of Interstate Carrier Water Supply Systems (USEPA, 1975) indicated that the maximal allowable concentration was seldom exceeded, although in a few instances the method of analysis had a minimal detection limit higher than the standard. One of the most sensitive methods for arsenic analysis in water is the atomic-absorption procedure of Fernandez (1973~. The method has an absolute detection limit of 10 ng, which, for a 20-ml sample, provides a solution detection limit of 0.5 ~g/liter a hundred times less than the drinking-water standard of 50 ,ug/liter. The sensitivity can be increased by using an electrodeless discharge lamp, giving an absolute detection
342 DRINKING WATER AND H"LTH limit of 3 ng and a concentration detection limit of 0.15 ~g/liter. The method applies to both inorganic and organic arsenic. There are few interference problems with drinking-water samples. Determination of Arsenic in Biologic Samples A modification of the Fernandez (1973) atomic-absorption method has been adopted by the National Institute for Occupational Safety and Health (1974) for urine and hair samples. The samples are digested in acid: after acid removal, the arsenic is converted to arsine with metallic zinc or sodium borohydride' NaBH4. The arsine is flushed into the burner of the atomic-absorption spectrophotometer for measurement. As little as 1 lag of arsenic per liter of urine can be detected by this method. Colorimetric methods can detect as little as -10 ~g/liter of arsenic in urine (National Institute for Occupational Safety and Health, 1974; Horwitz, 19701. The samples are digested as stated above, and the arsine generated reacts with ammonium molybdate, sulfuric acid, and hydra- zine sulfate, to develop a chromophore with an absorption peak at 845 nm; or the arsine reacts with silver diethyldithiocarbamate, and the chromophore concentration is determined at 522 nm. (If pyridine is present, an altered chromophore is measured at 560 nary.) At concentra- tions approaching the arsenic concentration, antimony will interfere with the calorimetric assays. CONCLUSIONS AND RECOMMENDATIONS The evidence for an association between arsenic and disease in some human populations has been further strengthened by recent epidemiolog- ical studies such as those conducted in the waters of Puget Sound, in local water supplies such as those in Lassen County, California; Perham, Minnesota; Lane County, Oregon; Antofagasta, Chile; and on the southwest coast of Taiwan. Skin lesions, including cancer, and a circulatory disorder referred to as "blackfoot" are major clinical problems where chronic exposure to arsenic exists. Human disease associated with arsenic is not exactly duplicated in animals, although misuse of arsenicals results in disease in dogs and in cattle. There is no animal model for study of arsenic-induced cancer. Arsenic causes fetal death at high doses and malformations at lower exposure in hamsters, mice, and rats. Bacterial systems have revealed that arsenic interferes with DNA repair. The different forms of arsenic that exist in the environment may account for differences in clinical manifestations between different localities. .
Inorganic Solutes 343 Environmental sources of arsenic, aside from those listed above include some coal-fired power plants and nonferrous smelting operations. Natural sources include volcanoes and hot springs. Although various analytical techniques are available for speciation of some arsenicals in air and water, others require better methods for accurate analysis at low concentrations. A system for interlaboratory cross-checking for analytic accuracy is needed. Several factors impinge on attempts to evaluate analytical data from human populations such as media being examined (blood, urine, hair, nails), route and dose level, and a requirement for analytical methods capable of measuring total arsenic absorption from all routes of exposure. There are very little data on kinetics and metabolism of arsenic and its compounds, although it appears that much of a dose is excreted via the urine; some is degraded and some may be excreted without metabolic degradation. Arsenic trioxide and pentoxide in humans, appears to be excreted mainly in the methylated form. There is some epidemiological evidence that high concentrations of arsenic in drinking water are associated with skin cancer. When the level was reduced by water treatment to 80,ug/liter, the incidence was reduced but still detectable. The existence of other cocarcinogens in these water supplies has not been extensively studied. If the time factors for the development of cancer are shown to be reasonable, then the current interim standard of 50 ~g/liter may not provide an adequate margin of safety. RECOMMENDATIONS FOR RESEARCH 1. Improvement and standardization of speciation techniques for analyses and application to various biological materials. 2. Interlaboratory cross-checking of the accuracy of the many meth- ods using different matrices. 3. More accurate determination of quantities of environmental arse- nic, their sources and fate. 4. Studies about metabolism in man and animals; rates and mechan- isms of methylation~emethylation in man, animals, and ecosystems. Transfer of arsenic species across tissue barriers, absorption, distribution, and excretion. 5. Investigations about interactions of arsenic and other environmen- tal factors that may account for difference in human clinical observa- tions, and ejects of diet, race, and climate. 6. Development of an animal model for carcinogenicity studies with particular reference to arsenic trioxide and pentoxide.
344 DRINKING WATER AND H"LTH 7. Studies about different responses to arsenic by individuals and species, particularly long-ter~rl, low-level exposure. 8. Further studies on the effect of arsenic on cellular mechanisms, as well as teratology and mutagenicity studies. 9. More uniform and improved methods for epidemiologic studies, coordinated by an international agency. Selenium OCCURRENCE Selenium is obtained industrially, primarily in conjunction with electro- lytic copper refining. Selenium is used in manufacture of electronics equipment (rectifiers, photocells, and xerography), steel (for machinabili- ty and porosity control), pigments, glass (for decolonization and pigmen- tation), and ceramics (for colored glazes). It is used principally in elemental form and in such compounds as selenium dioxide, sodium selenite, sodium selenate, and iron selenate (Cooper, 1967~. Selenium has a profound erect on animals, and either a deficiency or an excess can result in adverse biologic responses. There is a relatively narrow margin of safety for many species, and it is conceivable that an excess of selenium in drinking water can constitute a potential danger. Until recently, selenium was included in a list of carcinogic agents by the Food and Drug Administration (FDA), because of reports of animal research in the United States and Russia (Frost, 1960; Frost, 1972; Tscherkes et al., 1963; Volgarev and Tscherkes, 1967~. The evidence of carcinogenicity of selenium in these studies was tenuous and widely debated. The FDA now permits the addition of selenium to the feeds of turkeys, chickens, and swine, and, because these feeds are mixed in commercial milling operations, the distribution of selenium may become wider than is now anticipated. Selenium can reach toxic concentrations in water from wells drilled through seleniferous shales rich in soluble selenium, and other sources of water contamination are known. There- fore, a better understanding of sources, distribution, metabolism, and health erects is required. Water-soluble selenium has been identified in soils (Olson et al., 1942) and in some salt deposits (Byers et al., 1938), and the presence of selenium in other geologic materials has also been documented (Beath, 1946~. There is a wide variation in concentration of selenium, depending on geologic location. Thus, groundwaters and surface waters may contain significant amounts of selenium, particularly in areas where there is an
Inorganic Solutes 345 TABLE V-13 Selenium in the Natural Environment Selenium Concentration, ppm - Material Average Range Igneous rock 0.05 Shale 0.60 Sandstone 0.05 Limestone 0.08 Coal (ash) 3.30.46-10.6 Phosphate rock 19.0 Soil 0. 1-2.0<0.4-1,200 Surface water 0.00020.0001-0.4 Forage grasses 0.26<0.01-9.0 Forage legumes 0.20.075-0.7 Vegetables and fruits 0.050.01-0.20 (From Cannon, 1974) excess of selenium in rocks and soils; in other areas, there may be little (if any) detectable selenium in the water. There is little in the literature to indicate that surface waters contain toxic amounts of selenium; in fact (Table V- 13), it is likely that there is an insufficient amount of selenium in the water alone to provide the nutrient requirements of most animals (Cannon, 1974), but concentrations may vary in different places. An extensive study by the Department of Health, Education, and Welfare involving analyses of 535 samples of water from major U.S. watersheds indicated that over a 4-yr period only two samples contained selenium at more than 10 ~g/liter of water, the U.S. drinking- water standard (Lakin and Davidson, 1967~. In another study, over a 2-yr period, it was reported that there was a maximum of 10 and a mean of 8 ,ug/liter in 194 public finished water supplies (Taylor, 1963~. In a study in Oregon, the majority of farm samples of water had less than 1 ,ug/liter (Hadjimarkos and Bonhorst, 1961~. This study extended over a 2-yr period and included samples from three counties. In Germany and in Australia, village water supplies have been reported to contain from less than I to 5.3 ~g/liter (Oelschager and Menke, 1969; Edmond, 1967~. River water may contain high concentrations of selenium where irrigation drainage from seleniferous soils empties into it; values of 2,000 g/liter have been reported (Williams and Byers, 1935~. _ ,, . ~. . . .. .. . . . 1 ne water trom some springs and shallow wells contains selenium at more than 100 ~g/liter (Byers et al., 1938; Miller and Byers, 1935; Morette and Diven, 1965), but deep wells may contain only a few micrograms per liter. Water from some Wyoming wells contains enough selenium to be poisonous to man and livestock (Beath, 1962a), but these
346 DRINKING WATER AND H"LTH are in seleniferous areas. In another report from Wyoming, a high concentration of selenate in well water on an Indian reservation was associated with the loss of hair and nails in children (Beath, 1962~. Another source of selenium is the effluent from sewage plants which may contribute as much as 280 ,ug/liter in raw sewage, 45 ~g/liter in primary effluent, and 5 ,ug/liter in secondary effluent (Baird et al., 19721. Of 418 samples obtained from interstate carrier systems, only one failed to meet the mandatory drinking-water standard (Chemical Analysis of Interstate Carrier Water Supply Systems, USEPA, 1975~. It appears from a large number of reports that the selenium content of ocean water is very low. This is attributed primarily to the precipitation of selenite by oxides of iron and manganese (Goldschmidt and Strock, 1935; Ishibashi et al., 1953; Strock, 1935~. In areas where the selenium content of the soil is high, the water in lakes may vary widely in selenium content (Abu-Erreish, 1967~. Although the hypothesis that precipitation of selenium by various means results in low concentration in some cases, this has not been documented. Emerging data indicate that the microbial environment of lake-bottom sediment may influence selenium concentrations in the lake water (Chau et al., 1976~. Available reports indicate little danger of toxicity from amounts of selenium in finished waters, but wells drilled through seleniferous shale containing soluble selenium may have concentrations of selenium high enough to be of concern. Furthermore, finished water for domestic consumption usually is not analyzed for selenium, and, although it appears that most waters have relatively low concentrations, in some cases the selenium may approach toxic concentrations. Recent studies by the U.S. Geological Survey reported that some farms near Denver, Colorado, had high selenium concentrations in their water supplies. Some of the water on a South Dakota Indian reservation contained as much as 210,ug/liter (U.S. Public Health Drinking Water Standards, 1972~. Water that is consumed by human populations rarely constitutes a significant source of selenium. Even with the very low concentrations of selenium found in rivers, there is a significant transport of the element into oceans. This has been estimated at as much as 8,000 tons-of selenium per year discharged into the oceans from rivers (Bertine, 1971~. For this reason, aside from quality, water is important in leaching and transport- ing the element under some conditions. Selenium occurs naturally in the following oxidation states: selenide (-II), elemental selenium (0), selenite ~ + IV), and selenate ~ + VI). Recent published literature indicates that problems of environmental contamina- tion are very likely minimized because nearly all organic selenium is in
Inorganic Solutes 347 the -II oxidation state; this decomposes to elemental selenium, very little of which is absorbed (Klayman and Gunther, 1973; Okamota and Gunther, 19721. Compounds of major concern to environmental toxicolo- gists are selenite (+IV) and selenate (+VI). These are the forms that occur most often in water. The + II oxidation state has not been reported to occur naturally. Selenate ~ + VI) is taken up from water or soil by plants and may reach toxic concentrations (Moxon et al., 1939~. Selenite (+IV) salts are less soluble than the corresponding selenates. Of special interest is the low solubility of the ferric selenites (Geering et al., 19681. It is also of considerable importance that selenite is rapidly reduced to elemental selenium under acid conditions by mild reducing agents, such as ascorbic acid. It is likely that selenite will either form insoluble compounds with ferric oxide or be reduced to insoluble elemental selenium, either of which would minimize the potential hazard in water. Because elemental selenium is practically insoluble and may be derived by high-temperature decomposition of some natural materials, a buffer of safety for water and other environmental sources is provided. For example, in the combustion of fossil fuels or organic materials, selenium dioxide, which is formed from elemental selenium, is reduced to elemental selenium by the sulfur dioxide that is formed during the combustion of these materials (Weiss et al., 1971~. The amount of sulfur dioxide formed during such combustion is always greatly in excess of the amount required for the reduction of the selenium dioxide. For these reasons, elemental selenium appears to be a major inert form that provides a wide margin of safety by serving as a sink for selenium introduced into the environment. Selenide (-II) occurs as hydrogen selenide, which is a volatile acid with toxic fumes. Hydrogen selenide, however, decomposes rapidly in air to form elemental selenium and water, thus eliminating the hazard from this compound for most people, except those involved in industrial installa- tions. It appears that a large amount of insoluble selenide and possibly elemental selenium pass through most animals without appreciable absorption; this is particularly so in ruminants (Peterson and Spedding, 19631. The geochemical behavior of selenium in water resembles that of sulfur. Both are volatile and are emitted as gases during the natural course of volcanic eruption, during the smelting of sulfide ores, and in the burning of coal. It is only where the water-soluble selenate ion occurs in soils that plants can take up significant amounts of it. For this reason, cretaceous shales of a relatively low selenium content produce toxic vegetation, whereas soils that have a much higher selenium content (e.g.,
348 DRINKING WATER AND H"LTH in Hawaii and Puerto Rico) do not produce toxic amounts in plants, because the selenium occurs as selenite bound to ferric oxide (Lakin, 1972; Cannon, 19741. In the + IV state, selenium occurs as organic selenite. Soluble selenites are highly toxic. Selenite binds easily to iron and aluminum, with which it forms stable absorption complexes. Alkaline water conditions favor the formation of the +V-I form, selenate. Selenates are quite soluble, highly toxic, not tightly complexed by sesquioxides, easily leached from soils, and available to plants. In general, one would expect to find higher amounts of selenium in foods and water in areas that have been designated as seleniferous. The data in a number of reports suggest that feeds that are highest in protein usually are highest in selenium content (Scott and Thompson, 1971~. It may be concluded, however, that the selenium concentration in plants depends largely on the concentration and availability of selenium in the soil where the plants are grown. For example, in South Dakota whole milk may contain 1.9 ppm, whole eggs as much as 10 ppm, and vegetables (string beans, lettuce, turnip leaves, and cabbage) from 2 to 100 ppm; the concentrations in the milk and eggs probably reflect that in the feed. A number of investigators have found samples of wheat and wheat products that contain selenium at 1-4 ppm (Lakin and Byers, 1941; Robinson, 1936~. Selenium concentrations in the gluten fractions are usually 4 5 times greater than that in the whole wheat. Foods from nonseleniferous areas contribute little to the overall TABLE V- 14 Diet Selenium Content of Some Foods in the American Food Average Selenium Content, ppm (wet wt.) - 0.010 (0.004-0.039) 0.249 0.118 0.006 (<0.002-0.013) 0.38 (0.026-0.665) 0.051 0.183 0.11 0.003 0.082 (0.052-0.105) 0.006 0.012 0.224 (0.116-0.432) 0.532 (0.337-0.658) Vegetables. canned and fresh Fresh garlic Mushrooms canned and fresh Fruits. canned and fresh Cereal products Egg white Egg yolk Brown sugar White sugar Cheeses Table cream Whole milk Meat (excluding kidney) Seafood
Inorganic Solutes 349 TABLE V-15 Estimated Selenium Emission Factors Source Estimated Selenium Emission Factors Mining and milling Copper Lead Zinc Phosphate (western) Uranium Smelting and refining Copper Lead zinc Selenium refining Primary (from copper by-products) Secondary End product manufacturing Glass and ceramics Electronics and electric Duplicating Pigments Iron and steel alloys Other Other Coal Oil Incineration 0.015 lb/thousand tons of ore mined 0.047 Do. 0.032 Do. 0.350 Do. 0.350 Do. 0.25 lb/ton of copper produced 0.05 lb/ton of lead produced 0.04 lb/ton of zinc produced 277 lb/ton of selenium recovered 100 Do. 700 lb/ton of selenium consumed 2 Do. 2 Do. 15 Do. 1,000 Do. 10 Do. 2.90 Ib/1,000 tons of coal burned 0.21 lb/1,000 barrels of oil burned 0.02 lb/1,000 tons of refuse burned Derived from Davis (1972). dietary intake of selenium. Eggs and milk, fish, various types of meat, poultry, coffee, and tea all vary somewhat in their selenium content, but in general contribute minimally to the dietary intake. Table V-14 lists the selenium content of staple foods of the American diet (Morris and Levander, 1970~. There are occasional cases of industrial exposure to selenium when it is used in relatively high concentrations; the most notable is in copper refining, where selenium is a by-product. Potential industrial sources of exposure to selenium have been reviewed (Davis, 1972; Dudley, 1938~. Table V-15 (derived from Davis, 1972) provides estimates of selenium emission factors. Selenium is not normally used in agriculture, so it is unlikely that agriculture itself will contribute a significant amount to the water
350 DRINKING WATER AND H"LTH supplies. However, now that selenium is being added to the feeds of turkeys, chickens, and swine, some slight increase in soil concentrations may take place; if this occurs, runoff water might increase the selenium content of lakes and streams to a small degree. METABOLI SM The absorption, distribution, biotransformation, and excretion of seleni- um in microorganisms, plants, animals, and humans have recently been reviewed in detail (NAS, 19761. She present discussion is focused on selenium metabolism in animals and humans. Absorption Both inorganic and organic forms of selenium can be readily absorbed from the gastrointestinal tract. Although little is known about the uptake of ingested selenates, selenites are passively absorbed from mammalian intestine (McConnell and Cho, 1965; Brown et al., 19724. Selenite is absorbed more rapidly by monogastric animals than in ruminant animals, perhaps owing to bacterial reduction of selenite to elemental selenium or other insoluble forms in the ruminant gastrointestinal tract Upright and Bell, 19664. Selenocystine is passively absorbed from the intestine, but in the hamster selenomethionine can be absorbed against a concentration gradient; the active absorption of selenomethionine is inhibited by low concentrations of S-methionine (Spencer and Blau, 1962; McConnell and Cho, 1965~. Absorption of sodium selenite through rat skin has been reported (Dutkiewicz et al., 1971~. Distribution In the dog, as selenate is absorbed it binds to plasma albumin, gradually shifts to globulins, and finally becomes associated with red cells (McConnell, 1941; McConnell et al., 1960~. The uptake of selenium by red cells varies inversely with dietary concentration (Wright and Bell, 1963), and this relationship has been proposed for several groups of animals and humans (Weswig et al., 1966; Burk et al., 1967; Lopex et al. 1968). Selenite and selenate, after single subacute administration to rats (McConnell, 1941) and mice (Heinrich and Kelsey, 1955) are distributed largely to the liver, kidneys, muscle mass, gastrointestinal tract, and
Inorganic Solutes 351 blood. In rats, selenite distribution to the liver appears to be unaffected by the concentration of selenium in the maintenance diet (0.(~5.04 ppm), but a greater percentage of administered selenite goes to the kidney' blood, and muscles in rats on low-selenium diets, compared with animals maintained at higher selenium concentrations (Hopkins et al., 1966~. With chronic administration, selenium is also distributed to the testes (Broyer et al., 1966; Burk et al., 19721. Selenite distribution within the liver cell has been determined. More than half is in the cytosol and, depending on dose and diet, the rest is variably distributed in other fractions; injected selenite is found more in the mitochondria than in microsomes or nuclei (McConnell and Roth, 1962), whereas, in rats fed a selenium-deficient diet, nuclei and micro- somes have about equal amounts of selenium and much more than mitochrondria (Brown and Burk, 19731. Selenium in the liver turns over rapidly. Selenoamino acids and inorganic selenium are distributed similarly, except that selenomethionine and selenocystine accumulate in the pancreas to a greater extent than selenite (Jacobsson, 19664. When mice are fed alfalfa grown on selenium-75 selenious acid, the radiolabel is found more in kidneys than in liver or pancreas and to a much lesser extent in lungs, heart, spleen, skin, and brain (Jones and Godwin, 1962, 1963~. Studies on selenium distribution in pregnant ewes have demonstrated a placental barrier. The maternal fetal plasma ratio of selenium concentra- tions sheep was 12:1 for a single fetus and 22:1 in the case of double fetuses (Wright and Bell, 1964~. Selenium transfer across the placenta was slow but continuous. In many instances, the distribution of selenium to tissues and cells depends on the animal's nutritional status regarding selenium; the time after administration is also important, in that selenium distributions shift with time (Wright, 1967~. Excretion The principal route of excretion of selenium is via the urine. Approxi- mately 40% of the selenate administered to rats is excreted in the urine in the first 24 h, and the rate of excretion is much lower after that (McConnell, 1941~. The dietary concentration of selenium has a pronounced effect on excretion; rats maintained on low-selenium diets (0.004 ppm) excreted 6% of a dose of radioselenium in the urine in 10 days, and animals on high-selenium diets (I ppm) excreted 67% of an equal dose of radioselenium in the same time (Burk et al., 1972~. Whether
352 DRINKING WATER AND H"LTH this represents an ability to conserve selenium when intake is low or an increased ability to excrete selenium when intake is high is not clear. Fecal excretion of selenium by rats is small in most situations other than poisoning (Burk et al., 1972~. In swine, fecal excretion of selenium was about 5 times greater when sodium selenite was administered orally than when it was administered intravenously, although the total excretion was the same, regardless of route of administration (Wright and Bell, 1966~. Fecal excretion of selenium by sheep was approximately the same as in swine after intravenous injection of sodium selenite, but increased 13-fold after oral administration. Swine absorb selenium better than sheep, and the greater fecal excretion by sheep may be due to bacterial reduction of selenite to insoluble elemental selenium. Pulmonary excretion of selenium is important only in subacute poisoning and depends on the dietary concentrations of protein, methionine, and selenium (Olson et al., 19631. Storage Selenium binds to cystine-rich keratin and consequently is found in hair and nails (McConnell and Kreamer, 19601. When wool is chemically reduced and treated with selenium dioxide, the selenium forms a selenodithio bridge between two cysteine units (R S Se-S R) (Holker and Speakman, 1958~. Radioselenium injected into dogs was retained in hair for as long as 316 days (McConnell and Kreamer, 1960~. The effect of diet on the long- term rate of loss of selenium has been studied in rats; increasing the dietary selenium content decreases selenium retention (Burk et al., 1972, 1973~. Cattle, sheep, and swine fed inorganic selenium for several weeks take 1~20 weeks to return to baseline tissue selenium concentrations when put on depletion diets; if the animals are fed organic forms of selenium, it takes even longer for tissue concentrations to return to baseline (Kuttler et al., 1961; Hidiroglou et al., 1971; Ku et al., 19721. Biotransformation Little is known about the biochemistry of selenium in mammalian systems. At concentrations required nutritionally, selenium is incorporat- ed into specific functional proteins; at higher concentrations, it is incorporated into molecules normally served by sulfur. Selenium analogs are often less stable than sulfur compounds, and this lability may be the basis of toxicity. Selenium biochemistry has been the subject of recent reviews (Stadtman, 1974; NAS, 19761.
Inorganic Solutes 353 By the mechanism used for sulfate ion, microorganisms are capable of activating selenate with adenosine triphosphate (Wilson and Bandurski, 1956), but it is not clear that appreciable amounts of activated selenate (APSe) are reduced to selenite via 3'-phosphoadenosine-5'-phosphoselen- ate (PAPSe), which would be directly analogous to the recognized reduction of activated sulfate (APS) to sulfite by phosphoadenosine phosphosulfate (PAPS). In animals, PAPS is important in the formation of sulfate esters in the detoxication of foreign compounds and the metabolism of steroids and other indigenous compounds (Lipmann, 1958~; the activity of PAPSe, if formed, in formation of selenate esters is not known. Although selenate and selenite ions are absorbed and incorporated into organic molecules as selenide, it is not fully known how the reduction of selenium is accomplished (Stadtman, 1974~. Selenite is methylated by mammalian tissues in an apparent detoxica- tion process. Mouse liver and kidneys use S-adenosylmethionine and reduced glutathione to form dimethylselenide from selenite (Ganther, 1966~; the lungs are also active in the methylation, but muscle, spleen, and heart have little activity. Dimethylselenide is less toxic than sodium selenite (McConnell and Portman, 1952a). Sodium selenate is also reduced and converted to dimethylselenide in rats (McConnell and Portman, 1952b). Selenite and selenate are metabolized to trimethylselenonium ion, (CH3~3Se+, which is the principal excretory product of seleniun~ in urine (3(}50~370 of the urinary selenium) (Byard, 1968; Palmer et al., 1969, 1974~. Again, trimethylselenonium ion is less toxic than selenite or selenate ion (Obermeyer et al., 1971~. Although these methylated products are less toxic than the parent selenium compounds, they are involved by unknown mechanisms in synergistic toxicity; dimethylselenide and mercury toxicities are synergistic (Parizek et al., 1971), as are those of trimethylselenonium ion and arsenic (Obermeyer et al. (1971~. In mammalian systems, inorganic selenium usually is not incorporated into amino acids (Cummins and Martin, 1967y, although there is some evidence of the incorporation of selenium from sodium selenite into a rabbit protein (Godwin and Fuss, 1972~. The matter is confusing, because inorganic selenium can be reduced to complex with disulfides to give selenodisulfides (R S Se S R), as is the case with two molecules of cysteine (Painter, 1941; Ganther, 1968) or reduced glutathione (Ganther, 1971~. Selenium appears to serve as an essential element in some oxidation- reduction processes in mammals. Sheep skeletal muscles contain a small (mol. wt., 10,000) selenoprotein that has a heme group. Although the .
354 DRINKING WATER AND H"LTH selenium appears to be an integral part of the protein, its position and function in the protein are not known (Pedersen et al., 1973~. A second selenoprotein is known: glutathione peroxidase, an enzyme, catalyzes the reduction of hydrogen peroxide. The activity of glutathione peroxidase in red cells of selenium-deficient animals is low, but may be restored specifically by selenium administration (Roturck et al., 19731. The enzyme has a molecular weight of 84,000 and is composed of four subunits of molecular weight 21,000 each; each subunit contains one atom of selenium (Flohe et al., 1973~. HEALTH EFFECTS Although the essentiality of selenium as a nutrient for domestic and laboratory animals was established only fairly recently, its toxicity in animals has been known for more than a century. As a toxic element, selenium may produce a variety of clinical and toxicological syndromes, depending on the animal species, the dose, and the duration of exposure. Toxic Effects in Humans Reviews of selenium toxicity in humans include papers by Cooper (1967), Cerwenka and Cooper (1961), and Amor and Pringle (1945) and a monograph by the NRC Subcommittee on Selenium (NAS,1976~. Elemental selenium is relatively nontoxic, but some compounds such as soluble salts of selenium dioxide, selenium trioxide, and some halogen compounds are toxic in humans with hydrogen selenide, one of the most toxic and irritating selenium compounds. The toxic vapors and soluble salts are readily absorbed by the tissues of the lungs and alimentary canal and perhaps by the skin. Exposure of humans to selenium in most industrial situations is through the skin and lungs by exposure to dust or fumes. Selenium fumes in sufficient concentration can produce an acute respiratory distress syndrome in exposed humans. Most acute exposures to selenium and its compounds result in such symptoms as irritation of eyes and mucous membranes, sneezing, coughing, dizziness, dyspnea, dermatitis, headach- es, pulmonary edema, nausea and garlic breath odor. Prolonged exposure can result in death (Clinton, 1947; Glover, 1954, 1970; Middleton, 1947; Dudley, 1938; Buchan, 1947; Dudley and Miller, 1941; Carter, 19661. Chronic exposure of humans to selenium by ingestion or via the lungs (by inhalation of dusts and fumes) produced a set of signs and symptoms that included depression, nervousness, occasional dermatitis, gastrointes- tinal disturbance, giddiness, and garlic odor of the breath and sweat
Inorganic Solutes 355 (Cooper, 1967; Lemley and Merryman, 19411. Arnor and Pringle (1945) and Glover (1970) considered the presence of a garlic breath odor to be the earliest and most characteristic sign of selenium absorption. How- ever, the garlic odor is not specific for selenium, inasmuch as it is observed after absorption of tellurium. Garlic odor after selenium absorption is apparently due to formation of dimethyl selenium (Grover, 1970; Carter, 19661. Motley et al. (1937) suggested that the elimination of dimethyl selenium in the breath may give rise to sore throats and pneumonitis. Selenium has been implicated as having an influence on the incidence of dental caries. Epidemiologic studies of children indicated that the small amounts of selenium present in foodstuffs in some regions were significant in increasing the incidence of dental caries if consumed during the period of the development of the teeth (Hadjimarkos and Bonhorst, 1958; Tank and Storvick, 19601. Studies in rats indicate a cariogenic role for selenium: Buttner (1963) reported that the addition of selenium at 2.3 and 4.6 ppm as sodium selenite to the drinking water of pregnant rats and to their offspring increased the incidence of caries in proportion to the amount of selenium present and also reduced the number of young born. Nagai (1959) described signs of poisoning in Japan among workers in the manufacture of selenium rectifiers. Long employment was followed by hypochromic anemia and leukopenia. Female workers had irregular menses or menostasis. Smith and Westfall (1937), in a detailed study of correlate symptoma- tology with selenium excretion and selenium intake in the diet in humans in a highly seleniferous area, found that the most frequent symptoms were gastrointestinal disturbances, bad teeth, icteroid discoloration of the skin, and sallow and pallid skin color in younger people. None of the symptoms were regarded as specific effects of selenium intake, and it was not certain that any resulted directly from continual ingestion of selenium. Therapeutic Uses Selenium sulfide combined with bentonite and mixed with detergent is marketed under the trade name Selsun as a shampoo. The combination of selenium sulfide and detergent has been used in the treatment of seborrheic dermatitis and of tinea versicolor. The literature dealing with the therapeutic effects of selenium in seborrheic dermatitis was reviewed by Matson (1956~. Cohen (1954) and Fritz (1955) reported that the selenium sulfide suspension was elective in the treatment of granulated eyelids (blepharitis marginalis). Eisenberg (1955) and Grover (1956) .
356 DRINKING WATER AND H"LTH reported unfavorable reactions such as 1GSS of hair and local skin irritation after the use of Selsun as a therapeutic agent. Albright and Hitch ~ 1966), Giordano ~ 1963), Levan ~ 1957), and Robinson and Yankee (1957) used selenium sulfide in the treatment of tinea versicolor. How useful the treatment with selenium has been has not been established by adequate followup studies. Ransone et al. (1961) described a case of systemic selenium toxicity in a woman with open scalp lesions who had used the shampoo two or three times a week for 8 months. Diagnostic Uses Blau and Manshe (1961) found by the use of [75Seiselenomethionine in dogs that the compound had sufficient specificity for localization in the pancreas that it could be used for visualization of the pancreas by isotope scanning methods. There are no known precautions or contraindications to the use of [75Seiselenomethionine for scanning of human pancreas as the total selenium required is approximately 50 leg (Rosenfeld and Beath, 1964~. Herrera et al. (1965) reported that [75Seiselenonmethionine given intravenously for scanning of the pancreas was incorporated sufficiently into cells of lymphomas to allow detection of these tumors. Potchen (1963), DiGiulio and Beirwaltes (1964), and Haynie et al. (1964) have reported that the localization of [75Seiselenomethionine was sufficiently higher in the parathyroid gland than in the thyroid gland and other surrounding tissues to make it usable for localization of parathyroid gland adenoma. Garrow and Douglas (1968) suggested the use of [75Seiseleno- methionine for the measurement of placental competence. Douglas (1969) assessed the possible dangers and found that the test cannot be considered dangerous, because the radiation dose is too low to be considered harmful to a fetus. Lee and Garrow (1970) found no adverse reactions after its use in 467 patients. Toxic Effects on Animals Domestic Animals Selenium toxicity in domestic animals has been the subject of several reviews (Anderson et al., 1961; Harr and Muth, 1972; Rosenfeld and Beath, 1964; Muth and Binns, 1964~. Toxicity syndromes may be acute or chronic. The acute form results from the ingestion or injection of large quantities of selenium. Chronic selenosis is due to consumption of small amounts of selenium compounds over weeks or months. In some studies in domestic animals with inorganic forms of
Inorganic Solutes 357 selenium, chronic administration eventually resulted in an acute syn- drome followed within a short period by death. Shortridge et al. (1971) described an accidental occurrence of acute selenium poisoning in calves. The animals were to receive prophylactic subcutaneous injections of a sodium selenite solution; owing to an error in the preparation of the solution, they received 100 mg of selenium (approximately 0.5 mg/kg of body weight) instead of the intended 12 ma. The calves were depressed and salivating and had respiratory distress within 2 h of injection. Within 5 weeks, 67% had died. Dyspnea was the most noticeable clinical sign in the calves that died. A few reports detail the acute toxic signs and lesions in sheep caused by selenium poisoning, including papers by Caravaggi et al. (1970), Gabbedy and Dickson (1969), Morrow (1968), and Lambourne and Mason (1969~. In the accidental poisoning cases described by Morrow (1968), young lambs were given 10 mg of sodium selenite orally. Seven died within 10- 16 h; eight others developed diarrhea, but recovered; and five were unaffected. Herigstad et al. (1973) studied the toxicosis produced by sodium selenite (inorganic) and selenomethionine (organic) in young swine. Concentration in the ration varied from 0.1 to 600 ppm. At higher doses, survival varied from 1 to 10 days. A dose of 3 mg of selenium produced fatal selenium toxicosis within 2.5-14 h. Imboratory Animals Franke and Potter (1936) found that the minimal fatal dose (the smallest dose that killed 75% or more of the animals in 48 h) of selenium as sodium selenite injected intraperitoneally was 7.3 mg/kg of body weight. Smith et al. (1937) reported the intravenous LD50 of selenium as both selenite and selenate to be 3 mg/kg of body weight. Hopkins et al. (1966) reported poor growth in weanling rats fed various semipurified diets containing selenium at 5 ppm as selenite for 2 weeks when the ration was composed of natural feedstu~s. Halverson et al. (1966) fed selenium as sodium selenite and as seleniferous wheat to young rats at concentrations of 1.6, 3.2, 4.8. 6.4, 8.0, 9.6, and 11.2 ppm in a wheat diet. Growth depression occurred when the diet contained 6.4 ppm selenium or more. Mortality occurred after the fourth week of feeding at selenium concentrations of 8 ppm or more. A concentration of 8 ppm resulted in enlargement of the pancreas, reduction of hemoglobin content, and increased serum bilirubin. Palmer and Olson (1974) administered several concentrations of sodium selenite or sodium selenate in the drinking water to weanling rats. Selenium at concentrations of 2 or 3 ppm produced only a small reduction in weight gain and no mortality. Rats given water containing
358 DRINKING WATER AND H"LTH either form of selenium at 6 or 9 ppm had increased mortality. Smith et al. ( 1937) found that the toxicity of the selenite and selenate ions was similar when given intravenously and intraperitoneal. Franke and Moxon (1936) reported that rats fed seleniferous grains reduced their feed intake, lost weight or gained weight slowly, developed a hunched back, and had yellow staining of fur about the genitals. Necropsy findings included general visceral congestion, anemia, and cirrhosis of the liver. Morss and Olcott (1967) administered selenium to rats orally at 1~15 mg/kg of body weight. The rats lost weight, and many developed diarrhea and had bleeding from the nose, lacrimation, and depression. The LD50 was approximately 12.5 mg/kg. Halverson et al. (1970) reported that the anemia produced in rats by feeding of sodium selenite at 5-15 ppm was due to hemolysis. The synthesis of new red cells appeared unaffected. Campo and Bieln (1971) found histologic changes of the epiphyseal plate in rats given selenium at 4 88 mg/kg of body weight intraperitone- ally as sodium selenate for 13 days. Changes included blurring of the cellular and lacunar outlines, decrease in basophilia, disruption of cell columnation, and increase in widths of zones of proliferating and maturing chondrocytes. McConnell and Portman (1952a) found that dimethyl selenide had a low degree of toxicity in mice; LD50 was 1.3 g/kg by intraperitoneal injection. A state of hyperpnea lasted for 2-3 h, and the breath had a garlic odor. Convulsions were followed by death within a few hours of administration in most mice, but a few lived for 36 h. Mautner and Jaffee (1958) reported that the LD50 of 6-selenopurine by intraperitoneal injection was 160 + 37 mg/kg of body weight. Hadjimarkos (1970) gave male hamsters selenium as sodium selenite in their drinking water at 6, 9, and 12 ppm. Signs of toxicity were not observed at 6 ppm, but concentrations of 9 and 12 ppm caused a reduction in weight gain. These groups also consumed less water 45% less than controls. Smith et al. (1937) studied selenium toxicity in cats and reported that the minimal lethal dose of selenium as sodium selenate or selenite was about 1.5-3.0 mg/kg of body weight, regardless of the route of administration; subcutaneous, intraperitoneal, and intravenous routes were investigated. Rhian and Moxon (1943) compared the toxic e~ects of seleniferous grain and inorganic selenium as sodium selenite in dogs. Manifestations of selenium intoxication were similar to those in other laboratory animals. Signs appeared when the diet contained selenium at 7.2 ppm as
Inorganic Solutes 359 seleniferous grain and at 10 ppm as selenite. A selenium concentration of 20 ppm caused anorexia and death within a short time. Schroeder and Mitchener (1971a) administered selenate and selenite to rats in the drinking water at 2 ppm for a year and then at ~ ppm for another year. Selenate at these intakes was not toxic, with respect to growth, survival, and longevity. Rosenfeld and Beath (1947), Smith et al. (1937), and Smith (1941) described the signs and lesions in rats undergoing chronic selenium poisoning: marked loss of body weight to cachexia, often accompanied by ascites and hydrothorax; hunched backs; coarse, disheveled pelage; and anemia. Schroeder and Mitchener (1972) gave selenium as sodium selenite and sodium selenate to mice in the drinking water at 3 ppm for life. The two forms of selenium did not produce signs of toxicity with respect to growth, survival, or longevity in males; longevity in females was decreased. The incidence of spontaneous tumors was not affected. Schroeder and Mitchener ( 1971b) reported that selenate fed to pregnant mice in successive generations was very toxic at doses tolerated in weanling and nonpregnant adult mice. The results were death, failure to breed, and production of stunted mice. Animal experiments indicate that the young are more susceptible than adults of the same species. Franke and Potter (1936) reported that the tolerance of rats to seleniferous diets increases markedly between the ages of 21 and 42 days. Carcinogenicity Nelson et al. (1943) reported the induction of cirrhosis and tumors in the livers of male Osborne-Mendel rats fed either seleniferous grain or a solution of ammonium potassium sulfide and ammonium potassium selenide. The protein concentration of the diets was 12% and selenium concentrations were 5, 7, and 10 ppm. Of 53 rats surviving for 18 months, 11 developed tumors in cirrhotic livers and the other 42 contained focal hyperplasias. No metastatic growths were observed, and no tumors occurred in livers of rats not surviving for 18 months. The hepatic tumors were composed of regular or irregular cords of large hepatocytes without prominent cellular atypism. Tscherkes and co-workers (1963) fed male rats a 12% protein diet containing selenium at 0.43 mg/100 g of diet. Of 23 rats surviving for 18 months, 10 had tumors: 3 had malignant hepatic tumors, and 2 of these had lung metastases; 4 had sarcomas; and 3 had hepatic adenomas. Three of 40 rats fed selenium at 0.86 ma/ 100 g of diet had sarcomas in the mediastinal and retroperitoneal Iymph nodes. In a later study by Volgarev and Tscherkes (1967), the incidence of tumors designated "carcinoma" was reduced when protein in the diet was increased from 12
360 DRINKING WATER AND H"LTH to 30%. The tumor incidence was 8.5% in 200 rats. The incidence of tumors was 35% in rats fed a diet with selenium at 0.43 mg/100 g and 12% casein; 8.5% in rats fed selenium at 0.86 mg/100 g and 30~o casein; and 0% in a group fed selenium at 0.43 mg/100 g, 12% casein, and dietary additives. Harr et al. (1967) fed female Wistar rats commercial and semipurified diets containing selenium at several concentrations, including 2 ppm with 12% casein; 2, 6 and 8 ppm with 22% casein; and 4, 6, and 8 ppm with methionine and 12% casein. The hepatic lesions were designated acute and chronic hepatitis and focal hyperplasia with marked cellular atypism. None of the rats had hepatic cirrhosis. Hyperplasias were most numerous in rats fed a control diet for 5~250 days after an 84-day period of selenium feeding and rats fed selenium and control diets in alternate weeks. Fewer toxic and hyperplastic lesions were found in rats fed selenium-supplemented commercial diets than in rats fed the purified diets with added selenium. They concluded that selenium as selenite and selenate was not carcinogenic in the rat. Schroeder and Mitchener (1971a) reported tumorincidencesof38%in older male rats fed selenite at 3 ppm and 75% in older female rats. Of the tumors, 14% of those in the males and 52% of those in the females were considered malignant. The rate of metastastic lesions was high. In a later study by Schroeder and Mitchener (1972), in which rats were given selenium at 2 ppm as sodium selenite and sodium selenate for a year and then changed to selenium at 3 ppm, the incidence of tumors in the selenate group was 62.5% (control, 3 l`Yo) and the incidence of malignant tumors was 42% (control, 17~o). The "positive" studies do not establish selenium as a carcinogen in that there were several deficiencies in the experimental design and the interpretation of the lesions: It is possible and probable that some of the "low-grade carcinomas" described by Nelson and colleagues (1943) were degenerative lesions in the cirrhotic livers, rather than tumors. 2. It seems likely that acetaminophenyl selenium dehydroxide has an inherent goitrogenic activity apart from its selenium content, and there are no other reports that selenium is tumorigenic for the thyroid. 3. The low incidence of "spontaneous" tumors occurring in rats not receiving selenium and variations observed by several investigators can be due in part to age, sex, strain, diet, and contamination of diets with other carcinogens. 4. The reports of Schroeder and Mitchener (1971a) have not been confirmed or sufficiently documented.
Inorganic Solutes 361 5. Epidemiologic and demographic studies do not suggest that selenium is carcinogenic. Some regions of the world, including the north central and Rocky Mountain regions of the United States, are geological- ly rich in selenium. The incidence of cancer in humans is lower in these regions than in nonseleniferous regions (Shamberger, 19701. 6. Selenium is not carcinogenic in the mouse (Schroeder and Mitchen- er, 1972~. Mutagenicity No reports of mutagenicity by selenium compounds were found. Teratogenicity The chick embryo is extremely sensitive to low concentrations of selenium. Concentrations in feeds too low to produce signs of poisoning in adult poultry and other farm animals have reduced hatchability and produced deformities in chicks. Poor hatchability of eggs due to deformities in the chicks was found by Franke and Tully (1935) to occur in areas where toxic feedstu~s were produced. Holmberg and Ferm (1969) found that selenium as sodium selenite at 2 mg/kg of body weight was not teratogenic in hamsters when injected intravenously on the eighth day of pregnancy. Reproduction Franke and Potter (1936) fed seleniferous-wheat diets to rats at ages of 21-186 days. Rats that survived the toxic diets for relatively long periods had subnormal growth and reduced reproductive capacity. Matings between animals that were fed the selenium diets were infertile. Matings in which one animal was fed the normal diet and the other a toxic diet were sometimes fertile, but poisoned females were unable to raise their young. Rosenfeld and Beath (1954) provided Pregnant rats with water containing selenium at 1.5, 2.5, and 7.5 ppm as ~ ~ ~ , - . . potassium selenate. Normal litters were obtained trom females given the seleniferous water at 1.5 and 2.5 ppm. The second generation of selenium-dosed rats had normal litters, but the number of weaned pups was decreased by about 50%. In the group of females given the water with selenium at 7.5 ppm, fertility was reduced, the number of survivors was decreased, and growth of the young was reduced. When water containing 7.5 ppm selenium was provided on days 5-8 before parturition, the rats had normal litters, but the number of pups weaned was reduced with the continued intake of selenium. By mating of normal with selenium- exposed animals, it was determined that failure of reproduction in the rats was due to the eject of selenium on the female. Schroeder and Mitchener (1971b) gave mice selenium in the drinking water from
362 DRINKING WATER AND H"LTH weaning through several generations. Normal litters were produced until the third generation, which contained fewer and smaller litters with runts. Failure to breed and excessive deaths before weaning were also observed. Interactions Interrelationships of selenium toxicity with arsenic, mercury, cadmium, silver, and thallium have been described (Diplock, 19761. Moxon (1938) established that acute and chronic toxicity produced by feeding of seleniferous grains containing selenium at 15 ppm could be alleviated or prevented by administration of arsenic at 5 ppm as sodium arsenate in the drinking water. Ganther and Baumann (1962) used subacute dosages of arsenic and selenium and found that excretion of selenium into the gastrointestinal tract was stimulated by arsenic. Levander and Baumann (1966) demonstrated that bile was the route of excretion for selenium in arsenic-treated animals. A tenfold increase in the amount of selenium excreted into the bile of rats prepared with acute bilia~y fistulas was found. Levander (1972) suggested that arsenic protection against selenium toxicity may be mediated by combination of arsenic with selenium in the liver through reaction to selenol compounds to form a detoxication conjugate readily passed into the bile. Levander and Argrett (1969) described the eject of mercuric salts on the metabolism of selenium. Mercury increased the retention of selenium in the blood, kidneys, and spleen. Parizek et al. (1974) reported that selenium compounds protected against the toxicity of mercury. The renal and intestinal lesions produced by mercuric chloride at 20 ,umol/kg of body weight were abolished by the same dose of selenium as sodium selenite when given 1 h after mercuric chloride. Rats given lethal doses of mercuric chloride with selenium survived, and there were few gross lesions. The excretion of mercury was decreased by selenium. Parizek et al. (1971) found that the transport of mercury across the placenta in pregnant rats was decreased by selenium, and less mercury was secreted into the milk. The bioavailability of selenium was much lower in the rats treated with mercury. Ganther et al. (1972) reported that survival of Japanese quail given mercury at 20 ppm as methylmercury in diets containing 17% tuna was considerably longer than survival of quail exposed to the same concentration of methylmercury in a corn-soya diet. A striking correlation was found between the concentrations of selenium and mercury in the batches of tuna; batches that had little selenium contained low concentrations of mercury, and, when the concentration of mercury was high, the selenium concentration was also high (seleni- um:mercu~y, 2.91:2.97 ppm). The selenium in the tuna lowered the
Inorganic Solutes 363 toxicity in the quail of the methylmercury added at 20 ppm. In an experiment with rats fed a basal diet containing 20% casein with and without the addition of selenium at 0.5 ppm as sodium selenite, it was found that mercury at 10 ppm as methylmercury produced 100% mortality after 6 weeks of feeding, but selenium was completely effective in preventing mortality. Parizek and Zahor (1956) reported that the administration of cadmium at subtonic concentrations by subcutaneous-injection-produced necrosis of the testes of rats. Kar e! al. (1960) found that the cadmium-induced lesions in the testes could be prevented by the administration of selenium. Mason and Young (1967) reported that the testicular injury produced by single subcutaneous injections of 0.45 mg of cadmium chloride in rats was protected against by half-equimolar selenium dioxide injected at the same time as cadmium. Protection was also provided by daily subcutane- ous injections of half-equimolar selenium dioxide given over 6 successive days before cadmium. Parizek et al. (1968) and Gunn et al. (1968) found that mortality of rats given lethal doses of cadmium was much reduced by administration of selenium. Holmberg and Ferm (1969) found that the teratogenicity of cadmium was considerably reduced by selenium. Kar et al. ( 1959) and Parizek et al. ( 1968) found that cadmium would selectively damage the nonovulating ovary in the rat and that this damage was prevented by administration of selenium. Parizek et al. (1968) and Parizek (1964) found that cadmium produced necrosis and destruction of the placenta and that these changes could be prevented by the administration of selenium. Similarly, the "toxemia of pregnancy" induced by cadmium could be prevented by selenium (Parizek, 1965~. Diplock et al. (1967) and Grasso et al. (1969) reported that 0.15% dietary silver acetate produced toxicity in rats and chicks deficient in vitamin E. When the diets were adequate in vitamin E and selenium, the silver was not toxic. The removal of the vitamin E resulted in 100% mortality within 49~4 days. The addition of selenium to the diet at 1.0 ppm produced a protection of 55% against toxic elects of silver. Grasso et al. (1969) studied the lesions produced in the liver by silver and the lesions caused by dietary deprivation of vitamin E and selenium. The lesions were similar. Hollo and Zlatarov (1960) reported that mortality induced by thallium poisoning could be prevented by the parenteral administration of selenate. Rusiecki and Brzezinski (1966) found that oral administration of selenate prevented the toxicity of thallium and that the content of thallium in liver, kidneys, and bones was increased by the selenate. Levander and Argrett (1969) observed that the subcutaneous injection of
364 DRINKING WATER AND H"LTH thallium acetate increased the retention of selenium in the liver and kidneys and decreased the pulmonary and urinary excretion of selenium. Levander and Morris (1970) used a peanut-meal diet and found that neither methionine nor vitamin E alone gave much protection against hepatic damage produced by excessive selenium. Combinations of methionine and vitamin E were effective, and the degree of protection was approximately proportional to the concentration of vitamin E added to the diet. Selenium concentrations of the liver and kidneys from rats fed the diets supplemented with methionine and vitamin E were less than those of the same organs from rats fed either methionine or vitamin E alone or no supplement. The results were compatible with the hypothesis that methionine detoxifies selenium by forming methylated derivatives of the element that are eliminated via the breath and the urine. Vitamin E and some fat-soluble antioxidants increase the availability of the methyl group of methionine for this process. Moxon and DuBois (1939) reported that the combined administration of fluoride and selenium to rats increased the toxicity of selenium. They added fluoride at 5 ppm to the drinking water of young rats fed a diet containing selenium at 11 ppm as seleniferous wheat. Mortality was increased, and weight gains were decreased, as were feed intake and water intake. Hadjimarkos (1969) gave rats selenium at 3 ppm as sodium selenite and fluoride at 50 ppm as sodium fluoride. A second group received water with selenium at 3 ppm. The growth and mortality data indicated that the combined administration of selenium and fluoride did not increase the severity of signs of selenium toxicity. Beneficial Effects Diplock (1976) recently reviewed the multitude of studies concerned with the nutritional roles of selenium in laboratory and domestic animals and poultry. Selenium, the factor 3 of baker's yeast, was elective in preventing hepatic necrosis in rats; exudative diathesis in chicks and turkey poults; skeletal muscle degeneration and necrosis in poultry, domestic animals (such as lambs, calves, and swine), and laboratory rodents; hepatitis dietetica in swine, and cardiac myopathy in turkeys, swine, sheep, and cattle. Other selenium-deficiency diseases include reduced fertility, embryonic mortality, and unthriftiness in sheep and smooth muscle (gizzard) myopathy in turkey poults. Degeneration and necrosis of pancreatic acinar epithelium followed by fibrosis have been produced in chicks by selenium deficiency in the presence of adequate polyunsaturated fatty acids and vitamin E (Thompson and Scott, 1962~.
Inorganic Solutes 365 Several reports have indicated that selenium has antitumor activity in some animal model systems, and these were reviewed by Shapiro (1972~. Clayton and Baumann (1949) reported that the incidence of hepatic tumors induced by feeding of dimethylaminoazobenzene was decreased by about half by a diet containing selenium at 5 ppm. Shamberger (1970) found that selenium as sodium selenide greatly reduced the number of tumors in mice when administered concomitantly with cioton oil to mouse skin treated with dimethylbenz~ajanthracene (DMBA). Shamber- ger (1970), in a study in which DMBA was applied to the shaved skin of ICR mice, found that sodium selenide (0.0005~O) applied after DMBA reduced the incidence of papillomas. Sodium selenide applied concomi- tantly with 0.01% methy~cholanthrene reduced the total numbers of papillomas and cancers, compared with controls. Dietary sodium selenite at 1 ppm markedly reduced the number of papillomas induced by the combination of DMBA-croton oil and by benzo~a~pyrene. \lautner and Jade (1958) used experimental mouse tumor systems and reported that equimolar amounts of 6-selenopurine and 6-mercaptopu- rine produced similar degrees of inhibition of the growth of L1210 leukemia cells. 6-Selenopurine was somewhat more toxic than 6-mercap- topurine at doses required to cause 50% (or greater) reduction in tumor size. Activity of 6-selenopurine against leukemia L5 1 78-Y and sarcoma S- 180 was less than that of 6-mercaptopurine, and the highest dose that caused a significant inhibition of tumor growth was markedly toxic. Mautner et al. (1963) found that intraperitoneal and subcutaneous injections of selenoguanine inhibited the growth of L5178-Y lymphoma in mice. Riley (1968) studied the relationship between subcutaneous mast cell populations and papilloma induction and found that topical selenium decreased the incidence of papilloma and prevented the accumulation of mast cells at the base of the tumors in mice treated with carcinogen. ANALYSIS In the last 20 yr, much-- effort has been given to development of quantitative methods of analysis for nanogram amounts of selenium in a variety of materials. Methods include titrimetry, colorimetry, fluorome- try, atomic absorption, polarograpy, and neutron activation. For samples containing large (microgram or milligram) amounts of selenium, titrime- try and colorimetry are usually satisfactory. Good microanalytic methods include fluorescence and atomic-absorption spectroscopy. Olson et al. (1973) and Watkinson (1967) have reviewed methods for determination of selenium.
366 DRINKING WATER AND H"LTH Water The current U.S. Public Health Service drinking water standard for selenium is 10 ~g/liter (as total selenium); according to the 1975 Chemical Analysis of Interstate Carrier Water Supply Systems published by the EPA (1975), this concentration is rarely exceeded. Methods with sensitivities better than 10 ppb (10 ~g/liter) are required for determinations in most drinking water. The atomic-absorption method of Fernandez (1973) offers a highly sensitive and simple method of detecting nanogram quantities of selenium (and arsenic). The selenium in the water sample is reduced to gaseous hydride with sodium borohydride (Naught. The hydride is carried into an argon-hydrogen-entrained air flame with argon carrier gas. An atomic-absorption spectrophotometer with an electrodeless discharge lamp can have an absolute detection limit of 15 ppb based on a 20-ml sample volume. With a hollow-cathode lamp, the solution detection limit is 0.25 ppb (pa/liter). With either lamp, the method offers a precision (coefficient of variation) of To. The method detects both inorganic and organic selenium, and drinking-water samples over few interfering compounds. Polarographic procedures have been developed for selenium, but do not have the sensitivity and specificity of atomic-absorption methods. Lambert et al. (1951) developed a calorimetric method for water analysis based on conversion of inorganic and organic selenium to selenious acid, which was then used to oxidize iodide quantitatively to elemental iodine; the iodine was determined calorimetrically. The method was subject to several interferences and could reliably detect selenium in water only at concentrations of 0.1 ppm (100 ~g/liter) or more. Greater sensitivity (by a factor of 10) is obtained with fluorometric methods of analysis. Selenium, as selenious acid, is complexed with 3,3- diaminobenzidine (Cousins, 1960) or 2,3-diaminonaphthalene (Parker and Harvey, 1961~. Watkinsin (1960) reported measuring less than 10 ng of selenium with a standard deviation of 0.5 ng, using 2,3-diaminona- phthalene fluorometric analysis. Iron and copper interfere with the analysis, and the technique is considerably more involved than the atomic-absorption method. Biological Samples The atomic-absorption method described above for drinking water can be applied to acid digests of biologic samples. Fluorescence methods are
Inorganic Solutes 367 also widely used. The Official Methods of Analysis of the Association cuff Official Analytical Chemists (Horwitz, 1970) lists a 2,3-diaminonaphthal- ene fluorometric method for plant specimens containing selenium at less than 4 ppm; the analysis takes several hours to complete. For plants containing larder concentrations calf selenium. the AOAC uses a colori metric method, precipitating the distilled selenium with hydroxylamine hydrochloride and measuring the selenium concentration against pre- pared standards with a color comparator. For seleniferous plants in which the selenium concentration exceeds I 00 ppm, a gravimetric method is listed by the AOAC. For food samples, the official AOAC final action method is an acid digestion in the presence of a mercuric oxide fixate. The selenium is distilled as the bromide and reduced to elemental selenium with sulfur dioxide, and its concentration is determined as selenious acid, H2SeO3, by titration with sodium thiosulfate and iodine. Neutron-activation analysis has been used successfully to measure selenium in biological samples. Irradiation of the sample with neutrons in a nuclear reactor produces many radioactive elements, including seleni- um. Three radionuclides of selenium are produced at sufficiently high specific activity to be useful for determinations in biologic samples. 1 he half-lives of these radionuclides are 120 days for selenium-75, 17.5 for selenium-77, and 18.6 min for selenium-81; the first two are gamma emitters and selenium-81 is a beta-emitter (Bowen and Cawse, 1963~. Isolation of a specific radionuclide can require much time and effort and is generally limited to waiting several weeks for the short-lived elements to decay, spectrometrically analyzing for gamma-emission peaks at 121 + 136 and 265 ~ 280 keV (Grant et al., 1961), distilling the selenium with hydrogen bromide or extracting into an organic solvent the selenium complex of diaminobenzidene or diaminonaphthalene (Betteridge, 19654. Such techniques are reported to detect as little as 10 ng of selenium per sample. Reliability Before 1960, most water samples were analyzed by calorimetric or titrimetric methods for selenium, and these methods are of low sensitivity by today's standards. In fact, the minimal detectable concentrations by these methods are higher than the drinking-water standard of 10 ~g/liter. Water analyses completed before 1960 are likely to contain false-negative results, that is, reporting no detectable selenium when, in fact, the drinking-water standard of 1962 may have been exceeded. Methods requiring prolonged air drying of the sample, especially at
368 DRINKING WATER AND H"LTH temperatures above 60°C, or requiring distillation are subject to loss of selenium which results in underestimation of the selenium content. Many compounds have the potential of interfering with selenium determina- tions; iron, copper, and arsenic seem to over the most problems in water analysis, but are well accounted for in the calorimetric method of Lambert et al. (1951) and its modifications. CONCLUSIONS AND RECOMMENDATIONS The determination of a "no-adverse-effect" concentration of selenium is complicated by numerous experimental variables. The toxic effect of selenium depends on the type of selenium compound administered, whether it is organic or inorganic, the valence state of the selenium ion, the species and sex of the laboratory animal used, the age of the animal, the conditions and duration of the test, and the diet whether natural or semipurified ingredients, the protein content, the caloric intake, the type of protein, and the presence and concentrations of other elements, such as arsenic, mercury, thallium, and fluorine. The criterion of toxicity used is also important in establishing a no-e~ect concentration and growth may be the best indicator of toxicity. Harr and Muth (1972) used a semipurified diet in rats and reported that the minimal toxic concentration for induction of hepatic lesions was 0.25 ppm. A concentration of 0.75 ppm was considered the minimal concentration, with respect to longevity and development of cardiac, renal, and splenic lesions. However, rats fed selenium at 0.5 ppm grew as well as control rats. Halverson et al. (1966), in a study of rats and wheat diets, found that selenium at 3.2 ppm as sodium selenite did not affect growth over the feeding period of 6 weeks. Thapar et al. (1969) reported that a dietary selenite concentration of 2 ppm had no detrimental eject on chickens fed over a life cycle. Although there is now general agreement that selenium is an essential element for man as it is for domestic animals, virtually nothing is known about the forms and quantities of selenium consumed by man, in part because of inadequate methodology for collecting material and for accurate analysis. This must be corrected before the environment (water, air, food) can be satisfactori- ly monitored. Metabolism and kinetics of the various forms of selenium require intense research efforts. Molecular transformations must be determined in mammalian systems and the interactions between selenium and other environmental materials, particularly mercury, cadmium, and arsenic. Little information is available as to ejects of long-term exposure to relatively low levels of selenium. Although selenium is toxic to man and
Inorganic Solutes 369 animals in high doses, these are usually a result of accidental exposure. Rather than concern for toxicity the literature indicates that there is a greater potential for a deficiency. Consideration should be given to raising current permitted levels in waters of the United States. The paucity of definitive data on selenium and human health requires a number of approaches toward elucidating the role of selenium in the mammalian system. The following recommendations are suggested: 1. There is a critical need for more rapid, accurate, and reproducible analytic methods that will permit both qualitative and quantitative assays. Information on chemical forms, oxidation states, and solubility in water is needed. This is probably the most limiting need for progress over a broad front in selenium research. 2. Systems for monitoring the environment (water, air, food) should be improved. 3. Basic research should be conducted to define molecular transforma- tions in the mammalian system. 4. Ejects of selenium on the toxicity of mercury, cadmium and arsenic should be studied. 5. Natural and industrial emission and cycling of selenium in the environment should be investigated. 6. The effects on animal systems of long-term low concentrations of selenium in combination with other trace elements in the environment should be determined. 7. Baseline data on selenium concentrations in humans in health and disease are needed. 8. The ejects of selenium deficiency and excess on induced and spontaneous animal tumors should be determined. Fluoride OCCURRENCE Fluorine is the most electronegative of all elements, existing naturally in the form of fluoride. It is the 17th most abundant element in the earth's crust, occurring principally as fluorite, CaF2, and fluoroapatite, Ca~O(PO~F~. It is present in small amounts in most soils except those that have been strongly leached. The concentration of fluoride in natural waters depends principally on the solubility of the fluoride-containing rocks with which the water is in contact. In 1969 the general Community Water Supply Survey of the Public Health Service sampled 969 water supplies and found fluoride ranging
370 DRINKING WATER AND H"LTH from less than 0.2 up to 4.40 mg/liter. Fifty-two systems had fluoride concentrations greater than the then-recommended limits for this constituent. A more extensive survey in the same year by the Dental Health Division of the Public Health Service (1970) showed that 8.1 million people in 2,630 communities in 44 states were consuming water with more than 0.7 mg/liter of naturally occurring fluoride. Nearly 1 million people in 524 communities were receiving water with more than 2 mg/liter of naturally occurring fluoride. Most of the communities with more than 0.7 mg/liter natural fluoride were in: Arizona, Colorado, Illinois, Iowa, New Mexico, Ohio, Oklaho- ma, South Dakota, and Texas. There were no reports of community water supplies with as much as 0.7 mg/liter fluoride from Delaware, Hawaii, Massachusetts, Pennsylvania, Tennessee, or Vermont. The WHO monograph, "Fluorides and Human Health" (1970, pp. 17- 59), notes that high concentrations of fluoride are found in areas of every continent and that dental fluorosis is a problem from Finland to South Africa and from England to Japan. Fluoride in Water Treatment Conventional procedures of water treatment, i.e., clarification, filtration, softening, and disinfection, have little or no eject on the fluoride concentration in water. However, it was noted in Ohio in the 1930's that if the pH was increased during softening operations to a value high enough to precipitate magnesium hydroxide, some removal of fluoride was accomplished (Scott et al., 1937~. In most full-scale plants the removal of fluoride was less than 50 percent. Two special processes have been used for fluoride removal, both based on the adsorption of fluoride on granular media, either activated alumina or bone char (Mater, 1963~. The water containing fluoride is passed through a bed of the medium until the effluent concentration exceeds an acceptable value. The medium is then regenerated with a solution of sodium hydroxide to remove adsorbed fluoride. Costs of this type of treatment are such that few communities have undertaken voluntarily to remove fluoride from their supplies. Addition of Fluoride to Water Supplies For more than 30 yr, the practice of adding fluoride to drinking water has been practiced in the United States for reduction of dental caries. The principal chemicals used for this purpose are sodium fluoride, sodium
Inorganic Solutes 371 silicofluoride, hydroflurosilicic acid, and ammonium silicofluoride (Mai- er, 1963~. These chemicals require care in handling and must be dispensed with properly designed chemical feeding systems, but these are readily available. The usual dosage has been in the range of 1 mg/liter. When any one of these chemicals is dispersed in water at the 1 mg/liter range, it dissociates almost completely. Other Sources of Fluoride Food Fluoride is present to some extent in nearly all foods, but the concentrations vary widely. Studies of the fluoride contents of foodstuffs reported in the WHO Monograph (1970) have been reviewed by Muhlar (1970~. Prival and Fisher (1973) have made a more recent compilation of these fluoride contents. Among the foodstuffs notably high in fluoride are fish, particularly those, such as sardines, that are eaten with the bones. Fish-meal flour, which is produced from the whole fish, is also high in fluoride. Tea is unusually rich in fluoride. Milk and most fruits are generally low in fluoride. Vegetables vary greatly in fluoride content. Hodge and Smith (1965) computed the total fluoride intake from food at 0.5-1.5 mg/day for areas with nonfluoridated water. Marier and Rose (1966) showed that use of fluoridated water in canneries increased the fluoride content of canned food by 0.5 mg/liter and converted this to 0.5 mg/day in the diet. The proposed total intake from the diet then became 1.~2.0 mg/day. However, the Hodge and Smith estimate came from Machle and Largent (1943), whose values were based erroneously on earlier work (Machle et al., 1942~. In this earlier work the average total fluoride intake per day for 20 weeks was just under 0.5 mg with only 0.16 mg of the intake from food as such. In a more recent review Hodge and Smith (1970) have lowered their estimate to 0.3~.8 mg fluoride daily from the diet. Recent studies indicate that the total intake of fluoride is as high as 3 mg/day rather than the earlier figure of 1.5 mg/day, primarily because of increases in the estimated levels of fluoride in foods (Spencer et al., 1970~. Balance data presented by Spencer also suggest a higher retention by bone, nearly 2 mg/day rather than the 0.2 mg/day indicated earlier. Two recent articles from Spencer's group (Kramer et al., 1974; Dace et al., 1974) appear to support a higher estimate for dietary fluoride intake. The first is based on hospital-prepared food from 16 U.S. cities. The fluoride intake from food in the fluoridated communities was found to range from 1.6-3.4 mg/day (av. 2.6) while that from nonfluoridated cities
372 DRINKING WATER AND H"LTH was 0.8-1.0 mg (av. 0.9~. The very high values and the marked difference between fluoridated and nonfluoridated cities can be explained in part by the inclusion of coffee and other water-based beverages as dietary intake. a classification not usually followed by other investigators. The second article reports average fluoride intake from diets used in balance studies in a fluoridated city over a 6-yr period as 2.0 mg/day. These findings are important because, if valid, they might represent a shift in intake that could lead to dental fluorosis in fluoridated communities. Also, a retention of 2 mg/day would mean that an average individual would experience skeletal fluorosis after 40 yr, based on an accumulation of 10,000 ppm fluoride in bone ash. However, these new estimates for fluoride in food are questionable; consequently, so are their implications. The values are suspect because of analytical problems. The diffusion method of Singer and Armstrong (1969a) was used with a calorimetric reagent and false high values are obtained with this technique (Taves, 19661. A study more limited in scope, because it was restricted to 16- to 19-yr old males, found 2.0 2.3 mg/day total fluoride intake (San Filippo and Battistone, -19714. The increase over earlier values may reflect the fact that the food portions were large for the test group. Data from balance studies in children tend to support the lower values. The dietary fluoride intake for nine children aged 4 to 18 years averaged 0.3 mg/day (Forbes et al., 1973~. The quickest and most reliable method of checking whether there has been a shift in total intake of fluoride in the past 2~30 yr is through surveys of the urinary and bone fluoride concentrations occurring in people in fluoridated communities. There has been no question about the analytical techniques used in these earlier data on urine and bone because the concentrations involved were relatively high. A recent (Parkins, 1974) bone survey in Iowa done at autopsies showed bone fluoride levels higher than those in earlier publications, particularly when taking into account that they are for unasked bone, which means that the concentrations need to be approximately doubled to compare them to values for ashed bone. Detailed comparison of the method he used has shown no systematic error, but other bone fluoride values found in Rochester, New York, show concentrations which match earlier values almost exactly (Charen et al., in preparation, 1976~. Private communication with Parkins has not clarified the discrepancy, but he has indicated that the usual fluoride concentration in the urine is about 50 ~M, which is the same as earlier reports as well as the values found in a few samples analyzed from Rochester residents. Obviously
Inorganic Solutes 373 additional work is desirable to clarify these questions, but earlier values for average fluoride intake and balance still appear to be valid. Industrial exposure Industrial exposure to fluoride-containing dusts and gases has been a serious problem in many parts of the world. A committee of the National Academy of Sciences on the Biological Effects of Atmospheric Pollutants (1971) reported on fluoride as an atmospheric pollutant both in the work place and in the ambient air. Operations that introduce fluoride dusts and gases into the atmosphere include: grinding, drying, and calcining of fluoride-containing minerals; acidulation of the minerals; smelting; electrochemical reduction of metals with fluoride fluxes or melts as in the aluminum and steel industry; kiln firing of brick and other clay products and the combustion of coal. Generally speaking, good progress has been made in reducing fluoride exposure to industrial workers by ventilation and emission control practices. Air A.r pollution by fluoride dusts and gases has done substantial damage to vegetation and to animals in the vicinity of industrial fluoride sources. However, the contribution of ambient air to human fluoride intake is only a few hundredths of a milligram per day (NAS, 1971), an amount that is insignificant in comparison with other sources of fluoride. METABOLISM Radiofluoride studies show metabolism of fluoride in the body to be simple. Hence, fluoride is unlikely to give rise to intolerance by reason of disease or genetics. Accumulation has been found to occur only in the kidneys and calcified tissues. The reabsorption of water without the reabsorption of fluoride in the kidneys explains the increased concentra- tion in the kidneys. The isomorphism of the fluoride ion for the hydroxyl ion in hydroxyapatite explains the increased concentration of fluoride in calcified tissues. Some of the fluoride ingested is retained in the calcified tissues; however, the rate of such retention decreases with age, so adults are nearly in balance (Hodge, 1961~. There has long been confusion about the relationship of serum fluoride concentration to intake, confusion that carries over to recent reviews. Some 24 yr ago, Smith, Gardner, and Hodge found a 2-3-fold increase in the average serum fluoride concentration of people living in a fluoridated community, compared to those in a nonfluoridated community (0.7 vs. 1.8 ,uM, or 0.014 vs. 0.036 ppm) (Smith et al., 1950; see Taves, 1966, for revised values). Such a relationship would be expected, if about 0.5 mg of fluoride
374 DRINKING WATER AND H"LTH per day were coming from food in the nonfluoridated community and 1.5 mg from food and water in the fluoridated area. This work was ignored by Singer and Armstrong (1960) when they developed what appeared to be improved analytic techniques. They found more fluoride in the serum (7.5 ~M, or 0.15 ppm), but found no differences related to intake, although concentrations in the drinking water varied from O to 2.5 ppm. No adequate explanation was offered as to how the urinary and bone concentrations could be directly related to the intake of fluoride, while serum concentrations remained constant. Threshold phenomena in both kidney and bone would have to be present to maintain a constant serum concentration, but there was no reason to think that a threshold existed in either case. The exchange and uptake into the bone compartments cause a buffering of the serum fluoride concentration, both short-term (days) and long-term (years). However, this does not explain why the average serum fluoride concentration would be the same in different communities. Even though buffering would tend to diminish the surges of serum fluoride due to ingestion, the mean value should be an integrated reflection of the average intake and bone fluoride stores. The explanation for the confusion is to be found in the presence of two forms of fluoride in human serum, one of which can be shown to exchange with added radioactive fluoride and one which cannot (Taves, 1968a,b). The exchangeable fraction is smaller and is the same as ionic fluoride. Ionic fluoride can be measured directly with a fluoride electrode reasonably well, and even more accurately - after diffusion or ul- trafiltration. It can also be measured with a fluorometric reagent. The renal clearance of this fraction coincides with the renal clearance of radioactive fluoride (Taves, 1967), and also varies with the fluoride concentration in the water supply (Guy et al., 1976~. With fluoride content of water at 1 ppm, the serum inorganic fluoride content is on the average less than 1 ,uM, or 0.02 ppm (Taves, 1966; Singer and Armstrong, 1973; Hanjijarvi et al., 19721. This contrasts with the average value of 0.15 ppm found by Singer and Armstrong after asking and distillation, a value that should now be labeled "total" fluoride. In other words, variations in serum inorganic fluoride were hidden by a larger fraction of organic fluoride, which was being measured along with inorganic fluoride when asking was employed. Guy et al. (1976) reported the isolation of an 8-carbon perfluorinated compound from human plasma. If the second form of fluoride proves to represent only chemicals of this type with no relation to fluoridation, the case for the safety of fluoridation will have been strengthened, in that the
Inorganic Solutes 375 behavior of inorganic fluoride in the body will have become simple and understandable. Whether food is the source of this second form of fluoride is unclear, in part because the reports of organic fluoride in food have not been confirmed (Weinstein et al., 1972~. There is heavy use of fluorocompounds industrially and in homes (Bryce, 1964~. This may explain its presence in humans. Under steady-state conditions, at least 99% of the fluoride present in the body is sequestered in calcified tissues. Most of the remainder is present in plasma and is thus available for excretion. Hodge (1961) has emphasized that skeletal sequestration and renal excretion are the two major means by which the body prevents the accumulation of toxic amounts of fluoride ion. Chen et al. (1956) measured the renal clearance of fluoride in female dogs. After showing that fluoride was completely ultrafiltrable in dog plasma, they used routine clearance procedures in animals drinking tap water containing fluoride at 1 ppm (artificially fluoridated). The average normal renal fluoride clearance was 2.7 ml/min, and the fluoride:chloride clearance ratio was 19:1. During mannitol diuresis, fluoride clearance varied directly with the urinary flow rate. Hypertonic sodium chloride infusion also increased the clearance of fluoride. Although the authors claimed that the intravenous administra- tion of sodium nitrate or sodium sulfate did not affect fluoride excretion, their data did not establish that point. Plasma fluoride concentrations in their experiments ranged from 12 to 61 ~g/100 ml (6.3-33 ~M). Carlson et al. (1960a) studied the renal excretion and clearance of radiofluoride in dogs. Reabsorption ranged from 14 to 92% of the filtered load and was consistently less than reabsorption of chloride. Renal clearance of fluoride varied directly with urinary flow rate. There was no indication that renal tubular secretion occurred. In a later study, Carlson et al. (1960b) fed 1 mg of radiofluoride to each of two adult humans. Fluoride clearance always exceeded chloride clearance and increased with urinary flow rate. Fluoride clearance was always smaller than creatinine clearance. Although less than 1097O of the ingested radioisotope was present in the plasma volume at any time, about one-third of the ingested dose appeared in the urine within 4 h. Chlorothiazide, a benzothiadiazine diuretic, increased the clearance and excretion of fluoride. Plasma contained 72% of the whole-blood fluoride. This differential distribution between plasma and red cells was also observed in dogs (Carlson et al., 1960c). More recently Whitford et al. (1976) have demonstrated that the renal clearance of fluoride is inversely related to tubular fluid pH. They showed that urine flow rate and chloride clearance, which were previously
376 DRINKING WATER AND H"LTH thought to be the main determinants of fluoride clearance, were not strongly associated with fluoride clearance. Walser and Rahill (1965) have shown that the renal tubular reabsorp- t~on of iodide, bromide, and fluoride is related to the simultaneous reabsorption of chloride. The results indicate that all the halides are reabsorbed predominately by the same mechanisms. If reabsorption of fluoride is achieved by utilization of renal chloride-transporting systems, chloride must be the preferred substrate because the clearance of fluoride is generally much greater than the simultaneous clearance of chloride. A summary of the findings from these studies on renal handling of fluoride is: 1. Virtually all the fluoride in plasma (human or dog) is ultrafiltrable. 2. Renal excretion of radiofluoride depends on glomerular filtration and variable tubular reabsorption. 3 Probably, reabsorption is largely passive, with fluoride being less permeable than chloride. 4. Fluoride excretion increases when the plasma concentration is increased. 5. Procedures that increase urinary flow rate (e.g., administration of osmotic diuretics, hypertonic saline, or diuretic drugs) increase the clearance of fluoride. HEALTH ASPECTS Acute Effects Acute toxicity from fluoride is quite rare and occurrs principally as a result of suicide or accidental poisoning. The lethal dose of sodium fluoride for man is about 5 g, but there are reports of recovery from amounts much greater as well as deaths from smaller quantities (Goodman and Gilman, 19751. Initial symptoms of toxicity are a result of the local action of fluoride on the mucosa of the gastrointestinal tract. Vomiting, abdominal pain, nausea, and diarrhea are followed by paresthesias, hyperactive reflexes and tonic and clonic convulsions. No system of the body can be considered exempt, and death is usually due to respiratory paralysis or cardiac failure. Many of the signs and symptoms of acute fluoride toxicity are a result of the calcium-binding ejects of fluoride (Goodman and Gilman. 1975. WHO, 19701.
Inorganic Solutes 377 Chronic Effects Chronic toxicological studies indicate that teeth and bone are the most fluoride-sensitive tissues. The margin of safety with fluoridated water (assuming an intake of l mg/day) has beeen estimated to be 2-8-fold for dental mottling. Years of experience with fluoridation without apparent objectionable mottling (see below for possible exceptions) attest to the adequacy of this low margin of safety. Crippling skeletal fluorosis has a 20- to 40-fold margin of safety for the average person, again assuming an intake of only 1 mg/day (Hodge, 1961 and 1962~. Epidemiological studies where the water is naturally high in fluoride have reported no adverse ejects, except in rare cases, until the concentration is many times that recommended for artificial fluoridation (Hagen et al., 1954; Leone et al., 1954; AMA, 1957~. Indeed, there is a suggestion that l-5 ppm may prevent bone loss to some degree and decrease the amount of soft tissue calcification in older people (Bernstein et al., 1966~. Controlled studies with recommended levels of added fluoride, such as in Kingston-Newburg, have reported no evidence of adverse ejects (Ast et al., 1956~. Mongolism The possibility that mongolism is caused by fluoride in the drinking water stems from a report by Rappaport (1959), in which he observed a dose- related association between the number of cases of mongolism registered in institutions and the concentrations of fluoride in the water. From the towns with less than 0.1 ppm to those with 1.~2.6 ppm, the increase was nearly 3-fold. This study has been criticized because the case rates were less than half those found in intensive case-finding studies (Royal College of Physicians, 1976~. Three intensive case-finding studies in Britain (Berry, 1958, and two unpublished ones cited by the Royal College of Physicians, 1976) with different fluoride concentrations in the water have not shown such an association. Heavy tea drinking in England (Cook, 1970) might obscure differences in the British studies. However, the absolute rates were similar to those in a recent intensive case-finding study in Massachusetts (Needleman et al., 1974), in which no difference was noted between fluoridated and nonfluoridated communities. Therefore, for Rappaport's hypothesis to be maintained, an explanation as to why the British rate did not reflect increased consumption of fluoride from tea drinking would be necessary. Needleman estimated that he could have detected an increase
378 DRINKING WATER AND H"LTH of as little as 20% at the 95% confidence level. He admitted that his evidence was not adequate to rule out an eject where fluoridation had been present for the lifetime of the mother, because his data involved a relatively short period of fluoridation. Sensitivity to Fluoride A recent report (Grimbergen, 1974) suggests confirmation of the earlier claims by Waldbott (1962) that some people are very sensitive to fluoride. Waldbott's claims have been dismissed on two grounds: that he was the only one to report such ejects, and that sensitivity of this type has not been reported among the billions of tea drinkers in the world who would be ingesting extra fluoride (WHO, 1970, p. 15~. Grimbergen's report was a preliminay methodological paper and is not convincing. Two aspects of the methodology seem weak and could lead to erroneous conclusions. First, when large numbers of double-blind tests are done, it is to be expected that control patients will occasionally have symptoms that correspond to those associated with the administration of fluoride; the investigator should indicate the rate of positive responses and the results of retesting. Second, the patients selected themselves for inclusion in the study based on their beliefs that they were already sensitive to fluoride. Waldbott's case reports (1962) are more completely documented and he used concentrations that were probably too low to be identified by taste. He reported 29 positive responders among 48 people tested. The Royal College of Physicians (1976, p. 63) review stated that sodium fluoride at 1 mg/15 ml of distilled water has a distinctive taste. However, Taves (unpublished, 1976) found that four people out of five could not tell the difference at 1 mg/15 ml. Waldbott and Grimberger are not the only ones who have described patients with syndromes that they explained as intolerance to fluoride. Douglas (1947) tested 32 patients in a group of 133 with histories suggestive of sensitivity to fluoride-containing dentifrices. He implied that none were able to complete a series of six alternating trials using fluoride and nonfluoride toothpastes, because of intolerance, mainly In the form of ulcerations of the mouth. Feltman and Kosel claimed that, among pregnant mothers and their children, 1% (at least four of them) reacted adversely to 1 mg fluoride tablets. They stated that they established (by means of placebos) that it was the fluoride, rather than the binder, that caused the adverse effect (Feltman, 1956; Feltman and Kosel, 1961~. Shea, Gillespie, and Waldbott (1967) reported on seven cases of patient improvement after discontinuing vitamin drops or toothpaste containing fluoride. They subjected one case to a double-blind
Inorganic Solutes 379 study with sodium fluoride. In the cases involving toothpaste, the associated cation is not stated. Stannous fluoride is commonly used in toothpaste; therefore, sensitivity to tin, rather than to fluoride, cannot be ruled out. Petraborg (1974) reported on seven case histories of what seemed to be fluoride sensitivity, but the patients were not subjected to objective tests, so the evidence is weak. The quantities of fluoride involved are clearly relevant to the question of the safety of fluoridation. But, if Feltman and Kosel's estimate of 1% intolerant people is correct, there should have been more reports of adverse elects in the studies in which fluoride tablets were given to schoolchildren (at least 10,000 children by 1967, mainly in Switzerland) (O'Meara, 1968~. Also, as methoxyflurane anesthesia for surgery typically causes serum fluoride content to increase to 3~50 times normal (Fry et al., 1973), there should have been striking cases of such intolerance in an estimated 12 million patients who have recieved methoxyflurane GNAW NRC, 19711. Moreover, cases of intolerance to fluoride (20 100 mg/day) for osteoporosis have been associated with very few symptoms of the type reported by Waldbott. There have not been reports of intolerance from people who move into and out of numerous towns with naturally high fluoridated water supplies. Opportunities for such discovery existed before any bias for or against fluoridation. So, although sensitivity to fluoride has not been demonstrated firmly, a possibility of sensitivity or idiosyncratic reaction to fluoride should be kept in mind. Clarification might come from two kinds of study. Studies on the administration of fluoride drops or tablets for prevention of dental caries should include consideration of possible intolerance and definite statements should be made about any findings in this regard; in most such reports, no comments are made about a search for intolerance. Quissell and Suttie (1972) have demonstrated an ability of fluoride- resistant cells to remove or exclude fluoride from their interiors in vitro. Humans or animals receiving fluoride for long periods should be studied to see whether a cellular resistance develops in vivo. If this could be demonstrated, the metabolic consequences of resistance or its absence might shed light on how intolerance could occur. Renal Patients The elect of impaired renal function on the handling of fluoride could not be adequately studied until accurate measurements of serum ionic fluoride could be made. Evidence that was thought to carry some weight in the past, such as the lack of observed increase in serum concentration and the similarity of urinary fluoride concentrations in patients with renal
380 DRINKING WATER AND H"LTH disease, is faulty. Difficulties with serum fluoride values have already been discussed. Urinary concentrations will reflect impaired renal ability to excrete fluoride only if there has not been sufficient time for equilibrium with fluoride intake to be reached. Three reports confirm the belief that renal patients have a lower margin of safety than the average person. Hanhijari et al. (1972) noted that serum fluoride concentrations in patients with renal disease were as much as 5 times greater than in normal people. The increase can be explained on the basis of decreased renal clearnace of inorganic fluoride (Berman and Taves, 1973~. One case of symptomatic skeletal fluorosis (radiculomyelo- pathy) has been reported from an area in Texas with natural fluoride at 2.3-3.5 ppm in the water. (Sauerbrunn et al., 1965~. There have been two cases of suspected skeletal fluorosis (based on X-ray evidence) in the United States with fluoride at 2-3 ppm in the drinking water (Juncos and Donadio, 1972~. The combination of renal impairment and verge high water intake was thought to account for these findings. The best available information on the implications of increased serum fluoride concentration in renal patients is from studies on patients requiring renal dialysis. In these patients, serum fluoride during dialysis rises to about 25-30 ,uM; consequently, any effects should appear earlier than in renal patients not on dialysis. A double-blind study of the effect of fluoridated dialysate in long-term hemodialysis has been conducted by deionizing the water and adding fluoride or chloride via coded ampules to the dialyzing water of the artificial-kidney machine. Twenty patients were investigated for over a year (average, 20 months). Patients on fluoride showed no differences, when compared with the control group, except for the histologic observation of increased thickness of trabecular bone (Oreopoulos et al., 1974~. The question of effects on patients who are maintained on dialysis for longer periods, or who are not yet adults, is certainly not settled. The fasting (5-10 ~ and maximal (25-30 ~ serum fluoride concentra- tions in hemodialysis patients are almost identical with concentrations in patients being treated with fluoride for various bone diseases (Taves, unpublished data); hence, some effect is possible. The implications, however, of bone effect (fluorosis) from excess fluoride are not clear, unless a limitation of joint movement or compression of exit of the spinal nerves occurs. Fluoride is being used deliberately to produce increased bone density in patients with bone disease; therefore, it may be that small increases in bone density in renal patients may be advantageous, rather than harmful. Whether treatment with fluoride win result in improved bone density may be determined by the interrelated metabolism of calcium and vitamin D (Jowsey et al.,
Inorganic Solutes 381 1968~. Because calcium metabolism is altered in patients with renal disease, a beneficial eject of long-term fluoridated-water hemodialysis may not be automatic, even if fluoride proves to be beneficial in other bone diseases or in preventing fractures due to osteoporosis. The possibility of adverse ejects in renal patients still dependent on their own kidneys cannot be entirely ruled out by a demonstration of benefit to those on dialysis. The possibility of adverse ejects of fluoride on marginally functional kidneys has to be considered for patients with renal failure, but certain lines of evidence make adverse ejects unlikely. Considerable information has been collected on serum concentrations that will cause functional renal changes. This was the result of evidence that inorganic fluoride from the metabolism of methoxyflurane was the cause of the polyur~a occasionally seen after the use of that anesthetic. The serum concentrations of inorganic fluoride necessary to cause polyur~a were found to start at about 4~50 ~M, and severe ejects required 150 ~M. We immediate cause of the pol~na is the loss of the electrolyte concentration gradient from the cortex to the papilla (Whitford end Taves, 1973~. Cancer Early in 1975 it was claimed by Yamouyiann~s that there is a linkage between fluoridation of water and increased cancer rates. The initial data presented and shown In Table V-16 are the sum of rates for nine specific TABLE V-16 Selected Cancer Mortality Rates for the Largest Cities with Fluoridated and Nonfluor~dated Water (per 100,000) Fluoridated Nonfluoridated Chicago 121.0 Los Angeles 94.3 Philadelphia 124.6 Houston 82.7 Baltimore 119.2 Boston 123.1 Washington 113.1 New Orleans 104.1 Cleveland 121.9 San Antonio 84.2 San Francisco 119.9 San Diego 85.6 Milwaukee 125.9 Seattle 96.7 St. Louis 119.3 Cincinnati 115.2 Pittsburgh 112.1 Memphis 83.4 Buffalo 121.6 Atlanta 85.8 Mean 119.9 95.5 (From Yiamonyiannis, 1975)
382 DRINKING WATER AND H"LTH 240 220 UJ A: tar I ~ 200 a: UJ Ad 180 /o ,9 oro O Nonf luor idated · Fluoridated · / · '-/ Y ./ 0 ~00 j/oO1s'°OO° _ 160 1950 1960 oo J 1970 YEAR FIGURE V-1 Average crude cancer death rates for the 10 fluoridated cities from Table V-16 and 10 nonfluor~dated cities selected from the 15 largest ones to match the pre- fluor~dation period, 1944-1950. The two arrows mark the time when fluoridation was instituted in these cities. Reprinted, with permission, from Yiamouyiannis and Burk, 1975. cancer sites (seven for white males and two for white females) for the 10 largest cities with fluoridated water supplies for more than 12 yr prior to 1970 and for the 10 largest nonfluoridated U.S. cities. The source of the data was the age-specific cancer rates for a 20-yr period by site and county compiled by the National Cancer Institute (NCI) and published by the Department of Health, Education, and Welfare (HEW) in 1974. There is clearly a difference between the two groups of cities, with the fluoridated ones having about 25/100,000 more cancer deaths than the nonfluoridated ones.
Inorganic Solutes 383 Later, in September 1975, Yamouyiannis and Burk submitted data to NCI suggesting that there had been a change in cancer rates with time for fluoridated cities as compared with nonfluoridated ones. A later version of the same data is shown in Figure V-1, where average annual crude cancer mortality rates have been plotted as a function of time for the 10 largest fluoridated cities and for 10 control cities, selected from among the largest nonfluoridated cities giving the same average crude death rates prior to 1952, for both groups. As can be seen, the average crude mortality rates diverge markedly after 1952, when the one group of cities initiated fluoridation. In considering this evidence the National Cancer Institute found that Yamouyiannis and Burk had failed to take into account differing demographic factors and age distributions that affect cancer rates. When the NCI used 1950 rates for the U.S. population as a whole to adjust the crude mortality rates of Figure V-1 for sex, race, and age and expressed the results as the ratio of observed deaths to expected deaths (standard mortality ratios, SMR) the time trends are eliminated as shown in Figure V-2. The SMR's are greater than unity for both sets of cities and greater in 1 .40 In ~ 1.30 by J a: O 1.20 co 1.10 - _ ~ F luoridated -No of I uor idated 1950 1960 YEAR OF DEATH 1 1 1970 FIGURE V-2 Standard mortality ratios for all can- cers for the cities of Figure V- 1. Reprinted, with permission, from Hoover, 1976.
384 DRINKING WATER AND H"LTH the fluoridated than In the nonfluor~dated ones, but there is no change in these ratios with time from 1950 to 1970 (Hoover, 1976~. In supplementary studies, NCI (1975) investigated the absolute differences in cancer rates in fluoridated and nonfluoridated areas. One study, results of which are shown in Table V-17, dealt with reasons for the differences shown in Table V-16. Regression analyses were conducted for each of the nine cancer sites and the counties of the cities listed in Table V-16 using fluoridation as an independent variable alone and then after correction for a number of demographic variables. As shown in Table V- 17, columns 3 and 4, the slopes of the regression lines (B) are generally positive and the F values are generally greater than 6 when only fluoridation status is considered, in agreement with the claim of TABLE V-17 Regression Coefficients ~) and F Values Associated with a Fluoride Variable Entered into a Regression Analysis to Predict Sex and Site-Specific Cancer Mortality Rates in 20 Counties with and without Control for Demographic Risk Factors Without Control Sex ,8 F With Control ~F Mouth and throat M1 .14 2.6-0.78 0.8 F-0.16 1.9- 0.13 0.9 Esophagus M2.55 25.00.57 1.2 F-0.08 0.5-0.29 2.6 Stomach M5.02 19.72.31 11.6 F2.22 11.10.79 7.4 Colon M5.47 23.10.64 0.3 F3.57 13.3-0.31 0.1 Rectum M3.72 21.51.12 1.1 F1.50 17.50.22 0.2 Breast F3.85 16.10.76 0.2 Ovary F1.18 9.80.69 2.3 Kidney M0.44 7.20.11 0.2 F0.21 8.20.07 0.7 Bladder M1.49 13.10.84 1.3 F0.36 8.90.26 2.2 (From Hoover, 1976)
Inorganic Solutes 385 Yiamouyiannis. When demographic variables are taken into account, however, the F values, given in the last column, become insignificant except for stomach cancer. Further regression analysis, allowing also for control of the specific high-risk ethnic groups for cancer, yielded a nonsignificant F value of 0.02 for females with only the F value for males, 6.9 remaining greater than the 95% confidence level. Since one positive correlation of this sort occurs by chance in 5% of cases examined and 16 cases were examined in this instance, this result cannot be regarded as strong evidence of a linkage between fluoridation and cancer. Some linkage may not be unreasonable, however, for fluoride will exist primarily as hydrofluoric acid, a highly penetrating and irritating chemical, in the acidic stomach. Hydrofluoric acid is also a possible mutagen in plants (Mohamed, 1969) and drosophila (Mohamed and Kemmer, 1970~. This will be considered more fully in a later section. Two other studies by NCI (1975) give additional information on a possible linkage of fluorides to stomach cancer. In the first of these, cancer data for all the U.S. counties in which at least two-thirds of the population was first fluoridated between 1950 and 1965 were grouped into 5-yr intervals in order to study changes with time. Results are shown in Table V-18 in terms of standard mortality ratios at some particular sites. The bone and kidney are of special interest because fluoride is concentrated in those tissues. None of the specific sites give any indication of an increase in cancer following fluoridation; rather a possible decrease is suggested. The "other" category is of interest as the only grouping which suggested a possible increase for both sexes. The other study compared naturally fluoridated and nonfluoridated counties in Texas on the same basis as in the previous one. Results are shown in Table V-l9. The SMR's are more variable because of the smaller numbers involved, but there are no consistent trends with increasing fluoride content except for a possible decrease in the "other" category. Thus, there is no confirmation of the hypothesis that fluorides or fluoridation causes cancer. Moreover, epidemiological studies in England fail to support the hypothesis that stomach or any other cancer is associated with fluoride intake (Kinlen, 1975; Royal College of Physi- cians, 1976~. An independent evaluation of the data presented by Yiamouyiannis and Burk was carried out by Taves (1976) using the same basic statistics as those used by NCI (U.S. Census and Vital Statistics). To gain more precision, the cancer mortalities observed in the year prior to the census year have been averaged with the figures for the census year.
386 DRINKING WATER AND H"LTH TABLE V-18 SMR'S and Number of Deathsa from Cancer in 5-yr Intervals before and after Fluoridation of Water Supply Site: Stomach Kidney Sex: Men Women Men Women Prior to fluoridation 10yr 1.0 (352) 0.9 (205) 1.1 (76) 1.2 (44) 5 yr 1.3 (4,509) 1.2 (2,630) 1.1 (785) 1.3 (517) Pentad offluoridation 1.2 (8,053) 1.2 (5,143) 1.2 (1,796) 1.1 (991) After fluoridation 5 yr 1.2 (6,971) 1.1 (4,340) 1.2 (1,946) 1.1 (1,142) 10yr 1.2 (5,597) 1.1 (3,655) 1.1 (1,889) 1.0 (1,072) 15 yr 1.0 (2,454) 1.0 (1,671) 1.1 (1,009) 1.0 (633) Site: Bone Other - Sex: Men Women Men Women Prior to fluoridation 10yr 0.9 (28) 1.1 (23) 1.0 (203) 0.8 (184) 5 yr 1.2 (351) 1.1 (216) 0.9 (1,923) 0.9 (2,042) Pentad of fluoridation 1.1 (642) 1.0 (438) 1.0 (4,436) 1.0 (4,844) After fluoridation 5 yr 1.1 (597) 1.1 (413) 1.0 (4,682) 1.0 (4,871) 10 yr 1.1 (499) 1.1 (358) 1.1 (5,173) 1.1 (5,383) 15 yr 1.0 (269) 1.0 (173) 1.2 (3,400) 1.2 (3,678) aNumber of deaths in parentheses. (From Hoover, 1976) During evaluation of the data, it was noted that only l of the fluoridated cities had gained in population from 1950 to 1970, whereas 7 of the 10 nonfluoridated cities had gained. Accordingly, the next 10 largest fluoridated cities, 7 of which had gained in population over the 20 yr, were also evaluated. In addition, data were also compiled on the 5 large nonfluoridated cities that had been omitted from the original control group. Results are shown in Figure V-3 and in Table V-20. In no case is there a significantly different time trend; thus, the assertion that fluoridation has caused an increase in cancer rates does not hold up. The rates in fluoridated cities are higher only for a particular set of cities and the
Inorganic Solutes 387 higher rates in these cities were present before fluoridation. When the data for all 20 fluoridated cities and all 15 nonfluoridated cities are combined as shown in Table V-20, the standard mortality ratios for the fluoridated cities are remarkably constant. For negative results like those described in the preceding section it is important to assess the magnitude of the eject that would escape detection. Statistically, such evaluations are known as estimations of error of the second kind, beta error or power of the test (Dixon and Massey, 1969~. For the Taves study, for example, it was computed that a 1.5 % increase in cancer death rates would have been detected with 95 To confidence. The results of the large NCI study by 5-yr periods have a similar detection limit with about a 10~o detection limit for increase in cancer at specific sites (Taves, 1977~. Other observations of possible positive correlations between fluoride intake and cancer, although not conclusive, deserve attention and further investigation. Okamura and Matsuhisa (1963) showed a correlation between stomach cancer and the fluoride content of rice and "miso." The fluoride values reported for food by Okamura are many times those expected in this country and are based on analytic methods that would not distinguish between organic and inorganic fluoride. So, even if the correlation is causal, it is not clear that fluoride ion is involved. H~rayama (1977) reported that stomach cancer rates In Japan were positively correlated with the amounts of hot tea and fish consumed and negatively TABLE V-19 Site and Sex Specific SMR'S and Observed Number of Cancer Deathsa (1950-1969) in Counties in Texas Grouped According to Natural Fluoride Levels Levels of Natural Fluoride Site Sex Control Low Intermediate High Stomach Kidney Bone Men Women Men Women Men Women 1.0 (375) 1.0 (236) 1.1 (121) 1.0 (68) 1.0 (40) 0.9 (27) 1.0 (914) 1.0 (583) 1.0 (235) 1.0 (163) 1.0 (118) 1.1 (70) 1.1 (239) 1.0 (122) 1.2 (84) 1.0 (46) 1.2 (39) 0.9 (14) 1.1 (112) 1.0 (55) 0.6 (19) 1.2 (23) 0.6 (8) 0.8 (5) Other and Men 1.0 (319) 1.0 (774) 1.0 (211) 0.9 (83) unspecified Women 1.0 (318) 1.0 (854) 0.9 (170) 0.9 (73) aNumber of deaths in parentheses. (From Hoover, 1976)
388 DRINKING WATER AND H"LTH A: of J J A: ~ 1 1 O CC A) 1.2 _ 1 I_ o.s 1949-51 _ 1969-71 1 1 959-61 YEARS FIGURE V-3 Standard mortality ratios for all cancers using average of 2 yr observed mortality. Fluoridated cities of Figure V-1, open circles; nonfluor~dated cities of Figure V-1, closed circles. Next 10 largest fluoridated cities, open squares; the closed squares are the 5 non- fluor~dated cities omitted from 15 largest nonfluor~dated shown in Figure V-l. correlated with the amount of milk drunk. Tea and fish have been reported to have higher levels of fluoride than other foods, and milk would be expected to act as a binding agent and buffer to reduce effective concentrations of hydrogen fluoride (HF) in the stomach. There was an observation in the Kingston-Newburgh (As t et al., 1956) study that was considered spurious and has never been followed up. There was a 13.5% incidence of cortical defects in bone in the fluoridated community but only 7.5% in the nonfluoridated community. With 474 and 375 children in the respective groups, the t value was 2.85, which is statistically significant (Schlesinger, 1956~. Cagey (1955) noted that the age, sex, and anatomical distribution of these bone defects are "striking- ly" similar to that of osteogenic sarcoma. While progression of cortical
Inorganic Solutes 389 defects to malignancies has not been observed clinically, it would be important to have direct evidence that osteogenic sarcoma rates in males under 30 have not increased with fluoridation. The overall bone cancer rates do not appear to have been affected by fluoridation. However, bone cancer rates are dominated by the older age groups, which could obscure a difference in the younger ages. Taylor and Taylor (1964, 1965) concluded that low concentrations of fluoride increase the rate of tumor growth in animals or eggs. Their studies are not convincing because they show no dose-response effect over a very wide range of doses. Such findings generally indicate inadequate controls or the presence of bias. The use of distilded water for control, rather than an equivalent amount of sodium chionde, might be a cause of inadequacy in the controls. Distilled water tends to pick up metal ions to a greater extent than does a solution. The data of FIemm~ng (1953) suggested a beneficial eject from fluoride at 20 ppm in the drinking water of mice with implanted tumors. An abstract by Bittner and Armstrong (1952) indicated no carcinogenic eject from 5 to 20 ppm fluoride in the drinking water on the survival of the ZBC-strain mice. In summary, the available evidence does not suggest that fluoridation has increased the overall cancer mortality rates. The margin of possible error is very low, approaching 3/100,000. This is the theoretical effect that could have been missed with present statistical techniques. The NCI studies probably lowered the margin of error by a factor of 5 from the best previous study (Hagen et al., 1954~. Mutagenesis, Teratogenesis, Birth Defects There are a number of papers suggesting or claiming that fluonde is mutagenic, but relatively little attention has been paid to ~em. This lack of attention probably stems from the fact that the published evidence has TABLE V-20 Standard Mortality Ratios (SMR) for All Cities Expected Deaths Based on U.S. Rates for 1950 _ _ Nontluoridated (15) Fluoridated (20) Time, Observed Observed 2 yr Deaths SMR Deaths SMR 1949-1951 26,952 1.1272 53,908 1.1961 1959-1961 33,377 1.0899 6O, 185 1. 1958 1969-1971 38,825 1.1390 61,938 1.2116
390 DRINKING WATER AND H"LTH been in plants and Drosophila, primarily with high doses of HF rather than fluoride ion. As noted above, the possibility of mutagenesis due to HF is potentially important in cancer of the stomach. Ingested fluoride ion can become HF in the stomach because the pK of HF is 3.18 and the pH of the stomach without food is generally about 1. Although stomach cancer rates show no consistent indication of a relationship to fluorida- tion in the United States, the much higher stomach cancer rates in Japan are related to intake patterns that are compatible with a hypothesis that fluoride is the crucial factor involved (Taves, 1977~. Therefore, the work in plants with HF will be reviewed after consideration of the recent work of Mohamed and Chandler (1976), in which 1 ppm NaF (presumably 0.5 ppm fluoride) reportedly caused permanent damage to the chromosomes of bone-marrow cells and spermatocytes in mice. Increased rates of congenital malformations and decreased rates of reproduction can also be consequences of mutation. Hence, the available evidence on these topics as related to fluoride ingestion is also part of this section. Mohamed and Chandler's experiment consisted of feeding mice a low- fluoride diet together with varying concentrations of sodium fluoride in distilled water for two time periods, 3 and 6 weeks. The concentrations of sodium fluoride were 0, 1, 10, 50, 100, and 200 ppm. Sixty-four mice, plus eight baseline controls, were put on a low-fluoride diet and given distilled water to drink for 1 week prior to the start of the experiment. The data consisted of food intake, water consumption, fluoride concentration of the bone ash, and cytological examination of chromosomes from bone- marrow cells and spermatocytes. The frequency distribution of chromosomal changes in bone-marrow cells was given as a percentage. Two things are of note that are not commented on by the authors. One is the fact that the numbers of cells examined are not consistent with the number of animals in the groups, four to each treatment group and eight to each control group, and vary markedly, 737-1,345 for the groups with the same number of animals. The lack of twice the number of observations in the larger groups raises the question of how animals or slides were selected. Was each animal represented with the same intensity of searching, and, if not, what determined the intensity of the search? The second point of note is that the largest change in frequency of abnormality occurs between 0 and 1 ppm NaF. This is odd because there is little or no difference in the bone fluoride concentrations with these two dose levels. A possible difference between the controls and the rest of the animals is that the distilled water dissolved more metal ions than the distilled water with NaF and that this difference in intake was important in the marginally iron-deficient diet (Tao and Suttie, 1976~. This type of response makes the claim of an effect
Inorganic Solutes 391 down to the 1-ppm level uncertain. Using the 1-ppm NaF animals as the controls, rather than those receiving distilled water, would make the changes in chromosomal fragments unimpressive. There is still, however, a doubling of "ball metaphase" rings and bridges that is recorded. Ball metaphase is not commonly recognized by cytologists and was not noted by Temple and Weinstein (personal communication) when they repeated the work of Mohamed et al. (1966a) on onion root tip with 10-2M fluoride. The spermatocyte changes also show things of note which were not commented on by the authors. In this case, the numbers of cells examined are again very irregular. However, the total for the control groups is approximately double, properly reflecting the group sizes. The serious discrepancy, however, is that there is no way that the percentages given for the frequency of abnormalities can be derived from the number of cells examined. The cells examined are scored as having either breaks, fragments, or both for the first meiotic anaphase and telophase and for the second anaphase and telophase. If each number of cells listed to the left of these two sets of frequencies is divided into 1, 2, 3, etc., to the 4th decimal place, multiplied by 100, and then compared to the percentages listed, only 27 of 90 can be rationalized on the basis of rounding errors. It is, therefore, clear that the listed sets and number of cells are not the numbers from which the corresponding percentages were derived. It is possible that the authors meant that the number of cells was the sum of two denominators. However, there are several frequencies listed for a given exposure of cells examined would have to have been considerably larger than the total as given. Mohamed's earlier work in onion root tips (Mohamed et al., 1966a) and tomatoes (Mohamed et al., 1966b) was done without the use of random numbers to code the slides, but his work in corn (Mohamed, 1970) was done by random assignment of the slide numbers prior to reading, even though this is not mentioned in the paper (phone conversation to D. R. T.) There is apparently no published confirmation of any of this work. An unpublished study (Temple and Weinstein, 1976) was able to confirm increased bridges and fragments of chromosomes in onion root tips when grown in 10-2M fluoride, but they did not confirm the observation of ball metaphase. The only published second generation study to provide direct evidence of mutation was done by Mohamed (1968~. In this study he exposed tomato plants to HF. The summary gives the concentration as 3 mg/m3, but this should read 3 ,ug/m3 (phone conversation to D. R. T.) The dose or time of parental exposure is not given in the body of the paper. A phone conversation revealed that the seeds came from plants exposed in a
392 DRINKING WATER AND H"LTH previous study (Mohamed et al., 1966b) in which all flower buds past the stage used for the chromosome smears were destroyed so that the fruit grown from the recovered plants would not have been exposed to HF subsequent to the formation of flowers. If the exposure had continued beyond this point, abnormal numbers of cotyledons would not necessari- ly indicate genetic damage. Abnormal numbers and shapes of the cotyledons occurred in the treated groups about 3 times more often than the 4.7% of the controls. Fasciated petioles, wiry plants, and plumuless plants were noted only in the treated plants, but the frequency was irregularly related to the duration of exposure. Dwarf plants and double stalks increased from 0.8% in the controls to 5% in the treated plants with uniform increases in four of the five exposure periods of increasing length. These descriptions of damage sound arbitrary, and no criteria are listed; hence, the lack of blind reading leaves the data unconvincing. The article stated that work is in progress to determine whether the effect was due to minute chromosomal changes or to changes within the gene. However, there have been no citations of this article through the June 1976 issue of Citation Index, suggesting that the findings have not been confirmed. Temple and Weinstein (1976) were unable to confirm these findings with the same or a different strain of tomato. The negative results with the same strain are limited however, because of the low rate of seed germination under the conditions used. There has been work on Drosophila by several different laboratories with a variety of conclusions. Mohamed (1971) claims to have proven that HF in concentrations too low to cause death is mutagenic in Drosophila melanogaster. The basis for his claim is genetic analysis of the progeny of flies exposed for ~12 hr to air which had been bubbled through 2.5% HF. The analysis involved looking at the ratio of the homozygous to heterozygous offspring from F. generation sib matings. The tester females were heterozygous for a recessive lethal so that F2 generations could only be homozygous for the paternal chromosomes in question; i.e., 33% would be expected. These Fat sibs were selected on the bases of marker genes to have the same paternal gene. The control groups showed 34.69 + 0.86% homozygous and the treated groups showed 26.84 + 0.09 to 25.52 + 1.54% homozygous, a clearly significant difference. The author claims a statistically significant difference between the exposed groups, but this is true only if the data in his tables are in error and the + are standard deviations rather than standard errors, as listed. The small dose effect may be due to having discontinued the introduction of the HF after 1 h and erroneously assuming that the concentration stayed constant for the remaining time of the exposure period. In the previous
Inorganic Solutes 393 paper (Mohamed and Kemmer, 1970), continuous exposure to air bubbled through 5% HE resulted in only three males being left to test, which suggests that the use of a 2.5% solution in the 1971 study is quite high. In order to prove the contention of mutagenicity, the males should have been mated prior to treatment to show that their genes were in fact normal before exposure to HF. Mukherjee and Sobels (1968) reported that injection of 1 mM NaF (unstated amount), as compared to injection of 1 mMNaC1 increased the percent lethals produced by 2,000 R radiation. The percent lethals in the NaCl groups was about 5% in four experiments, while it was 6 to 10% in the NaF groups. Vogel (1973) stated that 1 mM fluoride in 5%glucose fed to Drosophila larva was a weak mutagen but acted as a powerful antimutagen in combination with a strong mutagen. The evidence for a weak mutagen erect is slim. In one of three experiments, there were three lethals compared to one in the controls and one in each of two exposure groups. With only fluoride exposure, the egg-laying capacity was clearly depressed in most experiments and the hatchability was generally, but not always lower. Hence, he concluded that fluoride had a sterilizing effect. Treatment with the trialkylating agent Trenimon alone showed 13.1% lethals but in combination with 12 mM F. 3.4% lethals without a consistent difference in the number of eggs laid or their hatchability. A second experiment showed 8.6 and 1.3%, respectively. Since at least 350 chromosomes were tested for each group in each experiment, these differences are clearly statistically significant. Herskowitz and Norton (1963) showed a marked increase in the incidence of melanotic tumors in two strains of Drosophila. The controls were 0.0% and 7.1%, while the treatment of the larvae with 1 to 30 mM fluoride caused a smooth dose response up to nearly lOO~o occurrence. The group sizes were 1,500 so the numbers are highly significant statistically. Obe and Slacik-Erben (1973) reported a 25-50% decrease in the total breaking events of chromosomes of human cells in vitro with three separate strong mutagens in combination with 1 mM fluoride. Slacik- Erben and Obe's further work (1976) attempting to clarify the role of sodium fluoride and antimutagenic effects with Trenimon gives control data which show no effect from 1 mM fluoride alone. The human cells in this case were lymphocytes stimulated with phytohaemagglutinin in which nucleotide incorporation and mitotic index were followed for over 2 days. The data curves for two experiments were averaged and plotted; hence, only a visual judgement of no-effect can be made and no estimate of the power of the test is given.
394 DRINKING WATER AND H"LTH Jagiello and Ja-Shein (1974) exposed mammalian eggs to NaF and concluded that some changes were taking pace. The earliest eject noted was clumping of the chromosomes at meiosis in cow oocytes exposed to 10 ppm (500 Ad). This was the lowest concentration used. There is no indication of blind reading of the smears. There is some evidence of decreased fertility or reproduction with doses of fluoride below obvious toxic levels, which might be related to mutation and is of interest even if it is not related. Gerdes et al., 1971 found a 5-10% reduction in male Drosophila fertility, a 30% reduction of female fecundity, and a 20~o reduction of egg hatchability from the second generation with 6 weeks exposure to 2.9 ppm HF. These changes in the second generation (C~) were attributed to genetic ejects rather than to direct effects on the eggs. This claim is not convincing, since the eggs giving rise to the first generation would also have been exposed for some hours to the HF. Rensburg and Vos (1966) concluded that for normal reproduction in Afrikaner heifers under ordinary ranching conditions, the fluoride concentration should be less than 5 ppm. They found that the number of calves produced by the animals on 12 ppm water was decreased by about one-half as compared to those drinking 5 ppm. They speculate that there are functional disturbances of the ovaries due to fluoride under range conditions, which are marginal for several months each year. If fluoride were an important mutagen for humans, there would be real concern that cancer rates and congenital malformations might increase. There is a new set of data on each of these possibilities. (See Report of The Royal College of Physicians, 1976, for a review of the largely unpublished earlier data.) In the case of human cancer, the data can rule out an eject larger than 2% (Taves, 1977~. Congenital malformation rates, relative to fluoridation, were collected by Erickson et al. (1976) in the counties around Atlanta. The overall rates were 292.6 abnormalties per 10,000 live births for the fluoridated and 270 per 10,000 for the nonfluoridated populations. The Chi square was 3.58, and 3.84 is needed to be significant at the 0.05 level. While the difference is not statistically significant, an increase of 10% certainly can not be ruled out. About half of the population of the county (Fulton County, which contains Atlanta) was represented in both the fluoridated and nonfluoridated populations, because fluoridation was introduced in the middle of the time when the data were being collected; consequently, the period of exposure was generally short. A second part of this study, however, used data from a 10-yr exposure period and shows the opposite relationship; i.e., a statistically significant lower rate in the population exposed to fluorida
Inorganic Solutes 395 lion. The difficulty in relying too heavily on later data is that the rates are about one-third of the Atlanta data, a fact that suggests serious under- reporting. Since a similar degree of apparent under-reporting has been cited to discredit Rapaport's findings on mongolism (Royal College of Physicians, 1976; Needleman et al., 1975), it is inconsistent to place great faith in this negative study even though it is about 10 times larger than Rapaport's. The above evidence will not convince most scientists that fluoride is mutagenic for any species, but it certainly does not rule out that possibility, particularly for Drosophila. However, even if fluoride is shown to be mutagenic for species other than man, its relevance to man would be questionable in the face of the available human data. Mottling The WHO report (1970, p. 299) includes a figure showing the relationship of the community fluorosis (mottling) index (as a function of water fluoride concentrations) to the mean annual temperature. The figure indicates that fluoride should be removed from water when its concentra- tion is greater than 0.8-1.6 mg/liter, depending on temperature, in order to avoid objectionable dental mottling. More recently collected data by Richards et al. (1967) led them to conclude that 0.7-1.3 mg/liter would be appropriate maximum concentrations to recommend, again depending on average temperature. These values overlap the WHO values and represent good agreement. Richards et al. preferred average maximum temperature to mean annual temperature as a basis for the recommenda- tions. No recent U.S. surveys or studies of communities have been found on which a sound decision could be made that greater concentrations are without objectionable erect. A report from Sweden by Ericsson and Ribelius (1971) suggests more mottling at 1.2 ppm than would be acceptable to many. They indicate that only 1 of 92 children had objectionable mottling, but their graph showed 9 graded at 3.0, which was defined as the "whole surface affected, often brown discoloration." They note that this was a higher incidence than previously reported for the same degree of intake. Whether this related to some peculiarity, such as high fish consumption, which would not be applicable to U.S. communi- ties, is not clear. Recent work in England has confirmed the view that considerable dental mottling is not due to fluoride and that the optimal concentration of fluoride may, in fact, decrease the amount of dental mottling (A1
396 DRINKING WATER AND H"LTH Alousi et al., 1975; Jackson et al., 1975~. The presence of discolored (brown) areas in a few teeth even in the low-fluoride area suggests that better methods of ascribing etiology need to be developed and the question of objectionable mottling reevaluated. Two cases of dental mottling in children with diabetes insipidus living in fluoridated communities have been reported (Greenberg et al., 1974~. The Royal College of Physicians (1976) report tended to dismiss the possibility that the dental mottling was due to fluoride on the grounds that other conditions might have caused it and that similar observations were lacking in a center for children with renal disease. The fluid intake was estimated to be 2.5~ times normal; however, it was also stated that the urinary volume was as much as 9 liters/day. Such volume would require an intake 18 times normal (Greenberg et al., 1974~. With such unusual intakes, it would not be unreasonable to find dental fluorosis; perhaps the more pertinent question is, "Why is it not noted more often?" It is possible that objectionable mottling is being avoided in naturally high-fluoride areas in the United States by the practice of drinking bottled water or beverages and by the use of air conditioning, which would decrease the fluid intake. Those who do not have these amenities may be either too transient or too nonvocal to be noted. The "moderate" dental fluorosis shown by Hodge and Smith (1965, p. 443) in a community with "about 2 ppm" would be objectionable to most, if not all, parents, although there seems to be little consumer research on the matter. Recently one of the authors (D. R. T.) visited several areas in Texas (Lubbock and Amarillo) that have high natural fluoride concentrations in their drinking water. Several health officials reviewed for him their observations concerning renal dialysis and dental mottling with respect to fluoride. Their experience has been that there seems to be less bone disease in patients who come to dialysis centers from high fluoride areas. While Lubbock and Amarillo have in recent years decreased the fluoride content of their drinking water supplies, the neighboring towns generally have not changed. The health officials in the surrounding areas have observed a decrease in dental mottling, as well as a decrease in rampant caries. In light of these recent observations, it is suggested that such communities be extensively resurveyed before any changes are made in fluoride standards for public water supplies. In light of the ability of anyone to observe and object to dental mottling, it seems presumptuous for experts to recommend acceptable fluoride concentrations without direct evidence on the levels of fluoride that may be causing difficulty.
Inorganic Solutes 397 General Epidem~olog~cal Studies The largest study of overall mortality rates in high-fluoride (0.4-4.0 ppm) vs. low-fluoride (~0.25 ppm) areas considered 32 paired cities (Hagen et al., 1954~. The average mortality in the high-fluoride areas was 1,010.6/100,000, which was 5.6/100,000 higher than in the control cities. This difference is not statistically significant, because the standard error of the difference is 27/100,000. Conversely, the smallest real difference that the study can be 95% sure of ruling out is 51/100,000, which is 1.69 (the one-tailed critical value for 31 degrees of freedom) times the standard error of the mean plus 5 (the actual difference). In other works, the study would be expected to have this small a difference (or less) only one-twentieth of the times even if there were a real difference of 51/100,000. Considering that the populations studied probably were not very stable, even greater differences cannot be ruled out. One alternative to increasing the size of the study population is to consider populations exposed to much higher concentrations in the water. The Bartlett~ameron study (Leone et al., 1954) is an example: fluoride concentrations in the water supplies were 8 and 0.7 mg/liter, respectively. People were selected who had resided for over 15 yr in either area, but no information was given about whether they drank community or bottled water. The same people were studied 10 yr later. The authors concluded that there was no statistically significant difference between the two groups taken as a whole. There were however, five of forty tests which showed statistically significant differences, some favoring the high fluoride group. Since several such individual differences would be expected to appear statistically significant by chance with so many tests these differences do not force rejection of the null hypothesis. The authors of the report conclude that there was not a statistically significant difference between the numbers of deaths. They do not give the age and sex-adjusted values, but these were over twice as high in the high-fluoride area. The AMA committee (1956) that reviewed the data concluded that the difference was just barely statistically significant (0.045~. The AMA committee minimized the importance of this difference by quoting Roholm's statement that he had not observed an increase in mortality among crysolite workers whose fluoride intake was presumably even higher. Roholm, however, also concluded that he could not rule out an increase in mortality. He had only 12 autopsy cases available, and they were not in a controlled study. It is clear that the studies discussed leave a considerable area of uncertainty. This could be reduced relatively easily. Fluoridation was introduced into many large cities in the early 1950's and into only a few
398 DRINKING WATER AND H"LTH cities since then, so there is a basis for an unusually large study for which the data have been collected but not examined for detrimental or beneficial elects. The positive elects might occur from better nutrition with less caries and tooth loss or from decreased soft tissue calcification. The cancer mortality studies of the NCI involved populations 1~50 times larger than those from the 32 paired cities, and the accumulating data will have an even larger potential. The data presumably are available within the federal agencies and could be run through the same basic programs as set up by the NCI for cancer mortality, to look at total as well as other separate categories of death. The lack of such studies on the continuing evaluation of fluoridation probably stems from the failure of scientists to ask what the no-e~ect limits are. Without statements about the power of the tests, the implication of finding no-e~ect is construed to be that no elect exists. Such implication leaves little incentive to do a better study. Currently, the only motivation for such studies is an interest in checking allegations as they arise. SUMMARY AND CONCLUSIONS In summary, there is no generally accepted evidence that anyone has been harmed by drinking water with fluoride concentrations considered optimal for the annual mean temperatures in the temperate zones. It seems likely, however, that objectionable dental fluorosis occurred in two children with diabetes insipidus. Bone changes, possibly desirable, have been noted in patients being dialyzed against large volumes of fluoridated water. Similar changes can be expected in the rare renal patient with a long history of renal insufficiency and a high fluid intake that includes large amounts of tea. With this particular combination of circumstances, the lowest drinking-water concentration of fluoride associated with symptomatic skeletal fluorosis that has been reported to date is 3 ppm, outside of countries such as India. It should be possible for the medical profession to avoid the possible adverse elects of fluoride under the conditions described above, thereby making it unnecessary to limit the concentrations of fluoride in order to protect these rare patients. On the basis of studies done more than 15 yr ago, occasional objectionable mottling would be expected to occur in communities in the hotter regions of the United States with water that contains fluoride at 1 ppm or higher and in any community with water that contains fluoride at 2 ppm or higher. However, this may not be the case today; more liberal provisional limits seem appropriate while studies are conducted to clarify the subject. The possibility of fluoride causing other adverse elects (allergic
Inorganic Solutes 399 responses, monogolism, and cancer) or beneficial effects other than decreased dental caries has not been adequately documented to carry weight in the practical decision about the desirable levels of fluoride. The questions of monogolism and cancer have been raised on the basis of epidemiological data for which there is contrary evidence and the risk factors involved in any case are too low to establish a causal association. The allergic responses claimed by some reports are based on clinical observations and in some case double blind tests. The reservation in accepting these at face value is the lack of similar reports in much larger numbers of people who have been exposed to considerably more fluoride than was involved in the original observations. From a scientific point of view none of these ejects can be ruled out, but the available data are rather limited or easily improved so further study is indicated. RESEARCH RECOMMENDATIONS Better criteria should be developed for diagnosing dental fluorosis, as distinct from dental mottling. 2. The present rate of dental fluorosis (particularly staining) in communities with fluoride at more than 1 ppm in the water supply should be determined. 3. Bone and blood fluoride concentrations of patients with chronic renal disease in communities with fluoride at 2 ppm or more should be compared with those of similar patients in low-fluoride areas, to see whether there is a difference radiologically, histologically, or clinically, particularly with regard to bone pain and fracture rates. 4. The inorganic fluoride content of food, as distinct from the total fluoride content, should be determined, to settle the issue of whether there has been an increase. 5. Rappaport's study on mongolism should be repeated with the same cities; if there is still an association, intensive case-finding should be carried out, to check whether the lack of case-finding was important in his results. 6. Mortality ratios should be evaluated by cause of death In the fluoridated vs. nonfluoridated areas. 7. There should be in viva studies on the possibility of the development of cellular tolerance or intolerance to fluoride. 8. The nonhuman-primate study of Manocha et al. 0975) should be repeated with 5 ppm water and better controls, to check the reported renal enzyme changes. 9. Chromosomal studies of mice drinking water with low F concentra
400 DRlNKlNG WATER AND H"LTH lions should be repeated to determine if chromosome abnormalities are induced. 10. Dominant lethal studies should be done in rats and mice by feeding the males various dose levels of fluoride and mating to tester females on a normal diet. This is easier to do and would confirm item 9, if positive, but not necessarily be inconsistent, if negative. 1 1. Further evaluation of cancer death rates and congenital malforma- tion rates in large fluoridated cities as compared to nonfluor~dated cities should be made. Sodium OCCURRENCE Sodium ion is an ubiquitous constituent of natural waters. It is derived geologically from the leaching of surface and underground deposits of salts such as sodium chloride, from the decomposition of sodium aluminum silicates and similar minerals, from the incorporation of evaporated ocean spray particles into rainfall, and from the intrusion of seawater into freshwater aquifers. Salt spray from the sea is often the largest contributor of sodium ions within 5~100 miles of seacoasts. Some soils exhibit the property of ion exchange in which calcium ions in the water are replaced by sodium ions during normal leaching. Human activities also contribute sodium ions to natural waters. The sodium chloride used as a deicing agent on roads enters water supplies in runoff from both roads and storage depots. The quantity of sodium ion from this source has increased progressively since 1947 from about 0.5 TABLE V-21 Sodium Ion Concentration in Drinking Water Sodium Ion Concentration,No. ofPercent mg/literSamplesof Samples 0-19.91,19458.2 20~9.939119.0 50-99.91909.3 100-249.91788.7 250-399.9743.6 400~99.9100.5 500-999.9140.7 1,000 or higher20.1 Total2,053100.1 (From White et al., 1967)
Inorganic Solutes 401 million tons to 9 million tons in 1970 (USEPA, 1971~. This added sodium chloride is distributed throughout the snow belt of the northern United States and is most heavily concentrated around metropolitan areas. (American Public Works Association, 1969; Hanes et al., 1970; Hutchin- son, 1971; Bubeck et al., 1971~. Municipal use of water typically results in the addition of 2~50 mg/liter of sodium ion, primarily from urine and washing products. Procedures for water treatment often produce a finished water with greater sodium-ion concentration than the raw water from which it was derived. Sources of sodium ion in the treatment of water include sodium hypochlorite, sodium hydroxide, sodium carbonate, and sodium silicate. A survey of 2,100 water supplies, covering approximately 50~O of the population of the United States, was carried out in 1963-1966 by the Heart Disease Control Program, Division of Chronic Diseases and the Water Supply Section, Division of Environmental Engineering, both of the U.S. Public Health Service. The distribution of sodium ion found in this survey ranged from 0.4 to 1,900 mg/liter as shown in Table V-21. Some 42% of the supplies had sodium ion concentrations in excess of 20 mg/liter and nearly 5% had concentrations greater than 250 mg/liter. Similar results were shown in the 1975 report, of Chemical Analysis Or Interstate Carrier Water Supply Systems. For 630 systems the range of sodium ion concentrations was from < 1 to 402 mg/liter. A total of 42% had concentrations greater than 20 mg/liter and 3% had concentrations greater than 200 mg/liter. Daily Intake of Sodium Ton Few studies of habitual sodium-ion intake in healthy adults have been reported. Such data as have been reported are based on measurement of sodium excretion in 24-h or 12-h urine collections. Since ingested sodium is mostly excreted in urine, these figures give an acceptable estimate of sodium intake for the period immediately preceding and embracing the time of urine collection. Wide variations occur among individuals and in the same individual from day to day (Dawber et al., 1967~. Dahl (1958) reported a mean 24-h excretion of 4,100 mg with a range from 1,600 to 9,600 mg in 71 working adult males in New York. Langford et al. (in press) reported a mean sodium excretion of 2,822 mg per 24 h in 171 black women ranging in age from 35~4 yr. A recent estimate for infants is 69-92 mg/kg/day (American Academy of Pediatrics, 1974~. Sodium chloride is added to many foods during processing, such as baby foods. Additional sodium chloride is often added during cooking and again at the table.
402 DRINKING WATER AND H"LTH Habitual intake of sodium bears no relationship to physiological need. Estimated daily losses of sodium in urine, stool, skin, and insensible perspiration in subjects on markedly restricted sodium intake total 4~185 mayday (Dahl. 19581. Additional losses occur during sweating; however, `~ ~ ~ 7 ~ _ _ _ _ __ _ - ---~' - - - - - ----I 7 -- - - - - - 7 sodium content of sweat is adjusted during sodium deprivation by adrenocortical influences. Healthy individuals have been shown to maintain sodium balance on a sodium intake of less than 2,000 mg/24 h while sweating 9 liters/day (Cone, 1949~. A variety of preindustrial societies, in widely divergent habitats (tropical jungle, desert, arctic, etc.) subsist for generations on sodium intake less than 1,000 mg/day and show no evidence of sodium deprivation (Dahl, 1958; Page, et al., 1974~. Total body sodium content is about 130,000 mg for a 70-kg man (Widdowson et al., 1951~. Requirements for sodium in growing infants and children are estimated at less than 200 mg/day (American Academy of Pediatrics, 1974~; It thus appears that habitual intake of sodium in adults in the United States often exceeds body need by 10-fold or more. Evidence that this excessive intake may have harmful consequences is summarized else- where in this report. Since adult fluid intake averages 1.5-3 liters/day, sodium intake from drinking water represents less than 10% of the habitual total intake of 3,000 - ,000 mg as long as the sodium content of the water does not exceed 200 mg/liter. Adverse health erects may be anticipated with sodium concentrations greater than 20 mg/liter, however, for that special risk group restricted to total sodium intake of 500 mg/day, for intake from food cannot feasibly be reduced to less than about 440 mg/day (White et al., 1967~. For this group, whose diets must be medically supervised in a careful manner, knowledge of the sodium-ion concentra- tion of the drinking water permits prescription of low-sodium water when necessary. METABOLISM A full description of the physiologic mechanisms governing sodium metabolism is beyond the scope of this report; excellent summaries are available elsewhere (DeWardener, 1973; Early, 1972; Burg, 1976~. Sodium is rapidly and almost quantitatively absorbed from the gastrointestinal tract. It is distributed as the most abundant cation of plasma and extracellular fluid in man and all other vertebrates. It is present in bone and (in low concentrations) in cells of most tissues, except adipose tissue, from which it is virtually absent. The concentration of sodium in extracellular fluid is maintained within narrow limits through regulation
Inorganic Solutes 403 of the excretion of water by the kidney, under the influence of endocrine, cardiovascular, and autonomic regulatory mechanisms. The total amount of sodium in extracellular fluid thus determines the volume of these fluids. The volume of plasma and of extracellular fluid is in turn governed by regulatory mechanisms involving the endocrine, cardiovascular, and autonomic nervous systems, which regulate volume primarily by influencing renal excretion of sodium. Arterial blood pressure influences and is influenced by variations in plasma volume. HEALTH EFFECTS Acute Effects Acute adverse ejects of sodium in the healthy population are probably confined to neonates and young infants and will be discussed later. Chronic Effects An impressive amount of evidence has accumulated over the last several decades that sodium taken in excess of physiologic need is important in inducing an age-related increase in blood pressure that culminates in hypertension in genetically susceptible people. The prevalence of hypertension in the adult population of United States is 15-20% among Caucasians (U.S. National Center for Health Statistics, 1964) and substantially higher among blacks (Stamler et al., 1960~. Thus some 30 40 million Americans are afflicted with this disease. Evidence both in animals (Dahl et al., 1962) and in man (Ostfield and Paul, 1963; Thomas, 1973) indicates that a genetic factor operates to make some people susceptible to hypertension. One or more environmental factors may then induce the development of hypertension in these people. A wide variety of environmental factors have been implicated in the induction of hypertension, including sodium ion, obesity, trace minerals, and psychosocial stress factors. Evidence that sodium ion is involved as a causative agent in hypertension has three main sources: animal experi- ments, clinical observations, and epidemiologic studies. The salient features of this evidence are summarized briefly in the following paragraphs. Animal Experiments Observations (Meneely and Dahl, 1961; Dahl, 1960, 1972) extending over a period of 20 yr have repeatedly shown that sodium ion induces hypertension in genetically susceptible rats. Rats given sodium chloride at 2.8-9.8% in diet rations develop hypertension within a
404 DRINKING WATER AND HEALTH few weeks or months. When unselected rats are used in such experiments, the incidence and severity of hypertension vary directly with the sodium chloride concentration in the diet (Meneely and Dahl, 1961~. Approxi- mately 80% of animals eventually develop some degree of elevated blood pressure (Dahl, 1960~. In selective breeding experiments, "sodium-sensi- tive" and "sodium-resistant" strains can be produced by inbreeding separately rats that do and rats that do not develop hypertension in response to sodium chloride (Dahl, 1972~. Among genetically sodium- sensitive rats, young animals are more sensitive to the ejects of sodium than adults (Meneely and Dahl, 1961~. When hypertension becomes established in these animals, it is not corrected by reducing sodium intake (Tobian et al., 1969~. Despite many generations of inbreeding, the sodium-sensitive animals will maintain normal blood pressure through- out life if they are never exposed to excessive intake of sodium (DahI, 1972~. Although there is not general agreement as to the exact mechanism by which excess sodium ion induces hypertension, considerable evidence has accumulated in the last few years that it involves the regulatory mechanisms governing the renal excretion of sodium. Transplantation of kidneys between sodium-resistant and sodium-sensitive rats results in a blood-pressure increase in the rat that receives the sodium-sensitive kidney and a decrease in the rat that receives the sodium-resistant kidney (Dahl et al., 1974~. An important determinant of sodium excretion by the normal kidney is the arterial perfusion pressure (Guyton et al., 1972~. Recent studies have shown that the relationship between perfusion pressure and sodium excretion is altered in sodium-sensitive animals in which hypertension has been induced by sodium feeding. Higher arterial pressure is required to excrete the same quantity of sodium in the hypertensive animals than in pair-matched control animals of the same strain whose blood pressure remains normal on high sodium intake (Tobian, 1975~. Correlative data from several other types of experiments support the importance of sodium excretion as a central determinant of arterial blood pressure in all forms of hypertension, and in normal animals as well. In recently developed strains of"spontaneously hypertensive rats" (highly inbred animals), hypertension develops spontaneously and does not require induction by sodium ion or other identifiable environmental factors (Okamoto, 1969~. Hypertension in these animals is corrected by transplanting into them kidneys from normal animals (Bianchi et al., 1973~. From these and other data, it has been suggested that hypertension in the spontaneously hypertensive rat is related to a genetically
Inorganic Solutes 405 determined alteration in renal sodium excretion similar to that induced by sodium loading in the sodium-sensitive rat (Coleman et al., 1975~. In animals made hypertensive by constricting one or both renal arteries, hypertension is due primarily to release of renin by the ischemic kidney (Gross, 1971~. In recent studies of this form of hypertension, a one-kidney model (one kidney constricted, the other excised) and a two- kidney model (one kidney constricted, the other intact) have been used for examining interrelations among blood pressure, sodium ion, and renin (Gavras et al., 1973~. Experiments with these models and with inhibitors of the renin-ang~otensin system have revealed that, when sodium ion is depleted, arterial blood pressure becomes dependent on the renin-angiotensin system, and that, during sodium loading, the renin- angiotensin system is depressed and arterial pressure depends on sodium ion (i.e., plasma volume). Studies in normotensive animals strongly suggest that this interaction between sodium and the renin-angiotensin system is a primary determinant of blood pressure in normal animals as well (Gavras et al., 1973~. Hypertension may be developed in rats by giving mineralcorticoids, such as desoxycorticosterone (DOC) (Selye et al., 1943~. However, if the animals are maintained on a low-sodium diet, hypertension does not develop (Gross, 1960~. It appears that the mechanism by which these animals become hypertensive is related to the sodium-retaining action of DOC on the renal tubule. Nephrectomized animals become hypertensive (renoprival hyperten- sion) on ordinary rations. However, if sodium and water intake are restricted, or if plasma volume is maintained by filtration and dialysis, hypertension is prevented or, if established, is corrected and controlled (Braun-Menendez and Covian, 1948~. During the last decade, sophisticated computer models of the circula- tion have been devised that include all known physiologic control loops. Studies with such models have demonstrated that some alteration in renal excretion of sodium is necessary to produce permanent hypertension (Guytonet al., 1972~. Clinical Studies in Hypertensive Human Subjects One of the earliest modes of elective treatment for human hypertension was the "rice diet," consisting of rice and fresh fruit and little else (Kempner, 1948~. This diet has repeatedly been shown to be elective in lowering blood pressure in approximately 707 of patients with hypertension. The rice diet provides approximately 200 mg of sodium per day. It has been shown that it is the sodium restriction that is responsible for the lowering of blood pressure (Dole et al., 1950; Dahl, 1972~. Smaller degrees of sodium restriction do
406 DRINKING WATER AND H"LTH not consistently lower blood pressure in established hypertension (Hatch et al., 1954~. Conversely, a very high dietary intake of sodium raises blood pressure in patients with hypertension (Perera and Blood, 1947~. Removal of sodium by regular daily use of diuretic medications is a well-established principle of modern antihypertensive therapy (Page and Sidd, 1973~. Use of diuretics alone is elective in significantly reducing blood pressure in 40 66% of patients with hypertension (Conway and Lauwers, 1960; Brest, 1960~. A continuing reduction in plasma volume resulting from diuretic therapy occurs in patients who respond to these medications with a reduction in blood pressure (Tarazi et al., 1970) and is thought by many investigators to be responsible for their electiveness. In most patients with kidney failure, there is a direct relationship between sodium intake and blood pressure (Ulvila et al., 1972~. In such patients, blood pressure is controlled by reducing sodium intake or by reducing plasma and extracellular fluid volume with diuretics, dialysis, or filtration procedures (Verses et al., 1969; Ulvila et al., 1972~. Patients who fail to respond to sodium (volume) depletion can be shown to have renin- dependent hypertension and respond to volume depletion after bilateral nephrectomy (Verses et al., 1969~. In normal subjects, large loads of sodium do not consistently influence arterial blood pressure in short-term experiments (Kirkendall et al., 19721. No carefully controlled long-term study has been done to assess the effects of chronic salt loading in normal subjects. Epidemiologic Studies Long-term longitudinal studies of U.S. popula- tion samples (Kennel et al.; 1969, Kannel et al., 1969a; Chiang et al., 1970) have demonstrated beyond doubt that increased blood pressure, of whatever degree, conveys an important risk of cardiovascular disease. Epidemiologic data bearing on the possibility of preventing hyperten- sion have been reviewed recently (Page, 1976~. It is universally agreed that a genetic factor is important in determining susceptibility to hypertension (Ostfeld and Paul, 1963~. The exact mode of inheritance has not been clearly established (Thomas, 1973~. However, most studies favor the interpretation that a polygenic, rather than single-gene, mode of inheritance best explains the existing data on familial occurrence (Pickering, 1965; Miall and Chinn, 1973; Ostfeld and Paul, 1963~. Both systolic blood pressure and diastolic blood pressure tend to rise with age in the United States (U.S. Center for Health Statistics, 1964) and most other industrialized countries (Hamilton et al., 1954; Miall and Chinn, 1973; Kahn et al., 1972~. Although hypertension is most commonly recognized in the fourth and fifth decades of life, recent
Inorganic Solutes 407 studies have shown that an upward trend in blood pressure is present in childhood (Zinner et al., 1971, Buck 1973) and that the children of hypertensive parents have higher blood pressure and a stronger upward trend than the children of normotensive parents. These trends are detectable as early as the age of 2 yr (Zinner et al., 1971~. Although long-term prospective studies on the children of hyperten- sives are still incomplete, available data strongly suggest that early trends in blood pressure presage later expression of hypertension and that efforts to prevent hypertension might best be directed toward infants and young children who are beginning to show age-related upward blood-pressure trends (Buck, 1973~. Population studies in many parts of the world show blood pressure rising with age and prevalences of hypertension comparable with those seen in the United States. Nevertheless, studies of a substantial number of societies that are outside the major Western culture disclose an absence of hypertension and little or no tendency of blood pressure to increase with age. These low-blood-pressure populations represent many different racial groups, climates, customs, and modes of subsistence. When comparisons are made between these populations and people of similar origin who have been assimilated into Western civilization, the accultu- rated groups show blood pressure rising with age. Thus, low-blood- pressure populations are not genetically protected from rising arterial pressure. Explanation must be sought among environmental factors. Low-blood-pressure populations include Chinese aborigines (Morse and Beh, 1937~; Greenland Eskimos (Thomas, 1927~; Melanesian tribes from several areas in New Guinea (Whyte, 1958; Maddocks, 1967) and the Solomon Islands (Page et al., 1974~; Polynesians from isolated islands in the Fiji (Maddocks, 1961), Cook (Prior et al., 1968), Caroline (Murrill, 1949), and Tokelau (Prior et al., 1974) groups; Easter Islanders (Cruz- Coke et al., 1964~; Australian aborigines (Abbie and Schroder, 1960~; nomadic tribes in Kenya (Shaper et al., 1969~; Congo pygmies (Mann et al., 1962~; bushmen of the Kalahari Desert (Truswell et al., 1972~; Masai from Tanzania (Mann et al., 1964~; West Malaysians (Burns-Cox, 1970~; and South and Central American Indians from Chile (Cruz-Coke, et al., 1973), Brazil (Lowenstein, 1961), Surinam (Glanville and Geerdink, 1972), and Guatemala (Hoobler et al., 1965~. By contrast, rising blood pressure with age and clinical hypertension have been seen in acculturat- ed town-dwelling persons of nearly all these diverse populations. Acculturation, or the assimilation into the dominant culture of persons from traditionally oriented preindustrial societies, affects nearly every aspect of life. Most often, the multiplicity of forces acting simultaneously
408 DRINKING WATER AND H"LTH makes it impossible to determine the effect of a single factor on biologic changes, such as blood-pressure trends, within populations. Obviously, such factors as general health and nutrition, weight, psychosocial stresses, and the totality of changes involved in acculturation must be considered in interpreting such changes. Low-blood-pressure populations with markedly different diets have been described (Page, 1976~. Change toward a more Westernized diet is a universal feature of acculturation. For example, salt, canned meat and fish, rice, wheat, flour, and sugar progressively supplant traditional dietary items (Page, 1976~. In long-term population studies in many countries, weight gain has been the most consistent factor in predicting hypertension (Epstein and Eckoff, 1967; Kahn et al., 1972~. The tendency toward rising weight and blood pressure is complex and may be partly genetically linked (Thomas, 1973~. Whereas mean weight in industrialized societies tends to rise with age, this is not true in many preindustrial societies (Page, 1976~. However, acculturation is often associated with rising weight, and it is difficult to separate this change from other ejects of changed diet and activity. Among low-blood-pressure populations, low sodium intake has been an invariable feature of habitual dietary patterns (Shaper, 1972; Page, 1976~. Where quantitative data are available, sodium intake among tow- blood-pressure populations averages less than 2,000 mg/day (Dahl, 1972; Page et al., 1974~. Upper limits have not been established. Statements to the contrary have been unsupported by data and appear to be based on an assumption that availability of salt, as in coastal peoples or inhabitants of small islands, is necessarily associated with high sodium intake. The available evidence fails to support this assumption (Page, 1976~. In a detailed analysis of six Solomon Islands societies (Page et al., 1974), blood pressure was found to be rising with age in females of the three more acculturated populations, but not in the three less acculturat- ed. All six societies were relatively unacculturated by Western standards, and weight decreased with age in all. Blood-pressure trends were correlated best with sodium intake. The highest blood pressures were found among a group (third out of six in acculturation rank) who had by far the highest sodium intake. A similar relationship between blood pressure and sodium intake has been reported among Polynesians (Prior et al., 1968) and Indians in Brazil (Lowenstein, 1961) and the southwest- ern United States (Strotz and Shorr, 1973~. Dahl (1960) reported a rough correlation between sodium intake and prevalence of hypertension among populations. Examples of populations with very high sodium intake and high prevalence of hypertension include northern Honshu, Japan (Dahl, 1960) and coastal fishing villages of Newfoundland (Fodor et al., 1973~.
Inorganic Solutes 409 With some exceptions, studies of blood pressure and sodium excretion have failed to show clear-cut correlations between these variables in either black or white populations in the United States (Dawber et al., 1967; Langford and Watson, 1975~. Lack of significant correlation in intrapopulation studies has been interpreted as evidence against an important etiologic role for sodium in human hypertension. However, the lack of correlation can be equally well explained by the presence of widely variable genetic susceptibility to the effects of sodium on blood pressure plus a high average sodium intake in the population in question. In these circumstances variation in blood pressure m7~v he related more .~, to the genetic factor than to sodium intake. In the United States, blood-pressure averages are higher, and the prevalence of hypertension is greater among blacks than among Caucasians (Stamler et al., 1960~. In addition, socioeconomic and urban- rural trends have been identified in both whites and blacks with higher arterial pressure in the lower socioeconomic and the more rural populations (Langford et al., 1968~. Differences in urinary sodium excretion are not correlated with these trends. However, higher sodi- um:potassium and sodium: calcium ratios are found in the groups with higher arterial pressure (Langford and Watson, 1971~. More research in these areas should be encouraged. Especially Susceptible Segments of the Population Data from British studies suggest that a significant number of "crib deaths" (sudden unexpected deaths between the ages of 2 weeks and 2 yr) may be due to hypernatremia, and that some infants who do not die may sustain permanent brain damage from hypernatremia. A number of such deaths have been attributed to the use of dry feeding formulas reconstituted with water that is high in sodium (Robertson, 1975~. Adult Patients Requiring Low-Sodium Diets The National Center for Health Statistics, on the basis of a representative survey sample of 15,778 subjects aged 12-74 yr, estimated that 2.8%, or approximately 6.2 million Americans, are currently on low-sodium diets prescribed for reasons of illness. The low-sodium diets most commonly prescribed limit the patient to either 2.0, 1.0, or 0.5 g of sodium for 24 h. Where water supplies contain more than 20 mg/liter, dietary sodium restriction to less than 1.0 g/day is difficult to achieve and maintain. White et al. (1967) concluded that 40% of municipal water supplies sampled are unsatisfactory for use with diets that limit sodium strictly.
410 DRINKING WATER AND HEALTH ANALYSIS Quantitative analysis of sodium in water poses no serious technologic or methoclologic difficulty. Flame-emission spectrophotometry is the meth- od for determining sodium ion in solution. It measures the light energy emitted by the sodium ions in aqueous solution after excitation of the sodium atom by passage into a flame. Flame-emission spectrophotometry has advantages of simplicity, speed, and sensitivity, with precision comparable with that of the older and more difficult gravimetric method. SUMMARY AND RECOMMENDATIONS The healthy population includes a large segment (15-20370) who are at risk of developing hypertension. There is evidence linking excessive soclium intake to hypertension, but for man the evidence is largely indirect. The risk of hypertension depends on genetic susceptibility and is influenced by other factors in addition to sodium intake. The development of hypertension is characterized by long latency and slowly rising blood pressure, entering the hypertensive range in middle life. People at greatest risk cannot be identified with certainty in advance. For most people, the contribution of drinking water to sodium intake is small in relation to total dietary intake. Because drinking water is an obligatory dietary ingredient, concentra- tions should be maintained at the lowest practicable levels, and trends toward increasing concentrations of sodium in water supplies as a result of deicing and water-softening procedures should be discouraged. Optimal concentrations of sodium should be regarded as the lowest feasible. Specification of a "no-observed-adverse-health-effect" level in water for a substance like sodium for which the effect is associated with total dietary intake and for which usual food intake is already greater than a desirable level is impossible. The defining of upper allowable limits is inevitably arbitrary. Reduc- tion in hypertension for a small segment of the U.S. population who are on severely restricted diets requires a total intake of sodium less than 500 mg/day. These persons need water containing less than 20 mg/liter . . soc Alum ton. A larger proportion of the population, about 3~O, is on sodium restricted diets calling for sodium intake of less than 2,000 mg/day. The fraction of this that can be allocated to water varies, depending on medical judgment for individual instances. Knowledge of the sodium ion content of the water supply and maintenance of it at the lowest
Inorganic Solutes 411 practicable concentration is clearly helpful in arranging diets with suitable sodium intake. It appears that at least 40% of the total population would benefit if total sodium ion intake were maintained not greater than 2,000 mg/day. With sodium ion concentration in the water supply not more than 100 mg/liter, the contribution of water to the desired total intake of sodium would be 10% or less for a daily consumption of two liters. Research Needs 1. A large and impressive body of data has been accumulated that relates excessive sodium intake to the development of hypertension. Nevertheless, the role of sodium in hypertension remains controversial. Genetic factors, hormones, other dietary factors, and psychosocial stresses also influence blood pressure in important ways. Research should be encouraged to clarify the relative roles and interactions of these influences and the mechanisms by which blood pressure is affected at the physiologic and cellular levels. 2. More information is needed on the average daily intake of sodium, potassium, calcium, and trace metals by different segments of the U.S. population and on the relative contributions of water and other dietary sources to intake. 3. Also more information is needed on day-to-day and seasonal variations in the composition of water supplies and on the variation in water intake in different segments of the population. 4. Removal of sodium from water by methods currently available is expensive and inefficient. Research directed to developing efficient methods for bulk desalinization of water should be encouraged. 5. Use of sodium chloride for deicing roads results in an increase of the sodium content of public water supplies. Research should be continued toward alternative methods of highway ice control. Nitrate OCCURRENCE Nitrate ion is the thermodynamically stable form of combined nitrogen for terrestrial, oxygenated aqueous systems. Accordingly, there is a tendency for all nitrogenous materials in natural waters to be converted into nitrate. All sources of combined nitrogen must, therefore, be regarded as potential sources of nitrate. Major point sources of combined nitrogen are municipal and industrial
412 DRINKING WATER AND HEALTH TABLE V-22 Well Depth and Nitrate Content of Water Concentration of Nitrate (as Nitrogen)a Depth No. 0.2 Well, m Analyses mg/liter 0.8 480 9-15 926 1~30 31~0 Over 60 1,568 2,042 3,828 87 80 64 61 55 2 10 mg/liter mg/liter 56 28 40 20 18 5 0.6 20 mg/liter 13 10 5 1.8 0.7 0.1 (From Larson and Henley, 1966) Percentages of analyses having nitrate equal to or greater than each of the four concentrations shown. wastewaters, refuse dumps, animal feed lots, and septic tanks. Disuse sources include runo~or leachate from manured or fertilized agricultural lands, urban drainage, and biochemical nitrogen fixation. Some tenths of a milligram per liter of combined nitrogen occurs in rainfall from solution of atmospheric ammonia and oxides of nitrogen. In the Community Water Supply Survey of the Bureau of Water Mvs~iene in 1969 the range of nitrate concentrations found was 0.~127 ~ ~ - - ~ ~ cat -. _.. . . . . ^~ ~^1 ~ ~:~1 ~:~ u^A mg/liter. Nineteen systems, about ergo or those exammea for Moran;, mu concentrations in excess of the recommended limit of 45 mg/liter. Groundwaters from shallow wells often have large concentrations of nitrate. Statewide records in Illinois (Table V-22) show high nitrate to be more common in wells less than 50 feet deep (Larson and Henley, 1966~. For example, 81% of 221 dug wells and 34% of drilled wells in Washington County, Illinois, contained more than 10 mg/liter of nitrate-N. Farm ponds had less than 3 mg/liter nitrate-N (Dickey et al., 1972~. Analyses of over 5,000 waters in Missouri showed that 27% of the waters contained nitrate-N in excess of 10 mg/liter (Smith, 1970~. Concentrations of nitrate in farm ponds were much less, similar to those found in Illinois. In Wisconsin, 45% of 250 wells that were examined twice monthly for more than a year consistently yielded water containing more than 10 mg/liter nitrate-N and 71% of the well waters exceeded this level at least once (Crabtree, 1970~. In Nassau County, New York, 370 wells supply 1.5 million people. In 1969, water from 20 of these wells showed more than 10 mg/liter nitrate-N (Smith and Baler, 1969~. In Southern California, certain public water supplies have exceeded 10 mg/liter nitrate-N since 1935. In Hall County, Nebraska (Piskin, 1973), nitrate concentrations in well-water samples were related to characteristics of the unsaturated zone. Hydraulic conductivity of the unsaturated zone permitted excessive
Inorganic Solutes 413 water and nitrate of the surface to reach the aquifer at 1~100-ft depth (Table V-23~. Observations on fertilized soils in Illinois showed no signs of nitrate percolation to groundwater. No observations were made on sandy soils. The U.S. Geological Survey has records on nitrate concentrations in six major rivers from 1950 to 1970. Trends toward increasing concentra- tion were indicated for the Delaware, San Joaquin, and Ohio Rivers. No distinct trend was observed in the Colorado River, and trends to decreased values were noted for the Missouri at Nebraska City and the Brazos River. Overall concentrations ranged from 0.~.5 mg/liter nitrate-N. Analyses by the Illinois State Water Survey since 1945 show trends toward increased nitrate for the Wabash, Ohio and Mississippi Rivers (Harmeson et al., 1973~. For other streams within Illinois the trends to greater concentrations were sharper than those of the major rivers. Characteristically, the highest levels occurred during the spring rainy season in the smallest watersheds, where intensive cultivation of row crops necessitated high fertilization and tile drainage (Harmeson, et al., 1971~. In 1897-1899, the load from the Illinois River at Kampsville was calculated to be 2.33 kg n~trate-n~trogen/ha/yr, and in 1900 1902, the load was still 2.33 kg/ha/yr (Palmer, 1903~. In 195~1961, at nearby Peoria, the load was 8.6 kg/ha/yr; in 1961-1966, it was 13.6 kg/ha/yr; and in 196~1971, it was 16.7 kg/ha/yr (Harmeson et al., 19731. When downstream concentrations in surface waters are examined, it must be realized that nitrate levels may decrease by dilution, and by rapid assimilation of nitrate into aquatic plants. Also, when trends are examined it should be recognized that the rate of application of nitrogenous fertilizers increased only gradually from 1945 to 1960, but TABLE V-23 Nitrate Concentration in Water Samples and Sand; Percentage in the Unsaturated Zone in Hall County, Nebraska Nitrate concentration, mg/liter Fraction of Sand in Unsaturated <10 >10 >45 Zone, 5to No. No No. % No. 55 <25 63 77.8 18 22.2 7 8.6 25-50 45 73.8 16 26.2 1 1.6 50-75 69 47.6 76 54.2 3 15.9 >75 99 44.2 125 55.8 34 15.2 Total wells 276 235 - 65 (From Piskin, 1973)
414 DRINKING WATER AND HEALTH TABLE V-24 Estimated Average Daily Ingestion of Nitrate and Nitrite in the United States Nitrate Nitrite Source mg % mg ~ Vegetables 86.1 86.3 0.20 1.8 Fruits, juices 1.4 1.4 0.00 0.0 Milk and products 0.2 0.2 0.00 0.0 Bread 2.0 2.0 0.02 0.2 Water 0.7 0.7 0.0 0.0 Cured meats 9.4 9.4 2.38 21.2 Saliva 30.0a 8.62 76.8 Total 99.8 100 11.22 100 aNot included in total. (From J. White, Jr., Journal of Agricultural and Food Chemistry, 23:886, 1975) increased fivefold from 1960 to 1967 and then leveled on with only a gradual increase to the present. Nitrate may be biochemically assimilated from water by growing plants or may be converted to gaseous nitrogen in anoxic situations. In oxygenated waters, it is quite stable and not easy to remove. Deni- trification to nitrogen gas and ion exchange are technically feasible processes for nitrate removal, but they have not been extensively developed on a municipal scale. So, concentrations in finished drinking waters at the tap are usually the same as those in the source waters. Other Sources of Nitrate Ordinarily, the major human intake of nitrate is from food rather than from water. The mean food intake for nitrate plus nitrite in the United States has been estimated to be nearly 120 mg/day Semite, 1975), most of it coming from vegetables such as celery, potatoes, lettuce, melons, cabbage, spinach and root vegetables, some of which may contain several thousand parts per million of nitrate (Table V-24. Nitrate is secreted in the saliva, the mean value being about 40 mg/day, of which about 10 mg/day is reduced to nitrite and found in that form. These quantities, although internally derived, also represent inputs to the gastric system. The variability from individual to individual must be very high, because different classes of foods vary significantly in nitrate content from near zero for fruits, milk, and cereal products to thousands of parts per million for certain vegetables. Aside from vegetables, the next largest contribution comes from cured meats. The history of use of nitrate and
Inorganic Solutes 415 nitrite for meat-curing has recently been reviewed (Binkerd and Kolari, 1975~. The amounts of nitrate and nitrite used in meat-curing have been on the decline for many years, and regulations expected to be promulgat- ed in the near future will decrease their use even further. Thus, it is likely that vegetables will continue to supply the bulk of dietary nitrate. Man's exposure to nitrite is also summarized in Table V-24. Most is a result of reduction of nitrate in saliva (Tannenbaum et al., 1974) to nitrite. However, other routes of reduction may occur. METABOLISM Little is known of nitrate metabolism in man. It is generally assumed that absorption takes place in the upper portion of the small intestine and that excretion is primarily, if not exclusively, through the kidney (Sollman, 1957~. It is well known that nitrate is absorbed in the upper gastrointestinal tract (Sollman, 1957) and concentrated from the plasma into saliva by the salivary glands (Burger and Emmelin, 1961~. Although the rate of clearance of salivary constituents is highly variable, the cleansing of mucosal surfaces is quite efficient, and clearance is rapid (Gibbons and van Houte, 1975~. A great deal of effort has gone into the study of iodide distribution in man, but very little into the study of nitrate distribution. However, Burgen and Emmelin (1961) summarized a number of studies that suggested that nitrate is transported by the same ion-transport system as iodide, perchlorate, and thiocyanate. Furthermore, the trans- port system operates in the thyroid, gastric mucosa, and mammary glands, as well as in the salivary ducts. It is of considerable significance that major differences occur among mammalian species in their ability to concentrate nitrate from plasma into saliva (Cohen and Myant, 1959~. Large interspecies differences have also been shown to occur in the elimination kinetics of nitrate (Schneider and Yeary, 19751. Preliminary observations on a number of species have shown that not all animals reduce nitrate to nitrite in saliva (P. M. Newberne, personal communication). Thus, nitrate metabolism in man cannot be readily predicted from animal data. Several studies have suggested that large differences in nitrate metabolism may occur between individuals. These differences can span about three orders of magnitude when all the available data, including diet and physiological status, are taken into consideration. Earlier investigations did not consider the ejects of conversion of nitrate to nitrite in saliva. Recent studies (Tannenbaum et al., 1976a) have demonstrated that high nitrate intake can lead to large increases in the
416 DRINKING WATER AND HEALTH concentration of salivary nitrite. Although the pattern and extent of nitrite concentration valor from individual to individual, all persons tested had very large increases in nitrite concentration after consumption of even a small quantity (50 ml) of celery juice containing sodium nitrate at 1,200 mg/liter. Salivary nitrite concentrations observed after consumption of celery juice are different from those reported by investigators using different foods as nitrate sources. Harada et al. (1975) found nitrate at 600 mg/liter or higher in saliva after ingestion of salted Chinese cabbage. The nitrite observed under these conditions reached about 100 mg/liter. These studies were performed on only a few people. Stephany and Schuller (1974) fed people several vegetables under a variety of conditions and observed increases in nitrite. In one experiment, a cooked onionlike vegetable (postelein) caused an increase in nitrite to about 200 mg/liter in 2 h; it reached 300 mg/liter in 17 h and declined slowly thereafter. In the work of Spiegelhalder et al. (1970), beet juice was the source of nitrate, and maximum nitrite concentration of about 150 mg/liter was observed. There does not appear to be any significant discrepancy among these observations. Two major factors other than nitrate intake determine the salivary nitrite content: the subject's oral microflora and other consti- tuents in the nitrate-containing food. It is not yet possible to construct a complete pharmacokinetic model of nitrate metabolism, but such a mode! will have to incorporate the following salient points (Tannenbaum et al., in press): 1. The half-life for clearance of nitrate, and consequently nitrite, is aboutl2h. 2. The maximal concentration of nitrite in saliva depends primarily on nitrate intake up to approximately 100 mg of sodium nitrate and increases relatively little with intake greater than 100 ma. 3. The nitrate source is as important in determining salivary nitrite concentration as the amount of nitrate consumed. 4. The conversion of nitrate to nitrite depends on the oral microflora. HEALTH ASPECTS Two health hazards are related to the consumption of water containing large concentrations of nitrate (or nitrite): induction of methemoglobine- mia, particularly in infants, and potential formation of carcinogenic nitrosamines. Acute toxicity of nitrate occurs as a result of reduction to nitrite, a process that can occur under specific conditions in the stomach, as well as
Inorganic Solutes 417 in the saliva. Nitrite acts in the blood to oxidize the hemoglobin to me/hemoglobin, which does not perform as an oxygen carrier to the tissues. Consequently, anoxia and death may ensue. Healthy adults are reported to be able to consume large quantities of nitrate in blinking water with relatively little, if any, elect (Bosch et al., 1950; Oregeron et al., 1957~. Acute nitrate toxicity is almost always seen in infants rather than adults. This increased susceptibility of infants has been attributed to high intake per unit weight, to the presence of nitrate- reducing bacteria in the upper gastrointestinal tract, to the condition of the mucosa, and to greater ease of oxidation of fetal hemoglobin (Walton, 195 1). Gastric pH greater than 4 is conducive to the growth of nitrate- reducing bacteria. Such gastric conditions are likely to occur with infants, who are prone to upset stomachs and achlorhydria (Comfy, 1945~. Assessment of maximum nitrate levels in water exhibiting no adverse health erects has been based principally on a study of known cases of methemoglobinemia. The early survey of Walton showed that no cases on methemoglobinemia were reported when the water contained less than 10 mg/liter nitrate as nitrogen. Later, Sattelmacher (1962) found 3% of 467 cases in which the nitrate concentration of the water supply was less than 9 mg/liter as nitrogen and Simon et al. 0964) found 4.4% of 249 cases in which the recorded concentration of nitrate as nitrogen was less than 11 mg/liter. Acceptance of these results as definitive is complicated by several factors: 1. Poor analytical methods. 2. Nitrate analyses frequently were performed some time after the case had occurred and so the concentration at the time of the illness is not really known. 3. Boiling of the water prior to feeding would have concentrated the nitrate over that in the raw water. 4. Incidence of toxicity should be related to total intake of nitrate, not just water concentration. Concurrent ingestion of vegetable puree or juice could have provided much enhanced nitrate intake in some cases. 5. Only one of the U.S. cases has been associated with a public water supply, regardless of nitrate content. It is known that many infants have drunk water in which nitrate as N was greater than 10 mg/liter without developing methemoglobinemia. Studies supplementary to the previous ones in which levels of methemoglobin in the blood of infants were related to concentrations of
418 DRINKING WATER AND HEALTH nitrate in the water being fed have been reported by Winton (1971) and by Shuval and Gruener (1975~. Both studies showed detectable enhance- ment of methemoglobin levels in infants being supplied with water containing nitrate as nitrogen only slightly in excess of 10 mg/liter. Although the full significance to health of increases in sub-clinical levels of methemoglobin is unclear, they presumably represent an onset of the toxicity leading to methemogiobinemia and therefore refer to a maximum level of nitrate for no-adverse-health effects. Normally less than 2% of total hemoglobin is present as methemoglo- bin (Ferrant, 1946; Gross, 1964; Jade and Helter, 1964~. No external signs or symptoms are noted generally as long as the methemoglobin is less than 5%. Between 5 and logo methemoglobin the first signs of cyanosis can be seen (Knotek and Schmidt, 1964~. In trained subjects undergoing work tests, 1~20~o methemoglobin was found to result in impaired oxygenation of muscles. A Russian study of 800 children in day nurseries (Subbotin, 1961) found that over 90~O of them who ingested water with 20~ mg/liter of nitrate had elevated levels of blood methemoglobin and 50% showed levels in excess of 5%. On the other hand, there was no elevation of methemoglobin level with 9 mg/liter of nitrate in the water. It can be concluded that, from the viewpoint of induction of methemoglobinemia, the maximum concentration of nitrate in water exhibiting no-observed-adverse-health effect is close to the interim standard of 10 mg/liter as nitrogen. However, there appears to be little margin of safety for some infants with the standard at this concentration. There appear to be five possible conditions for poisoning of man or animals: 1. The presence of microorganisms in the rumen of cattle causes reduction of nitrate to nitrite. Absorption of the nitrite ion can result in toxicity to cattle (Bradley et al., 1939~. The enlarged cecum and colon of horses also provide a location for microbial reduction of nitrate (Bradley et al., 1940; Knotek and Schmidt, 1964~. 2. The more alkaline stomach of infants younger than 4 months old allows growth of microorganisms that can reduce nitrate to nitrite: therefore, high-nitrate water can be toxic to the very young (Knotek and Schmidt, 1964; Richards and Knowles, 1969; Schuphan, 1965~. 3. When processed or unprocessed spinach is stored under conditions permitting growth of microorganisms, nitrate can be reduced to nitrite. Spinach left at room temperature for some time after cooking or after a jar of baby food has been opened has caused toxicity in babies. Other
Inorganic Solutes 419 vegetables or prepared foods high in nitrate can also cause problems (Schuphan 1965; Simon, 1966; Sinios and Wodsak, 1965~. 4. Nitrite has occurred in damp forage materals that were high in nitrate. Ingestion by livestock proved toxic (Olson and Moxon, 1942~. 5. There have been cases of outright nitrite poisoning where the legal limit for food additives has been exceeded by a factor of 10 or where nitrite has been mistaken for common salt. A summary of studies on direct acute toxic effects of ingestion of nitrate-and nitrite by different species of animals, including man, has recently been published (Ridder and Oehme, 1974~. Excerpts from their report are presented in the following paragraphs: Monogastric animals are more tolerant to excessive levels of nitrate in their diet than are ruminants. Dogs have been fed up to Ho (20,000 ppm) nitrate in their diet without any adverse health effects (Olson et al., 1972; USPHS, 1962~. Rats have been fed approximately 1% (10,000 ppm) nitrate for a lifetime without adverse effects (USPHS, 1962~. Healthy human adults are reported to be able to consume large quantities of nitrate in drinking water with relatively little, if any, effects (Bosch et al., 1950; Oregeron et al., 1957~. However, the physiological effects noted with ingestion of nitrate in food and water are variable. This may be explained by the metabolic and physiologic differences existing between animals. Toxicity usually results when nitrate in the food is reduced to nitrite prior to ingestion. Under specific conditions, this reduction can occur in the stomach. Some tissues of all animals are able to reduce nitrate to nitrite. In swine, larger doses of nitrites are required to produce the methemoglobin levels necessary for acute toxicity (Curtin and London, 1966~. The pig was found to have the slowest rates of methemoglobin formation and methemoglobin reduction (Smith and Beutler, 1966~. A relative lack in response to treatment with methylene blue was also noted. Swine are only susceptible to nitrite when the nitrite is pre-formed (Blood and Henderson, 1968~. The toxic level of nitrites for pigs is listed as 88 mg/kg. Some of the clinical signs of chronic nitrate toxicity in swine are vitamin A deficiency, thyroid dysfunction, decreased rate of gain, arthritic conditions, and abortions. Lymphocytic leukocytosis and erythrocytosis have also been reported (Curtin and London, 1966~. Nitrate, when given orally to dogs was reduced to nitrite, but the amount reduced varied from practically none to a quantity sufficient to bring about methemoglobinemia (Singer, 1968~. When given orally or intravenously, the nitrate ion caused over-excretion of chloride, resulting in hypochloremia, alkalosis, and digestive disturbances (Green and Hiatt, 1954~. Dehydration occurred due to the diuretic effect of nitrates (Green and Hiatt, 1955~. The physiologic effects of nitrate toxicity in humans are largely unknown. Acute nitrate toxicity is almost always seen in infants rather than adults, and results from ingestion of well waters and vegetables high in nitrates. Comly (1945) deduced that infants were prone to upset stomachs and achlorhydria. As a result,
420 DRINKING WATER AND H"LTH the stomach pH increased in alkalinity allowing nitrate-reducing organisms to enter and to reduce nitrates to nitrites. A gastric pH above 4 supports nitrate-reducing organisms (Bosch et al., 1950; American Academy of Pediatrics Committee on Nutrition, 1970~. Digestive disorders causing injury to the gastrointestnal mucosa and the resulting increased absorption was evident in several cases of infant methemoglobinemia reported in Minnesota (Bosch et al., 1950~. Immature enzyme systems may also be of importance (Comfy, 1945~. Methemoglobin formation rate in human adults is close to the rate observed in cattle. However, in man, the rate of methemoglobin reduction occurred the fastest of all species studied (Smith and Beutler, 1966~. Approximately 1% of the adult hemoglobin is present as methemoglobin (Jaffe and Heller, 1964~. This constant concentration exists as a result of the balance between the oxidation of hemoglobin and the reduction of me/hemoglobin. Fetal hemoglobin (hemoglobin F) is oxidized by nitrite to methemoglobin at a rate twice as rapid as adult hemoglobin (hemoglobin A). Furthermore, the enzymatic capacity of the erythrocytes of newborn infants to reduce methemoglobin to hemoglobin appears less than that of adults (Jaffe and Heller, 1964~. The difference is probably due to a developmental deficiency in the activity of DPNH-methemoglob~n reductase (diphosphopyridine nucleotide) (Jaffe and Heller, 1964~. As opposed to adults, several clinical, physiologic, and metabolic factors predispose infants to develop- ment of methemoglob~nem~a and acute nitrate poisoning. Several studies have been conducted on long-term chronic feeding of nitrite to rats. In one study (Druckrey et al., 1963), rats received sodium nitrite at 100 mg/kg in drinking water daily during their entire life span over three generations; no evidence of chronic toxicity, carcinogenicity, or teratogenicity was found. A second investigation (Greenblatt et al., 1973) involved feeding sodium nitrite alone or with amino acids to rats for 67 weeks, for a total dose of 3.35 g of sodium nitrite per rat; no eject was seen in any of the animals receiving nitrite. A third study (Van Logten et al., 1972) involved feeding rats canned meat processed with sodium nitrite at 5,000 ppm over a lifetime; no eject was seen in any of a large variety of chemical, biochemical or histopatho- logic indexes in the test animals. However, in other laboratory studies (Shuval and Gruener, 1972) chronic exposure of rats to sodium nitrite at 2,000 and 3,000 mg/liter in drinking water for 2 yr was associated with distinct pathologic changes in heart and lung tissues. Also, mice chronically exposed to sodium nitrite at 1,000 and 2,000 mg/liter in dunking water showed reduced motor activity. BEG recordings from implanted electrodes revealed major changes in brain electric activity in rats receiving nitrite at 100-2,000 mg/liter. These changes persisted after exposure to nitrite ceased. Gruener et al. 0973) showed that transplacental passage of nitrite occurred in pregnant rats given doses at 2.5-50 mg/kg orally or
Inorganic Solutes 421 interperitoneally with production of methemogiobinemia in the fetuses. The concentrations of nitrite and methemoglobin reached in the fetal blood were lower than those in the maternal blood. Fetal rats were found to have methemoglobin reductase activity approximately 10 times higher than that of adult rats. In contrast, human adult blood exhibited methemoglobin reductase activity 1.5 times higher than did human cord blood (Gruener et al., 1973~. Rats born of dams exposed to nitrite during gestation had high mortality rates and poor growth and development. The other health hazard proposed for nitrate in water, that it may act as a procarcinogen, is much more speculative. A series of reactions is involved by which it is proposed that nitrate in water may be converted to N-nitroso compounds that are the direct carcinogenic agent. The steps in the reaction sequence are: 1. Reduction of nitrate to nitrite. 2. Reaction of nitrite with secondary attunes or amides in food or water to form N-nitroso compounds. 3. Carcinogenic reaction of N-nitroso compound. To the extent that this series of processes actually operates in the human body, nitrate has a capacity to become a procarcinogen. In this event, potential carcinogenesis will be the major hazard involved in the ingestion of nitrate. The full series of reactions has not yet been demonstrated, however, so that the problem is a prospective rather than a realized one. The possible role of nitrate in water in contrast to the role of the normally much greater ingestion in foods has also not been determined. More than one hundred N-nitroso compounds have been tested for carcinogenicity and about 75-80% have been found to cause cancer in animals (Magee and Barnes, 1967; Druckrey et al., 1967; Shank, 1975; Mirvish, 1975a). Although there is no definite evidence that nitrosam~nes or other N-nitroso compounds have induced cancer in man, several suggestive epidemiological correlations have been reported (Clifford, 1970; Fong and Chan, 1973; Burrell et al., 1966; Mirvish, 1972; Gregor, 1974) and there is no reason to suppose that man is not susceptible. Reaction of nitrites and secondary amines or amides occurs readily in acidic solution and particularly at the normal phi range of 1-5 character- istic of gastric contents after a meal (Mirvish, 1975a, 1975b). Moreover, simultaneous feeding of nitrite and amines to mammals results in the formation of mtrosamines in the stomach and the producton of gastric tumors (Sander et al., 1968; Greenblatt et al., 1971; Sander and Schweinsberg, 1972; Mirvish, 1975b; Newberne and Shank, 1973~. On
422 DRINKING WATER AND H"LTH the other hand, cancers were not observed when nitrate and amine were administered together to mice, indicating little reduction of nitrate to nitrite in the mouse stomach. The relation of nitrate concentrations in water supplies to the first step in the reaction sequence for man is still more problematic, however. The major source of nitrite to the stomach, at least for healthy individuals, is the saliva, normally containing 6-15 mg/liter of nitrite (Tannenbaum et al., 1974~. The ingestion of foods, such as vegetables or vegetable juices containing nitrate at hundreds or thousands of milligrams per liter, can lead to much greater salivary concentrations of nitrite, in the range of hundreds of milligrams per liter (Tannenbaum, et al., 1976a,b). However, the erect of concentration of nitrate in drinking water on salivary nitrite concentration is not known. Nitrite may be formed from nitrate in the stomach by bacterial reduction, as discussed in connection with the induction of methemoglo- binemia. Little reduction occurs in man, however, unless the gastric pH is greater than 4.6 (Mucha et al., 1965; Sander and Schweinsburg, 1968~. Thus, the pH condition for formation of nitrite is quite different from the pH range for ready formation of N-nitroso compounds, pH 3.5 or less. Other organs of interest in connection with nitrate reduction and N- nitroso compound formation are the infected urinary bladder, the large intestine and the mouth itself (Mirvish, 1975b). Brooks et al. (1972), for example, found dimethylnitrosamine in the urine of two people having Proteus mirabilis infections of the bladder. Epidemiologically, correlations have been shown to occur between incidence of gastric cancer and concentration of nitrate in the drinking water. For example, Hill et al. (1973) pointed out that the town of Worksop, England, with 90 mg/liter nitrate in the drinking water for many years, had an incidence of gastric cancer 25% greater (loopy greater for those 75 and over) than that of similar control towns. In the control towns, the weekly nitrate intake was about 400 mg (100 mg from meat, 200 mg from vegetables, 100 mg from water) whereas in Worksop the total intake was 900 mg/week, with 600 mg from water. Similarly, it has been shown that the unusually high incidence of stomach cancer in certain mountainous areas of Colombia (Hawksworth et al., 1975; Correa et al., 1975) is associated with high concentration of nitrate in the drinking water. In the area of high cancer incidence, there is 110 mg/liter nitrate in the drinking water compared to much lower values in control low-incidence areas. As much as 180 mg/liter nitrate was found in the urine of persons in the high-incidence area, but never more than 45 mg/liter in the low-incidence regions. Findings such as these are preliminary and suggestive. They provide no
Inorganic Solutes 423 firm evidence of a causal link between incidence of cancer and high intake of nitrate. They do indicate a need for caution in assessment of lack of adverse health ejects even at the 10 mg/liter concentration level for nitrate as nitrogen and a need for continued intensive study on the metabolism and effects of nitrate in man. ANALYSIS A variety of methods for determination of nitrate exists, but none is particularly precise, accurate or sensitive in the milligram per liter concentration range (Schuller and Veen, 1967; Boltz, 1973~. Further development and standardization of analytical methodology will be required if standard routine determinations are to be considered reliable within the range required for proper control and assessment of health effects. Most standard procedures for nitrate determination in the mg/liter range are spectrophotometric. Traditionally, three types of reaction of nitrate have been used as bases: nitration of a phenolic substance to a colored derivative; oxidation of an organic substance to a colored product; and reduction of the nitrate to nitrite or ammonia, followed by reaction of the reduced nitrogenous materials to give colored substances. In addition, direct spectrophotometric determination based on ultraviolet absorption of nitrate at 273 nm is possible and becoming established. Electrochemical determination with the use of a nitrate electrode may also be feasible, but is subject to numerous interferences (Usher and Telling, 1975; Milham et al., 1970; Morie et al., 1972~. With all these techniques there has been a consistent problem of reproducibility. Analyses of samples containing water-soluble organic matter and low concentrations of nitrate tend to give erratic values. These erratic values have been attributed to: reduction of nitrate by organic matter in the presence of strong acids; considerable charring, which contributes color that is measured as nitrate in some procedures; and organic anions, which are often co-extracted and interfere in the determination of nitrate. In oxidation methods, e.g., using brucine, the color developed does not always obey Beer's law, and continual calibration of the standard curve is necessary (Usher and Telling, 1975~. Interference from nitrite, chloride, and carbohydrate has been reported (Usher and Telling, 1975~. Reduction of nitrate to nitrite can be accomplished by the use of various reagents, such as copper, zinc, hydrazine sulfate, cadmium powder, and spongy cadmium (Usher and Telling, 1975~. The reducing agents are not sufficiently specific and most of them give either
424 DRINKING WATER AND H"LTH incomplete reduction or further reduction of nitrite to ammonia. Since nitrite is ultimately determined, both defects tend to give low results. Likewise, reduction of nitrate to ammonia with zinc or any one of a number of alloys or amalgams tends to be incomplete at the concentra- tion levels common in water samples. Because of these analytical problems determinations of nitrate in water samples should not be regarded as valid to better than logo or 1 mg/liter. If suitable methods for the elimination of background interference are developed, then the direct ultraviolet spectrophotometric method may provide greater precision, accuracy and sensitivity. In contrast to the determination of nitrate that of nitrite is highly sensitive to 1 ,ug/liter and generally convenient and accurate. The methods are based on reaction with a primary aromatic amine in acid solution to form a diazonium salt followed by coupling with a second phenol or aromatic amine to give an intensely colored azo dye. CONCLUSIONS AND RECOMMENDATIONS Nitrate in water at concentrations less than a thousand milligrams per liter is not of serious concern as a direct toxicant. It is a health hazard because of its conversion to nitrite. Nitrite is directly toxic by reaction with hemoglobin to form methemogiobin and cause methemoglobinemia. It also reacts readily under appropriate conditions with secondary amines and similar nitrogenous compounds to form N-nitroso compounds, many of which are potent carcinogens. Epidemiological evidence on the occurrence of methemoglobinemia in infants tends to confirm a value near 10 mg/liter nitrate as nitrogen as a maximum concentration level for water with no observed adverse health ejects, but there is little margin of safety in this value. The highly sporadic incidence of methemoglobinemia when drinking water that contains much greater concentration of nitrate is used suggests, however, that factors other than nitrate intake are important in connection with development of the disease. For example, no cases of clinical methemogiobinemia could be found in two recent studies of communities in Southern California and central Illinois, where the water supplies were on occasion found to contain as much as 20 mg/liter of nitrate as N (Shearer, et al., 1972; Winton, et al., 1970~. More research is needed on the metabolism of nitrate and on factors that affect the rate of extent of reduction to nitrite, as well as on those that influence subsequent reaction of nitrite to form me/hemoglobin. Each link in the chain of reactions from nitrate to N-nitroso compound has been shown to occur in some conditions in man or other animals. The
Inorganic Solutes 425 extent of operation of the overall reaction chain in man has not been shown however, nor is there knowledge of the ways in which other environmental or internal factors may affect potential formation of N- nitroso compounds. In particular, relative ejects of salivary nitrate as compared with nitrate in imbibed water have not been elucidated. There is thus little scientific basis to support conclusions on the safety of any concentration of nitrate in water with regard to carcinogenic potential. Sulfate OCCURRENCE Sulfate is found almost universally in natural waters in concentrations ranging from a few tenths of a milligram/liter up to several thousand milligrams/liter. It occurs frequently in rainfall, particularly from air masses that have encountered metropolitan areas, sometimes at concen- trations greater than 10 mg/liter. One of the most important terrestrial sources is evaporite sediment, from which magnesium, sodium and especially calcium sulfate may be leached. Metallic sulfides, such as iron pyrites, occur in both igneous and sedimentary rocks; they are oxidized to sulfate by moist oxygen during weathering processes. Some sulfate is form er1 Inn nvir1~tiv`~ {1P~`' nE organic matter. Sulfate may also enter water courses through waste discharges. Household wastes, including detergents, add 10 or more mg/liter of sulfate to sewage. Tanneries, steel mills, sulfate-pulp mills and textile plants are all important industrial sources of sulfate. In the 1970 survey of drinking water supplies the range of sulfate concentrations for the 969 samples was from less than 1 mg/liter up to 770 mg/liter with a median of 46 mg/liter. Twenty-five supplies, about 3% of those tested, showed sulfate in excess of the maximum recommend- ed value in the 1962 U.S. Public Health Service Drinking Water Standards (250 mg/liter). Similar results were obtained in the Interstate Water Carrier Analyses of 1975 (USEPA, 1975~. Of 625 supplies analyzed, 21 or 3.4% were found to contain sulfate greater than 250 mg/liter, the greatest concentration being 978 mg/liter. Once sulfate has been dissolved in water, it becomes a permanent solute except when it is anaerobically reduced to sulfide and precipitated in sediments, released to the atmosphere as H2S, or incorporated in living organic matter. Most inorganic sulfates are quite soluble except for the lead and barium salts. Sulfate is not removed from water by any of the common treatment processes. Desalination techniques such as ion ~ _ . be, A, ~ _~ i,, _ ~__~, in.
426 DRiNKiNG WATER AND H"LTH exchange, reverse osmosis or membrane electrodialysis must be em- ployed. HEALTH ASPECTS The major observed health effect of sulfate is its laxative action. Peterson (1951) observed that when the laxative doses of Glauber's salt, Na2SO4, and Epsom salt, MgSO4, were translated into water concentrations based on a 2-liter daily supply, the laxative concentrations should be 300 mg/liter for Na2SO4 and 390 mg/liter for MgSO4. Results of a survey on the reactions of water consumers by the North Dakota State Department of Health (Peterson, 1951) indicated that a laxative eject was perceived at 750 mg/liter, but not at 600 mg/liter or less. The presence of Mg+2 at a concentration about equivalent to that of sulfate made the laxative effect manifest at lesser sulfate concentrations. A more detailed analysis of the data by Moore (1952) led to the conclusion that most people experienced a laxative effect when sulfate plus magnesium exceeded 1,000 mg/liter. Moore's tabulation of the data is shown in Table V-25. An et al. (1967) reported that concentrations of sulfate in water between 500 and 1,000 mg/liter caused slight, but significant, decrease in acidity TABLE V-25 Laxative Effect of Well Water Containing Magnesium and Sulfate Laxative Effects Percent Substance Concentration, No. Effects Not of"Yes" in Water mg/liter Wells Yes No Stated Answers Magnesium 0-200 51 9 34 8 21 plus 200-500 45 7 27 11 21 sulfate 500-1,000 56 11 28 17 28 1,000-1,500 36 18 10 8 64 1,500-2,000 14 6 4 4 60 2,000-3,000 21 13 3 5 81 Over 3,000 14 5 1 8 83 Sulfate 0-200 56 10 36 10 22 200-500 47 9 28 10 24 500-1,000 56 13 26 17 33 1,000-1,500 34 16 10 8 62 1,500-2,000 16 9 4 3 69 2,000-3,000 20 9 3 8 75 Over 3,000 8 3 0 5 100 aBased only on total of ''yes" and ''no" answers. It is probable that a large proportion of the wells for which no statements were made were not regularly used as water supplies. (From Moore, 1952)
Inorganic Solutes 427 TABLE V-26 Influence of Sulfates on the Taste of Water and Coffee Threshold Concentration, mg/liter Median Range Average Compound Salt Anion Salt Anion Salt Anion Na~SO4 350 327 250-550 169-372 CaSO4 525 340 250-900 177~35 MgSO4 525 4 1'9 400~00 320~7'9 500 400 (From Lockhart fit al., 1955) of gastric juice. Also, persons living at Shumilova Settlement (USSR) experienced diarrhea and taste deterioration when the concentration of sulfate increased from 571-1,235 mg/liter. Korotchenok (1946), however, reported that there were no acute toxic effects noted in Western Turkmenia (USSR) from the consumption of water with as much as 1,295 mg/liter of sulfate. Macfayden (1953) reported on one village in British Somaliland that was using a water containing sulfate at a concentration about 4,400 mg/liter. Studies by Digesti and Weeth (1973) gave results indicating that growing cattle can tolerate water containing sulfate at 2,500 mg/liter without ill effect. They concluded, moreover, that this value was nearly the maximum safe concentration. The taste threshold for sulfate in water has been reported to lie between 300 and 400 mg/liter (Whipple, 1907; Lockhart et al., 1955~. Table V-26 shows a summary of the data. The 1962 Drinking Water Standards of the U.S. Public Health Service recommended that sulfate in water should not exceed 250 mg/liter, except when no more suitable supplies are or can be made available. The World Health Organization, in its European Standards For Drinking Water, set a sulfate limit of 250 mg/liter (WHO, 1970~. OTHER ASPECTS Ingleson et al. (1949) state that sulfate appears not to increase the corrosion of brass fittings in domestic water systems. Holl (1935) found that concentrations of sulfate less than 200 mg/liter do not increase the plumbosolvency of water. Kellam (1933) has reported that sulfate at concentration less than 25 mg/liter has little effect on the corrosiveness of water toward concrete,
428 DRINKING WATER AND H"LTH but Hammerton (1945) claims that concentrations greater than 1,000 mg/liter cause rapid corrosive attack. Great concentrations of sulfate may be toxic to plants. According to Schofield (1936) water containing more than 960 mg/liter of sulfate is unsuitable for irrigation. ANALYSIS The preferred standard technique for determination of sulfate is precipitation of barium sulfate followed by ignition of the collected precipitate. Results for concentrations in the range of 100 mg/liter have shown standard deviations near 5%; the sensitivity is about 1 mg/liter (American Public Health Association, 1976~. Routine determinations can be performed more conveniently with only slight decrease in precision by collecting and drying the barium sulfate on a frilled glass or membrane filter, rather than igniting it. Turbidimetric measurement of precipitated barium sulfate is rapid and particularly suitable for concentrations of sulfate less than 100 mg/liter. The limiting sensitivity remains nearly 1 mg/liter, however. CONCLUSIONS AND RECOMMENDATIONS No adverse health ejects have been noted for concentrations of sulfate in water less than about 500 mg/liter. The only observed physiological effect at greater concentrations to more than 1.000 mn/liter has been the induction of diarrhea. The taste threshold for sulfate in water lies between 300 and 400 mg/liter for most persons, but some individuals are able to detect as little as 200 mg/liter. , ~ Summary Other Inorganic Constituents ARSENIC Arsenic is widely distributed in the waters of the United States but generally in low concentration. In 728 samples of surface water, the concentration of arsenic ranged from less than 10 ,ug to a maximum of 1,200 ,ug/liter. The median value for arsenic in river waters was less than 10 ,ug/liter. High levels of arsenic in well waters have also been reported; occasionally exceeding 1 mg/liter. Waters may be contaminated with many different forms of arsenic, each of which has different toxicological properties. Arsenic occurs in
Inorganic Solutes 429 many different forms which vary in their solubility and other physical and chemical properties. Those of most concern are water-soluble compounds. Arsenic is found in pork, poultry and shellfish; the last may contain up to 170 ppm. The daily median intake of arsenic in the United States from all sources has been estimated to be 137-330,ug. A major problem in understanding the metabolism and toxicity of arsenic has been the difficulty in finding a suitable animal model. The relative toxicity of different forms of arsenic can be explained, in part, by the fact that the more toxic trivalent compounds are retained in the tissues in greater amounts and are excreted more slowly than the less toxic. Arsenic affects tissues that are rich in oxidative systems primarily the alimentary tract, kidneys, liver, lungs and epidermis. It is very damaging to capillaries and this results in hemorrhage into the gastrointestinal tract, sloughing of mucosal epithelium, renal tubular degeneration, hepatic fatty changes and necrosis. The major characteristics of acute arsenic poisoning in humans are profound gastrointestinal damage and cardiac abnormalities. Subacute exposure results in vomiting, diarrhea, conjunctivitis, rhinitis, laryngitis, bronchitis, skin eruptions, necrologic signs and symptoms, muscle tenderness, and transverse white ridge on the finger nails (Mees lines). Chronic arsenic toxicosis has not been encountered to any significant extent in animals; effects in man include cancer of the skin and lungs. In most human exposure, concomitant exposures to other agents confound interpretation of observations. Although there appears to be some doubt regarding the carcinogenicity of arsenic compounds, there is epidemiological evidence that cutaneous lesions peukoderma, melanoderma, hyperkeratosis, squamous-cel1 carci- noma) are associated with drinking water with higher than normal arsenic concentration. The city of Antofagosta, Chile, is a remarkable example of cause and erect. A city of 100,000 population drinking for decades a water containing a weighted average arsenic of 598 ,ug/liter resulted in an incidence of cutaneous skin lesions of 313/100,000 per year. After the water-treatment plant was completed, which reduced the arsenic level to 80 ,ug/liter, the incidence of cutaneous lesions dropped to 19/100,000 per year. This finding suggests that even 80 ,ug/liter exceeds the acceptable level for a public water supply. Animal studies have failed to demonstrate carcinogenicity for arsenic compounds; mutagenicity and teratogenicity studies have yielded vari- able results. In conclusion, there is some epidemiological evidence that high
430 DRINKING WATER AND H"LTH concentrations of arsenic in drinking water are associated with skin cancer. When the level was reduced by water treatment to 80 ,ug/liter, the incidence was reduced but still detectable. The existence of other cocarcinogens in these water supplies has not been extensively studied. If the time factors for the development of cancer are shown to be reasonable, then the current interim standard of 50 ,ug/liter may not provide an adequate margin of safety. Research Needs 1. Improvement of analytical techniques and methodology for better adaptability to water and foods; definition of chemical form is required. 2. Epidemiologic and analytical studies to determine extent of the various forms of arsenic at low concentrations in the environment and their relation to disease patterns. 3. Development of a suitable animal model for a study of low-level long-term studies. 4. Intensive studies into the metabolism of arsenic in mammalian systems. 5. Studies about interaction of arsenic, with other trace elements in the environment (Se, Cu. Zn, etc.~. SELENIUM Selenium is found in water principally as a result of leaching from rocks and soils that are high in selenium content. Most toxicity from selenium is a result of drinking water from wells drilled through seleniferous shales rich in soluble selenium. There is an insufficient amount of selenium in water alone to provide even the nutrient requirements of most animals, but concentrations vary in different places. Analyses of 535 samples of water from major U.S. watersheds indicated that over a 4-yr period only two samples contained selenium at more than 10 ,ug/liter of water, the current U.S. interim drinking water standard. In another study, a maximum of 10 and a mean of 8 ,ug/liter in 194 public finished water supplies in the U.S. has been reported. In Germany and in Australia, village water supplies have been reported to contain from 1 to 5.3 ,ug/liter. Shallow or deep wells contain varying concentra- tions of selenium. For example, deep wells in Wyoming may contain only a few micrograms per liter while other wells contain enough selenium to be poisonous to man and livestock; some of these have been associated with the loss of hair and nails in children. Foods from nonseleniferous areas contribute very little to the overall dietary intake of selenium. Eggs
Inorganic Solutes 431 and milk, fish, various types of meat, poultry, coffee, and tea all vary somewhat in their selenium content, but in general contribute minimally to the dietary intake. Inorganic and organic forms of selenium are readily absorbed from the gastrointestinal tract of animals. Selenite is absorbed more rapidly by monogastric animals compared to ruminant animals, perhaps due to bacterial reduction of Selenite to elemental selenium or other insoluble forms in the ruminant gastrointestinal tract. Selenite and selenate are distributed largely to the liver, kidneys, muscle mass, gastrointestinal tract, and blood. Chronic administration of selenium results in increased concentration in the testes. The principal route of excretion of selenium is via the urine. At higher exposure levels, selenium is incorporated into molecules normally served by sulfur; it is methylated by mammalian tissues in an apparent detoxication process. Selenite and selenate are metabolized to trimethyl-selenonium ion, which is the principal excretory product for . . . se emum in unne. The toxicity of selenium can be altered extensively by interactions with sulfate, methionine, cystine, mercury, lead, zinc, cadmium, copper, arsenic, and vitamin E, but little is known about these interactions. Selenium is essential for domestic animals but the margin of safety is relatively narrow. A low level of selenium is essential to prevent myopathies, liver injury, and congenital abnormalities in domestic and laboratory animals and poultry, and there is little reason to believe that humans diner appreciably in this regard; however, data are lacking. High dietary selenium is toxic to animals and a defined set of signs and lesions have been established for acute, and subchronic exposure to toxic concentrations in several species. Chronic, long-term studies have been limited primarily to feeding studies in the rat and those have involved relatively high concentrations of the element. With the exception of a limited number of reports of acute exposures to toxic levels under industrial circumstances, or other accidental exposure, an indication for health effects on human populations must be extrapolat- ed from animal data. Inhalation causes acute respiratory distress, and skin exposure causes severe local irritation and dermatitis. The severity of response will depend on the chemical form of selenium. In animals, acute exposure to selenium causes respiratory distress, diarrhea, pulmonary edma, hemorrhage, liver, and renal necrosis. Chronic exposure results in death from gastroenteritis, myocardial damage, hydrothorax, pulmonary edema, renal and liver damage. Sodium Selenite is toxic to rats at concentrations of ~9 mg/liter in
432 DRINKING WATER AND H"LTH drinking water; concentrations of 1 mg/liter are without observed toxic eject. Chronic exposure of humans to selenium by inhalation or by ingestion results in central nervous system and gastrointestinal disturbances, and dermatitis. The high selenium content of diet and water in areas of seleniferous soils has been associated with "alkali disease" in cattle. Human populations living in these areas are not similarly affected. This is believed to be due to the wide geographical sources of food consumed and the loss of selenium during processing. Where feed is low in selenium, water containing 400 500 ,ug/liter is too low to cause poisoning in the cattle. For livestock water the maximum recommended concentration is 50 ,ug/liter. The only documentation of human toxicity from drinking water involved a family consuming well water which contained selenium at 9,000 ,ug/liter. In 1942, the USPHS drinking water standard listed selenium for the first time along with fluoride and arsenic. The level set was 50,ug/liter and easily met by public water supplies. The interim standard of 10 ,ug/liter was recommended in 1962 because of evidence that selenium was carcinogenic in animal studies. The current literature review of animal studies does not support this contention nor is there any epidemiological evidence implicating a higher than normal cancer incidence among those having higher than normal daily intake of selenium. The established requirement for selenium in most animal species indicates a need for more data on potential or real deficits or excesses in human populations. The concentration of selenium in waters of the United States varies widely and currently there is no evidence to suggest a problem. The totality of evidence indicates that there is greater overall potential for selenium deficiency than for selenium toxicity with current intake levels of selenium. The maximum no-observed-adverse health eject level for selenium in water is not less than 100 ,ug/liter and appears to be as great as 500 ,ug/liter. A concentration of 20 ,ug/liter just barely provides a minimum nutritional amount of selenium with a consumption of 2 liters a day. In conclusion, there is evidence that selenium may be an essential trace element for humans. The current interim standard of 0.01 ,ug/liter was established because there was some concern that selenium was a carcinogen. This claim cannot be supported by a review of the current literature. To this end these ejects must be investigated and the current interim standard re-evaluated* The paucity of definitive data on selenium and human health requires a
Inorganic Solutes 433 number of research approaches to elucidate the role of selenium in the mammalian system. The following research needs are suggested: 1. Techniques need to be developed for more rapid, accurate and reproducible analytical methods which will permit both qualitative and quantitative assays of chemical forms, oxidation state, and solubility in water. 2. Improved systems for monitoring selenium in the environment (water, air, food). 3. Research to define molecular transformations in the mammalian system. 4. Programs to study interactions between selenium, mercury, cadmi- um, arsenic, and other trace elements and heavy metals in the biosphere and in animal organisms. 5. A determination of natural and industrial emissions and cycling of selenium in the environment. 6. Effects in animal system of long-term, low levels of selenium singly and in combination with other trace elements in the environment. 7. Baseline data on selenium levels in humans in health and disease. 8. Ejects of deficiency or an excess of selenium on the development of animal tumors. 9. Determine whether some segments of the human population of the United States require additional selenium for optimum health. FLUORIDE Fluoride is found widely in water supplies, but the concentration is usually not great enough to be undesirable. The maximum concentration found for the 969 supplies studies in the 1969 Community Water Supply Survey was 4.4 mg/liter. Most supplies not fluoridated had fluoride concentrations less than 0.3 mg/liter. A more extensive survey by the Dental Health Division of the U.S. Public Health Service showed more than 2,600 communities with a population of 8 million people had water supplies with more than 0.7 mg/liter of naturally occurring fluoride. Most of these communities are in Arizona, Colorado, Illinois, Iowa, New Mexico, Ohio, Oklahoma, South Dakota, and Texas. Of these, 524 communities representing 1 million people had fluoride concentrations more than 2 mg/liter, which is an upper limit not known to produce objectionable mottling even with high temperatures. Small amounts of fluoride, of the order of 1 mg/liter, depending on the environmental temperature, in ingested water and beverages, are general
434 DRINKING WATER AND H"LTH ly conceded to have a beneficial erect on prevention of dental caries, particularly among children. This review did not systematically review the evidence for the beneficial erects of fluoride. Two forms of chronic toxic effects are recognized generally as being caused by excess intake of fluoride over long periods of time. These are mottling of tooth enamel or dental fluorosis, and skeletal fluorosis. In both cases, it is necessary to consider the severity since the very mild forms are considered beneficial by some. The most sensitive of these erects is the mottling of tooth enamel, which, depending on the temperature, may occur to an objectionable degree with fluoride concentrations in drinking water of only 0.8-1.6 mg/liter. Apparently there has been little systematic investigation of the degree to which consumers of drinking water with several mg/liter of fluoride regard the resultant mottling as an adverse health erect. Skeletal fluorosis has been observed with use of water containing more than 3 mg/liter. It now appears that long-term consumption of water containing fluoride in excess of l mg/liter runs into a fair probability of objectionable dental mottling and increased bone density in patients with long-standing renal disease or polydipsia. Increased bone density, however, has often been regarded as a beneficial rather than an adverse erect. Intake of fluoride for long periods in amounts greater than 20~0 mg/day may result in crippling skeletal fluorosis. Other reported adverse health effects of intake of milligram per liter levels of fluoride in drinking water, including mongolism, cancer mortality, mutagenic or birth erects, and sensitivity have either been unconfirmed or found lacking in substance. There is also no evidence that there is any difference between the erects of naturally occurring or intentionally added fluoride. Epidemiological studies where the water is naturally high in fluoride have found no adverse erects except in rare cases, until the concentration is many times that recommended for added fluoride. Controlled studies with fluoridiation at the l mg/liter level have reported no instances of adverse erects. Available evidence does not suggest that fluoridation has increased or decreased cancer mortality rates; the margin of error is very low, approaching 2 per 100,000. This is the theoretical erect that could have been missed with present statistical techniques. Additional studies of mottling and skeletal fluorosis need to be done in communities with several mg/liter fluoride in their water supplies to ascertain whether the no-adverse-health erect level for fluoride is greater or less than l mg/liter. In addition sociological studies are needed to
Inorganic Solutes 435 ascertain the extent to which dental mottling is regarded as an adverse effect. SODIUM Sodium ion is an ubiquitous constituent of natural waters. It is derived geologically from the leaching of surface and underground deposits of salts such as sodium chloride, from the decomposition of sodium aluminum silicates and similar minerals, from the incorporation of evaporated ocean spray particles into rainfall and from the intrusion of seawater into freshwater aquifers. The sodium chloride used as a deicing ~. . . agent on roads enters water supplies in runoff from both roads and storage depots. This added sodium chloride amounting to 9 million tons in 1970 is distributed throughout the snow belt of the northern United States and is most heavily concentrated around metropolitan areas. A survey of 2,100 supplies, covering approximately 50% of the population of the United States, was carried out in 1963-1966. The distribution of sodium ion found in this survey ranged from 0.~1900 mg/liter. Some 42% of the supplies had sodium ion concentrations in excess of 20 mg/liter and nearly 5% had concentrations greater than 250 mg/liter. Few studies of habitual sodium-ion intake for healthy adults in the United States have been reported. Such data as have been reported are based on measurement of sodium excretion in 12- or 24-h urine collections. Wide variations occur among individuals and in the same individual from day to day. One study reported a mean 24-h excretion of 4,100 mg with a range from 1,600 9,600 mg in 71 working adult males in New York. Another reported a mean sodium excretion near 2,800 per 24 h in 171 black women ranging in age from 35 to 44 yr. A recent estimate for infants is 69-92 mg/kg/day. Sodium chloride is added to many foods during processing. Additional sodium chloride is often added during cooking, and again at the table. None of this is essential, for habitual intake of sodium bears no relationship to physiological need. Healthy individuals have been shown to maintain sodium balance on a sodium intake of less than 2,000 mg/24 h while sweating 9 liters/day. A variety of preindustrial societies, in widely divergent habitats (tropical jungle, desert, arctic, etc.) subsist for generations on sodium intake less than 1,000 mg/day and show no evidence of sodium deprivation. Requirements for sodium in growing infants and children are estimated at less than 200 mg/day. It thus appears that habitual intake of sodium in adults in the United States often exceeds body need by 10-fold or more. Evidence that this
436 DRINKING WATER AND H"LTH excessive intake may have harmful consequences is summarized in the detailed report. Specification of a "no-observed-adverse-health-effect" level in water for a substance like sodium, for which the eject is associated with total dietary intake and for which usual food intake is already greater than a desirable level, is impossible. Since adult fluid intake averages 1.5-3 liters/day, sodium intake from drinking water represents less than 10% of the habitual total intake of 3,000~4,000 mg as long as the sodium content of the water does not exceed 200 mg/liter. Adverse health effects may be anticipated with sodium concentrations in water greater than 20 mg/liter only for that special risk group restricted to total sodium intake of 500 mg/day, because intake from food cannot be reduced feasibly to less than 440 mg/day. For this group, whose diets must be medically supervised in a careful manner, knowledge of the sodium ion concentration of the drinking water permits prescription of bottled water low in sodium when necessary. A larger proportion of the population, about 3%, is on sodium- restricted diets calling for sodium intake of less than 2,000 mg/day. The fraction of this that can be allocated to water varies, depending on medical judgment for individual instances. Knowledge of the sodium-ion content of the water supply and maintenance of it at the lowest practicable concentration is clearly helpful in arranging diets with suitable sodium intake. In many diets allowance is made for water to contain lOOmg/literofsodium. It appears that at least 40~o of the total population would benefit if total sodium-ion intake were maintained at not greater than 2,000 mg/day. With sodium-ion concentration in the water supply not more than 100 mg/liter, the contribution of water to the desired total intake of sodium would be logo or less for a daily consumption of 2 liters. NITRATE All sources of combined nitrogen must be regarded as potential sources of nitrate, for there is a tendency for all nitrogenous materials in natural waters to be converted into nitrate. Major point sources of combined nitrogen in water are municipal and industrial wastewaters, refuse dumps, animal feed lots and septic tanks. Disuse sources include runoff or leachate from manured or fertilized agricultural lands, urban drainage and biochemical nitrogen fixation. Some tenths of a milligram/liter of combined nitrogen occurs in rainfall from solution of atmospheric ammonia and oxides of nitrogen.
Inorganic Solutes 437 In the Community Water Supply Survey of the Bureau of Water Hygiene in 1969, the range of nitrate concentrations found was 0-127 mg/liter. Nineteen systems, about 3% of those examined for nitrate, had concentrations in excess of the recommended limit of 45 mg/liter as nitrate. Ordinarily, the major human intake of nitrate is from food rather than from water. The mean food intake in the United States has been estimated to be nearly 100 mg/day, most of it coming from vegetables such as spinach, lettuce, and root vegetables, which may contain several thousand parts per million of nitrate. Nitrate is secreted in the saliva, the mean value being about 40 mg/day, of which about 10 mg/day is reduced to nitrite and found in that form. These quantities, although internally derived, also represent inputs to the gastric system. Two health hazards are related to the consumption of water containing large concentrations of nitrate (or nitrite): induction of methemoglobine- mia, particularly in infants, and possible formation of carcinogenic nitrosamines. Acute toxicity of nitrate occurs as a result of reduction to nitrite, a process that can occur under specific conditions in the stomach, as well as in the saliva. Nitrite acts in the blood to oxidize the hemoglobin to me/hemoglobin, which does not perform as an oxygen carrier to the tissues. Consequently, anoxia and death may ensue. Healthy adults are reported to be able to consume large quantities of nitrate in drinking water with relatively little, if any, ejects. Acute nitrate toxicity is almost always seen in infants rather than adults. This increased susceptibility of infants has been attributed to high intake per unit weight, to the presence of nitrate-reducing bacteria in the upper gastrointestinal tract, to the condition of the mucosa and to greater ease of oxidation of fetal hemoglobin. Assessment of maximum nitrate levels in water exhibiting no adverse health ejects has been based principally on a study of known cases of methemoglobinemia. No cases of methemoglobinemia have been report- ed when the water contained less than 10 mg/liter nitrate as nitrogen. Later, a small percentage of cases were found in which the nitrate concentration of the drinking water was somewhat less. Only one U.S. case has been associated with a public water supply regardless of nitrate content. Studies supplementary to the previous ones in which levels of methemoglobin in the blood of infants were related to concentrations of nitrate in the water being fed showed detectable enhancement of
438 DRINKING WATER AND H"LTH methemoglobin levels in infants being supplied with water containing nitrate as nitrogen only slightly in excess of 10 mg/liter. It can be concluded that, from the viewpoint of induction of methemoglobinemia, the maximum concentration of nitrate in water exhibiting no significant adverse health ejects is close to the interim standard of 10 mg/liter as nitrogen. However, there appears to be little margin of safety for some infants with the standard at this concentration. The other health hazard proposed for nitrate in water, that it may act as a procarcinogen, is more speculative. A series of reactions is involved by which it is proposed that nitrate in water may be converted to N- nitroso compounds that are carcinogenic agents. The steps in the reaction sequence are: 1. Reduction of nitrate to nitrite. 2. Reaction of nitrite with secondary amines or amides in food or water to form N-nitroso compounds. 3. Carcinogenic reaction of N-nitroso compound. Reaction of nitrites and secondary amines or amides to form N-nitroso compounds occurs readily in acidic solution and particularly at the normal pH range of 1 to 5 characteristic of gastric contents after a meal. However, the relation of nitrate concentrations in water supplies to the presence of nitrite in the digestive tract is much more problematic. The major source of nitrite to the stomach, at least for healthy individuals, is the saliva, normally containing AS mg/liter of nitrite. Little reduction of nitrate to nitrite occurs in the human stomach unless the gastric pH is greater than 4.6. Thus the pH condition for formation of nitrite is quite different from the pH range for ready formation of N-nitroso com- pounds, pH 3.5 or less. Epidemiologically, correlations have been shown to occur between incidence of gastric cancer and concentration of nitrate in the drinking water. An unusually high incidence of stomach cancer in certain mountainous areas of Colombia is associated with high concentration of nitrate in the drinking water. The findings, however, are preliminary and only suggestive. They provide no firm evidence of a causal link between incidence of cancer and high intake of nitrate. They do indicate a need for caution in assessment of lack of adverse health ejects even at the 10 mg/liter concentration level for nitrate as nitrogen and a need for continued intensive study on the metabolism and ejects of nitrate in man. In conclusion, epidemiological evidence on the occurrence of methe- moglobinemia in infants tends to confirm a value near 10 mg/liter nitrate
Inorganic Solutes 439 as nitrogen as a maximum concentration level for water with no- observed-adverse-health effects, but there is little margin of safety in this value. There is little scientific basis to support conclusions on the hazard of any concentration of nitrate in water with regard to carcinogenic potential. SULFATE No adverse health ejects have been noted for concentrations of sulfate in water less than about 500 mg/liter. The only observed physiological eject at concentrations greater than 1000 mg/liter has been the induction of diarrhea. The taste threshold for sulfate in water lies between 300 and 400 mg/liter for most persons, but some individuals are able to detect as little as 200 mg/liter. WATER HARDNESS AND HEALTH Introduction The principal focus of Drinking Water and Health is on possible adverse health effects from contaminants in drinking water. However, certain inorganic or mineral constituents of drinking water that, by usual definition, are not considered to be "contaminants" have been recently reported to be of public health importance. These are constituents that are associated with the level of "hardness" of the water and that occur naturally or that are picked up from water-treatment or distribution systems. Hardness may be defined as the sum of the polyvalent cations present in water. The most common such cations are calcium and magnesium. Hardness usually is expressed in terms of the equivalent quantity of calcium carbonate (CaCO3~. There are no distinctly defined levels for what constitutes a hard or a soft water supply. Generally, water with less than 75 mg/liter (ppm) of CaCO3 is considered soft and above this concentration as hard. There has been a great deal of interest in the relationship between the hardness of drinking water and morbidity and mortality since the studies, almost 20 yr ago, of Kobayashi in Japan (1957) and Schroeder (1960) in the United States. Subsequently, numerous other studies have been carried out throughout the world which indicate some water factories) are statistically correlated with pathologic ejects, particularly various cardiovascular diseases. As a result, a voluminous body of literature on
440 DRINKING WATER AND H"LTH these studies has developed and the problem has been the subject of several comprehensive reviews. The Subcommittee on Morbidity and Mortality, in preparing this report, has relied heavily on several of these reviews, notably those by Craun and McCabe (1975), Heyden (1976), Neri et al. (1974), Sauer 0974), Sharrett and Feinleib (1975), Schroeder and Kraemer (1974), and Winton and McCabe (1970~. These reviews have been abstracted and summarized rather than reprinting the same material or attempting another review. It should be noted, also, that the World Health Organization and the International Atomic Energy Agency consider that there is sufficient evidence for the involvement of trace elements in the pathogenesis of cardiovascular diseases to warrant international collaborative studies on the problem (IAEA, 1973; WHO, 1973~. The possible causal association between water hardness and cardiovascular disease has been recognized in Great Britain to be of enough potential public health importance to have resulted in official governmental expert review of the problem (MRC, 1970; COMA, 1974~. More than 50 studies in nine countries have been carried out on possible relationship of water hardness and health. Most of the investigations were in the United Kingdom, United States, and Canada; they reveal a consistent trend of significant statistical associations between the hardness characteristics of drinking water and the incidence of cardiovascular problems (heart disease, hypertension, and stroke) and, to a lesser extent, other diseases. Generally, reports have shown an inverse correlation between the the incidence of cardiovascular disease and the amount of hardness of drinking water, or, conversely, a positive correlation with the degree of softness. Studies in the United States and Canada have shown that age-adjusted cardiovascular mortality rates among populations using very soft water may be as much as 15-20% higher than among populations using hard water. The differential reported for the United Kingdom may be as high as 40%. Cardiovascular diseases are the leading cause of death in the United States, where they account for more than 50% of all causes of death, or roughly 1 million deaths each year, and death rates from coronary heart disease have been steadily increasing over the past few decades. It is evident, therefore, that if water factors are ultimately proven to be involved causally in the pathogenesis of cardiovascular disease, then we are confronted with a major public health problem and current water treatment practices will have to be greatly modified. The credibility of these water-factor studies depend more on the consistent trend of the findings than their biological plausibility or the size of the correlation coefficients or the actual significance levels.
Inorganic Solutes 441 However, there is some scientific justification for the biological plausibili- ty of these associations. There has been increasing evidence that certain trace elements play an important role in a number of biological processes through their action as activators or inhibitors of enzymatic reactions, by competing with other elements and proteins for binding sites, by influencing the permeability of cell membranes, or through other mechanisms. It is assumed that these elements can also directly or indirectly exert an action on cardiac cells, the blood vessel walls, on blood pressure, or other systems related to cardiovascular function, such as lipid and carbohydrate metabolism. It is assumed further that water quality can affect man's trace element or mineral balance and, conse- quently, cardiovascular function. As previously noted, the preponderance of reported evidence indicates statistically significant correlations between some drinking water fac- tor~s) and the incidence of cardiovascular diseases resulting in a general impression that inorganic substances in water may be causally implicat- ed. It must be emphasized, however, that there is considerable disagree- ment among various investigators concerning the magnitude or even the existence of a "water factor" risk, the identity of the water factorts), the mode of action, and the specific pathologic ejects. Theories on Risk Factors Several hypotheses have been offered on how components of drinking water may affect cardiovascular function and disease; these generally fall into one of the following classes: 1. That one or more of the principal "bulk" constituents of hardness in tap water are protective. 2. That one or more of the trace elements that tend to be present in hard water are protective. 3. That harmful metals are present in soft water, possibly having been picked up by leaching from the distribution system. 4. That other factors are involved. Each class of hypotheses is briefly reviewed below. PROTECTIVE EFFECT FROM BULK CONSTITUENTS OF HARD WATER Hardness is not a specific constituent of water, but is a complex and variable mixture of cations and anions. Several investigators have attributed the disease-protective effect of hard water to the presence of
442 DRINKING WATER AND H"LTH calcium and magnesium, which are the principal cations found in hard water. Calcium, magnesium, and hardness generally correlate well with one another. In a few studies, however, it was possible to discriminate between the two elements and treat them as separate variables. When calcium and magnesium are separately correlated with cardiovascular disease rates, calcium appears to correlate with greater significance in the United Kingdom, whereas in the United States the correlations are about equally strong for calcium and magnesium. There is a limited amount of evidence to explain the possible mechanism whereby calcium and/or magnesium may play a role in protection against cardiovascular diseases. Experimentally, a moderate increase of calcium in the diet results in lower levels of circulating and organ cholesterol; this is speculated as a possible factor in the association noted between water hardness and cardiovascular diseases. Magnesium is theorized to protect against lipid deposits in arteries and also may have some anticoagulant properties that could protect against cardiovascular diseases by inhibiting blood clot formation. Also, there is evidence to indicate that there may be higher concentrations of calcium and magnesium in certain tissues among residents of hard water areas as compared to soft water areas. PROTECTIVE ACTION OF TRACE ELEMENTS IN HARD WATER There is a paucity of systematic data concerning the concentrations of trace elements as a correlate of hardness of water and cardiovascular disease rates. From a limited number of studies that have been carried out, if hard water contains protective beneficial elements (other than calcium and magnesium), vanadium, lithium, and possibly manganese and chromium emerge as candidates. Lithium and vanadium have been reported to be negatively correlated with cardiovascular mortality. These negative correlations appear to persist and remain significant even after controlling for calcium and magnesium. The biological functions of these metals are obscure. It is speculated that lithium may have a specific influence on catecholamines and coronary-prone behavioral patterns. Vanadium is reported as an essential trace element in human nutrition and thought to inhibit hepatic cholesterol synthesis and reduce serum cholesterol. Increased intake of vanadium is believed therefore to reduce serum cholesterol. The mechanism is thought to be an inhibition of cholesterol synthesis, especially in young subjects. A case is made that chromium, which is positively correlated with the
Inorganic Solutes 443 hardness of tap water in North America (but not in the United Kingdom), may be causally involved. Experimentally, chromium deficiency produces elevated serum glucose and cholesterol levels and increased deposition of aortic plaques. Though quantitative estimates of daily chromium requirements cannot be given yet, it is thought that the chromium level in hard water may help protect against a deficiency. Similarly, it is speculated that hard water may protect against a deficiency of manganese which also experimentally is associated with decreased glucose tolerance. HARMFUL ELEMENTS IN SOFT WATER Soft water tends to be more corrosive than hard water. As a result certain trace metals are found in higher concentrations in soft than in hard water. Several such metals have been suggested as possible intermediaries in the increased cardiovascular disease rates associated with soft water. Based on very limited data, cadmium, lead, copper, and zinc have been suspected to be possibly involved in the induction of cardiovascular disease. These metals often occur in plumbing materials and have been found to leach into soft drinking water. There is evidence that relatively low doses of cadmium can produce hypertension in rats. It is known that the metal can accumulate in human kidneys and produce renal damage and presumably could affect blood pressure. However, direct evidence linking cadmium in water to heart disease in humans is lacking. Several studies have shown elevated levels of blood lead occurring among persons living in homes having lead plumbing and soft water, or both. But the relationship between these elevated blood lead levels and cardiovascular disease remains unclear. There are limited data suggesting that the intake levels of copper and zinc from soft water may adversely affect cardiovascular disease rates. However, there are conflicting data from other studies. Still other studies suggest that the discrepancies may be due to the failure to examine critically the ionic form and the intake ratios of the suspect metals from all sources, particularly the Zn:Cu and the Cd:Zn ratios as well as various other metabolic variables. OTHER FACTORS AND CONFOUNDING VARIABLES From the above discussion, it is apparent that there is no shortage of hypotheses to explain how components of drinking water might affect
444 DRINKING WATER AND HEALTH cardiovascular function and disease. It is necessary to consider these hypotheses along with other factors and some confounding variables. Several cations found predominantly in hard water are theorized to exert a beneficial effect on cardiovascular function, and other cations found in soft water, to exert a detrimental effect. The question often raised is whether drinking water can provide enough of these elements to have any significant impact on the pathogenesis of cardiovascular diseases when considered in the context of the total intake of these elements through other dietary and environmental pathways. Hard or mineralized water generally would supply less than 1~15% of the total dietary intake for calcium and magnesium. Water provides even a smaller proportion of the total intake for the various suspect trace metals with the possible exception of lead. The largest proportion of trace metal intake from water compared to food is for zinc, but even for this water provides only about 4% of its total dietary intake. For all other suspect metals drinking water provides under 4% of total intake. The concentrations of lead in certain drinking waters may exceed 100 ,ug/liter as compared to an average adult daily dietary intake of about 300 ,ug. Several investigators, however, point out that the amount of these elements provided through drinking water relative to other sources is less important than their chemical form. It is theorized that trace elements often occur in a chelated form in foods and may be less available metabolically than the ionized form that generally occurs in water. Also, the valence form of elements found in water may differ from that in foods and affect metabolic behavior. Another possible variable is the different effect of hard and soft waters on the mineral composition of foods during cooking. It is theorized that soft water may remove a significantly higher proportion of various "protective" nutrients and elements from foods during cooking than do hard waters. Most of the studies carried out to date correlate mortality rates with measurements made on raw rather than on finished water; the correla- tions were of lesser statistical significance when finished water was used. There was considerable variation in the study design and methods among the numerous investigations reported. As previously noted, most of the studies report a statistically significant correlation between water hardness and one or more of several cardiovascular diseases. It is not possible, however, to quantitatively compare the data from many of these studies because of the different criteria and indices used in the specification of cause of death. The case for a causal association of water factors to any specific pathologic ejects is thought to be further
Inorganic Solutes 445 weakened by several reports of correlations of the water factor with other causes of death, such as bronchitis, infant mortality, malignancies, cirrhosis, and other noncardiovascular causes of death. Despite the consistent trend for most of the reported studies, a few studies have shown negative or conflicting results for different age and sex groups. For example, in Holland and Sweden, hard water was correlated with decreased cardiovascular mortality among women but not men, and an opposite finding emerged from a study in Newfoundland. The strength and specificity of the correlative studies have varied depending on the sample sizes of the area and population. In general, the relationship appears stronger in larger and more populous areas. To some extent these differences are probably due to a lack of sensitivity of correlation coefficients related statistically to the size of the sampling unit. Obviously, smaller geographical units with smaller populations would tend to have less stable death rates and consistency than larger ones, so that any variable will tend to correlate less well with smaller geographical and population bases. But it should be noted that the size of the metropolitan area and population density tend to correlate well with cardiovascular disease rates independently of water quality. This is attributed to various cultural and socioeconomic factors that appear to influence cardiovascular disease mortality rates. On the other hand, less urban areas are more likely to use relatively hard groundwater and, conversely, larger metropolitan areas are usually more dependent on softer surface waters. In a few studies where corrections for socioeconom- ic factors were attempted, the correlatons with hardness of water still exist but with a reduced statistical significance. It is possible that both urbanization and water mineralization have an eject on cardiovascular disease rates and could be interacting or acting separately. Several studies have shown statistically significant correlations of death rates with various geographical and climatic variables, especially rainfall, independently of water-quality variables. Much more work must be done on the possible associations and interrelationships of variables such as rain, soil chemistry, and human nutrition with water-quality and cardiovascular disease rates. From this review, it is clear that there is no shortage of hypotheses related to how the components of drinking water might affect cardiovas- cular function and disease. Despite the large body of evidence supporting the hypotheses, there are too many confounding variables and discrepan- cies in the data to permit any scientifically sound conclusions as to the specific role of water factors in the pathogenesis of cardiovascular diseases.
446 DRINKING WATER AND H"LTH Summary Water Hardness and Health There is a large body of scientific information that indicates certain inorganic or mineral constituents of drinking water are correlated with increased morbidity and mortality rates. These constituents by usual definition are not considered to be "contaminants," as they often are associated with the level of "hardness" of drinking water and occur naturally or are picked up from water-treatment or distribution systems. Hardness is due primarily to the presence of ions of calcium and magnesium and is expressed as the equivalent quantity of calcium carbonate (Cached. Water with less than 75 mg CaCO3/liter is generally considered soft, and above 75 mg/liter as hard. A voluminous body of literature suggests that in the United States and other developed nations, the incidence of many chronic diseases, but particularly cardiovascular diseases (heart disease, hypertension, and stroke), is associated with various water characteristics related to hardness. Most of these reports indicate an inverse correlation between the incidence of cardiovascular disease and the amount of hardness. A few reports also indicate a similar inverse correlation between the hardness of water and the risk from several noncardiovascular causes of death as well. Several hypotheses are reported on how water factorts) may eject health; these mostly involve either a protective action attributed to some elements found in hard water or harmful effects attributed to certain metals often found in soft water. The theorized protective agents include calcium, magnesium, vanadi- um, lithium, chromium, and manganese. The suspect harmful agents include the metals cadmium, lead, copper, and zinc, all of which tend to be found in higher concentrations in soft water as a result of the relative corrosiveness of soft water. It is evident from the review of the literature that there is considerable disagreement concerning the magnitude or even the existence of a "water factor" risk, the identity of the specific causal factorts), the mode of action, and the specific pathologic ejects. Nevertheless, the preponderance of reported evidence reflects a consistent trend of statistically significant inverse correlations between the hardness of water and the incidence of cardiovascular diseases. As a result, there is a general impression that harmful elements in soft water and/or protective elements in hard water are causally implicated in the pathogenesis of cardiovascular and possibly other chronic diseases. The wide spectrum of alleged associated effects, the lack of consistency in theorized or reported etiologic factors, the very small quantities of
Inorganic Solutes 447 suspect elements in water relative to other sources, and the discrepancies between studies raise serious questions as to whether drinking water really serves as a vehicle of causal agents, is an indicator of something broader within the environment, or represents some unexplained spurious associations. Despite these uncertainties, the body of evidence is sufficiently compelling to treat the "water story" as plausible, particularly when the number of potentially preventable deaths from cardiovascular diseases is considered. In the United States, cardiovascular diseases account for more than one-half of the approximate 2 million deaths occurring each year. On the assumption that water factorts) are causally implicated, it is estimated that optimal conditioning of drinking water could reduce this annual cardiovascular disease mortality rate by as much as 15% in the United States. In view of this potential health significance, it is essential to ascertain whether water factors are causally linked to the induction of cardiovascu- lar or other diseases and, if so, to identify the specific factors that are involved. Much more definitive information is needed in order to identify what remedial water treatment actions, if any, can be considered. REFERENCES FOR TRACE METALS Aberg, B., L. Ekman, R. Falk, U. Greitz, G. Persson, end J.O. Snihs. 1969. Metabolism of methyl mercury (203 Hg) compounds in man. Arch. Environ. Health 19:478484. Ackermann, W.C. 1971. Minor Elements in Illinois Surface Waters. Illinois State Water Survey Technical Letter 14. Adamson, A.H., D.A. Valks, M.A. Appleton, and W.B. Shawl 1969. Copper toxicity in housed lambs. Vet. Rec. 85:368-369. Aikawa, J.K., E.L. Rhoades, and G.S. Gordon. 1952. Urinary and fecal excretion of orally administered Mg28. Proc. Soc. Exp. Biol. Med. 98:39-31. Albert, R. E., R.E. Shore, A.J. Sayers, C. Strehlow, T.J. Kneip, B.S. Pasternack, A.J. Friedhoff, F. Covan, and J.A. Cimino. 1974. Follow-up of children overexposed to lead. Environ. Health Perspect., Exp. Issue no.7, pp.33-39. Alberts, J.J., J.E. Schindler, and R.W. Miller. 1974. Mercury determinations in natural waters by persulfate oxidation. Anal. Chem.46:434-437. Aldous, K.M., D.G. Mitchell, and K.W. Jackson. 1975. Simultaneous determination of seven trace metals in potable water using a Vidicon atomic absorption spectrometer. Anal. Chem. 47: 10341037. Alexander, F.W., H.T. Delves, and B. E. Clayton. 1973. The uptake and excretion by children of lead and other contaminants. In Environmental Health Aspects of Lead, Proc. Int. Symp., Amsterdam, Oct. 2-6, 1972. Luxembourg, Commission of the European Communities, pp.319-331. American Public Health Association. 1976. Standard Methods for the Examination of Water and Wastewater, 13th ed. Washington, D.C. American Society for Testing and Materials. 1970. Annual Book of ASTM Standards, pt. 23, Water and atmospheric analysis. Philadelphia.
448 DRINKING WATER AND H"LTH Andelman, J.B., and M.A. Shapiro. 1972. Changes in trace element concentrations in water treatment and distribution systems. In D.D. Hemphill, ed. Trace Substances in Environmental Health. University of Missouri, Columbia, pp. 87-91. Andelman, J.B. 1974. The effect of water treatment and distribution on trace element concentrations. In A.J. Rubin, ed. Chemistry of Water Supply, Treatment, and Distribution, pp. 423440. Ann Arbor Science Publishers, Inc. Ann Arbor, Michigan. Anon. 1962. Molybdenum toxicity. Nutr. Rev. 20:152-154. Asmangulyan, T.A. 1965. Determination of the maximum permissible concentration of molybdenum in open bodies of water. Hyg. and Sanit. (trans. of Gig. Sanit.) 30:5-11. Bacon, A.P.C., K. Froome, A.E. Gent, T.K. Cooke, and P. Sowerby. 1967. Lead poisoning from drinking soft water. Lancet 1 :264-266. Baltisberger, R.J. and C.L. Knudson. 1974. The differentiation of submicrogram amounts of inorganic and organomercury in water by flameless atomic absorption spectrometry. Anal. Chem. Acta 73:265-272. Barabannik, P.I., I.A. Mikhaliuk, R.P. Mnatsakanian, I.N. Tsvetkova, and G.S. Iatsula. 1961. Zinc, manganese, cobalt and iodine in potable artesian water in Kiev. Gig. Sanit. 26:95-97. Barnard, W.M., and M.J. Fishman. 1973. Evaluation of the use of the heated graphite atomizer for the routine determination of trace metals in water. At. Absorpt. Newsl. 12:118-124. Barnes, J.M., and H.B. Stoner. 1959. The toxicity of tin compounds. Pharmacol. Rev. 2:211- 231, Part 1. Barnett, P.R., M.W. Skougstad, and K.J. Miller. 1969. Chemical characterization of a public water supply. J. Am. Water Works Assoc. 61 :61-67. Barry, P.S.I. 1975. A comparison of concentrations of lead in human tissues. Br. J. Ind. Med. 32:119-139. Bauer, G.C.H., A. Carlsson, and B. Lindquist. 1957. Metabolism of i40Ba in man. Acta Orthop. Scand. 26:241-254. Bauer, G.C.H., A. Carlsson, and B. Lindquist. 1956. A comparative study on the metabolism of ~40Ba and 45Ca in rats. Biochem. J. 63:535-542. Beattie, A.D., M.R. Moore, A. Goldberg, M.J.W. Finlayson, J.F. Graham, E.M. Mackie, J.C. Main, D.A. McLaren, R.M. Murdoch, and G.T. Stewart. 1975. Role of chronic low- level lead exposure in the aetiology of mental retardation. Lancet 1:589-592. Beattie, A.D., M.R. Moore, W.T. Devenay, A.R. Miller and A. Goldberg. 1972. Environ- mental lead pollution in an urban soft-water area. Br. Med. J. 2:491-493. Beeson, K.C., W.R. Griffitts, and D.B. Milne. 1977. Geochemistry and the Environment. Vol. II: Tin. National Academy of Sciences, Washington, D.C. Berg, J.W., and F. Burbank. 1972. Correlations between carcinogenic trace metals in water supplies and cancer mortality. Ann. N.Y. Acad. Sci. 199:249-264. Berglund, F. 1971. Reprt from an expert group. Methylmercury in fish, A toxicologic- epidemiologic evaluation of risks. Nord. Hyg. Tidskr. Supplement 4, Stockholm, Sweden. Bisogni, J.J., Jr. and A.W. Lawrence. 1974. Determ~nation of submicrogram quantities of monomethyl mercury in aquatic samples. Environ. Sci. Technol. 8:85~852. Boettner, E.A., and F.I. Grunder. 1968. Water analysis by atomic absorption and flameless emission spectroscopy. In R.A. Baker, ed. Trace Inorganics in Water, pp. 236-246, Adv. Chem. Ser. no. 73. American Chemical Society, Washington D.C. Bostrom, H., and P.O. Wester. 1967. Trace elements in drinking water and death rate in cardiovascular disease. Acta Med. Scand. 181 :465~73.
Inorganic Solutes 449 Bowers, E. 1971. Ion-exchange softening. In Water Quality and Treatment, a Handbook of Public Water Supplies, ad ea., pp. 341-377. Prepared by The American Water Works Association. McGraw-Hill Book Co., New York. Brooks, P.P. Presley, and I.R. Kaplan. 1967. APDC-MIBK extraction system for the determination of trace elements in saline waters by atomic absorption spectrophotome- try. Talanta 14:809-816. Brown, D.R. 1975. Neonatal lead exposure in the rat: Decreased learning as a function of age and blood lead concentrations. Toxicol. Appl. Pharmacol. 32:628-637. Brown, E., M.W. Skougstad, and M.J. Fishman. 1970. Methods for collection and analysis of water samples for dissolved minerals and gases. U.S. Geological Survey, Techniques of Water-Resources Invest. no. 5. Browning, E. 1961. Toxicity of industrial metals. Butterworths, London, England. Camp, T.R., and R.L. Meserve. 1974. Water and Its Impurities, 2nd ea., pp. 184-191. Dowden, Hutchinson and Ross Inc., Stroudsbrug, Pa. Carson, T.L., G.A. VanGelder, G.C. Karas, and W.B. Buck. 1974. Slowed learning in lambs prenatally exposed to lead. Arch. Environ. Health. 29: 154156. Chao, T.T., M.J. Fishman, and J.W. Ball. 1969. Determination of traces ofsilverin wafers by anion exchange and atomic absorption spectrophotometry. Anal. Chem. Acta. 47: 189-195. Chapman, J.F., L.S. Dale, and J.W. Kelly. 1974. A carbon tube for the analysis of water by flameless atomic absorption spectrometry. Anal. Chem. Acta 69:207-210. Chappell, W.R. 1973. Transport and biological effects of molybdenum in the environment. Progress Report, 1 Jan. 1973. University of Colorado and Colorado State University. Chau, Y.K., and K. Lum-Shue-Chan. 1969. Atomic absorption determination of microgram quantities of molybdenum in lake waters. Anal Chem. Acta 48:205-212. Chernoff, N. 1973. Teratogenic effects of cadmium in rats. Teratology 8~1~:29-32. Chuttani, H.K., P.S. Gupta, S. Gulati, and D.N. Gupta. 1965. Acute copper poisoning. Am. J. Med. 39:849-854. Cohen, J.M., L.J. Kamphake, E.K. Harris, and R.L. Woodward. 1960. Taste threshold concentrations of metals in drinking water. J. Am. Water Works Assoc. 52:660 670. Consolazio, C.F., L.O. Matoush, R.A. Nelson, R.S. Harding, and J.E. Canham. 1963. Excretion of sodium, potassimn, magnesium, and iron in human sweat and the relation of each to balance and requirements. J. Nutr. 79:407415. Copenhaver, E.D., G.U. Ulrikson, L.T. Newman, and W. FuLkerson. 1973. Cadmium in the environment: An annotated bibliography. Oak Ridge National Laboratory. ORNL-EIS- 73-17. Cosgrove, J.F., and D.J. Bracco. 1973. Determination of minor metallic elements in the water environment. In L. Ciaccio, ed. Water and water pollution handbook, vol. 4, pp. 1315-1356. M. Dekker Co., New York. Coussons, H. 1969. Magnesium metabolism in infants and children. Postgrad. Med.46, 135- 139. Cralley, L.J. 1972. Uses and industrial exposures. In I.R. Tabershaw, ed. The Toxicology of Beryllium. U.S. Department of Health, Education, and Welfare, Public Health Service. Public Health Service Publication 2173, Washington, D.C. Craun, G.F., and L.J. McCabe. 1975. Problems associated with metals in drinking water. J. Am. Water Works Assoc. 67:593-599. Crum~Wiesner, H.J. and W.C. Purdy. 1969. Extraction of vanadium into isobutyl methyl ketone. Talanta 16: 12~129.
450 DRINKING WATER AND H"LTH Dangel, R.A. 1975. Study of corrosion products in the Seattle Water Department distribution system. Report, Environmental Protection Technology Series, EPA-670/2- 75-036. Davis, G.K. 1974. Copper and molybdenum. In Geochemistry and the Enviornment. Vol. I: The Relation of Selected Trace Elements to Health and Disease, pp. 68-79. National Academy of Sciences, Washington, D.C. De Groat, A.P., V.J. Feron, and H.P. Till 1973. Short-term toxicity studies of some salts and oxides of tin in rats. Food Cosmet. Toxicol. 11: 19-30. de No, L.R., and T.P. Feng. 1946. Analysis of the effect of barium upon nerve with particular reference to rhythmic activity. J. Cell. Comp. Physiol. 28:397464. Doherty, P.C., R.M. Barlow, and K.W. Angus. 1969. Spongy changes in the brains of sheep poisoned by excess dietary copper. Res. Vet. Sci. 10:303-304. Dolinsek, F., and J. Stupar. 1973. Application of the carbon cup atomization technique in water analysis by atomic absorption spectroscopy. Analyst 98:841-850. Durfor, C.N., and E. Becker. 1964. Public Water Supplies of the 100 Largest Cities in the United States, 1962. U.S. Geological Survey Water-Supply Paper 1812. U.S. Government Printing Office, Washington, D.C. Durum, W.H. and J. Haffty. 1961. Occurrence of Minor Elements in Water. U.S. Geological Survey Circular 445, Washington, D.C. Durum, W.H. 1974. Occurrence of some trace metals in surface and groundwaters. In Trace Metals in Water Supplies: Occurrence, Significance, and Control. Proceedings, 16th Water Quality Conference, University of Illinois, Urbana. Durum, W.H., J.D. Hem, and S.G. Heidel. 1971. Reconnaissance of Selected Minor Elements in Surface Waters of the United States, October 1970. U.S. Geological Survey Circular 643, Washington, D.C. Durum, W.H., S.G. Heidel, and L.J. Tison. 1960.World-widerunoffofdissolvedsolids.In International Association of Scientific Hydrology, General Assembly of Helsinki, 1960, pp. 618-628. Publication no. 51-55. Dye, J.F., and J.L. Tuepker. 1971. Chemistry of the lime-soda process. In Water Quality and Treatment, a Handbook of Public Water Supplies, 3rd ed, pp.313-340. Prepared by the American Water Works Associations. McGraw-Hill Book Co., New York. Ediger, R.P. 1973. Review of water analysis by atomic absorption. At. Absorpt. Newsl. 12: 151-157. Ekman, L., U. Greitz, G. Persson, and B. Aberg. 1968. Omsattning av methyLkvicksilver hos manniska. Nord. Med. 79:450-456. Elwell, W.T., and J.A. Gidley. 1966. Atomic-absorption spectrophotometry, 2nd rev. ed. Pergamon Press, New York. Everett, G.L., T.S. West, and R.W. Williams. 1974. The determination of tin by carbon filament atomic absorption spectrometry. Anal. Chem. Acta 70:291-198. Everson, R.J., and H.E. Parker. 1974. Effect of hydrogen ion concentration on the determination of lead by solvent extraction and atomic absorption spectrophotometry. Anal. Chem. 46: 1966-1970. Falk, R., J.O. Snihs, L. Ekman, U. Greitz, and B. Aberg. 1971. Whole-body measurements on the distribution of mercury-203 in humans after oral intake of methylradiomercury nitrate. Acta. Radiol. 9:55-72. Feldman, C. 1974. Perchloric acid procedure for wet-aching organic for the detenn~nation of mercury (and other metals). Anal. Chem. 46: 1606-1609. Ferm, V.H. 1972. The teratogenic effects of metals on mammalian embryos. Adv. Teratol. 5:51-75.
Inorganic Solutes 451 Fernandez, F.J., and D.C. Manning. 1971. Atomic absorption analyses of metal pollutants in water using a heated graphite atomizer. At. Absorpt. Newsl. 10:65-69. Fernandez, F.J. 1973. Atomic absorption determination of gaseous hydrides utilizing sodium borohydride reduction. At. Absorpt. Newsl. 12:93-97. Bribers, I. M Piscator. and G. Nordberg. 1971. Cadmium in the Environment. CRC Press, --D' ~-~ ~ Cleveland. Friberg, L., T. Kjellstrom, G. Nordberg, and M. Piscator. 1975. Cadmium in the Environment. III: A Toxicological and Epidemiological Appraisal. U.S. Environmental Protection Agency, Environmental Protection Series, EPA-650/2-7549, Washington, D.C. Friberg, M. Piscator, G.F. Nordberg and T. Kjellstrom. 1974. Cadmium in the Environ- ment, 2nd Edition. CRC Press, Cleveland. Furukawa, D.H. 1973. Removal of heavy metals from water using reverse osmosis. In Conference on Traces of Heavy Metals in Water Removal Processes and Monitoring, pp. 180-187. Princeton University, Princeton, N.J., Nov. 15-16, 1973. U.S. Environmental Protection Agency, EPA-902/9-74-001. Gammill, J.C., B. Wheeler, E.L. Carothers, and P.F. Hahn. 1950. Distribution of radioactive silver solloids in tissues of rodents following injection by various routes. Proc. Soc. Exp. Biol. 74:691-695. Gettler, A.C., C.P. Rhoads, and S. Weiss. 1927. A contribution to the pathology of generalized argyria with a discussion of the fate of silver in the human body. Am. J. Pathol. 3:631-651. Goldwater, L.J., and T.W. Clarkson. 1972. Mercury. In D.H.K. Lee, ed. Metallic Contaminants and Human Health, pp. 17-55. Academic Press, New York. Goldwater, L.J. 1971. Mercury in the environment. Sci. Am. 224:15-21 Goodman, L.S., and A. Oilman, eds. 1975. The Pharmacological Basis of Therapeutics. Macmillan Pub. Co., New York. Gotsev, T. 1944. Blood pressure and heart activity. III. Action of barium on the circulation. Arch. Exp. Pathol. Pharmakol. 203:264277. Griffitts, W.R., W.H. Allaway, and D.H. Groth. 1977. Beryllium. In Geochemistry and the Enviornment. Vol. II: The Relation of Other Substances and Trace Elements to Health and Disease. National Academy of Sciences, Washington, D.C. Gross, S.B., E.A. Pfitzer, D.W. Yeager, and R.A. Kehoe. 1975. Lead in human tissues. Toxicol. Appl. Pharmacol. 32:638-351. Guy, R.D., and C.L. Chakrabarti. 1975a. Distribution of metal ions between soluble and particulate forms. International Conference on Heavy Metals in the Environment, Abstracts, Toronto, Ontario, Canada, Oct. 27-31. Guy, R.D., and C.L. Chakrabarti. 1975. Analytical techniques for speciation of trace metals. International Conference on Heavy Metals in the Environment, Abstracts, Toronto, Ontario, Canada, Oct. 27-31. pp. 275-294. Hadjimarkos, D.M. 1967. Effect of trace elements in drinking water on dental caries. J. Pediatr. 70:967-969. Hambidge, K.M. 1971. Chromium nutrition in the mother and the grow~ng child. In W. Mertz and W.E. Cornatzer, eds. Newer Trace Elements in Nutrition, pp. 169-194. Marcel Dekker, New York. Hammerstrom, R.J., D.E. Hissong, F.C. Kopfler, J. Jayer, E.F. McFarron, and B.H. Pringle. 1972. Mercury in drinking water supplies. Am. Water Works Assoc. 64:60 61. Harris, R.W., and W.R. Elsea. 1967. Ceramic glaze as a source of lead poisoning. J. Am. Med. Assoc. 202:544 546.
452 DRINKING WATER AND H"LTH Hatch, W.R., and W.L. Ott. 1968. Determination of submicrogram quantities of mercury by atomic absorption spectrophotometry. Anal. Chem. 40:2085-2087. Hem, J.D. 1970. Study and Interpretation of Chemical Characteristics of Natural Water, 2nd ea., p. 172. Geological Survey Water-Supply Paper 1473. U.S. Government Printing Office, Washington, D.C. Hemphill, D.D., ed. 1972. Trace Substances in Enviornmental Health, vol. VI. University of Missouri. Hill, W.R., and D.M. Pillsbury. 1939. Argyria: The Pharmacology of Silver. Williams .£ Wilkins Co., Baltimore. Holtzman, N.A., and R.H.A. Haslam. 1968. Elevation of serum copper following copper sulfate as an emetic. Pediatrics 42: 189-193. Hopper, S.H., and H.S. Adams. 1958. Copper poisoning from vending machines. Public Health Rep. 73:910-914. Hume, D.N. 1967. Analysis of water for trace metals. In Equilibrium Concepts in Natural Water Systems, pp. 30-44. Avd. Chem. Ser. no. 67, American Chemical Society, Washington, D.C. Ichinose, N. 1974. Extraction and atomic absorption spectrometric determination of trace copper with zinc dibenzyldithiocarbamate. Anal. Chem. Acta 70:222-226. International Agency for Research on Cancer. 1972. IARC Monographs on the Evaluation of the Carcinogenic Risk of Chemicals to Man, vol. I. World Health Organization, Geneva, Switzerland. International Agency for Research on Cancer. 1973. IARC Monographs on the Evaluation of Carcinogenic Risk of Chemicals to Man. Vol. 2: Some Inorganic and Organometallic Compounds. World Health Organization, Geneva, S`vitzerland. Issaq, H.J., and W.L. Zielinski, Jr. 1974. Hot atomic absorption spectrometry method for determination of mercury at the nanogram and subnanogram level. Anal. Chem. 46: 1436-1438. Jenne, E.A. Mercury in waters of the United States. 1970-1971. U.S. Department of the Interior, Geological Survey. Open-file report. Menlo Park, Calif. Apr. 1, 1972. Jenne, E.A., and J.W. Ball. 1972. Time stability of aqueous ammonium pyrrolidine dithiocarbamate and its manganese and nickel complexes in methyl isobutyl ketone. At. Absorpt.Newsl. 11:6~61. Jones, J.E., R. Manalo, and E.B. Flink. 1967. Magnesium requirements in adults. Am. J. Clin. Nutr. 10:632-635. Joyner, T., M.L. Healy, D. Chakravarti, and T. Koyanagi. 1967. Preconcentration for trace analysis of sea water. Environ. Sci. Technol. 1:417424. Kaminski, E.E. 1974. Interference of aluminum in the atomic absorption determination of cadmium using sodium diethyldithiocarbamate as chelating agent. Anal. Chem. 46: 1304 1305. Karalekas, P.C., Jr., G.F. Craun, A.F. Hammonds, C.R. Ryan, and D.J. Worth. 1976. Lead and other trace metals in drinking water in the Boston metropolitan area. J. New Engl. Water Works Assoc. 90: 15~172. Karlsson, B., and L. Noren. 1965. Ipecac',~nha and copper sulphate as emetics in intoxications in children. Acta Paediatr. Scand. 54:331-335. Kehoe, R.A. 1953. Report on the physiological efl~ects of some common inorganic salts in water on man and domestic animals. The Kettering Laboratory, University of Cincinnati. Kehoe, R.A. 1961. The metabolism of lead in man in health and disease. The Harben Lectures, 1960. J. R. Inst. Public Health Hyg. 24:81-97, 129-143, 177-203.
Inorganic Solutes 453 Kehoe, R.A., J. Cholak, and E.J. Largent. 1944. The hygienic significance of the contamination of water with certain mineral constitutents. J. Am. Water Works Assoc. 36:645-657. Kehoe, R.A., J. Cholak, and E.J. Largent. 1944. The concentrations of certain trace metals in drinking water. J. Am. Water Works Assoc.36:637-644. Kehoe, R.A., J. Cholak, and R.V. Story. 1940. Manganese, lead, tin, aluminum, copper and silver in normal biological material. J. Nutr.20:85-98. Kent, N.L., and R.A. McCance. 1941. The absorption and excretion of"minor" elements by man. II. Cobalt, nickel, tin, and manganese. Biochem. J. 35:877-883. Kerber, J.D., and F.J. Fernandez, 1971. The determination of trace metals in aqueous solution with the Delves sampling cup technique. At. Absorpt. Newsl. 10:78-80. King, B.G. 1971. Maximum daily intake of lead without excessive body lead-burden in children. Am. J. Dis. Child. 122:337-340. Kinrade, J.D., and J.C. Van Loon. 1974. Solvent extraction for use with flame atomic absorption spectrometry. Anal. Chem. 46: 1894-1898. Kirkbright, G.F. and M. Sargent. 1974. Atomic Absorption and Fluorescence Spectroscopy. Academic Press, New York. Klein, M., R. Namer, E. Harpur, and R. Corbin. 1970. Earthenware containers as a source of fatal lead poisoning: Case study and public-health considerations. N. Engl. J. Med. 283:669-672. Klimmer, O.R. 1968. Toxicologicl viewpoint on the application of organotin fungicides in agriculture. Pflanzenschutzberichte, 37:57-66. Ko~bye, A.C., Jr., K.R. Mahaffey, J.A. Fiorino, P.C. Corneliussen, and C.F. Jelinek. 1974. Food exposures to lead. Environ. Health Perspect.7:65-74. Konovalov, G.S., A.A. Ivanova, end T.K. Kolensnikova. 1966. Rare and dispersed elements (microelements) in the water and in the suspended substances in rivers of the European Territory of USSR. Gidrokhimi. Mater. (trans.) 42:94111. Kopp, J.F., and R.C. Kroner. 1967. Trace metals in waters of the United States. A five-year summary of trace metals in rivers and lakes of the United States (Oct. 1, 1962-Sept. 30, 1967). U.S. Department of the Interior, Federal Water Pollution Control A'lministration, Division of Pollution Surveillance, Cincinnati, Ohio. Kopp, J.F. 1969. The occurrence of trace elements in water. In D.D. Hemphill, ed. Proceedings of the Third Annual Conference on Trace Substances in Environmental Health, 1969, pp. 59-73. University of Missouri, Columbia. Korkisch, J., and A. Sorio. 1975. Determination of cadmium, copper and lead in natural waters after anion exchange separation. Anal. Chem. Acta 76:393-399. Krasovskii, G.N., and S.A. Fridlyand. 1971. Experimental data for the validation of the maximum permissible concentration of cobalt in water bodies. Hyg. Sanit. (trans. of Gig. Sanit) 36:277-279. Kubota, J., E.L. Mills, and R.T. Oglesby. 1974. Lead, Cd, Zn, Cu. and Co in streams and lake waters of Cayuga Lake basin, New York. Environ. Sci. Technol. 8:243-248. L,vov, B.V. 1970. Atomic Absorption Spectrochemical Analysis. Adam Hilger, London. Lancranj an, I., H.I. Popescu, O. Gavanescu, I. Klepsch, and M. Servanescu. 1975. Reproductive ability of workmen occupationally exposed to lead. Arch. Env~ron. Health 30:396401. Landrigan, P.J., S.H. Gehlbach, B.F. Rosenblum, J.M. Shoults, R.M. Candelaria, W.F. Barthel, J.A. Liddle, A.L. Smrek, N.W. Staehling, and J.F. Sanders. 1975. Epidemic lead absorption near an ore smelter. The role of particulate lead. N. Engl. J. Med. 292: 123- 129.
454 DRINKING WATER AND H"LTH Lauwerys, R., J.P. Buchet, H. Roels, A. Berlin and J. Smeets. 1975. Intercomparison program of lead, mercury, and cadmium analysis in blood, urine, and aqueous solutions. Clin. Chem. 21:551-557. Lieber, M. 1954. Contamination of ground water by cadmium. J. Am. Water Works Assoc. 46:541-547. Linstedt, K.D., C.P. Houck, and J.T. O'Commor. 1971. Trace element removals in advanced waste water treatment processes. J. Water Pollut. Control Fed. 43: 1507-1513. Livingstone, D.A. 1963. Chemical composition of rivers and lakes. In M. Fleischer, ed. Data of geochemistry, 6th ed. Geological Survey Professional Paper NAG. U.S. Government Printing Office, Washington, D.C. Lockhart, E.E., C.L. Tucker, and M.C. Merrit. 1955. The effect of water impurities on the flavor of brewed coffee. Food Res. 10:598-605. Logsdon, G.S., and J.M. Symons. 1973. Removal of trace inorganics in drinking water treatment unit processes. Am. Inst. Chem. Eng. Meet., Detroit, June 1973. Paper 482 Logsdon, G.S., and J.M. Symons. 1973. Removal of heavy metals by conventional treatment. Conference on Traces of Heavy Metals in Water Removal Processes and Monitoring, Princeton University, Princeton, N.J., Nov. 15-16, 1973, pp. 225-226. U.S. Environmental Protection Agency. EPA 902/9-74001. Logsdon, G.S., and J.M. Symons. 1973. Mercury removal by conventional water-treatment techniques. J. Am. Water Works Assoc. 5:55~562. Lu, F.C., P.E. Berteau, and D.J. Clegg. 1972. The toxicity of mercury in man and animals. In Mercury Contamination in Man and His Environment, pp. 67-85. International Atomic Energy Agency, Vienna. Lundgren, K.D., A. Swensson, and U. Ulfarvson. 1967. Studies in humans on the distribution of mercury in the blood and the excretion in urine after exposure to di~erent mercury compounds. Scand. J. Clin. Lab. Invest. 20: 164-166. Maines, I.S., K.M. Aldous, and D.G. Mitchell. 1975. Determination of lead in potable waters using Delves cup atomic-absorption spectrometer with signal integration. Environ. Sci. Technol. 9:549-551. McCabe, L.J., and J.C. Vaughn. 1969. Trace metals content of drinking water from a large system. Presented at National Meeting, American Chemical Society, Minneapolis, Minn. McCabe, L.J., J.M. Symons, R.D. Lee, and G.G. Robeck. 1970. Survey of community water supply systems. J. Am. Water Works Assoc. 62: 67~687. McKee, J.E., and H.W. Wolf (eds.). 1963. Water Quality Criteria, 2nd ed. The Resources Agency of California State Water Resources Control Board Publication no. 3-A (Reprint December, 1971). Sacramento. McKee, J.E., and H.W. Wolf. 1976. Water Quality Criteria. California State Water Quality Control Board Publication no.3-A, Sacramento. Mertz, W. 1972. Human requirements: Basic and optimal. N.Y. Acad. Sci. Ann. 199: 191- 201. Miller, R.F., N.O. Price, and R.W. Engel. 1959. The m~croelement (Zn, Mn, Cu. Mo, and Co) balance of 7-9 year old girls. Fed. Proc. 18:538. Minear, R.A. 1975. Analytical techniques for measuring and monitor~ng trace metals. J. Am. Water Works Assoc. 67:9-14. Monier-Williams, G.W. 1949. Trace Elements in Foods. Chapman-Hall, Ltd., London. Monty, K.J. 1960. Effects of trace amounts of molybdenum. In Proceedings, Conference on Physiological Aspects of Water Quality, pp. 75-78. U.S.Public Health Service, Washing- ton, D.C. Moore, M.R., P.A. Meredith, A. Goldberg, K.E. Carr, P.G. Toner, and T.D.V. Lawrie. 1975. Cardiac e~ects of lead in drinking water of rats. Clin. Sci. Molecu. Med. 49:337-341.
Inorganic Solutes 455 Morik, J., and Z. Morlin. 1959. Pollution of the air of industrial regions by metals. Nepeqeszsegugy 40:288-293, reported in Chemical Abstracts, 57, 8850f (1962). Mulford, C.E. 1966. Solvent extraction techniques for atomic absorption spectroscopy. At. Absorpt. Newsl. 5:88-90. National Academy of Sciences-National Research Council. Environmental Studies Board. 1973. Water Quality Criteria 1972. EPA Report. EPA-R3-73-033. Washington, D.C. National Academy of Sciences-National Research Council. Division of Medical Sciences. 1974. Medical and Biological Effects of Environmental Pollutants: Chromium. Washing ton, D.C. National Academy of Sciences-National Research Council. Division of Medical Sciences. 1972. Lead: Airborne Lead in Perspective. Washington, D.C. National Academy of Sciences-National Research Council. Assembly of Life Sciences. Committee on Toxicology. 1976. Recommendations for the Prevention of Lead Poisoning in Children. Washington, D.C. National Academy of Sciences-National Research Council. Division of Medical Sciences. 1973. Medical and Biologic Effects of Environmental Pollutants: Manganese. Washing- ton, D.C. National Academy of Sciences-National Research Council. Division of Medical Sciences. 1975. Medical and Environmental Effects of Environmental Pollutants: Nickel. Wash- ington, D.C. National Academy of Sciences-National Research Council. Division of Medical Sciences. 1974. Medical and Environmental Effects of Environmental Pollutants: Vanadium. Washington, D.C. National Academy of Sciences-National Research Council. Food and Nutrition Board. 1973. Toxicants Occurring Naturally in Foods, 2nd ed. Washington, D.C. National Academy of Sciences-National Research Council. Food and Nutrition Board. 1974. Recommended Dietary Allowances, 8th ed. Washington, D.C. National Technical Advisory Committee. 1969. Raw water quality criteria for public supplies. J. Am. Water Works Assoc. 61: 133-138. Naylor, L.M., and R.R. Dague. 1975. Simulation of lead removal by chemical treatment. J. Am. Water Works Assoc.67:560-565. Negus, S.S. 1938. The physiological aspects of mineral salts in public water supplies. J. Am. Water Works Assoc. 30:242-264. Nicholas, P.O. 1968. Food-poisoning due to copper in the morning tea. Lancet 2:40 42. Nilsson, R. 1971. Removal of metals by chemical treatment of municipal waste water. Water Res. 5:51-60. Nix, J., and T. Goodwin. 1970. The simultaneous extraction of iron, manganese, copper, cobalt, nickel, chromium, lead and zinc from natural water for determination by atomic absorption spectrocopy. At. Absorpt. Newsl.9: 119-122. Nordberg, G.F. (ed.) 1976. Effects and Dose-Response Relationships of Toxic Metals. Elsevier Scientific Publishing Co., Amsterdam. Nordell, E. 1961. Water Treatment for Industrial and Other Uses, 2nd ed. Reinhold Publishing Co., New York. Norgaard, O. 1954. Investigation with radioactive Ag into the resorption of silver through human skin. Acta Dermato-Venerol.34:415419. Olcutt, C.T. 1950. Experimental argyrosis. V. Hypertrophy oftheleft ventricle of the heart in rats ingesting silver salts. Arch. Pathol. 49: 138-149. Oliver, S. 1974. Mood and trace metals in drinking water. Master of Science Thesis. The Johns Hopkins University, School of Hygiene and Public Health, Baltimore, Md.
456 DRINKING WATER AND H"LTH Omang, S.H. 1971. Determination of mercury in natural waters and effluents by flameless atomic absorption spectrophotometry. Anal. Chem. Acta 53:415-419. Paus, P.E. 1971. The application of atomic absorption spectroscopy to the analysis of natural waters. At. Absorpt. Newsl. 10:69-71. Pickering, Q.H., and C. Henderson. 1966. The acute toxicity of some heavy metals to different species of warmwater fishes. Int. J. Air Water Pollut. 10:453-463. Poller, R.C. 1970. The Chemistry of Organotin Compounds. Academic Press, New York. Pomelee, C.S. 1953. Toxicity of beryllium. Sewage Ind. Wastes 25: 14241428. Price, W.J. 1972. Analytical Atomic Absorption Spectrometry. Heyden and Son, London. Proctor and Gamble Co. 1974. Nitrilotriacetate Levels in Canadian Waters. Drinking Water Survey Progress Report no. 1. Ramage, H. 1930. Mushrooms-Mineral content. Nature 126:279. Ramamoorthy, S., and D.J. Kushner. 1975. Binding of heavy metal ions by river water. International Conference on Heavy Metals in the Environment, Abstracts, Toronto, Ontario, Canada, Oct. 27-31, pp. D-l9-D-21. Ramirez-Munoz, J. 1968. Atomic-Absorption Spectroscopy and Analyses by Atomic- Absorption Flame Photometry. Elsevier Publishing Co., New York. Rattonetti, A. 1974. Determination of soluble cadmium, lead, silver, and indium in rainwater and stream water with the use of flameless atomic absorption. Anally. Chem. 46:739-742. Renn, C.E., W.E. Chesney, and S.L. Chang. 1955. Effect of hyla 603K on cysts of E. histolytic and bactericidal efficiencies of hyla 603D filtrate. The Johns Hopkins University, Institute for Cooperative Research, Project Report PG 49.33. Renshaw, G.D. 1973.`The determination of barium by flameless atomic absorption spectrophotometry using a modified graphite tube atomizer. At. Absorpt. Newsl. 12: 158- 160. Renshaw, G.D., C.A. Pounds, and E.F. Pearson. 1973.Theq~ntitativeestimationoflead, antimony and barium in gunshot residues by nonflame atomic absorption spectropho- tometry. At. Absorpt. Newsl. 12:55-56. Reynolds, R.J., and K. Aldous. 1970. Atomic Absorption Spectroscopy: A Practical Guide. Barnes and Noble, Scranton, Pa. Robinson, J.W. 1975. Atomic Absorption Spectroscopy. Marcel Dekker Co., New York. Roels, H.A. 1975. Response of some heme biosynthetic pathway parameters in men, women, and children moderately exposed to lead. In International Conference on Heavy Metals in the Environment, Abstracts, Toronto, Ontario, Canada, Oct. 27-31, pp. B-57- B-60. Roshchin, I.V., A.V. Il'nitskaia, L.A. Lutsenko, and L.V. Zhidkova. 1965. Effect on organism of vanadium trioxide. Fed. Proc. 24:611-613. Sachdev, S.L. and P.W. West. 1969. Concentration and determination of traces of metal ions. Anal. Chem. Acta 44:301-307. Sachdev, S.L., and P.W. West. 1970. Concentration of trace metals by solvent extraction and their determination by atomic absorption spectrophotometry. Environ. Sci. Technol. 4:749-751. Salvidio, E., I. Pannaccivlli, and A. Tizianello. 1963. Glucose-6-phosphate and 6-phospho- gluconic dehydrogenase activities in the red blood cells of several animal species. Nature 200:372-373. Sandstead, H.H. 1976. Interactions of cadmium and lead with essential minerals. In G.F. Nordberg. Effects and Dose-Response Relationships of Toxic Metals, pp. 511-526. Elsevier Scientific Publishing Co., Amsterdam.
Inorganic Solutes 457 Sandstead, H.H. 1974. Cadmium, zinc, and lead. In Geochemistry and the Environment. Vol. I: The Relation of Selected Trace Elements to Health and Disease, pp. 43-56. National Academy of Sciences, Washington, D.C. Sayre, J.W., E. Charney, J. Vostal, and I.B. Pless. 1974. House and hand dust as a potential source of childhood lead exposure. Am. J. Dis. Child. 127: 167-170. Scanlon, J.W. 1975. Dangers to the human fetus from certain heavy metals in the environment. Rev. Environ. Health 2:39-64. Scheinbert, I.H., and I. Sternlieb. 1965. Wilson's disease. Ann. Rev. Med. 16:119-134. Schroeder, D.C., and G.F. Lee. 1975. Potential transformations of chromium in natural waters. Water Air Soil Pollut. 4:355-365. Schroeder, H.A. 1970. Chromium American Petroleum Institute Air Quality Monograph No. 70-15. Washington, D.C. Schroeder, H.A., and M. Mitchener. 1975. Life-term effects of mercury, methyl mercury, and nine other trace metals on mice. J. Nutr. 105:452458. Schroeder, H.A. 1974. The role of trace elements in cardiovascular disease. Med. Clin. N. Am.58:381-396. Schroeder, H.A., A.P. Nason, and I.H. Tipton. 1969. Essential metals in man: Magnesium. J. Chron. Dis. 21 :815-841. Schroeder, H.A., A.P. Nason, I.H. Tipton, and J.J. Balassa. 1966. Essential trace metals in man: Copper. J. Chron. Dis. 19: 1007-1034. Schroeder, H.A., J.J. Balassa, and I.H. Tipton. 1970. Essential trace elements in man: Molybdenum. J. Chron. Dis. 23:481499. Schroeder, H.A., J.J. Balassa, and I.H. Tipton. 1964. Abnormal trace elements in man: Tin. J. Chron. Dis. 17:483-502. Schwarz, K., D.B. Milne, and E. Vinyard. 1970. Growth effects of tin compounds in rats maintained in a trace element-controlled environment. Biochem. Biophys. Res. Com- mun. 40:22-29. Seaber, W.M. 1933. Barium as a normal constituent of Brazil nuts. Analyst 58:575-580. Semmens, M.J. 1975. Unpublished data. Semple, A.B., W.H. Parry, and D.E. Phillips. 1960. Acute copper poisoning; an outbreak traced to contaminated water from a corroded geyser. Lancet 2:700 701. Shakman, R.A. 1974. Nutritional influence on the toxicity of environmental pollutants. A review. Arch. Environ. Health 28: 105-113. Shapiro, M.A., W.H. Hill, P.K. Chin, and Y. Kobayashi. 1962. Physiological Aspects of Water Quality. University of Pittsburgh, RG5309. Shapiro, M.A., W.H. Hill, F.A. Rosenberg, and G.F. Lee.1960. Report on research project at University of Pittsburgh. In Proceedings, Conference on Physiological Aspects of Water Quality, pp. 223-231. U.S. Public Health Service, Washington, D.C. Shigematsu, T., M. Matsui, O. Fujino, and K. Kinoshita. 1975. Determination of manganese in natural waters by atomic absorption spectrometry with a carbon tube atomizer. Anal. Chiem. Acta 76:329-336. Shouse, S.S., and G.H. Whipple. 1931. I. Effects of the intravenous injection of colloidal silver upon the hemopoietic system in dogs. J. Exp. Med. 53:413. Sigworth, E.A., and S.B. Smith. 1972. Adsorption of inorganic compounds by activated carbon. J. Am. Water Works Assoc.64:386. Singer, P.C. 1974. Chemical processes for the removal of trace metals from drinking waters. In Trace Metals in Water Supplies: Occurrence, Significance, and Control. Proceedings, 16th Water Quality Conference, University of Illinois, Urbana, Feb. 1974. Slavin, W. 1968. Atomic Absorption Spectroscopy. John Wiley-Interscience, New York. Sollman, T. 1957. A Manual of Pharmacology, 8th ed. W.B. Saunders Co., Philadelphia.
458 DRINKING WATER AND H"LTH Sterner, J.H., and M. Eisenbud. 1951. Epidemiology of beryllium intoxication. Arch. Ind. Hyg. Occup. Med. 4: 123-151. Stofen, D. 1973. The maximum permissible concentrations in the U.S.S.R. for harmful substances in drinking water. Toxicology 1: 187-195. Stokinger, H.E., and R.L. Woodward. 1958. Toxicologic methods for establishing drinking- water standards. J. Am. Water Works Assoc. 50(4):515-529. Stokinger, H.E. 1972. In I.R. Tabershaw, ed. The Toxicology of Beryllium. Public Health Service Publication 2173. U.S. Department of Health, Education, and Welfare, Public Health Service, Washington, D.C. Straub, C.P. 1964. Low Level Radioactive Wastes. U.S. Government Printing Office, Washington, D.C. Streeten, D.H.P., M.M. Gerstein, B.M. Marmor, and R.J. Doisy. 1965. Reduced glucose tolerance in elderly human subjects. Diabetes 14:579-583. Sunderman, F.W., Jr. 1971. Metal carcinogenesis in experimental animals. Food. Cosmet. Toxicol. 9: 105-120. Surles, T., J.R. Tuschall, Jr., and T.T. Collins. 1975. Comparative atomic absorption spectroscopic study of trace metals in lake water. Environ. Sci. Technol. 9: 1073-1075. Szastak, W. 1961. The role of magnesium in the body. Poll Med. Wkly. 16(34): 1421-1424. Takeuchi, T. 1972. Biological reactions and pathological changes in human beings and animals caused by organic mercury contamination. In R. Hartung and B.D. Dinman, eds. Environmental Mercury Contamination, an International Conference, University of Michigan, Sept. 3~0ct. 2, 1970. Ann Arbor Science Publishers, Inc., Ann Arbor, Mich. Tepper, L.B., and L.S. Levin. 1975. A survey of air and population lead levels in selected American communities. In F. Coulston and F. Korte, eds. Environmental Quality and Safety, Supplement vol. II, Lead, ed. by T.B. Griffin and J.H. Knelson, pp. 152-196. New York, Academic Press. Ter Haar, G., and R. Aronow. 1975. Tracer studies of ingestion of dust by urban children. In F. Coulston and F. Korte, eds. Environmental Quality and Safety, Supplement vol. II, Lead, ed. by T.B. Griffin and J.H. Knelson, pp. 197-201. New York, Academic Press. Tipton, I.H., P.L. Stewart, and P.G. Martin. 1966. Trace elements in diets and excrete. Health Phys. 12:1682-1689. Todd, J.R. 1969. Chronic copper toxicity of ruminants. Proc. Nutr. Soc. 28: 189-198. Trace elements in clinical chemistry. 1975. Clin. Chem. 21 :467-634. (Special Issue) Traversy, W.J. 1971. Methods for Chemical Analysis of Waters and Wastewaters. Ottawa, Canada, Department of Fisheries and Forestry, Inland Waters Branch, Water Quality Division. U.S. Environmental Protection Agency. 1975. Region V joint federal/state survey of organics and inorganics in selected drinking water supplies. Draft report. Chicago. U.S. Environmental Protection Agency. 1973. Water programs. Guidelines establishing test procedures for analysis of pollutants. Fed. Reg.38 (199): 28758-28760, Oct. 16. U.S. Environmental Protection Agency. 1976. Methods for chemical analysis of waters and wastewater. Cincinnati, Ohio. U.S. Environmental Protection Agency. 1975. Water programs. National interim primary drinking water regulations. Fed. Reg. 40(248), 59566-59588, Dec. 24. U.S. Environmental Protection Agency. 1975. Scientific and technical assessment report on manganese. EPA 600/6-75-002. National Environmental Research Center, Research Triangle Park, N.C. U.S. Environmental Protection Agency. 1975. Chemical analysts ofinterstate carrier wafer supply systems. EPA-430/9-75-005. Washington, D.C.
Inorganic Solutes 459 U.S. Environmental Protection Agency Order. 1976. Decision of the Administrator on the cancellation of pesticides containing mercury. FIFRA Dockets 246, Febuary 17. U.S. Environmental Protection Agency. 1973. Water Quality Criteria, 1972. EPA.R.73.033, March. U.S. Environmental Protection Agency. 1975. Preliminary Investigation of Effects on the Environment of Boron, Indium, Nickel, Selenium, Tin, Vanadium, and Their com- pounds. Vol. VI: Vanadium. EPA/560/2-75/005f. Washington, D.C. U.S. Food and Drug Administration. 1975. Toxicity of the essential minerals-Information pertinent to establishing appropriate levels of single-mineral dietary supplements. Washington, D.C. U.S. Geological Survey. 1959. Study and interpretation of the chemical characteristics of natural water. Water Supply Paper 1473. U.S. Geological Survey Sampling Data. U.S. Geological Survey. 1970. Mercury in the Environment. A Compilation of Papers on the Abundance, Distribution, and Testing of Mercury in Rocks, Soils, Waters, Plants, and the Atmosphere. Professional Paper 713. Washington, D.C. Underwood, E.J. 1971. Trace Elements in Human and Animal Nutrition, 3rd ed. Academic Press, New York. Underwood, E.J. 1973. Trace elements. In Toxicants Occurring Naturally in Foods, 2nd ea., pp. 43-87. National Academy of Sciences, Washington, D.C. Velhagin, K., Jr. 1953. Zur Hornhautargyrose. Klin. Mbl. AugenheiLk. 122:36~2. Von Nageli, C. 1893. Neu Deuschr. Allg. Schweig-Ges. Gesam. Naturu 33. Walker-Smith, J., and J. Blomf~eld. 1973. Wilson's disease or chronic copper poisoning? Arch. Dis. Child. 48:476~79. Wallace, R.A., W. Fulkerson, W.D. Shults, and W.S. Lyon. 1971. Mercury in the Environment: The Human Element. Oak Ridge National Laboratory. ORNL NSF-EP- 1, Oak Ridge, Tenn. West, F.K., P.W. West, and T.V. Ramakrishna. 1967. Stabilization and determination of traces of silver in waters. Environ. Sci. Technol. 1:717-720. Wolf, H.W. Personal Communication (1975). Wong, P.T.S., Y.K. Chau, and P.L. Luxon. 1975. Methylation of lead in the environment. Nature 253:263-264. Wood, J.M. 1976. Metabolic cycles for toxic elements in the aqueous environment. In O. Bessey, Status of marine biomedical research. Environ. Health Perspect. 13:147-163. World Health Organization. 1970. European Standards for Drinking Water, 2nd ed. Geneva, Switzerland. World Health Organization. 1971. International Standards for D6nking Water, 3rd ed. Geneva, Switzerland. World Health Organization. 1972. Evaluation of mercury, lead cadmium and the food additives amaranth, diethylpyrocarbonate, and octyl gallate, p. 20. WHO Food Additives Series, no. 4. p. 20. World Health Organization. 1973. Trace Elements in Human Nutrition, pp. 38-39. Technical Report Series no. 532. Geneva, Switzerland. Wyllie, J. 1957. Copper poisoning at a cocktail party. Am. J. Public Health 47:617. Yanagisawa, M., M. Suzuki, and T. Talceuchi. 1969. Extraction of manganese dithiocarba- mate complexes for atomic absorption spectrophotometry. Anal. Chiem. Acta 43: 50 502. Zielbuis, R.L. 1975a. Dose-response relationships for inorgan~c lead. I. Biochemical and haematological responses. Int. Arch. Occup. Health 35: 1-18. -~ rr
460 DRINKING WATER AND H"LTH Zielbuis, R.L. 1975b. Dose-response relationships for inorganic lead. II. Subjective and functional responses-chronic sequelae-no-response levels. Int. Arch. Occup. Health 35: 19-35. REFERENCES FOR ARSENIC AND SELENIUM Abu-Erreish, G.M. 1967. On the nature of some selenium losses from soils and waters. M.S. Thesis. South Dakota State University, Brookings. Albright, S.D. III, and J.M. Hitch. 1966. Rapid treatment oftinea versicolor with selenium sulfide. Arch. Dermatol. 93:460462. Aldrich, C.J. 1904. Leuconychia striate arsenicalis transverses. With report of three cases. Am. J. Med. Sci. 127:702-709. Amor, A.J., and P. Pringle. 1945. A review of selenium as an industrial hazard. Bull. Hyg. 20:239-241. Anderson, M.S., H.W. Lakin, K.C. Beeson, F.F. Smith, and E. Thacker. 1961. Selenium in Agriculture. U.S. Department of Agriculture Handbook 200. U.S. Government Printing Office, Washington, D.C. Baird, R.B., S. Pourian, and S.M. Gabrielian. 1972. Determination of trace amounts of selenium in waste waters by carbon rod atomizaion. Anal. Chem. 44:1887-1889. Baroni, C., G.J. Van Esch, and U. Saffiotti. 1963. Carcinogenesis tests of two inorganic arsenicals. Arch. Environ. Health 7:668-674. Beath, O.A. 1962. Selenium poisoning in Indians. Sci. News Letter 81:254. Beath, O.A. 1962a. The Story of Selenium in Wyoming. University of Wyoming, Laramie. Beath, O.A., A.F. Hagner, and C.S. Gilbert. 1946. Some Rocks of High Selenium Content. Wyoming Geological Survey Bull. no. 36. The Geological Survey of Wyoming, University of Wyoming, Laramie. Bergoglio, R.M. 1964. Mortalidad por cancer en zones de agues arsenicales de la Provincia de Cordoba, Republica Argentina. Prensa Med. Argent. 51:994998. Bertine, K.K., and E.D. Goldberg. 1971. Fossil fuel combustion and the major sedimentary cycle. Science 173:233-235. Betteridge, D. 1965. Determination of selenium in hair by neutron-activation analysis. United Kingdom Atomic Energy Research Establishment Report no. AERER4881. London. Bird, H.R., A.C. Groschke, and M. Rubin. 1949. Effect of arsenic acid derivatives in stiumlating growth in chickens. J. Nutr. 37:215-226. Blau, M., and M.A. Bender. 1962. Se75-selenomethionine for visualization of the pancreas by isotope scanning. Radiology 78:974. Blau, M., and R.F. Manske. 1961. The pancreas specificity of Se75-selenomethionine. J. Nucl. Med. 2:102-105. Borgono. J.M., H. Venturino, and P. Vincent. 1976. Arsenic in the drinking water of the city of Antofogasta: Epidemiological and clinical study before and after the installation of a treatment plant. Presented at an International Conference on Environmental Arsenic. Co-sponsored by NIEHS and the Karolinska Institute. Fort Lauderdale, Fla. Borgono, J.M., and R. Greiber. 1972. Epidemiological study of arsenicism in the city of Antofasgasta. In D.D. Hemphill, ed. Trace Substances in Environmental Health. Pr~dings of the University of Missouri's 5th Annual Conference on Trace Substances in Environmental Health, June 29-July 1, 1971. University of Missouri, Columbia.
Inorganic Solutes 461 Boutwell, R.K. 1963. A carcinogenicity evaluation of potassium arsenite and arsanilic acid. J. Agric. Food Chem. 11:381-385. Bowen, H.J.M., and P.A. Cawse. 1963. The determination of selenium in biological material by radioactivation. Analyst 88:721-726. Braun, W. 1958. Carcinoma of the skin and the internal organs caused by arsenic: Delayed occupational lesions due to arsenic. Ger. Med. Mon. 3 :321-324. Brown, D.G., and R.F. Burk. 1973. Selenium retention in tissues and sperm of rats fed a Torula yeast diet. J. Nutr. 103:102-108. Brown, D.G., R.F. Burk, R.J. Seely, and K.W. Kiker. 1972. Effect of dietary selenium on the gastrointestinal absorption of(75SeO ~ in the rat. Int. J. Vit. Nutr. 42:588-591. Broyer, T.C., D.C. Lee, and C.J. Asher. 1966. Selenium nutrition of green plants. Effect of selenite supply on growth and selenium content of alfalfa and subterranean clover. Plant Physiol. 41:1425-1428. Buchan, R.F. 1947. Industrial selenosis. A review of the literature, report of five cases and a general bibliography. Occup. Med. 3:439-456. Buck, W.B. 1969. Untoward reaction encountered with medicated feeds. In The Use of Drugs in Animal Feeds, Proceedings of a Symposium. Publ. no. 1679. National Academy of Sciences, Washington, D.C. Buck, W.B., G.D. Osweiler, and G.A. Van Gelder. 1973. Clinical and Diagnostic Veterinary Toxicology. Kendall Hunt Publishing Co., Dubuque, Iowa. Bull, R.C., and J.E. Oldfield. 1967. Selenium involvement in the oxidation by rat liver tissue of certain tricarboxylic acid cycle intermediates. J. Nutr. 91:237-246. Burk, R.F., D.G. Brown, R.J. Seely, and C.C. Scaief III. 1972. Influence of dietary and injected selenium on whole-body retention, route of excretion, and tissue retention of 75SeO=in the rat. J. Nutr. 102:1049-1055. Burk, R.F., Jr., W.N. Pearson, R.P. Wood II, and F. Viteri. 1967. Blood-selenium levels and in vitro red blood cell uptake of 75Se in kwashiorkor. Am. J. Clin. Nutr. 20:723-733. Burk, R.F., R.J. Seely, and K.W. Kiker. 1973. Selenium: Dietary threshold for urinary excretion in the rat. Proc. Soc. Exp. Biol. Med. 142:214216. Buttner, W. 1963. Action of trace elements on the metabolism of fluoride. J. Dent. Res. 42:453 460. Byers, H.G., T.J. Miller, K.T. Williams, and H.W. Lakin. 1938. Selenium occurrence in certain soils in the United States with a discussion of related topics. Third report, U.S. Department of Agriculture Technical Bulletin no. 601. U.S. Department of Agriculture, Washington, D.C. Byron, W.R., G.W. Bierbower, J.B. Brouwer, and W.H. Hansen. 1967. Pathologic changes in rats and dogs from two-year feeding of sodium arsenite or sodium arsenate. Toxicol. Appl. Pharmacol. 10:132-147. Campo, R.D., and R.J. Bieln. 1971. Acute toxic effects of sodium selenate on the epiphyseal plate of the rat. Calc. Tiss. Res. 7:318-330. Cannon, H.L. 1974. Natural toxicants of geolog~c origin and their availability to man. In P.L. White and D. Robbins, eds. Symposium on Environmental Quality in Food Supply, pp. 143-164. Futura Publishers. Caravaggi, C., F.L. Clark and A.R.B. Jackson. 1970. Acute selenium toxicity in lambs following intramuscular injection of sodium selenite. Res. Vet. Sci. 2:14~149. Carey, W.F. 1968. Determination of arsenic in organic arsenates. J. Assoc. Off. Anal. Chem. 51:1300. Carter, R.F. 1966. Acute selenium poisoning. Med. J. Aust. 1 :S25-528. Cerwenka, E.A., Jr., and W.C. Cooper. 1961. Toxicology of selenium and tellurium and their compounds. Arch. Environ. Health 3:189-200.
462 DRINKING WATER AND H"LTH Chau, Y.K., P.T.S. Wang, B.A. Silverberg, P.L. Luxon, and G.A. Bengert. 1976. Methylation of selenium in the aquatic environment. Science 192:1130-1131. Clarke, E.G.C., and M.L. Clarke. 1967. Arsenic. In Garner's Veterinary Toxicology. 3rd ed. Williams ~ Wilkins Co., Baltimore. Clayton, C.C., and C.A. Baumann. 1949. Diet and azo dye tumors: Effect of diet during a period when the dye is not fed. Cancer Res. 9:575-582. Clinton, M., Jr. 1947. Selenium fume exposure. J. Ind. Hyg. Toxicol. 29:225-226. Cohen, L.B. 1954. Use of"Selsun" in blepharitis marginalis. Am. J. Ophthal. 38: 560-562. Cooper, W.C. 1967. Selenium toxicity in man. In O.H. Muth, ed. SYmposium. Selenium in Biomedicine. AVI Publishing Co., Inc., Westport, Conn. Cousins, F.B. 1960. A fluorimetric microdetermination of selenium in biological materials. Aust. J. Exp. Biol. Med. Sci. 38:11-16. Crecelius, E.A., and R. Carpenter. 1974. Arsenic distribution in waters and sediments of the Puget Sound region. In Proceedings, First National Science Foundation Trace Contami- nants Conference. Cummings, J.G. 1966. Pesticides in the total diet. Res. Rev. 16:30. Cummins, L.M., and J.L. Martin. 1967. Are selenocystine and selenomethionine synthe- sized in vitro from sodium selenite in mammals? Biochemistry 6:3162-3168. Czapek, F., and J. Weil. 1893. Uber die wirkung des selens and Tellurs auf dem thierischen organismus. Naunyn-Schmiedeberg's Arch, Exp. Pathol. Pharmakol 32:438-45S. Davis, W.E. 1972. National inventory of sources emissions: Barium, boron, copper, selenium and zinc. Environmental Protection Agency. Air Programs. Leawood, Kansas. W.E. Davis and Associates, Contract no. 68-02-0100. Diplock, A.T. 1976. Metabolic aspects of selenium action and toxicity. CRC Crit. Rev. Toxicol. 4:271-329. Diplock, A.T., J. Green, J. Bunyan, D. Mchale, and I.R. Muthy. 1967. Vitamin E and stress. 3. The metabolism of D-a-tocopherol in the rat under dietary stress with silver. Br. J. Nutr. 21:115-125. DiGuilio, W., and W. Beirwaltes. 1964. Parathyroid scanning with selenium75 labeled methionine. J. Nucl. Med. 5:417-427. Douglas, C.P. 1969. Assessment of placental competence. Scot. Med. J. 14: 162-170. Ducoff, H.S., W.B. Neal, R.L. Straube, L.O. Jacobson, and A.M. Brues. 1948. Biological studies with arsenic76. II. Excretion and tissue localization. Proc. Soc. Exp. Biol. Med. 69:548-554 Dudley, H.C., and J.W. Miller. 1937. Toxicology of selenium. IV. Effects of exposure to hydrogen selenide. U.S. Public Health Rep. 52:1217-1231. Dudley, H.C., and J.W. Miller. 1941. Toxicology of selenium. VI. Effects of subacute exposure to hydrogen selenide. J. Ind. Hyg. Toxicol. 23:47~477. Dudley, H.C. 1938. Selenium as a potential industrial hazard. U.S. Public Health Rep. 53:281-292. Dudley, H.C. 1938. Toxicology of selenium. V. Toxic and vesicant properties of selenium oxychloride. U.S. Public Health Rep. 53:94-98. Duggan, R.E., and G.Q. Lipscomb. 1969. Dietary intake of pesticide chemicals in the United States. June 196~April 1968. Pesticide Monit. J. 2:153. Durum, W.H. 1974. Occurrence of some trace metals in surface waters and ground waters. Proc. Water Qual. Conf. 16:17-25. Durum, W.H., J.D. Hem, and S.G. Heidel. 1971. Reconnaissance of selected minor elements in surface waters of U.S. U.S. Geological Survey Circular 643. Dutkiewicz, T., B. Dutkiewicz, and I. Balcerska. 1971. Dynamics of organ and tissue -~ --r
Inorganic Solutes 463 distriution of selenium after intragastric and dermal administration of sodium selenite. Bromatol. Chem. Toksykol. 4:475-481 (Chem. Abstr. 77:1476,1972). Eagle, H., and G.O. Doak. 1951. The biological activity of arsenobenzenes in relation to their structure. Pharmacol. Rev. 3:107-143. Edmond, C.R. 1967. Dental caries etiology in New Guinea. Some contributions from analytical chemistry. Aust. Miner. Dev. Lab. Bull. 4:17-36. Eisenberg, B.C. 1955. Contact dermatitis from selenium sulfide shampoo. Arch. Dermatol. Syphil. 72:71-72. Feinglass, E.J. 1973. Arsenic intoxication from well water in the United States. N. Engl. J. Med. 288:828-830. Ferm, V.H., and S.J. Carpenter. 1968. Malformation induced by sodium arsenate. J. Reprod. Fertil. 17:199-201. Ferm, V.H., A. Saxon, and B.M. Smith. 1971. The teratogenic profile of sodium arsenate in the golden hamster. Arch. Environ. Health 22:557-560. Fernandez, F.J., and D.C. Manning. 1971. The determination of arsenic at submicrogram levels by atomic absorption spectrophotometry. At. Absorpt. Newsl. 10:4. Fernandez, F.J. 1973. Atomic absorption determination of gaseous hydrides utilizing sodium borohydride reduction. At. Absorpt. Newsl. 12:93-97. Fitch, L.W.N., R.E.R. Grimmett, and E.M. Wall. 1939. Occurrence of arsenic in the soils and waters of the Waiotapu Valley and its relation to stock health. II. Feeding experiments at Wallaceville. N.Z.J. Sci. Tech. Sect. A21: 146A-149A. Fleischer, M. 1973. Natural sources of some trace elements in the environment. Proc. Environ. Resour. Conf. Nat. Environ. Res. Center, 3-10. Flohe, L., W.A. Gunzler, and H.H. Schock. 1973. Glutathione peroxi,dase: a selenoenzyme. Fed. Eur. Biochem. Soc. Lett. 32:132-134. Franke, K.W., and V.R. Potter. 1936. The effect of selenium containing foodstuffs on growth and reproduction of rats at various ages. J. Nutr. 12:205-214. Franke, K.W., and A.L. Moxon. 1936. A comparison of the minimum fatal doses of selenium, tellurium, arsenic and vanadium. J. Pharmacol. Exp. Ther. 58:45~459. Franke, K.W., and V.R. Potter. 1935. A new toxicant occurring naturally in certain samples of plant foodstuffs. IX. Toxic effects of orally ingested selenium. J. Nutr. 10:213-221. Franke, K.W., and W.C. Tully. 1935. A new toxicant occurring naturally in certain samples of plant foodstuffs. V. Low hatchability due to deformities in chicks. Poult. Sci. 14:273- 276. Franke, K.W., A.L. Mxon, W.E. Poley, and W.C. Tully. 1936. A new toxicant occurring naturally in certain samples of plant foodstuffs. XII. Monstrosities produced by the injection of selenium salts into hens' eggs. Anat. Rec. 65: 15-22. Fritz, M.H. 1955. The treatment of dandruff and granulated eyelids with selenium sulfide (Selsun). Clin. Med. 2:695-696. Frost, D.V. 1960. Arsenic and selenium in relation to the Food Additive Law of 1958. Nutr. Rev. 18:129-132. Frost, D.V. 1972. The faces of selenium-Can selenophobia be cured? CRC Crit. Rev. Toxicol. 1:467-514. Frost, D.V. 1967. Arsenicals in biology-Retrospect and prospect. Fed. Proc. 26:194208. Frost, D.V. 1967. Significance of the symposium. In O.H. Muth, ed. Symposium: Selenium in Biomedicine. AVI Publishing Co. Inc., Westport, Conn. Frost, D.V., H.S. Perdue, B.T. Main, J.A. Kolar, I.D. Smith, R.J. Stein, and L.R. Overby. 1962. Further considerations on the safety of arsanilic acid for feed use. In Proceedings, 12th World's Poultry Congress, Sydney, Australia.
464 DRINKING WATER AND H"LTH Frost, D.V. 1970. Tolerances for arsenic and selenium: A psycholdynamic problem. World Rev. Pest Control 9:6-28. Gabbedy, B.J. and J. Dickson. 1969. Acute selenium poisoning in lambs. Aust. Vet. J. 45:470-472. Gainer, J.H., and T.W. Pry. 1972. Ejects of arsenicals on viral infections in mice. Am. J. Vet. Res. 33:2299-2307. Gainer, J.H. 1972. Ejects of arsenicals on interferon formation and action. Am. J. Vet. Res. 33:2579-2586. Ganther, H.E., and C.A. Baumann. 1962. Selenium metabolism. I. Effects of diet, arsenic and cadmium. J. Nutr. 77:210-216. Ganther, H.E. 1966. Enzymic synthesis of dimethyl selenide from sodium selenite in mouse liver extracts. Biochemistry 5:1089-1098. Ganther, H.E. 1968. Selenotrisulfides. Foration by the reaction of thiols with selenious acid. Biochemistry 7:2898-2905. Ganther, H.E. 1971. Reduction of the selenotrisulfide derivative of glutathione to a persulfide analog by glutathione reductase. Biochemistry 10:4089~098. Ganther, H.E. C. Goudie, M.L. Sunde, M.J. Kopecky, P. Wagner, S.H. Oh, and W.G. Hoekstra. 1972. Selenium: Relation to decreased toxicity of methylmercury added to diets containing tuna. Science 175:1122-1124. Garrow, J.C., and C.P. Douglas. 1968. A rapid method for assessing intrauterine growth by radioactive selenomethionine uptake. J. Obstet. Gynecol. Br. Commonw. 75:10341039. Geering, H.R., E.E. Cary, L.H.P. Jones, and W.H. Allaway. 1968. Solubility and redox criteria for the possible forms of selenium in soils. Soil. Sci. Soc. Am. Proc. 32:3540. Geyer, L. 1898. Ueber die chronischen Hautveranderungen beim Arsenicismus und Betrachtungen ueber die Massenerkrankungen in Reichenstein in Schlesien. Arch. Dermatol. Syphilol. 43:221-280. Gilbert, L.M., W.G. Overend, and M. Webb. 1951. The inhibition of pancreas deoxyribonu- clease. Exp. Cell Res. 2:349-365. Ginsburg, J.M., and W.D. Lotspeich. 1963. Interrelations of arsenate and phosphate transport in the dog kidney. Am. J. Physiol. 205:707-714. Ginsburg, J.M. 1965. Renal mechanism for excretion and transformation of arsenicin the dog. Am. J. Physiol. 208:832-840. Giordano, W.G. 1963. One application treatment for tinea versicolor. J. Med. Soc. N.J. 60:186-187. Glenn, M.W., R. Jensen, and L.A. Griner. 1964. Sodium selenate toxicosis: Pathology and pathogenesis of sodium selenate toxicosis in sheep. Am. J. Vet. Res. 25 :1486-1494. Glover, J.R. 1970. Selenium and its industrial toxicology. Ind. Med. 39: 5~54. Glover, J.R. 1954. Some medical problems concerning selenium in industry. Trans. Assoc. Ind. Med. Officers 4:94-96. Glover, J.R. 1970. Selenium and its industrial toxicology. Ind. Med. 39: 5~54. Godwin, K.O., and C.N. Fuss. 1972. The entry of selenium into rabbit protein following the administration of Na275SeO3. Aust. J. Biol. Sci. 25:865-871. Goldschmidt, V.M., and L.W. Strock. 1935. Zur Geochemi des Selen II Nachr. Ges. Wiss. Gottingen, Math-Physik. Klasse 1:123-142. Goldsmith, J.R., M. Deane, J. Thom, and G. Gentry. 1972. Water Res. 6:1133-1136. Graham, J.H., G.R. Mazzanti, and E.B. Helwig. 1961. Chemistry of Bowen's disease: Relationship to arsenic. J. Invest. Dermatol. 37:317-332. Grant, C.A., B. Thafvelin, and R. Christell. 1961. Retention of selenium by pig tissues. Acta Pharmacol. Toxicol. 18:285-297.
Inorganic Solutes 465 Grasso, P., R. Abraham, R. Hendy, A.T. Diplock, L. Golberg, and J. Green. 1969. The role of dietary silver in the production of liver necrosis in vitamin E-deficient rats. Exp. Mol. Pathol. 11:186-199. Grover, R.W. 1956. Diffuse hair loss associated with selenium (Selsun) sulfide shampoo. J. Am. Med. Assoc. 160:1397-1398. Gunn, S.A., T.C. Gould, and W.A.D. Anderson. 1968. Specificity in protection against lethality and testicular toxicity from cadmium. Proc. Soc. Exp. Biol. Med. 128:591-595. Hadjimarkos, D.M., and C.W. Bonhorst. 1958. The trace element selenium and its influence on dental caries susceptibility. J. Pediatr. 52:274278. Hadgimarkos, D.M., and C.W. Bonhorst. 1961. The selenium content of eggs, milk, and water in relation to dental caries in children. J. Pediatr. 59:256-259. Hadgimarkos, D.M. 1970. Toxic effects of dietary selenium in hamsters. Nutr. Rep. Int. 1:175- 179. Halver, J.E. 1962. Progress in studies on contaminanted trout rations and trout hepatoma. NIH Report, April 11-12. Halverson, A.W., D.T. Tsay, K.C. Triebwasser and E.I. Whitehead. 1970. Development of hemolytic anemia in rats red selenite. Toxicol. Appl. Pharmacol. 17:151-159. Halverson, A.W., I.S. Palmer, and P.L. Guss. 1966. Toxicity of selenium to post-wea.nling rats. Toxicol. Appl. Pharmacol. 9:477-484. Harr, J.R., and O.H. Muth. 1972. Selenium poisoning in domestic animals and its relationship to man. Clin. Toxicol. 5 :175-186. Harr, J.R., J.F. Bone, I.J. Tinsley, P.H. Weswig, and R.S. Yamamoto. 1967. Selenium toxicity in rats. II. Histopathology. In O.H. Muth, ed. Symposium: Selenium in Biomedicine, pp. 153-178. AVI Publishing Co., Inc., Westport, Conn. Harvey, S.C. 1965. Arsenic. In L.S. Goodman and A Gilman, eds. The Pharmacological Bases of Therapeutics, 3rd ed. The Macmillan Co., New York. Harvey, S.C. 1975. Heavy metals. In L.S. Goodman and A Gilman, eds. The Pharmacologi- cal Bases of Therapeutics, 5th ed. The Macmillan Co., New York. Haynie, T. P., W. K. Otte, and J.C. Wright. 1964. Visualization of hyperfunctioning parathyroid adenoma using Se75-selenomethionine and the photoscanner. J. Nucl. Med. 5:71~714. Heinrich, M., Jr., and F.E. Kelsey. 1955. Studies on selenium metabolism: The distribution of selenium in the tissues of the mouse. J. Pharmacol. Exp. Ther. 114:28-32. Heinrich, M.A., Jr., and D.M. MacCanon. 1960. Some effects of sodium selenite on the cardiovascular system. Toxicol. Appl. Pharmacol. 2:3343. Herigstad, R.R., C.K. Whitehair, and O.K. Olson. 1973. Inorganic and organic selenium toxicosis in young s~vine: Comparison of athologic changes with those in swine with vitamin E-selenium deficiency. Am. J. Vet. Res. 34:1227-1283. Herrera, N.E., R. Gonzalez, R.D. Schwartz, A.M. Diggs, and J. Belsky. 1965. 75Se- selenomethione as diagnostic agent in malignant lymphoma. J. Nucl. Med. 6:792-804. Heuper, W.C., and W.W. Payne. 1962. Experimental studies in metal carcinogenesis. Chromium, nickel, iron, arsenic. Arch. Environ. Health 5:445-462. Hidiroglou, M., K.J. Jenkins, and I. Hoffman. 1971. Teneurs en selenium d~n les tissue des ruminants. Ann. Biol. Anim. Biochim. Biophys. 11:695-704. Hill, A.B., and E.L. Faning. 1948. Studies in the incidence of cancer in a factory handling inorganic compounds of arsenic. I. Mortality experience in the factory. Br. J. Ind. Med. 5:1-6. Holker, J.R., and J.B. Speakman. 1958. The action of selenium dioxide on wool. J. Appl. Chem. 8:1-3.
466 DRINKING WATER AND H"LTH Holland, J.W. 1904. Arsenic. In F. Peterson and W.S. Haines, eds. A Textbook of Legal Medicine and Toxicology, vol. 2. W.B. Saunders & Company, Philadelphia. Hollo, Z.M., and S. Zlatarov. 1960. The prevention of thallium death by selenate. Natur~vissenschaften 47:87. Holmberg, R.E., and V.H. Ferm. 1969. Interrelationships of selenium, cadmium, and arsenic in mammalian teratogenesis. Arch. Environ. Health 18:873-877. Hood, R.D., and C.T. Pike. 1972. BAL alleviation of arsenate-induced teratogenesis in mice. Teratology 6:235-237. Hood, R.D., and S.L. Bishop. 1972. Teratogenic effects of sodium arsenate in mice. Arch. Environ. Health 24:62-65. Hopkins, L.L., Jr., A.L. Pope, and C.A. Baumann. 1966. Distribution of microgram quantities of selenium in the tissues of the rat and effects of previous selenium uptake. J. Nutr. 88:61-65. Honvitz, W. 1970. Official Methods of Analysis of the Association of Official Analytical Chemists. 11th ed. Association of Official Analytical Chemists, Washington, D.C. Hove, E., C.A. Elvehjem, and E.B. Hart. 1938. Arsenic in the nutrition of the rat. Am. J. Physiol. 124205-212. Hunter, F.T., A.F. Kip, and J.W. Irvine, Jr. 1942. Radioactive tracer studies on arsenic injected as potassium arsenite. J. Pharmacol. Exp. Ther. 76:207-220. Hutchinson, J. 1888. On some examples of arsenic-keratoses of the skin and of arsenic- cancer. Trans. Pathol. Soc. (London) 39:352-363. Hwang, S.W., and L.S. Schanker. 1973. Absorption of organic arsenical compounds from the rat small intestine. Xenobiotica 3:351-355. International Agency for Research on Cancer. 1973. IARC Monographs on the Evaluation of the Carcinogenic Risk of Chemicals to Man. Vol. 2: Some Inorganic and Organome- tallic Compounds. World Health Organization, Lyon. Ishibashi, M., T. Shigematsu, and Y. Nakagawa. 1953. Determination of selenium in sea water. Rec. Oceanogr. Work. Japan 1:4~48. Jacobsson, S.O. 1966. Uptake of Se75 in tissues of sheep after administration of a single dose of Se75-sodium selenite, Se75-selenomethionine, or Se75-selenocystine. Acta Vet. Scand. 7:303-320. James, L.F., V.A. Lazar, and W. Binns. 1966. Effects of sublethal doses of certain minerals on pregnant ewes and fetal development. Am. J. Vet. Res. 27:132-135. Jones, G.B., and K.O. Godwin. 1962. Distribution of radioactive selenium in mice. Nature 196:1294-1296. Jones, G.B., and K.O. Godwin. 1963. Studies on the nutritional role of selenium. I. The distr~bution of radioactive selenium in mice. Aust. J. Agric. Res. 14:716-723. Josephson, C.J., S.S. Pinto, and S.J. Petronella. 1951. Arsine: Electrocardiographic changes produced in acute human poisoning. Arch. Ind. Hyg. Occup. Med. 4:43-52. Kanisawa, M., and H.A. Schroeder. 1967. Life term studies on the effects of arsenic, germanium, tin, and vanadium on spontaneous tumors in mice. Cancer Res. 27:1192 1195. Kar, A.B., R.P. Das, and F.N.I. Mukergi. 1960. Prevention of cadmium-induced changes in the gonads of the rat by zinc and selenium: a study in antagonism between metals in the biological system. Proc. Nat. Inst. Sci. India. Part B. Suppl. 26:4~50. Kar, A.B., R.P. Das, and J.N. Karkun. 1959. Ovarian changes in prepubertal rats after treatment with cadmium chloride. Acta Biol. Med. Ger. 3:372-399. Kenzaburo, T. 1976. The various effects of arsenic in Japan according to type of exposure. International Conference on Environmental Arsenic. Fort Lauderdale, Fla.
Inorganic Solutes 467 Kharkar, D.P., K.K. Turekian, and K.K. Bertine. 1968. Stream supply of dissolved silver, molybdenum, antimony, selenium, chromium, cobalt, rubidium, and cesium to the ocean. Geochim. Cosmochim. Acta 32:285-298. Klayman, D.L., and W.H.H. Gunther. 1973. Organic selenium compounds: Their chemistry and biology. Wiley-Interscience, New York. Kraybill, H.F., and M.B. Shimkin. 1964. Carcinogenesis related to foods contaminated by processing and fungal metabolites. Adv. Cancer Res. 8: 191-248. Kroes, R., M.J. van Logten, J.M. Berkvens, T. de Vries, and G.J. van Esch. 1974. Study on the carcinogenicity of lead arsenate and sodium arsenate and on the possible synergistic effect of diethylnitrosamine. Food Cosmet. Toxicol. 12:671-679. Ku, P.K., W.T. Ely, A.W. Groce, and D.E. Ullrey. 1972. Natural dietary selenium tocopherol and effect on tissue selenium. J. Anim. Sci. 34:208-211. Kuttler, K.L., D.W. Marble, and C. Blincoe. 1961. Serum and tissue residues following selenium injections in sheep. Am. J. Vet. Res. 22:422-428. Lakin, H.W., and H.G. Byers. 1941. Selenium in wheat and wheat products. Cereal Chem. 18 :73-78. Lakin, H.W., and D.F. Davidson. 1967. The relation of the geochemistry of selenium to its occurrence in soils. In O.H. Muth, ed. Symposium: Selenium in Biomedicine. First International Symposium, Oregon State University, 1966, AVI Publishing Co., Inc., Westport, Conn. Lakin, H.W. 1972. Selenium accumulation in soils and its absorption by plants and animals. In H.L. Cannnon and H.C. Hopps, eds. Geochemical Environment in Relation to Health and Disease, pp. 45-54. Geological Society of America. Paper 140. Lambert, J.L., P. Arthur, and T.E. Moore. 1951. Determination of trace amounts of selenium in water. Anal. Chem. 23:1101-1106. Lambourne, D.A., and R.W. Mason. 1969. Mortality in lambs following overdosing with sodium selenite. Aust. Vet. J. 45:208. Lanz, H. Jr., P.W. Wallace, and J.G. Hamilton. 1950. The metabolism of arsenic in laboratory animals using As74 as a tracer. Univ. Calif. Pub. Pharmacol. 2:263-282. Ledet, A.E., J.R. Duncan, W.B. Buck, and F.K. Ramsey. 1973. Clinical, toxicological, and pathological aspects of arsanilic acid poisoning in swine. Clin. Toxicol. 6:439-457. Lee, A.M., and J.F. Fraumeni, Jr. 1969. Arsenic and respiratory cancer in man: An occupational study. J. Nat. Cancer Inst. 42:1045-1052. Lee, P., and J.S. Garrow. 1970. A clinical evaluation of the selenomethionine uptake test. J. Obstet. Gynacol. Br. Commonw. 77:983-986. Lemley, R.E., and M.P. Merryman. 1941. Selenium poisoning in the human subject. Lancet 61:435438. Levan, A. 1945. Cytological reactions induced by inorganic salt solutions. Nature 156:751- 752. Levan, N.E. 1957. Selenium sulfide suspension in the treatment of tinea versicolor. Arch. Dermatol. 75:128-129. Levander, O.A., and C.A. Baumann. 1966. Selenium metabolism. V. Studies on the distribution of selenium in rats given arsenic. Toxicol. Appl. Pharmacol. 9:98-105. Levander, O.A., and C.A. Baumann. 1966. Selenium metabolism. VI. Effect of arsenic on the excretion of selenium in the bile. Toxicol. Appl. Pharmacol. 9:106-115. Levander, O.A., and L.C. Argrett. 1969. Effects of arsenic, mercury, thallium and lead on selenium metabolism in rats. Toxicol. Appl. Pharmacol. 14:308-314. Levander, O.A., and V.C. Morris. 1970. Interactions of methionine, vitamin E, and antioxidants in selenium toxicity in the rat. J. Nutr. i00:1111-1118.
468 DRINKING WATER AND H"LTH Levander, O.A. 1972. Metabolic interrelationships and adaptations in selenium toxicity. Ann. N.Y. Acad. Sci. 192:181-192. Levander, O.A., M.L. Young, and S.A. Meeks. 1970. Studies on the binding of selenium by liver homogenates from rats fed diets containing either casein or casein plus linseed oil meal. Toxicol. Appl. Pharmacol. 16:79-87. Levander, O.A., V.C. Morris, and D.J. Higgs. 1973. Selenium as a catalyst for the reduction of cytochrome c by glutathione. Biochemistry 12:4591-4595. Levander, O.S., and C.A. Baumann. 1966. Selenium metabolism. VI. Effect of arsenic on the excretion of selenium in the bile. Toxicol. Appl. Pharmacol. 9:106-115. Lipmann, F. 1958. Biological sulfate activation and transfer. Science 128:575-580. Lisella, F.S., K.R. Long, and H.G. Scott. 1972. Health aspects of arsenicals in the environment. J. Environ. Health 34:511-518. Lopez, P.L., R.L. Preston and W.H. Pfander. 1968. In vitro uptake of selenium-75 by red blood cells from the immature ovine during varying selenium intakes. J. Nutr. 94:219-226. Maag, D.D., J.S. Osborn, and J.R. Clopton. 1960. The effect of sodium selenite on cattle. Am. J. Vet. Res. 21:1049-1053. Marshall, S.P., F.W. Hayward, and W.R. Meagher. 1963. Effects of feeding arsenic and lead upon their secretion in milk. J. Diary Sci. 46:580-581. Mason, K.E., and J.O. Young. 1967. Effectiveness of selenium and zinc in protecting against cadmium-induced injury of the rat testis. In O.H. Muth, ed. Symposium: Selenium in Biomedicine, pp. 383-394. AVI Publishing Co. Inc., Westport, Conn. Matson, E.J. 1956. Selenium sulfides as an antidandruff agent. J. Soc. Cosmet. Chem. 7:459- 466. Mautner, H.G., and J.J. Jaffe. 1958. The activity of 6-selenopurine and related compounds against some experimental mouse tumors. Cancer Res. 18:294-298. Mautner, H.G., S.H. Chu, J.J. Jaffe, and A.C. Sartonelli. 1963. The synthesis and antineoplastic properties of selenoguanine selenocytosine and related compounds. J. Med. Chem. 6:36-39. McConnell, K.P., and A.E. Kreamer. 1960. Incorporation of selenium-75 into dog hair. Proc. Soc. Exp. Biol. Med. 105:170-173. McConnell, K.P., and D.M. Roth. 1962. 75Se in rat intracellular liver fractions. Biochim. Biophys. Acta 62:503-508. McConnell, K.P., and G.J. Cho. 1965. Transmucosal movement of selenium. Am. J. Physiol. 208:1191-1195. McConnell, K.P., and O.W. Portman. 1952a. Toxicity of dimethyl selenide in the rat and mouse. Proc. Soc. Exp. Biol. Med. 79:230-231. McConnell, K.P., and O.W. Portman. 1952b. Excretion of dimethyl selenide by the rat. J. Biol. Chem. 195:277-282. McConnell, K.P. 1941. Distribution and excretion studies in the rat after a single subtoxic subcutaneous injection of sodium selenate containing radioselenium. J. Biol. Chem. 141:427437. McConnell, K.P., C.H. Waboitz, and D.M. Roth. 1960. Time-distribution studies of selenium-75 in dog serum proteins. Tex. Rep. Biol. Med. 18:438 445. Mealey, J., Jr., G.L. Brownell, and W.H. Sweet. 1959. Radioarsenic in plasma, urine, normal tissues, and intracranial neoplasms. Arch. Neurol. Psychiatry 81:310-320. Middleton, J.M. 1947. Selenium burn of the eye. Report of a case, with a review of the literature. Arch. Ophthalmol. 38:80~811. Miller, J.T., and H.G. Byers. 1935. A selenium spring. Ind. Eng. Chem. News Ed. 13:456. Milner, J.E. 1969. The e~ect of ingested arsenic on methylcholanthrene-induced skin tumors in mice. Arch. Environ. Health 18:7-11.
Inorganic Solutes 469 Mizuta, N., M. Mizuta, F. Ito, T. Ito, H. Uchida, Y. Watanabe, H. Akama, T. Murakami, F. Hayashi, K. Nakamura, T. Yamaguchi, W. Mizuia, S. Oishi, and H. Matsumura. 1956. An outbreak of acute arsenic poisoning caused by arsenic contaminated soy-sauce (shoyu): A clinical report of 220 cases. Bull. Yamagochi Med. Sch. 4(2,3~:131-150. Moeschlin, S. 1965. Poisoning: Diagnosis end treatment, 1st Am. Ed. Grune and Stratton, New York. Moody, J.P., and R.T. Williams. 1964a. The fate of arsanilic acid and acetylarsanilic acid in hens. Food Cosmet. Toxicol. 2:687-693. Moody, J.P., and R.T. Williams. 1964b. The fate of 4-nitrophenylarsonic acid in hens. Food Cosmet. Toxicol. 2:695-706. Morehouse, N.F. 1949. Accelerated growth in chickens and turkeys produced by 3-nitro~ hydroxyphenylarsonic acid. Poult. Sci. 28:375-384. Morette, A., and J.P. Diven. 1965. La determination du selenium dans lteau ann. Pharm. Fr. 23:169-178. Morris. V.C., and O.A. Levander. 1970. Selenium consent offoods.J.Nutr. 100:1383-1388. Morrow, D.A. 1968. Acute selenite toxicosis in lambs. J. Am. Vet. Med. Assoc. 152:1625- 1629. Morss, S.G., and H.S. Olcott. 1967. Absence of effect of tocopherol on acute oral toxicity of sodium selenite in the rat. Proc. Soc. Exp. Biol. Med. 124:483-485. Motley, H.L., M.M. Ellis, and M.D. Ellis. 1937. Acute sore throats following exposure to selenium. J. Am. Med. Assoc. 109:1718-1719. Moutschen, J., and N. Degraeve. 1965. Influence of thiol-inhibiting substances on the effects of ethyl methane sulphonate (EMS) on chromosomes. Experientia 21:200 202. Moxon, A.L., and K.P. DuBois. 1939. The influence of arsenic and certain other elements on the toxicity of seleniferous grains. J. Nutr. 18:447-457. Moxon, A.L. 1937. Alkali Disease or Selenium Poisoning. S. Dak. Agric. Exp. Stn. Bull. no. 311. Brookings, S. Dak. Moxon, A.L. 1938. The effect of arsenic on the toxicity of seleniferous grains. Science 88:81. Moxon, A.O., O.K. Olson, and W.V. Seawright. 1939. Selenium in Rocks, Soils and Plants. S. Dak. Agric. Exp. Stn. Tech. Bull. no. 2, Brookings, S. Dak. Muth, O.H., and W. Binns. 1964. Selenium toxicity in domestic animals. Ann. N.Y. Acad. Sci. 111:583-590. Muth, O.H., P.D. Whanger. P.H. Weswig, and J.E. Oldfield. 1971. Occurrence of myopathy in lambs of ewes fed added arsenic in a selenium-deficient ration. Am. J. Vet. Res. 32: 1621-1623. Nagai, H., R. Okuda, H. Nagaumi, A. Yagi, C. Mori, and H. Wada. 1956. Subacute and chronic arsenic poisoning in bottle-fed infants-Follow-up clinical observations. Ann. Paediatr. Jap. (Shonika Kiyo) 2(2):12~132. (In Japanese). Nagai, I. 1959. An experimental study of selenium poisoning. Igaku Kenkyu (Acta Med.) 29:1505-1532. National Academy of Sciences-National Research Council. 1976. Assembly of Life Sciences. Medical and Biologic Effects of Environmental Pollutants: Selenium. Washington, D.C. National Institute for Occupational Safety and Health. 1974. NIOSH Manual of Analytical Methodls. U.S. Department of Health, Education, and Welfare, Cincinnati, Ohio. National Research Council. Agriculture Board, Committee on Animal Nutrition. Subcom- mittee on Selenium. 1971. Selenium in Nutrition. Washington, D.C. Nelson, A.A., O.G. Fitzhugh, and H.O. Calvery. 1943. Liver tumors following cirrhosis caused by selenium in rats. Cancer Res. 3:23~236.
470 DRINKING WATER AND H"LTH Nelson, W.C., M.H. Lykins, J. Mackey, V.A. Newill, J.F. Finklea, and D.I. Hammer. 1973. Mortality among orchard workers exposed to lead arsenate spray: A cohort study. J. Chron. Dis. 26:105-1 18. Neubauer, O. 1947. Arsenical cancer: A review. Br. J. Cancer 1:192-251. Nielsen, F.H., S:H. Givand and D.R. Myron. 1975. Evidence of a possible requirement for arsenic by the rat. Fed. Proc. 34:923. (Abstract) Obermeyer, B.D., I.S. Palmer, O.K. Olson, and A.W. Halverson. 1971. Toxicity of trimethylselenonium chloride in the rat with and without arsenite. Toxicol. Appl. Pharmacol. 20:135-146. Oelschager, W., and K.H. Menke. 1969. Uber Selengehalte pflanzlicher, tierischer and anderer stoffe. 2. Mitteilung Selen-und Schwfelgehalte in Nehrungsmitteln. Z. Ernaeh- rungswiss. 9:216-222. Okamoto, Y., and W.H.H. Gunther. 1972. Organic selenium and tellurium chemistry. Ann. N.Y. Acad. Sci. 192:1-226. Oliver, W.T., and C.K. Roe. 1957. Arsanilic acid poisoning in swine. J. Am. Vet. Med. Assoc. 130: 177-178. Olson, O.E., B.M. Schulte, E.I. Whitehead, and A.W. Halverson. 1963. Effect of arsenic on selenium metabolism in rats. J. Agric. Food Chem. 11:531-534. Olson, O.E., E.I. Whitehead, and A.L. Moxon. 1942. Occurrence of soluble selenium in soils and its availability to plants. Soil Sci. 54: 47-53. Olson, O.E., I.S. Palmer, and E.I. Whitehead. 1973. Determination of selenium in biological materials. In D. Glick, ed. Methods of Biochemical Analysis, vol. 21. John Wiley Sons, New York. Osburn, H.S. 1957. Cancer of the lung in Gwanda. Cent. Af. J. Med. 3:215-223. Osswald, H., and K1. Goerttler. 1971. Leukosen bei der Maus nach diaplacentarer und postnataler Arsenik-Applikation. Dtsch. Gesamte Path. 55:289-293. Ott, M.G., B.B. Holder, and H.L. Gordon. 1974. Respiratory cancer end occupational exposure to arsenicals. Arch. Environ. Health 29:250-255. Overby, L.R., and L. Straube. 1965. Metabolism of arsanilic acid. I. Metabolic stability of double labeled arsanilic acid in chickens. Toxicol. Appl. Pharmacol. 7:850-854. Overby, L.R., and R.L. Fredrickson. 1963. Metabolic stability of radioactive arsanilic acid in chickens. J. Agric. Food Chem. 1 1:378-381. Overby, L.R., and R.L. Fredrickson. 1965. Metabolism of arsanilic acid. II. Localization and type of arsenic excreted and retained by chickens. Toxicol. Appl. Pharmacol. 7:855- 867. Painter, E.P. 1941. The chemistry and toxicity of selenium compounds, with special reference to the selenium problem. Chem. Rev. 28 :179-213. Palmer, I.S., and O.K. Olson. 1974. Relative toxicities of selenite and selenate in the d~nking water of rats. J. Nutr. 104:306-314. Palmer, I.S., D.D. Fischer, A.W. Halverson, and O.K. Olson. 1969. Identif~cation of a major selenium excretory product in rat urine. Biochim. Biophys. Acta 177:336-342. Parizek, J., and Z. Zahor. 1956. Effect of cadmium salts on testicular tissue. Nature 177:1036. Parizek, J. 1964. Vascular changes at sites of estrogen biosynthesis produced by parenteral injection of cadmium salts. The destruction of the placenta by cadmium salts. J. Reprod. Ferti. 7:263-265. Parizek, J. 1965. The peculiar toxicity of cadmium during pregnancy: "An experimental toxaemia of pregnancy" induced by cadmium salts. J. Reprod. Ferti. 9:111-112. Parizek, J., I. Ostadalova, J. Kalouskova, A. Babicky, and J. Benes. 1971. The detoxifying effects of selenium interrelations between compounds of selenium and certain metals. In
Inorganic Solutes 471 W. Mertz and W.E. Cornatzer, eds. Newer Trace Elements in Nutrition, Marcel Dekker, Inc., New York. Parizek, J., I. Ostadalova, J. Kalouskova, A. Babicky, L. Pavlik, and B. Bibr. 1971. Effect of mercuric compounds on the maternal tranmission of selenium in the pregnant and lactating rat. J. Reprod. Ferti. 25:157-170. Parizek, J., I. Ostadolova, I. Benes, and A. Babecky. 1968. Pregnancy and trace elements: The protective effect of compounds of an essential trace element selenium-against the peculiar toxic effects of cadmium during pregnancy. J. Reprod. Ferti. 16:507-509. Parizek, J., J. Kalouskova, A.A. Babicky, J. Benes, and L. Pavlik. 1974. Interaction of selenium with mercury, cadmium and other toxic metals. In W.G. Hoekstra, J.W. Suttie, H.E. Ganther and W. Mertz, eds. Trace Element Metabolism in Animals, 2nd ed. University Park Press, Baltimore. Parker, C.A., and L.G. Harvey. 1961. Fluorometric determination of submicrogram amounts of selenium. Analyst 86:5462. Paton, G.R., and A.C. Allison. 1972. Chromosome damage in human cell cultures induced by metal salts. Mutation Res. 16:322-336. Pedersen, N.D., P.D. Whanger, P.H. Weswig, and O.H. Muth. 1973. Selenium binding proteins in tissues of normal and selenium responsive myopathic lambs. Bioinorg. Chem. 2:33-45. Penrose, W.R. 1974. Arsenic in the marine and aquatic environments: Analysis, occurrence, and significance. CRC Crit. Rev. Environ. Control 4(4):465482. Peoples, S.A. 1964. Arsenic toxicity in cattle. Ann. N.Y. Acad. Sci. 111:64~649. Perry, K., R.G. Bowler, H.M. Buckell, H.A. Druett, and R.S. F. Shilling. 1948. Studies in the incidence of cancer in a factory handling inorganic compounds of arsenic. II. Clinical and environmental investigations. Br. J. Ind. Med. 5:6-15. Pershagen, G., C.G. Elinder, and A.M. Balander. 1976. Mortality in an area surrounding an arsenic emitting plant. International Conference on Environmental Arsenic. Fort Lauderdale, Fla. Peterson, P.J., and D.J. Spedding. 1963. The excretion by sheep of 75selenium into red clover. The chemical nature of the excreted selenium and its uptake by three plant species. N.Z.J. Agric. Res. 6:13-23. Petres, J., and A. Berger. 1972. Zum Einfluss anorganischen Arsens auf die DNS-Synthese menschlicher Lymphocyten in vitro. Arch. Dermatol. Forsch. 242:343-352. Petres, J., and M. Hundeiker. 1968. "Chromosomenpulverisation" nach Arseneinwirkung aufZelLlculturen in vitro. Arch. Klin. Exp. Dermatol. 231:366-370. Petres, J., D. Baron, and M. Hagedorn. 1976. Effects of arsenic on cell metabolism and cell proliferation. Cytogenic and biochemical studies. International Conference on Environ- mental Arsenic. Fort Lauderdale, Fla. Petres, J., K. Schmid-Ullrich, and W. Wolf. 1970. Chromsomenaberrationen an menschli- chen Lymphozyten bei chronischen Arsenchaden. Dtsch. Med. Wochenschr. 95:79-80. Pinto, S.S., and B.M. Bennett. 1963. Effect of arsenic trioxide exposure on mortality. Arch. Environ. Health 7:583-591. Potchen, E.J. 1963. Isotopic labeling of the rat parathyroid as demonstrated by autoradiog- raphy. J. Nucl. Med. 4:480-484. Pringle, P. 1942. Occupational dermatitis following exposure to inorganic selenium compounds. Br. J. Dermatol. Syphilol. 54:5458. Radeleff, R.D. 1970. Veterinary Toxicology, 2nd ed. Lea and Febiger, Philadelphia. Ransone, J.W., N.M. Scott, Jr., and E.C. Knoblock. 1961. Selenium sulfide intoxication. N. Engl. J. Med. 264:384-385.
472 DRINKING WATER AND H"LTH Reynolds, E.S. 1901. An account of the epidemic outbreak of arsenical poisoning occurring in beer-drinkers in the north of England and Midland Countries in 1900. Lancet 1:16 170. Rhian, M., and A.L. Moxon. 1943. Chronic selenium poisoning in dogs and its prevention by arsenic. J. Pharmacol. Exp. Ther. 78:249-264. Ridgway, L.P., and D.A. Karnofsky. 1952. The effects of metals on the chick embryo: Toxicity and production of abnormalities in development. Ann. N.Y. Acad. Sci. 55:203- 215. Riley, J.F. 1968. Mast cells, co-carcinogens and anticarcinogenesis in the skin of mice. Expermentia 24: 1237. Robinson, H.M. Jr., and S.N. Yaffe. 1956. Selenium sulfide in the treatment of pityriasis versicolor. J. Am. Med. Assoc. 162:113-114. Robinson, W.O. 1936. Selenium content of wheat from various parts of the world. Ind. Eng. Chem. Ed. 28:736-738. Rosenfeld, I., and O.A. Beath. 1964. Selenium: Geobotany, Biochemistry, Toxicity and Nutrition. Academic Press, New York. Rosenfeld, I. and O.A. Beath. 1947. The influence of various substances on chronic selenium poisoning. J. Pharmacol. Exp. Ther. 91:218-223. Rossman, T.G., M.S. Meyn, and W. Troll. 1976. Effects of Arsenite on DNA Repair in Escherichia coli. International Conference on Environmental Arsenic. Fort Lauderdale, Fla. Roth, F. 1957. The sequelae of chronic arsenic poisoning in Moselle vintners. Ger. Med. Month. 2: 172-175. Rotruck, J.T., A.L. Pope, H.E. Ganther, A.B. Swanson, D.G. Hafeman, and W.G. Hoesktra. 1973. Selenium: Biochemical role as a component of glutathione peroxidase. Science 179:588-590. Rusiecki, W., and J. Brzezinski. 1966. Influence of sodium selenate on acute thallium poisonings. Acta Poll Pharm. 23:69-74. Schroeder, H.A., and J.J. Balassa. 1966. Abnormal trace elements in man: arsenic. J. Chron. Dis. 19:85-106. Schroeder, H.A., and M. Mitchener. 1971a. Selenium and tellurium in rats: Effect on growth, survival and tumors. J. Nutr. 101:1531-1540. Schroeder, H.A., and M. Mitchener. 1972. Selenium and tellurium in mice. Effects on growth, sumval and tumors. Arch. Environ. Health. 24:66-71. Schroeder, H.A., and M. Mitchener. 1971b. Toxic effects of trace elements on the reproduction of mice and rats. Arch. Environ. Health 23:102-106. Schroeder, H.A., M. Kanisawa, D.V. Frost, and M. Mitchener. 1968. Germanium, tin, and arsenic in rats: Effects on growth, survival, pathological lesions and life span. J. Nutr. 96:37-45. Schwa~z, K. 1965. Role of vitamin E, selenium and related factors in experimental nutritional liver disease. Fed. Proc. 24:58-67. Scott, M.L., and J.N. Thompson. 1971. Selenium content of foodstuffs and effects of dietary selenium levels upon tissue selenium in chicks and poults. Poult. Sci. 50:1742-1748. Shamberger, R.J. 1970. Relationship of selenium to cancer. I. Inhibitory effect of selenium on carcinogenesis. J. Nat. Cancer Inst. 44:931-936. Shapiro, J.R. 1972. Selenium and carcinogenesis. A review. Ann. N.Y. Acad. Sci. 192:215-219. Shapiro, J.R. 1972. Selenium compounds in nature and medicine; selenium and human biology. I)' D.L. Klayman and W.H.H. Gunther, eds. Organic Selenium Compounds: Their Chemistry and Biology. John Wiley & Sons, New York.
Inorganic Solutes 473 Shortridge, E.H., P.J. O'Hara, and P.M. Marshall. 1971. Acute selenium poisoning in cattle. N.Z.Vet.J.19:47-50. Silver, A.S., and P.L. Wainman. 1952. Chronic arsenic poisoning following use of an asthma remedy. J. Am. Med. Assoc. 150:584-585. Smith, M.I., and B.B. Westfall. 1937. Further field studies on the selenium problem in relation to public health. Public Health. Rep. 52:1375-1384. Smith, M.I. 1941. Chronic endemic selenium poisoning. J. Am. Med. Assoc. 116:562-566. Smith, M.I., E.F. Stohlman, and R.D. Lillie. 1937. The toxicity and pathology of selenium. J. Pharmacol. Exp. Ther. 60:449470. Snegire~, L.S., and O.L.M. Lombard. 1951. Arsenic and cancer. Observations in the metallurgical industry. Arch. Ind. Hyg. 4:199-205. Sommers, S.C., and R.G. McManus. 1953. Multiple arsenical cancers of the skin and internal organs. Cancer 6:347-359. Spencer, R.P., and M. Blau. 1962. International transport of selenium-75 selenomethionine. Science 136:155-156. Stadtman, T.C. 1974. Selenium biochemistry. Science 183:915-922. Strock, L.W. 1935. The distribution of selenium in nature. Am. J. Pharm. 107:144-157. Tank, G., and C.A. Strovick. 1960. Effect of naturally occurring selenium and vanadium on dental caries. J. Dent. Res. 39:473488. Tarrant, R.F., and J. Allard. 1972. Arsenic levels in urine of forest workers applying silvicides. Arch. Environ. Health 24:277-280. Taylor, F.B. 1963. Significance of trace elements in public, finished water supplies. J. Am. Water Works Assoc. 55:619-623. Thapar, N.T., E. Guenthner, C.W. Carlson, and O.K. Olson. 1969. Dietary selenium and arsenic additions to diets for chickens over a life cycle. Poult. Sci. 48:1987-1993. Thompson, J.N., and M.L. Scott. 1969. Role of selenium in the nutrition of the chick. J. Nutr. 97:335-342. Tscherkes, L.A., M.N. Volgarev and S.G. Aptekar. 1963. Selenium-caused tumors. Acta Un. Int. Cancer 19:632-633. Tseng, W.P., H.M. Chu, S.W. How, J. M. Fong, C.S. Lin, and S. Yeh. 1968. Prevalence of skin cancer in an endemic area of chronic arsenicism in Taiwan. J. Nat. Cancer Inst. 40:453-363. Tseng, Wen-Ping. 1976. Effects and dose-response relationships of skin cancer and blackfoot disease with arsenic. International Conference on Arsenic. Fort Lauderdale, Fla. Tsuchiya, K. 1976. Various effects of arsenic in Japan according to type of exposure. Presented at Int. Conf. Environ. Arsenic Res., Triangle Park, N.C., Oct. 5-8, 1976. U.S. Department of Health, Education, and Welfare. 1975. National Institute for Occupational Safety and Health. Criteria for a Recommended Standard . . . Occupation- al Exposure to Inorganic Arsenic. New Criteria, 1975. Publ. no. (NIOSH)75-149. U.S. Government Printing Office, Washington, D.C. U.S. Environmental Protection Agency, 1975. Chemical Analysis of Interstate Carrier Water Supply Systems. EPA430/9/75-005. Washington, D.C. U.S. Public Health Service. 1962. Drinking Water Standards. U.S. Department of Health, Education, and Welfare. Public Health Service Publ. no. 956. Washington, D.C. Underwood, E.J. 1971. Trace Elements in Human and Animal Nutrition, 3rd ed. Academic Press, New York. Voegtlin, C., and J.W. Thompson. 1923. Quantitative studies in chemotherapy. VI. Rate of excretion of arsenicals, a factor governing toxicity and parasiticidal action. J. Pharmacol. Exp. Ther. 20:85-105.
474 DRINKING WATER AND H"LTH Volgarev, M.N., and L.A. Tscherkes. 1967. Further studies in tissue changes associated with sodium selenate. In O.H. Muth, ed. Symposium: Selenium in Biomedicine, pp. 179-184. First International Symposium, Oregon State University, 1966. AVI Publishing Co., Inc., Westport, Conn. Vorhies, M.W., S.D. Sleight, and C.K. Whitehair. 1969. Toxicity of arsanilic acid in swine as influenced by water intake. Cornell Vet. 59:3-9. Wadkins, C.L. 1960. Stimulation of adenosinetriphosphatase activity of mitochondria and submitochondrial particles by arsenate. J. Biol. Chem. 235:3300-3303. Walker, G.W.R., and A.M. Bradley. 1969. Interacting effects of sodium monohydrogenar- senate and selenocystine on crossing over in Drosophila melanogaster. Can. J. Genet. Cytol. 11:677-688. Watkinson, J.H. 1960. Fluorometric determination of traces of selenium. Anal. Chem. 32:981-983. Watkinson, J.H. 1967. Analytical methods for selenium in biological material. In O.H. Muth, ed. Symposium: Selenium in Biomedicine. First International Symposium, Oregon State University. 1966. AVI Publishing Co., Inc., Westport, Conn. Weiss, H.V., M. Koide, and E.D. Goldberg. 1971. Selenium and sulfur in a Greenland ice sheet; Relation of fossil fuel consumption. Science 172:261-263. Weswig, P.H., S.A. Roffler, M.A. Arnold, O.H. Muth, and J.E. Oldfield. 1966. In vitro uptake of selenium-75 by blood from ewes and their lambs on different selenium regimens. Am. J. Vet. Res. 27:128-131. Willcox, W.H. 1922. An address on acute arsenical poisoning. Br. Med. J. 2:118-124. Williams, K.T., and H.G. Byers. 1935. Occurrence of selenium in the Colorado River and some of its tributaries. Ind. Eng. Chem. Anal. Ed. 7:431432. Wilson, L.G., and R.S. Bandurski. 1956. An enzymatic reaction involving adenosine triphosphate and selenate. Arch. Biochem. Biophys. 62:503-506. Wright, P.L., and M.C. Bell. 1963. Selenium and vitamin E influence upon the in vitro uptake of Se75 by ovine blood cells. Proc. Soc. Exp. Biol. Med. 114:379-382. Wright, P.L., and M.C. Bell. 1964. Selenium75 metabolism in the gestating ewe and fetal lamb: effects of dietary a-tocopherol and selenium. J. Nutr. 84:49-57. Wright, P.L., and M.C. Bell. 1966. Comparative metabolism of selenium and tellurium in sheep and swine. Am. J. Physiol. 211:6-10. Wright, P.L. 1967. The absorption and tissue distribution of selenium in depleted animals. In O.H. Muth ed. Symposium: Selenium in Biomedicine. First International Symposium Oregon State University, 1966. AVI Publishing Co., Inc., Westport, Conn. Zachariae, H., H. Sogaard, and A. Nyfors. 1974. Liver biopsy in psoriatics previously treated with potassium arsenite. Acta Derm. Venereol. 54:235-236. Zaldivar, R. 1974. Arsenic contamination of drinking water and foodstuffs causing endemic chronic poisoning. Beitr. Pathol. Bd. 151:384400. REFERENCES FOR FLUORIDE, SODIUM, NITRATE, AND SULFATE Abbie, A.A., and J. Schroder. 1960. Blood pressure in Arnhem Land aborig~nes. Med. J. Aust. 2:493496. Al-Alousi, W., D. Jackson, G. Crompton, and O.C. Jenkins. 1975. Enamel mottling in a fluoride and in a non-fluoride community; A study. Br. Dent. J. 138:9-15, 56-60. American Academy of Pediatrics Committee on Nutrition. 1970. Infant methemoglobine- mia: The role of dietary nitrate. Pediatrics 46:475478.
Inorganic Solutes 475 American Academy of Pediatrics Committee on Nutrition. 1974. Salt intake and eating patterns of infants and children in relation to blood pressure. Pediatrics 53:115-121. American Medical Association House of Delegates. 1957. Statement on fluoridation of public water supplies. American Public Health Association. 1976. Standard Methods for the Examination of Water and Wastewater, 14th ed. Washington, D.C. American Public Works Association. 1969. Water pollution aspects of urban runoff. Final report on the causes and remedies of water pollution from surface drainage of urban areas. Research project no. 120, conducted for the Federal Water Quality Administra- tion, U.S. Department of the Interior. An, A.S., V.A. Dudina, and N.I. Nedostupova. 1967.0utbreaksofintestinaldisorders due to high sulfate concentration in drinking water. Hyg. Sanit. 32:264-266. Ast, D.B., D.J. Smith, B. Wachs, and K.T. Cantwell. 1956. Newburgh-Kingston caries- fluorine study. XIV. Combined clinical and roentgenographic dental findings after ten years of fluoride experience. J. Am. Dent. Assoc. 52:314-325. Bell, M.E., and T. G. Ludwig. 1970. The supply of fluoride to man. In Fluorides and Human Health, pp. 18-32. World Health Organization Monograph no. 59. Berman, L.B., and D.R. Taves. 1973. Fluoride excretion in normal and uremic humans. Clin. Res. 21:100. Bernstein, D.S., N. Sadowsky, D.M. Hegsted, C.D. Guri, and F.J. Stare. 1966. Prevalence of osteoporosis in high and low fluoride areas in North Dakota. J. Am. Med. Assoc. 198:499- 504. Berry, W.T. 1958. A study of the incidence of mongolism in relation to the fluoride content of water. Am. J. Ment. Defic. 62:634636. Bianchi, G., V. Fox, G. FiFrancesco, V. Bardi, and M. Radice. 1973. The hypertensive role of the kidney in spontaneously hypertensive rats. Eur. J. Clin. Invest. 3:313. Binkerd, E.F., and O.K. Kolari. 1975. The history and use of nitrate and nitrite in the curing of meat.FoodCosmet.Tox~col. 13:655-661. Bittner, J.J., and W.D. Armstrong. 1952. Lack of e~ect of fluoride ingestion on longevity of mice. J. Dent. Res. 31 :495. Blood, D.C., and J.A. Henderson. 1968. Veterinary Medicine, 3rd ed. Williams dc Wilkins, Baltimore. Boltz, D.F. March 1973. Recent development in methods for the determination of anions. Section V: Anions of nitrogen. Crit. Rev. Anal. Chem. 3:147-199. Bosch, H.M., A.B. Rosenfield, R. Huston, H.R. Shipman, and F.L. Woodward. 1950. Methemoglobinemia and Minnesota well supplies. J. Am. Water Works Assoc. 42:161- 170. Bradley, W.B., A.O. Beath, and H.F. Eppson. 1939. Oat hay poisoning. Science 89:365. Bradley, W.B., H.F. Eppson, and A.O. Beath. 1940. Livestock Poisoning by Oat-Hay and Other Plants Containing Nitrates, pp. 1-20. Wyo. Agric. Exp. Stn. Bull. no. 241. Braun-Menendez, E., and M.R. Covian. 1948. Mecanismo de la hipertenion de las rates totalmente nefrectomizadas. Rev. Soc. Argent. Biol. 24:13~141. Brest, A.N. 1960. The therapeutic use of the thiazide derivatives in the treatment of hypertension. In J.H. Moyer and M. Fuchs, eds. Edema: Mechanisms and Management. W.B. Saunders Co., Philadelphia. Brooks, J.B., W.B. Cherry, L. Thacker, and C.C. Alley. 1972. Analysis by gas chromatogra- phy of amines and nitrosamines produced in vitro and in vitro by Proteus mirabilis. J. Infect. Dis. 126:143-153. 3ryce, H.G. 1964. Industrial and utilitarian aspects of fluorine chemistry. In S.H. Simmons, ed. Fluorine Chemistry, vol. 1, pp. 295-498. Academic Press, New York.
476 DRINKING WATER AND H"LTH Bubeck, R.C., W.H. Diment, B.L. Deck, A.L. Baldwin, and S.D. Lipton. 1971. Runoff of deicing salt: Effect on Irondequoit Bay, Rochester, New York. Science 172:1128-1131. Buck, C.W. 1973. The persistence of elevated blood pressure first observed at age five. J. Chron. Dis. 26:101-104. Burg, M.B. 1976. Renal handling of sodium chloride. In B.M. Brenner and F.C. Rector, eds. The Kidney, vol. 1. W.B. Saunders Co., Philadelphia. Burgen, A.S.V., and N.G. Emmelin. 1961. Physiology of the salivary glands. Williams & WiLkins Co., Baltimore. Burk, D., and J. Yiamouyiannis. 1975. Fluoridation and Cancer, July 21, Congressional Record. Burns-Cox, C.J., and J.D. Maclean. 1970. Splenomegaly and blood pressure in an Orang- Asli community in West Malaysia. Am. Heart J. 80:718-719. Burrell, R.J.W., W.A. Roach, and A. Shadwell. 1966. Esophageal cancer in the Bantu of the Transkei associated with mineral deficiency in garden plants. J. Nat. Cancer Inst. 36:201- 214. Caffey, F. 1955. On fibrous defects in cortical walls of growing tubular bones: Their radiologic appearance, structure, prevalence, natural course, and diagnostic significance. Adv. in Pediatr. 7:13-50. Carlson, C.H., W.D. Armstrong, and L. Singer. 1960a. Distribution, migration and binding of whole blood fluoride evaluated with radiofluoride. Amer. J. Physiol. 199:187-189. Carlson, C.H., W.D. Armstrong, and L. Singer. 1960b. Distribution and excretion of radiofluoride in the human. Proc. Soc. Exp. Biol. Med. 104:235-239. Carslon, C.H., W.D. Armstrong, L. Singer, and L.B. Hinshaw. 1960c. Renal excretion of radiofluoride in the dog. Am. J. Physiol. 198:829-832. Chen, P.S., Jr., F.A. Smith, D.E. Gardner, J.A. O'Brien, and H.C. Hodge. 1956. Renal clearance of fluoride. Proc. Soc. Exp. Biol. Med. 92:879-883. Chiang, B.N., L.V. Perlman, M. Fulton, L.D. Ostrander, and F.H. Epstein. 1970. Predisposing factors in sudden cardiac death in Tecumseh, Michigan: A prospective study. Circulation 41:31-37. Clifford, P. 1970. On the epidemiology of nasopharyugeal carcinoma. Int. J. Cancer 5:287- 309. Cohen, B., and N.B. Myant. 1959. Concentration of salivary iodide: A comparative study. J. Physiol. 145:595-610. Coleman, T.G., R.D. Manning, R.A. Norman, and J. DeClue. 1975. The role of the kidney in spontaneous hypertension. Am. Heart J. 89:9~98. Comly, H.H. 1945. Cyanosis in infants caused by nitrates in well water. J. Am. Med. Assoc. 129:112-116. Conn, J.W. 1949. The mechanism of acclimatization to heat. Adv. Inter. Med. 3:373-393. Conway, J., and P. Lanwers. 1960. Hemodynamic and hypotensive effects of long term therapy with chlorothiazide. Circulation 21:21-37. Cook, H.A. 1970. Fluoride intake through tea by British children. Fluoride Q. Rep. 3:12-18. Correa, P., W. Haenszel, C. Cuello, S. Tannenbaum, and M. Archer. 1975. A model for gastric cancer epidemiology. Lancet 2:58-59. Crabtree, K.T. 1970. Nitrate variation in ground water. Technical Completion Report, OWItR B 044Wis. Office of Water Resources Research. Cruz-Coke, R., H. Donoso, and R. Barrera. 1973. Genetic ecology of hypertension. Clin. Sci. Mol. Med. 45(Suppl. 1):55-65. Cruz-Coke, R., R. Etcheverry, and R. Nagel. 1964. Influence of migration on the blood pressure of Easter Islanders. Lancet 1:697-699.
Inorganic Solutes 477 Curtin, T.M., and W.T. London. 1966. Nitrate-nitrite intoxication in swine. Proceedings, United States Livestock Sanitary Association 60:339-348. Dace, O., L. Kramer, D. Wiatrowski, H. Spencer. 1974. Dietary fluoride intake in man. J. Nutr. 104:1313-1318. Dahl, L.K. 1958. Salt intake and salt need. N. Engl. J. Med. 258:1152-1157. Dahl, L.K. 1960. Possible role of salt intake in the development of essential hypertension. In K.D. Bock and P.T.Cottier, eds. Essential Hypertension, An International Symposium, pp. 53-65. Springer-Verlag, Heidelberg. Dahl, L.K. 1972. Salt and hypertension. Am. J. Clin. Nutr. 25:231-244. Dahl, L.K., M. Heine, and K. Thompson. 1974. Geneticinfluenceofthe kidneys on blood pressure. Evidence from chronic renal homografts in rats with opposite predispositions to hypertension. Circ. Res. 40:94101. Dahl, L.K., M. Heine, and L. Tassinari. 1962. Effects of chronic excess salt ingestion. Evidence that genetic factors play an important role in susceptibility to experimental hypertension. J. Exp. Med. 115: 1173-1190. Dawber, T. R. , W.B . Kannel, A. Kagan, R.K. Donabedian, P. McNam ara, and G. Pearson. 1967. Environmental factors in hypertension. In J. Stamler, R. Stamler, and T. Pullman, eds. The Epidemioloty of Hypertension. Proceedings of an International SvmDosium. Chicago, pp. 255-288.1964, Grune and Stratton, Inc., New York. J ~ DeWardener, H.E. 1973. The control of sodium excretion. In J. Orloff, and R.W. Berliner, eds. Handbook of Physiology, pp. 677-720. Section 8: Renal Physiology. American Physiological Society, Washington, D.C. Dickey, E., W.D. Lembke, T.R. Peck, G. Stone, and W.H. Walker. 1972. Nitrate levels and possible sources in shallow wells. In Proceedings Second Allerton Conference on Environmental Quality and Agriculture, 1971, pp. 40~4. University of Illinois, Urbana. Special Publication No. 26. Digesti, R.D., and H.J. Weeth. 1973. E~ects of sulfate-water on cattle. Proc. West. Sect., Am. Soc. Anim. Sci. 24:259-263. Dixon, W.J., and F.J. Massey. 1969. Introduction to Statistical Analysis, 3d ed. McGraw Hill, New York. Dole, V.P., L.K. Dahl, G.C. Cotzais, H.A. Eder, and M.E. Krebs. 1950. Dietary treatment of hypertension. Clinical and metabolic studies of patients on the rice-fruit diet. J. Clin. Invest. 29: 1 189-1206. Douglas, T.E. 1957. Fluoride dentrifice and stomatitis. Northwest Med. 56:1037-1039. Druckrey, H., D. Steinhoff, H. Beuthner, H. Schneider, and P. Klarner. 1963. Prufung von Nitrit auf chronisch toxische Wirkung und Ratten. ArzneimiHelforschung 13:320-323. Druckrey, H., R. Preussmann, S. Ivankovic, and D. Schmahl. 1967. Organotrope carcinogene Wirkungen bei 65 verschiedenen N-nitros~verbindungen an BD ratter. Zeitschr. Krebsforsch. 69:103-201. Earley, L.E. 1972. Sodium metabolism. In M.H. Maxwell and C.R. Kleeman, eds. Clinical Disorders of Fluid and Electrolyte Metabolism, 2nd ea., pp. 95-119. McGraw Hill, Inc. New York. Epstein, F.H., and R.D. Eckoff. 1967. The epidemiology of high blood pressure-geographic distributions and etiologic factors. In J. Stamler, R. Stamler, and T.N. Pullman, eds. The Epidemiology of Hypertension. Proceedings of an International Symposium, Chicago, 1964, pp. 155-166. Grune and Stratton, Inc., New York. Erickson, J.D., G.P. Oakley, Jr., J.W. Flynt, Jr., and S. Hays. 1976. Water fluoridation and congenital malformations: No association. J. Am. Dent. Assoc. 93:981-984. Ericsson, Y., and U. Ribelius. 1971. Wide variations of fluoride supply to infants and their effect. Caries Res. 5:78-88.
478 DRINKING WATER AND H"LTH Feltman, R. 1956. Prenatal and postnatal ingestion of fluorides: a progress report. Dent. Digest 62:353-357. Feltman, R., and G. Kosel. 1961. Prenatal and postnatal ingestion of fluorides 14 years of investigation final report. J. Dent. Med. 16:190-198. Ferrant, M. 1946. Methemoglobinemia: Two cases in newborn infants caused by nitrates in well water. J. Pediatr. 29:585-592. Fisher, F., and M.J. PrivaL 1973. Total Fluoride Intake. Center for Science in the Public Interest, Washington, D.C. Fleming, H.S. 1953. Effect of fluorides on the tumor S37 after transplantation to selected locations in mice and guinea pigs. J. Dent. Res. 32:646. Fodor, J.G., E.C. Abbott, and I.E. Rusted. 1973. An epidemiologic study of hypertension in Newfoundland. Can. Med. Assoc. J. 108:1365-1368. Fong, Y.Y., and W.C. Chan. 1973. Bacterial production of dimethyl nitrosamine in salted fish. Nature 243:421422. Forbes. G., F.A. Smith, and M.F. Bryson. 1973. Effect of growth hormone on fluoride balance. Calc. Tiss. Res. 11:301-10. Fry, B.W., D.R. Taves, and R.G. Merin. 1973. Fluorometabolites of methoxyflurane. Anethesiology 38:144. Gavras, H., H.B. Brunner, E.D. Baughan, Jr., and J.H. Laragh. 1973. Angiotensin sodium interaction in blood pressure maintenance of renal hypertensive and normotensive rats. Science 180:1369-1372. Gerdes, R.A., J.D. Smith, and H.G. Applegate. 1971. The effects of atmospheric hydrogen fluoride upon Drosophila melanogaster. I. Differential genotypic response. Atmos. Environ. 5:113-122. Gibbons, R.J., and J. van Houte. 1975. Bacterial adherence in oral microbial ecology. Ann. Rev. Microbiol. 29:19 44. Glanville, E.V., and R.A. Geerdink. 1972. Blood pressure of Amerindians from Surinum. Am. J. Phys. Anthropol. 37:251-254. Goodman, L.S., and A. Gilman. 1975. The Pharmacologic Basis of Therapeutics, 5th ed. MacMillan Co., New York. Greenberg, L.W., C.E. Nelsen, and N. Kramer. 1974. Nephrogenic diabetes insipidus ~vith fluorosis. Pediatrics 54:32~322. Greenblatt, M., S. Mirvish, and B.T. So. 1971. Nitrosamine studies: Induction of lung adenomas by concurrent administration of sodium nitrite and secondary amines in S`viss mice. J. Nat. Cancer. Inst. 46:1029-1034. Greenblatt, M., V.R.C. Kommineni, and W. Lijinsky. 1973. Null effect of concurrent feeding of sodium nitrite and amino acids to MRC rats. J. Nat. Cancer. Inst. 50:799-802. Greene, I., and E.P. Hiat. 1955. Renal excretion of nitrate and its effect on excretion of sodium and chloride. Am. J. Physiol. 180:149-182. Greene, I., and E.P. Hiatt. 1954. Behavior of the nitrate ion in the dog. Am. J. Physiol. 176:463-367. Gregor, O. 1974. Gastric cancer control. Neoplasmia 21:235-247. Grimbergen, G.W. 1974. A double blind test for determination of intolerance to fluoridated water; Preliminary report. Fluoride 7:146-152. Gross, E. 1964. Vergiftungen durch aufoakme von nitraten im trinlcwasser und in pflanzen bei kleinstkinderen und bei nutztieren. Arch. Hyg. Bakteriol. 148:28-39. Gross, F. 1960. Adrenocortical function and renal pressor mechanisms. In K.D. Bock and P.T. Cottier, eds. Essential Hypertension, An International Symposium, pp. 92-111. Springer-Verlag, Berlin. Gross, F. 1971. The renin-angiotensin system and hypertension. Ann. Int. Med. 75:777-787.
Inorganic Solutes 479 Gruener, N., H.I. Shuval, K. Behroozi, S. Cohen, and H. Sheeter. 1973. Methemoglobine- mia induced by transplacental passage of nitrites in rats. Bull. Environ. Contam. Toxicol. 9:4448. Guy, W.G., D.R. Taves, and W.S. Brey. 1976. Organic fluorocompounds in human plasma: Prevalence and characterization. In R. Filler, ed. Biochemistry Involving Carbon- Fluorine Bonds. ACS Symposium, Series 28. Guyton, A.C., T.G. Colemen, A.W. Cowly, K.W. Scheel, R.D. Manning, Jr., and R.A. Norman, Jr. 1972. Arterial pressure regulation. Overriding dominance of the kidneys in long-term regulation and in hypertension. Am. J. Med. 52:584-594. Hagan, T.L., M. Pasternack, and G.C. Scholz. 1954. Waterborne fluorides and mortality. Public Health Rep. 69:450-454. Hamilton, M., G.W. Pickering, J.A.F. Roberts, and G.S.C. Sowry. 1954. The aetiology of essential hypertension. I. The arterial pressure in the general population. Clin. Sci. 13:11- 35. Hammerton, C. 1945. The corrosion of cement and concrete. Sewage Works J. 17:403-405. Hanes, R.E., L.W. Zelazny, and R.E. Blaser. 1970. Effects of de-icing salts on water quality and biota; Literature review and recommended research. National Cooperative Highway Research Program Report 91, Highway Research Board, National Research Council, National Academy of Sciences-National Academy of Engineering, Washington, D.C. Hanhijarvi, H., V.M. Anttonen, A. Pekkarinen, and I. Penttila. 1972. The effect of artificially fluoridated drinking water on the plasma ionized fluoride content in certain clinical diseases and in normal individuals. Acta Pharmacol. Toxicol. 31(I): 104. Harada, M, H. Ishiwata, Y. Nakamura, A. Tanimura, and M. Ishidate. 1975. Studies on in vivo formation of nitroso compounds. I. Changes of nitrite and nitrate concentrations in human saliva after ingestion of salted Chinese cabbage. J. Food Hyg. Soc. Jap. 16:11-18. Harmeson, R.H., F.W. Sollo, Jr., and T.E. Larson. 1971. The nitrate situation in Illinois. J. Am. Water Works Assoc. 63:303-310. Harmeson, R.H., T.E. Larson, L.M. Henley, R.A. Sinclair, and J.C. Neill. 1973. Quality of surface water in Illinois, 196~71. Illinois State Water Survey Bulletin 56. Urbana. Hatch, F.T., A.R. Wertheim, G.H. Eurman, D.M. Watkin, H.F. Froeb, and H.A. Epstein. 1954. Effects of diet in essential hypertension. III. Alterations in sodium chloride, protein and fatintake.Am.J.Med. 17:499-513. Hawksworth, G., M.J. Hill, G. Gordillo, and C. Cuello. 1975. Possible relationship between nitrates, nitrosamines, and gastric cancer in S.W. Colombia. In P. Bogovski, ed. N- Nitroso Compounds in the Environment. International Agency for Research in Cancer. Scientific Publication no. 9. Lyon, in press. Herskowitz, I.H., and I.L. Norton. 1983. Increased incidence of melanotic tumors in two strains of Drosophila melanogaster following treatment with sodium fluoride. Gen. 48:307-310. Hill, M.J., G. Hawksworth, and G. Tattersall. 1973. Bacteria, nitrosamines and cancer of the stomach. Br. J. Cancer 28: 562-567. Hirayama, T. 1976. Changing patterns of cancer mortality in Japan with special reference to the decrease in stomach cancer mortality. Presented at a conference on Origins of Human Cancer, September 7-14, Cold Spring Harbor Laboratory. Hodge, H.C. 1956. Fluoride metabolism: its significance in water fluoridation. J. Am. Dent. Assoc. 52:307-314. Hodge, H.C., and F.A. Smith. 1965. Fluorine Chemistry, vol. IV, ed. by J.H. Simmons. Academic Press, New York. Hodge, H.C., and F.A. Smith. 1970. Minerals: fluorine and dental caries. Advances in Chemistry Series no. 94:93-115.
480 DRINKING WATER AND H"LTH Hodge, H.C., F.A. Smith, and I. Gedalia. 1970. Excretion of fluorides. In Fluorides and Human Health, pp. 141-161. World Health Organization Monograph Series no. 59. Geneva. Hodge, H.D. 1961. Metabolism offluorides. J. Am. Med. Assoc. 177:313-316. Hall, K. 1937. The factors which play a role in the solution of lead by water. Ges. Ing. 58:323-328 (Abstr.: J. Am. Water Works Assoc. 29:293). Hoobler, S.W., C. Tejada, M. Guzman, and A. Pardo. 1965. Influence of nutrition and acculturation on the blood pressure levels and changes with age in the highland Guatemala Indian Circ. 32(Suppl II): 116. Hoover, R.N. 1976. Fluoridated drinking water and the occurrence of cancer. J. Nat. Cancer Inst. In press. Hutchinson, F.E. 1971. The effect of highway salt on water quality in selected Maine rivers. In Proceedings, Street Salting-Urban Water Quality Workshop, pp. 2~23. State University of New York College of Environmental Science and Forestry at Syracuse. Ingleson, H., A.M. Sage, and R. Wilkinson. 1949. Effect of chlorination of drinking water on brass fittings. J. Inst. Water Eng. 3:81-91. Jackson, D., P.M.C. James, and W.B. Wore. 1975. Fluoridation in Anglesey. Br. Dent. J. 138:165-171. Jaflfe, E.R., and P. Helter. 1964. Methemoglobinemia in man. In C.V. Moore and E.B. Brown, eds. Progress in Hematology, vol. IV, pp. 48-71. Grune and Stratton, New York. Jagiello, G., and L. Ja-Shein. 1974. Sodium fluoride as potential mutagen in mammalian eggs. Arch. Environ. Health 29:23~235. Jowsey, J., R.K. Schenk, and F.W. Reutter. 1968. Some results of the effect of fluoride on bone tissue in osteoporosis. J. Clin. Endocrinol. Metab. 28:869-874. Juncos, L.I., and J.V. Donadio, Jr. 1972. Renal failure and fluorosis. J. Am. Med. Assoc. 222:783-785. Kahn, H.A., H.H. Medalie, H.N. Nenfeld, E.G. Riss, and U. Goldbourt. 1972. The incidence of hypertension and associated factors. The Israel ischemic heart disease study. Am. Heart J. 84:171-172. Kannel, W.B., W.P. Castelli, P.M. McNamara, and P. Sortie. 1969a. Some factors affecting morbidity and mortality in hypertension: The Framingham Study. Milbank Mem. Fund Q. 47(3)Part 2:116-142. Kannel, W.B., M.J. Schwartz, and P.M. McNamara. 1969. Blood pressure and risk of coronary heart disease: The Framingham Study. Dis. Chest 56:43-52. Kellam, B. 1933. The action of water on concrete. Proc. Am. Soc. Testing Materials 33(Part D:389-296. Kempner, W. 1948. Treatment of hypertensive vascular disease with rice diet. Am. J. Med. 4:545-577. Kinlen, L. 1975. Cancer incidence in relation to fluoride level in water supplies. Br. Dent. J. 138:221-224. Kirkendall, W.M., W. E. Connor, F. Abboud, S. P. Rastogi, T.A. Anderson, and M. Fry. 1972. The effect of dietary sodium on the blood pressure of normotensive man. In J. Geest and E. Koiw, eds. Hypertension '72, pp. 360-373. Springer-Verlag, New York. Knotek, Z., and P. Schmidt. 1964. Pathogenesis, incidence, and possibilities of preventing alimentary nitrate methemoglobinemia in infants. Pediatrics 34:78-83. Korotchenok, N.A. 1946. Limiting concentrations of some mineral consituents of drinking water in western Turkmenia. Chem. Abstr. 40:7459; Gig. Sanit. 10(6):13-15 (1945~. Kramer, L., D. Osis, E. Wiatrowski, and H. Spencer. 1974. Dietary fluoride in different areas in the United States. Am. J. Clin. Nutr. 27:590 594.
Inorganic Solutes 481 Langford, H.G., and R.L. Watson. 1971. A hypothesis about essential hypertension. Trans. Am. Clin. Climatol. Assoc. 83:125-132. Langford, H.G., R.L. Watson, and B H. Douglas. 1968. Factors affecting blood pressure in population groups. Re. Assoc. Am. Phys. 8 1:135-145. Langford, H.G., R.L. Watson, and J.G. Thomas. 1976. Salt intake and the treatment of hypertension. Am. Heart J., in press. Langford, H.S., and R.L. Watson. 1975. Electrolytes and hypertension. In C. Paul, ed. Epidemiology and Control of Hypertension, pp. 119-128. Stratton Intercontinental Medical Book Corp., New York. Larson, T.E., and L. Henley. 1966. Occurrence of nitrate in well waters. Final Report. Project 65-OSG. University of Illinois Water Resources Center, Urbana. Leone, N.C., M.B. Shimkin, F.A. Arnold, Jr., C.A. Stevenson, E.R. Zimmerman, P.B. Geiser, and J.E. Lieberman. 1954. Medical aspects of excessive fluoride in a water supply. Public Health Rep. 69:925-936. Lockhart, E.E., C.L. Tucker, and M.C. Merritt. 1955. The effect ofwaterimpuritieson the flavor of brewed coffee. Food Res. 10:598-605. Lowenstein, F.W. 1961. Blood pressure in relation to age and sex in the tropics and subtropics. Lancet 1:389-392. Maclayden, W.A. 1953. Sulfates in African inland waters. (Letter to the editor.) Nature 172:595. Machle, W., and E.J. Largent. 1943. The absorption and excretion of fluoride: II. The metabolism at high levels of intake. J. Ind. Hyg. Toxicol. 25:112-123. Machle, W., E.W. Scott, and E.J. Largent. 1942. The absorption and excretion of fluorides. Part I. The normal fluoride balance. Ind. Hyg. Toxicol. 24:199-204. Maddock, I. 1967. Blood pressure in Melanesians. Med. J. Aust. 1:1123-1126. Maddocks, I. 1961. Possible absence of essential hypertension in two complete Pacific island populations. Lancet 2:396-399. Magee, P.N., and J.M. Barnes. 1967. Carcinogenic nitroso compounds. Adv. Can. Res. 10: 163-246. Maier, F.J. 1963. Manual of Water Fluoridation Practice. McGraw Hill, New York. Mann, G.V., O.A. Roels, D.L. Price, and J.M. Merrill. 1962. Cardiovascular disease in African pygmies. A survey of the health status, serum lipids and diet of Pygmies in the Congo. J. Chron. Dis. 15:341-371. Mann, G.V., R.D. Shaffer, R.S. Anderson, and H.H Sandstead. 1964. Carciovascular disease in the Masai. J. Atheroscler. Res. 4:289-312. Manocha, S.L., H. Warner, and Z.L. Olkowski. 1975. Cytochemical response of kidney, liver and nervous system to fluoride ions in drinking water. Histochem. J. 7~11~:343-355. Marier, J.R., and D. Rose. 1966. The fluoride content of some foods and beverages. A brief survey using a modif~ed Zr-spadus method. J. Food Sci. 31:941-946. Meneely, G.R., and L.K. Dahl. 1961. Electrolytes in hypertension. The effects of sodium chloride. Med. Clin. N. Am. 45:271-283. Miall, W.E., and S. Chinn. 1973. Blood pressure and aging. Results of a f~fteen to seventeen year follow-up study in South Wales. Clin. Sci. Mol. Med. 45(Suppl. D:23-33. Milham, P.J., A.S. Awad, R.E. Paull, and J.H. Bull. 1970. Analysis of plants, soils, and waters for nitrate by using an ion-selective electrode. Analyst 95:751-757. Mirvish, S.S. 1972. Studies on N-nitrosation reactions. Kinetics of nitrosation, correlation with mouse feeding experiments, and natural occurrence of nitrosatable compounds (ureides and quanidines). In W. Nakahara, S. Takayama, T. Sugimura, and S. Odashima, eds. Topics in Chemical Carcinogenesis, pp. 279-295. University Park Press, Baltimore.
482 DRINKING WATER AND H"LTH Mirvish, S.S. 1975a. Formation of N-nitroso compounds: Chemistry, kinetics, and in vivo occurrence. Toxicol. Appl. Pharmacol., in press. Mirvish, S.S. 1975b. Blocking the formation of N-nitroso compounds with ascorbic acid in vitro and in viva. In C.G. King and J.J. Burns, eds. Proc., Second Conference on vitamin C. Ann. N.Y. Acad. Sce., in press. Mohamed, A.H. 1968. Cytogenic effects of hydrogen fluoride treatment in tomato plants. J. Air Pollut. Cont. Assoc. 18:6, 395-398. Mohamed, A.H. 1969. Cytogenetic effects of hydrogen fluorideinplants.Fluoride2:76-84. Mohamed, A.H. 1971. Induced recessive lethals in second chromosomes of Drosophia melanogaster by hydrogen fluoride. In H.M. Englung and W.T. Berry, eds. Proc. 2nd Internal. Clean Air Cong., pp. 158-161. Academic Press, New York. Mohamed, A.H. 1970a. Chromosomal changes in maise induced by hydrogen fluoride gas. Can. J. Gen. Cyto. 12(3):614-620. Mohamed, A.H., and P.A. Kemmer. 1970b. Genetic effects of hydrogen fluoride on Drosophila melanogaster. Fluoride 3(4): 192-199. Mohamed, A.H., H.G. Applegate, and J.D. Smith. 1966a. Cytological reactions induced by sodium fluoride in Allium Cepa root tip chromosomes. Can. J. Genet. Cytol. 8(2):241- 244, 241-244. Mohamed, A.H., J.D. Smith, and H.G. Applegate. 1966b. Cytological effects of hydrogen fluoride on tomato chromosomes. Can. J. Genet. Cytol. 8(3):575-583. Mohamed, A.H., and M.E.W. Chandler. 1976. Cytological effects of sodium fluoride on mitotic and meiotic chromosomes of mice. Preprint. Moore, E.W. 1952. Physiological effects of the consumption of saline drinking water. Bulletin of Subcommittee on Water Supply, National Research Council, Jan. 10, 1952. Appendix B. pp. 221-227. Marie, G.P., C.J. Ledford, and C.A. Glover. 1972. Determination of nitrate and nitrite in mixtures with a nitrate ion electrode. Anal. Chim. Acta. 60:397~03. Morse, W.R., and Y.T. Beh. 1937. Blood pressure amongst aboriginal ethnic groups of Szechwan Province, West China. Lancet 1:966-967. Mucha, V., P. Kamensky, and J. Keleti. 1965. Genesis and prevention of alimentary nitrate methemoglobinemia in babies. Hyg. Sanit. 30:185-190. Muhler, J.C. 1970. The Supply of Fluorides to Man. In Fluorides and Human Health, pp. 32- 40. World Health Organization Monograph no. 59. Mukherjee, R.N., and F.H. Sobels. 1968. The effects of sodium fluoride and iodoacetamide on mutation induction by x-irradiation in mature spermatozoa of Drosophila. Mutat. Res. 6:217-225. Murrill, R.I. 1949. A blood pressure study of the natives of Ponape Island, Eastern Carolines. Human Biol. 21:47-59. National Academy of Sciences. 1971. Biolog~c Effects of Atmospheric Pollutants-Fluorides. Washington, D.C. National Academy of Sciences-National Research Council. 1971. Statement regarding the role of methoxyflurane in the production of renal dysfunction. Anesthesiology 34(6):505- 509. National Academy of Sciences-National Research Council. Environmental Studies Board. 1973. Water Quality criteria, 1972. EPA Report. EPA-R3-73-033. Washington, D.C. Needleman, H.L., S.M. Pueschel, and K.J. Rothman. 1974. Fluoridation and the occurrence of Down's Syndrome. N. Engl. J. Med. 291:821-823. Needleman, H.L., S.M. Pueschel, and K.J. Rothman. 1975. Fluoridation and Down's Syndrome. N. Engl. J. Med. 292(3):161-162.
Inorganic Solutes 483 Newberne, P.M., and R.C. Shank. 1973. Induction of liver and lung tumours in rats by the simultaneous administration of sodium nitrite and morpholine. Food Cosmet. Toxicol. 1 1:819-125. O'Meara, W.F. 1968. Fluoride administration -in single daily dose: A survey of its value in prevention of dental caries. Clin. Pediatr. 7:177-184. Obe, G., and R. Slaci-Erben. 1973. Suppressive activity by fluoride on the induction of chromosome aberrations in human cells and aLkylating agents in vitro. Mutat. Res. 19:369-371. Okamoto, K., 1969. Spontaneous hypertension in rats. Int. Rev. Exp. Pathol. 7:227-270. Okamura, T., and T. Matsuhisa. 1963. Fluorine and other related materials in rice. I. Fluorine content of lowland nonglutinous husked rice and its-correlation with human mortality with cancer. Nippon Sakumotsu Gakkai Kiji 32:132-138. Olson, J.R., F.W. Oehme, and D.L. Carnahan. 1972. Relationship of nitrate levels in water and livestock feeds to herd health problems on 25 Kansas farms. Vet. Med. Small Anim. Clin. 67:257-260. Olson, O.E., and A.L. Moxon. 1942. Nitrate reduction in relation to oat-hay poisoning. J. Am. Vet. Med. Assc. 100:403-406. Oreopoulos, D.G., D.R. Taves, S. Rabinovich, H.E. Meema, T. Murray, S.S. Fenton, and G.A. deVerber. 1974. Fluoride and dialysis osteodystrophy: Results of a double-blind study. Trans. Am. Soc. Art. Int. Organs 20:203-208. Orgeron, J.D., J.D. Martin, and C.T. CAraway. 1957. Methemoglobinemia from eating meat with high nitrite content. Public Health Rep. 72:189-193. Ostfeld, A.M., and O. Paul. 1963. The inheritance of hypertension. Lancet 3:575-579. Page, L.B., and J.J. Sidd. 1973. Medical Management of P'imary Hypertension. Little, Brown and Co., Boston. Page, L.B. 1976. Epidemiologic evidence on the etiology of human hypertension and its possible prevention. Am. Heart J. 91:527-534. Page, L.B., Damon, A., and R.C. Moellering. 1974. Antecedents of cardiovascular disease in six Solomon Islands societies. Circulation 49:1132-1146. Palmer, A.W. 1903. Chemical survey of the water of Illinois. Report for the years 1897-1902. University of Illinois. Parkins, F.M. 1974. Relationship of human plasma fluoride and bone fluoride to age. Calc. Tiss. Res. 16:335-338. Perara, G.A., and D.W. Blood. 1947 The relationship of sodium chloride to hypertension. J. Clin. Invest. 26:1109-1118. Peterson, N.L. 1951. Sulfates in drinking water. Official Bulletin. North Dakota Water and Sewage Works Conference, 18:6-11. Petraborg, H.T. 1974. Chronic fluoride intoxication from drinking water: Preliminary report. Fluoride 7:47-52. Pickering, G. 1965. Hyperpeisis: High blood pressure without evident cause. Essential Hypertension. Br. Med. J. 2:959-968. Piskin, R. 1973. Evaluation of nitrate content of ground water in Hall County, Nebraska. Groundwater 1 1:4-13. Prior, I.A., J.M. Stanhope, J. Grimley-Evans, and C.E. Salmond. 1974. The Tokelau Island migrant study. Int. J. Epidemiol. 3:225-232. Prival, M.J., and F. Fisher. 1974. Adding fluorides to the diet. Environment 16(5):29-33. Quissell, D.O., and J.W. Suttie. 1972. Development of fluoride-resistant strain of L cells: Membrane and metabolic characteristics. Am. J. Physiol. 223:59~603. Rapaport, I. 1959. Nouvelles recherches sur le mongolisme. A propos du role pathogenique du fluor. Bull. Acad. Nat. Med. 143:367-379.
484 DRINKING WATER AND H"LTH Rensburg, S.W.J., and W.H. Vos. 1966. The influence of excess fluorine intake in the drinking water on reproductive efficiency in bovines. Onderstepoort J. Vet. Res. 33(1): 185-194. Richards, F.M., and J.R. Knowles. 1968. Glutaraldehyde as a protein cross-linking reagent. J. Mol. Biol. 37:231-233. Richards, L.F., W.W. Westmoreland, M. Tashiro, C.M. McKay, and J.T. Morrison. 1967. Determining optimum fluoride levels for community water supplies in relation to temperature. J. Am. Dent. Assoc. 74:389-397. Ridder, W.E., and F.W. Oehme. 1974. Nitrates as an environmental, animal, and human hazard. Clin. Toxicol. 7:145-159. Robertson, J.S. 1975. Water sodium: The problem of the bottle-fed neonate. WRC Drinking Water Quality and Public Health. Roholm, K. 1937. Fluorine Intoxication. H.K. Lewis, London. Royal College of Physicians. 1976. Fluoride, teeth, and health. Pitman Medical and Scientific Publishing Co., Ltd., London. San Filippo, F.A., and G.C. Battistone. 1971. The fluoride content of a representative diet of the young adult male. Clin. Chim. Acta 31:453-457. Sander, J., and F. Schweinsberg. 1972. Wechselbeziehungen zw~schen nitrat, nitrit und kanzerogenen N-nitrosoverbindungen. Zbl. Bakt. Hyg. I. Abt. Orig. B. 156:299-340. Sander, J., F. Schweinsberg, and H.P. Menz. 1968. Untersuchunge- ueber die entstehung cancerogener nitrosamine in magen. Hoppe-Seyler's Z. Physiol. Chem. 349:1691-1697. Sattelmacher, P.G. 1962. Methemoglobinemia from nitrates in drinking water. Schr~ftenr- eiche des Vererins fur Wassar Boden und Lufthygiene, no 21. Sauerbrunn, B.J.L., C.M. Ryan, and J.F. Shawl 1965. Chronic fluoride intoxication with fluorotic radiculomyelopathy. Ann. Intern. Med. 63:1074-1078. Schlesinger, E.R. 1956. Newburgh-Kingston Caries-fluorine study. XIII. Pediatric flndings after ten years. J. Am. Dent. Assoc. 52:296-306. Schneider, N.R., and R.A. Yeary. 1975. Nitrite and nitrate pharmacokinetics in the dog, sheep, and pony. Am. J. Vet. Res. 36:941-947. Schuller, P.L., and E. Veen. 1967. Preservatives: A review of methods of analysis. J. Assoc. Off. Anal. Chem. 50:1127-1145. Schuphan, W. 1965. The n~trate content of spinach (Spinacia oleracea) in relation to methemoglobinemia in infants. Z. Ernaehrungswiss. 5:207-209. Scofield, C.S. 1936. The salinity of irrigation water. Smithsonian Institution Annual Report, 1935, pp. 275-287. Washington, D.C. Scott, K.D., A.E. Kimberly, A.L. Van Horn, L.F. Ely, and F.H. Waring. 1937. Fluoride in Ohio water supplies. Its effect, occurrence and reduction. J. Am. Water Works Assoc. 29:9-25. Selye, H., C.E. Hall, and E.M. Fowley. 1943. Malignant hypertension produced by treatment with desoxycorticosterone acetate and sodium chlor~de. Can. Med. Assoc. J. 49:88-92. Shank, R.C. 1975. Toxicology of N-nitroso compounds. Toxicol. Appl. Pharmacol. 31:361- 368. Shaper, A.G., D.H. Wright, and J. Kyobe. 1969. Blood pressure and body build in three nomadic tribes of northern Kenya. East Afr. Med. J. 46:274. Shea, J.J., S.M. Gillespie, and G.L. Waldbott. 1967. Allergy to fluoride. Ann. Allergy 25:388- 391. Shearer, L.A., J.R. Goldsmith, C. Young, O.A. Kearns, and B.R. Tamplin. 1972. Methemoglobin levels in infants in an area with high nitrate water supply. Am. J. Public Health 62:1174-1180.
Inorganic Solutes 485 Shuval, ELI., and N. Gruener. 1973. Health effects of nitrates in water. Final report. Office of Research and Development, U.S. Environmental Protection Agency, Washington, D.C. (Grant No. 06-012-3) Shuval, H.I., and N. Gruener. 1972. Epidemiological and toxicological aspects of nitrates and nitrites in the environment. Am. J. Pub. Health 62:1045-1052. Simon, C. 1966. Nitrite poisoning from spinach. Lancet 1 :872. Singer, L., and W.D. Armstrong. 1969a. Determination of fluoride procedure based upon diffusion of HF. Anal. Biochem. 10:495-500. Singer, L., and W.D. Armstrong. 1969. Total fluoride content of human serum. Arch. Oral Biol. 14:1343-1347. Singer, L., and W.D. Armstrong. 1973. Determination of fluoride in ultrafiltrates of sera. Biochem. Med. 8:415-422. Singer, L., and W.D. Armstrong. 1960. Regulation of human plasma fluoride concentration. J. Appl. Physiol. 15:508-510. Singer, R.H. 1968. Environmental nitrates and animal health. Southwest. Vet. 22:13-18. Sinios, A., and W. Wodsak. 1965. Die spinatvergiftung des savglings. Dent. Med. Wochenschr. 90: 1856-1863. Slacik-Erben, R., and G. Obe. 1976. The effect of sodium fluoride on DNA synthesis, mitotic indices and chromosomal aberrations in human leukocytes treated with Trenimon in vitro. Mutat. Res. in press. Smith, F.A. 1966. Handbook of Experimental Pharmacoloy, vol. XXII. Springer-Verlag, New York. Smith, F.A., D.E. Gardner, and H.C. Hodge. 1950. Investigations on the metabolism of fluoride II Fluoride content of blood and urine as a function of the fluorine in drinking water. J. Dent. Res. 29:596 600. Smith, G.E. 1970. Nitrate pollution of water supplies. Trace Subst. Environ. Health 3:273- 287. Smith, J.E., and E. Beutler. 1966. Methemoglobin formation and reduction in man and various animal species. Am. J. Physiol. 210:347-250. Smith, S.O., and J.H. Baier. 1969. Report on nitrate pollution of ground water, Nassau County, Long Island. Bureau of Water Resources, Nassau County Department of Health, Mineola, New York. Sollman, T. 1957. A Manual of Pharmacology, 8th ed. W.B. Saunders, Philadelphia. Spencer, H., I. Lewin, E. Wistrowski, and J. Samachson. 1970. Fluoride metabolism in man. Am. J. Med. 49:807-813. Spiegelhalder, B., G. Eisenbrand, and R. Preussman. 1976. The influence of dietary intake of nitrate on the nitrite content in human saliva: A factor of possible relevance for in vivo formation of N-nitroso compounds. Food Cosmet. Toxicol., in press. Stamler, J., M. Kjelsberg, and Y. Hall. 1960. Epidemiologic studies on cardiovascular-renal disease. I. Analysis of mortality by age-race-sex-occupation. J. Chron. Dis. 12:440455. Stephany, R.W., and P.L. Schuller. 1974. De aanwezigheid van nitriet in menselijk speeksel en het N-nitrosamine probleem. In Berichten uit het Rijksin stituut voor de VoLksgezon- dheid. waarin Liber Amicorum, pp. 184190. Utrecht. Strotz, C.R., and G.I. Shorr. 1973. Hypertension in the Papago Indians. Circulation 48: 1299-1303. Subbotin, F.N. 1961. Nitrates in the drinking water and their effect on the formation of me/hemoglobin. Gigi. Sanit. 2:13-17. Tannenbaum, S.R., A.J. Sinskey, M. Weisman, and W. Bishop. 1974. Nitrite in human saliva. Its possible relationship to nitrosamine formation. J. Nat. Cancer Inst. 53:79-84.
486 DRINKING WATER AND H"LTH Tannenbaum, S.R., M. Wiesman, and D. Fett. 1976a. The effect of nitrate intake on nitrite formation in human saliva. Food Cosmet. Toxicol. 14(6):549-S52. Tannenbaum, S.R., M.C. Archer, J.S. Wishnok, and W. Bishop. 1976a. Nitrosamine formation in saliva. Presented at the 4th Meeting on the Analysis and Formation of N- Nitroso Compounds, Tallinn, Estonia, Oct. 1-2, 1975. International Agency for Research on Cancer, World Health Organization, in press. Tao, S., and J.W. Suttie. 1976. Evidence for a lack of an effect of dietary fluoride level on reproduction in mice. J. Nutr. 106(8):1115-1122. Tarazi, R.C., H.P. Dustan, and E.D. Frohlich. 1970. Long-term thiazode therapy in essential hypertension. Evidence for persistent alteration in plasma volume and renin activity. Circulation 41 :709-717. Taves, D.R. 1976. Fluoride and Cancer Mortality, Cold Springs Harbor Symposium on Origins of Human Cancer, in press. Taves, D.R. 1966. Normal human serum fluoride concentrations. Nature 211:192-193. Taves, D.R. 1968a. Electrophoretic mobility of serum fluoride. Nature 220:582-583. Taves, D.R. 1968b. Evidence that there are two forms of fluoride in human serum. Nature 217: 1050-1051. Taves, D.R. 1975. Safety of fluoridation. B.N.F. Bull. 15, 3:3, 193-198. Taves, D.R. 1967. Use of urine to serum fluoride concentration ratios to confirm serum fluoride analyses. Nature 215:1380. Taylor, A., and N.C. Taylor. 1964. The effect of sodium bromide on tumor growth. Cancer Res. 24:751-753. Taylor, A., and N.C. Taylor. 1965. The effect of sodium fluoride on tumor growth. Proc. Soc. Exp. Biol. Med. 119:252-255. Temple, P., and L. Weinstein. 1976. Personal communication. Thomas, C.B. 1973. Genetic pattern of hypertension in man. In G. Onesti, K.E. Kim, and J.H. Moyer, eds. Hypertension: Mechanisms and Management, pp. 66-73. Grune and Stratton, Inc. Thomas, W.A. 1927. Health of a carnivorous race. Study of the Eskimo. J. Am. Med. Assoc. 88: 1559-1560. Tobian, L. 1975. Current status of salt in hypertension. In 0. Paul, ed. Epidemiology and Control of Hypertension, pp. 131-143. Stratton Intercontinental Medical Book Corp., New York. Truswell, A.S., B.M. Kennelly, J.D.L. Hansen, and R.B. Lee. 1974. Blood pressure of Ikung bushmen in northern Botswana. Am. Heart J. 84:5-12. U. S. Department of Health, Education, and Welfare. 1969. Natural Fluoride Content of Community Water Supplies. U.S. Environmental Protection Agency. 1971. Environmental impact of highway de-icing. Storm and Combined Sewer Technology Branch, Edison Water Quality Research Laboratory. 11040 GKK 06/71 . U.S. Public Health Service. 1962. ~inking water standards. U.S. Department of Health, Education, and Welfare. Public Health Service Publication no. 956. Washington, D.C. Ulvila, J.M., J.A. Kennedy, J.D. Lamberg, and B.H. Scribner. 1972. Blood pressure in chronic renal failure: Effect of sodium intake and furosemide. J. Am. Med. Assoc. 220:233-288. United States National Center for Health Statistics. 1964. Vital and Health Statistics. Heart Disease in Adults, United States 196~62. PHS Publication no. 1000, series 11, no. 6. U.S. Government Printing Office, Washington, D.C. Usher, C.D., and G.M. Telling. Dec. 1975. The analysis of nitrate and nitrite in food stuffs. A critical review. Int. Agency Res. Cancer. Lyon, France.
Inorganic Solutes 487 van Logten, M.J., E.M. den Tonkelaar, R. Kroes, J.M. Berkvens, and G.J. van Esch. 1972. Long-term experiment with canned meat treated with sodium nitrite and glucono-& lactone in rats. Food Cosmet. Toxicol. 10:475488. Vertes, V., J.L. Cang~ano, L.B. Berman, and A. Gould. 1969. Hypertension in end-stage renal disease. N. Engl. J. Med. 380:978-981. Vogel, E. 1973. Strong antimutagenic effects of fluoride on mutation induction by Trenimon and I-phenyl-3,3-dimethyltriazenc in Drosophila melanogaster. Mutat. Res. 20:339-352. Waldbott, G.L. 1962. Fluoride in clinical medicine. Int. Arch. Allergy 20(Suppl. 1):1-60. Walser, M., and W.J. Rahill. 1965. Nitrate, thiocyanate and perchlorate clearance in relation to chloride clearance. Am. J. Physiol. 208:1158-1164. Walton, G. 1951. Survey of literature relating to infant methemoglobinemia due to nitrate- contaminated water. Am. J. Public Health 41:986-996. Weidmann, S.M., and J.A. Weatherell. 1970. Distribution in hard tissues. In Fluorides and Human Health, pp. 104-128. World Health Organization Monograph Series no. 59, Geneva. Weinstein, L.H., D.C. McCune, J.F. Mancini, L.J. Colavito, D.H. Silberman, and P. vanLeuken. 1972. Studies on fluoro-organic compounds in plants. III. Comparison of the biosynthesis of fluoro-organic acids in Acacia georginae with other species. Environ. Res. 5:393-408. -7 rr Whipple, G.C. 1907. The value of pure water. J. Wiley & Sons, New York. 84 pp. White, J.M., J.G. Wingo, L.M. Alligood, G.R. Cooper, J. Gutridge, W. Hydaker, R.T. Benack, J.W. Dening, and F.B. Taylor. 1967. Sodium ion in drinking water. I. Properties, analysis, and occurrence. J. Am. Diet. Assoc. 50:32-36. White, J.W., Jr. 1975. Relative significance of dietary sources of nitrate and nitrite. J. Agric. Food Chem. 23:886-891. Whitford, G.M., D.H. Pashley, and G.E. Stringer. 1976. Fluoride renal clearance: A pH- dependent event. Am. J. Physiol. 230:527-532. Whitford, G.H., and D.R. Taves. 1973. Fluoride-induced diuresis: Renal tissue solute concentrations, functional, hemodynamic and histological correlates in the rat. Anesthe- siology 39:416427. Whyte, H.M. 1958. Body fat and blood pressure of natives in New Guinea. Aust. Ann. Med. 7:3646. Widdowson, E.M., R.A. McCance, and C.M. Spray. 1951. Chemical composition of the human body. Clin. Sci. 10:113-125. Winton, E.F., R.G. Tardiff, and L.J. McCabe. 1971. Nitrate in drinking water. J. Am. Water Works Assoc. 63:95-98. Wold, H.L., and J.V. Denko. 1958. Osteosclerosis in chronic renal disease. Am. J. Med. Sci. 235:3342. World Health Organization. 1970. Fluorides and Buma H~ealth. WHO Monograph Series no. 59, 364 pp. Yiamouyiannis, J.A. 1975. A definite link between fluoridation and cancer death rate. National Health Federation, unpublished manuscript. Zinner, S.H., P.S. LTvy, and E.H. Kass. 1971. Familial aggregation of blood pressure in childhood. N. Engl. J. Med. 284:401~)4.
488 DRINKING WATER AND H"LTH REFERENCES FOR WATER HARDNESS AND HEALTH COMA Report. 1974. Diet and coronary heart disease. Report of the Advisory Panel of the Committee on Medical Aspects of Food Policy (Nitrution) on Diet in Relation to Cardiovascular and Cerebrovascular Disease. Department of Health and Social Security, London. Craun, G.F., and L.J. McCabe. 1975. Problems associated with metals in drinking water. J. Am. Water Works Assoc. 67:593-599. Heyden, S. 1976. The hard facts behind the hard-water theory and ischemic heart disease. J. Chron. Dis. 29:149-157. International Atomic Energy Agency. 1973. Trace Elements in Relation to Cardiovascular Diseases. (WHO/IAEA joint research program me) Proc. research coordination meeting, Vienna, 1973. IAEA, Vienna, Technical Report IAEA-157. Kobayashi, J. 1957. On the geographical relationship between the chemical nature of river water and death-rate from apoplexy. Ber. Ohara Inst. Landwirt. Biol. 11:11-21. Medical Research Council. 1970. Report on Recommendations. Conference on Trace Elements and Disease in Man. London, July 6, 1970. Neri, L.C., D. Hewitt, and G.B. Schreiber. 1974. Can epidemiology elucidate the water story. Am. J. Epidemiol. 99:75-88. Sauer, H.I. 1974. Relationship between trace element content of drinking water and chronic diseases. In J.T. O'Conner, and A.R. Sapoznik, eds. Proceedings of the Sixteenth Water Quality Conference: Trace Metals in Water Supplies: Occurrence, Significance, and Control, Feb. 12-13, 1974, University of Illinois, Urbana-Champaign. Univ. Ill. Bull. 71:39~8, April 29,1974. Schroeder, H.A. 1960. Relation between mortality from cardiovascular disease and treated water supplies. J. Am. Med. Assoc. 172:98-104. Schroeder, H.A., and L.A. Kraemer. 1974. Cardiovascular mortality, municipal water, and corrosion. Arch. Environ. Health 28:303-311. Second meeting of investigators on trace elements in relation to cardiovascular diseases (Joint WHO/IAEA research program m e) (unpublished WHO document C:VD/73.4), 1973. Sharrett, A.R., and M. Feinleib. 1975. Water constituents and trace elements in relation to cardiovascular disease. Prev. Med. 4:20-36. Winton, E.F., and L.J. McCabe. 1970. Studies relating to water mineralization and health. J. Am. Water Works Assoc. 62:26-30.
