
1
Physical Setting and Geologic History
SITE LOCATION
The Nevado del Ruiz volcano, one of the highest peaks in the Central Cordillera of Colombia, is located approximately 120 km west of Bogota (4°50-55' N, 75°16-20'W). The Ruiz volcano belongs to a 50-km-long chain of seven volcanos aligned north-south along the Central Cordillera.
MORPHOLOGY AND PHYSICAL ENVIRONMENT
The summit of the Nevado del Ruiz volcano is located at about 5,400 m above sea level and remains covered year-round by a 10- to 30-m-thick ice cap that extends over an area of approximately 19 km2 (INGEOMINAS, personal communication) with an estimated total ice volume of 337 million m3 ( Figure 1.1 ).
The upper part of the volcano, above an average elevation of 4,000 m, exhibits relatively steep slopes with inclinations ranging from 20 to 30 degrees. This part of the volcano consists of recent volcanic deposits. The break in slope at about 4,000 m elevation marks the contact between the recent volcanic units and the older basal volcano. Below this elevation the slope becomes flatter (approximately 10 degrees) and extends almost symmetrically to the floodplains of the north-bound Magdalena River on the east and the Cauca River on the west ( Figure 1.2 ).
The slopes of the volcano are thus generally steep and are drained by narrow, relatively deep, “V”-shaped river valleys. Drainage towards the Cauca River, west of the volcano, takes place along the Claro, Molinos, and Chinchina rivers. Drainage towards the Magdalena River, east of the volcano, follows the Gualí, Azufrado, Lagunillas, and Recio rivers.
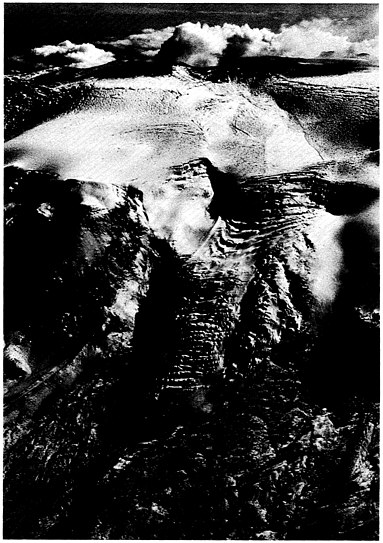
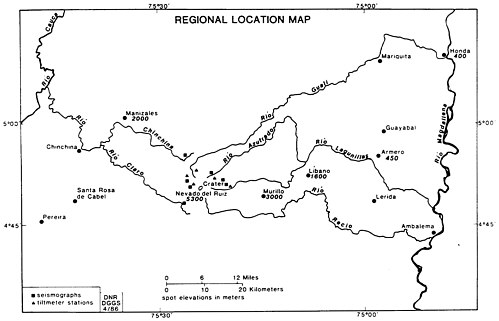
FIGURE 1.2 Regional map showing the location of towns and rivers referenced in this report. Numbers below physical locations indicate approximate elevations in meters. North is at the top of map.
A three-dimensional schematic diagram of the terrain and main population centers of the volcano’s eastern flank, where most of the destruction occurred and where the reconnaissance team’s field observations were made, is shown in Figure 1.3. The foothills at the base of the eastern side of the volcano are at an approximate elevation of 400-700 m, 45 km east of the summit.
A gently sloping floodplain extends 20 km east from the foothills to the bank of the north-bound Magdalena River. The floodplain stretches north-south along the Magdalena River for over 70 km. Within the floodplain a low ridge of sedimentary rocks runs parallel to the Magdalena River in a north-south direction, approximately 5 km west of the river. The ridge-top elevation is approximately 400 m above sea level, or about 100-150 m above the level of the Magdalena River.
The average mean annual temperature on the plain is about 25°C and the annual rainfall is approximately 180 cm. Annual precipitation in the highlands is estimated at 300-400 cm.
On the east side of the volcano, several towns have been built on the floodplain directly east of the foothills at elevations ranging from 400-500
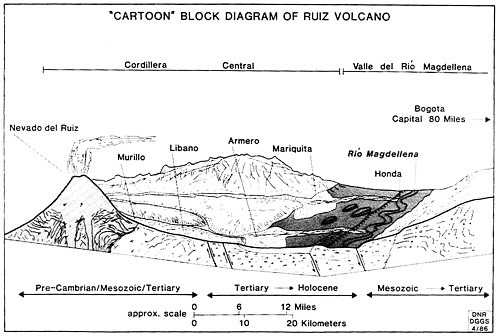
FIGURE 1.3 A diagrammatic three-dimensional view of the region east of Nevado del Ruiz showing the generalized geologic setting.
m above sea level. The two largest towns are Armero, on the Lagunillas River, and Mariquita, 25 km north of Armero on the Gualí River.
In addition, two relatively large cities are located on the western bank of the Magdalena River approximately 20 km east of the foothills. These cities are Ambalema, located at the junction of the Recio and the Magdalena rivers, approximately 63 km southeast of the volcano, and Honda, at the junction of the Gualí and Magdalena rivers, approximately 75 km northeast of the volcano. These cities, as well as other smaller towns between the foothills and the Magdalena River, are vulnerable to lahars generated in the volcanic highlands.
There are two other relatively large cities in the highlands on the eastern flank of the volcano. These two cities, located directly east of the summit between the Recio and Lagunillas rivers, are Líbano and Murillo. The largest city, Líbano, is located approximately 29 km east of the summit, at 1,590 m above sea level. Murillo is situated 16 km east of the summit at 2,900 m above sea level. Both cities, which are located at higher elevations than Armero, were unaffected by the lahars, which were constrained in narrow, well-defined river valleys. A discussion of the regional geology, tectonic setting, and prehistoric activity of the volcano can be found in Appendix A .
HISTORIC ERUPTIONS AND LAHARS IN THE RUIZ AREA
A review of the recorded activity of the Nevado del Ruiz volcano indicates the occurrence of two major historic events: the volcanic eruption of March 12, 1595, and the lahar flows of February 19, 1845. Minor lahar flows in 1828 have also been reported. A brief description of these events follows.
Volcanic Eruption of March 12, 1595
A description of this event is given by Fray Pedro Simon (1625). The text describes a volcanic eruption that started between 8:00 a.m. and 11:00 a.m. on March 12, 1595, with three thunderous explosions that were heard at distances of more than 100 km from the summit. The hot ash ejected was so profuse that it completely darkened the area around the volcano. Ash, lapilli, and pumaceous bombs covered a substantial area around the volcano— as far as 40-50 km from the summit.
Large mudflows developed along both the Gualí and Lagunillas rivers and both rivers were overwhelmed by a viscous mass of mud and ash with a strong sulfur odor. The land flooded by this mud was reportedly burned and fish died in both rivers. The largest flows apparently descended down the Lagunillas River. The kinetic energy of the mass flowing through the river canyon and out onto the floodplain was sufficient to transport large angular rocks several meters in diameter for distances of up to 2 km. Once the flood reached the floodplain, it spread laterally up to 2 km on either side of the river and continued east until it reached the Magdalena River. The waters of the Magdalena River were muddied by the introduction of mudflows from the Lagunillas and Gualí rivers. The historical account also indicates the occurrence of significant earthquake events three days prior to the eruption.
It should be noted that the city of Armero was built in 1895 at a site on the floodplain in front of the Lagunillas River canyon, approximately 2.0-2.5 km east of the foothills. This site was covered by the lahars of the 1595 eruption, which transported large angular blocks as far as the modern location of Armero.
Mudflows of February 19, 1845
A description of the 1845 mudflows was initially given by Acosta (1846). This report establishes the occurrence of a significant earthquake on the morning of February 19, 1845, followed by large mudflows that descended along the Lagunillas River. The mudflows rapidly filled parts of the Lagunillas River valley, spilling out of the river channel and killing much of the population in the vicinity of the upper river valley. Once the mudflows disgorged onto
the alluvial fan they split into two branches. The main branch followed the Lagunillas River course towards the Magdalena River. The other branch was diverted by relatively high ground in front of the Lagunillas Canyon and turned 90 degrees to the north until it reached the Sabandija River, which flows east towards the Magdalena River.
Numerous blocks of ice descended with the mudflows and were observed a few days later floating down the Magdalena River. It is estimated that 1,000 people were killed by the mudflows in the floodplain between the eastern foothills and the Magdalena River.
The historical account indicates that the area covered by the mudflows resembled a desolated beach interrupted only by a few isolated groups of large, broken trees that resisted the momentum of the flooding mass. Acosta indicates that the thickness of the remaining mud varied considerably; the thicker layers are located upstream, with a volume of approximately 300 million m3.
A later report by Acosta (1850) describes observations made during a field visit to the area five years after the 1845 mudflows. The text indicates that the sediment from the 1845 mudflow was consolidated, with the appearance of a “trachytic conglomerate” very similar to others that can be observed along a 25-km-wide band that parallels the Magdalena River for at least 150 km. Acosta noted the similar nature of the old and new lahar deposits, indicating that 8-10 layers of superimposed flows can be observed at various locations within the floodplain. The accumulated thickness of these deposits becomes greater in the low-gradient areas of the plain near the Magdalena River, where they can reach a total thickness of up to 100 m.
Acosta (1850) also carried out an inspection of the large boulders transported by the 1845 mudflows. The author indicates that a 500-m3 dioritic block was carried by the mudflows a distance of 2 km beyond the mouth of the Lagunillas River canyon onto the floodplain. Farther south on the floodplain, especially along creeks and in the lower areas, the author observed “millions” of smaller angular blocks ranging from 10 cm3 to 5 m3. The blocks were resting on top of the “trachytic conglomerate” that had transported them. These blocks were so numerous at some locations that they entirely covered the ground. Acosta indicated that the reduction of volume that took place during “drying” of the mud had exposed blocks previously submerged within the mudflow.
The velocity of the mudflows in the floodplain can be estimated by eyewitness accounts indicating that people were able to escape by running ahead of the flows until they reached high ground (Acosta, 1850). Based upon Acosta’s descriptions, it can be concluded that the mudflows that descended the Lagunillas River in February 1845 were as voluminous, if not more so, than the November 1985 Lagunillas River flows that destroyed
Armero. Furthermore, the course followed by the 1845 flows was nearly the same as that followed by the mudflows 140 years later.
Other Historic Events
The occurrence of large earthquakes south and southwest of the area of the volcano are reported to have occurred at various times in the past (Boussingault, 1849). Two of the most significant earthquakes took place on June 16, 1826, and on November 16, 1827. Thick mudflows with an intense odor of sulfur (indicating possible volcanic eruption as well) were observed along the Magdalena and Cauca rivers immediately after these earthquakes (Boussingault, 1849). Other reports (Acosta, 1850) indicate that after these earthquakes large numbers of dead fish were observed in the main rivers that drain the eastern flank of the Ruiz volcano. Thus, it is very likely that lahars of a lesser magnitude than those of 1845 have occurred at various times in the recent past.


