
For more than three decades, experts at the Dartmouth Institute for Health Policy and Clinical Practice have documented significant variation in Medicare spending across geographic regions apparently unrelated to health care outcomes achieved. From this seminal body of work, an idea emerged that certain regions of the country may be uniformly more efficient than others at providing high-quality health care services. Moreover, many argue that Medicare’s traditional fee-for-service reimbursement system is a major driver of both variation and waste in health care because it rewards providers based on the volume and intensity rather than the value of services delivered. Seeking strategies for reducing Medicare costs, some wonder whether cutting payment rates to high-cost areas would save money without adversely affecting health care quality for Medicare beneficiaries.
Other health care policy experts counter that supporters of the above policy proposal conflate the issue of improving value with that of reducing geographic variation. Some variation in health care spending is to be expected in an efficient health care system, reflecting “acceptable”—meaning driven by genuine health needs—differences in consumption of health care services by individual patients. Reducing geographic variation is desirable only to the extent that measured variation represents inefficiencies in the health care system. Further, the literature on geographic variation traditionally has focused on spending and utilization in fee-for-service Medicare. Little attention has been paid to Medicaid, the commercial health care sector, Medicare Advantage (also known as Part C), or the uninsured. Spending and utilization patterns in traditional Medicare should not be assumed
to be representative of other populations or of total health care spending and utilization in the United States.
Still other health care policy experts argue that regionally based payments are inherently unfair and would fail to create market incentives necessary to promote high-value, patient-centered care. Furthermore, there may not exist a natural geographic unit to use in analyses of area variation, since inter-area variation remains substantial even when the areas are defined as smaller and smaller geographic units. In other words, intra-area variation can be large, and even larger than variation across areas. Finally, provider payments based on regional area performance would reward inefficient providers in low-cost regions and punish more efficient providers in high-cost regions.
STUDY CHARGE
In 2009, following negotiations related to passage of the Patient Protection and Affordable Care Act (ACA), a group of members of the U.S. House of Representatives known as the Quality Care Coalition asked Secretary of the Department of Health and Human Services (HHS) Kathleen Sebelius to sponsor two Institute of Medicine (IOM) studies focused on geographic payments under Medicare, independent of final health care reform legislation. The first study evaluated the accuracy of Medicare’s geographic adjustment factors, which alter physician and hospital payment rates based on specific, geographically based input prices. The IOM released two related reports—Geographic Adjustment in Medicare Payment—Phase 1: Improving Accuracy and Geographic Adjustment in Medicare Payment—Phase II: Implications for Access, Quality, and Efficiency—in 2011 and 2012, respectively.
For the second study, documented in the present report, the Centers for Medicare & Medicaid Services (CMS) contracted with the IOM to conduct a 3-year consensus study under the guidance of a 19-member committee, focused on better understanding the relevance of geographic variation to payment policies designed to promote value across the U.S. health care system. The committee members included experts in health economics, statistics, health care financing, value-based health care purchasing, health services research, health law, and health disparities. The committee’s statement of task draws on language in earlier federal health care reform legislation1,2 and includes the following three tasks:
1Preservation of Access to Care for Medicare Beneficiaries and Pension Relief Act of 2010, Public Law 111-192, 111th Cong., 2nd sess. (June 25, 2010).
2The Affordable Health Care for America Act, H.R. 3962, 111th Cong., 1st sess. (October 29, 2009).
1. to independently evaluate geographic variation in health care spending levels and growth among Medicare, Medicaid, privately insured, and uninsured populations in the United States;
2. to make recommendations for changes in Medicare Part A, B, and C payments, considering findings from task 1, as well as changes to Medicare payment systems under the ACA; and
3. to address whether Medicare payments for physicians and hospitals should incorporate a value index that would modify the payments based on geographic area performance.
RESEARCH FRAMEWORK
To respond to its statement of task, the committee identified two basic questions:
1. What is known about geographic variation in health care spending, utilization, and quality?
2. Should geographically based measures of value be used to adjust Medicare fee-for-service hospital and provider reimbursement rates in a geographic region?
To help answer these questions and complement its review of the existing literature, the committee commissioned an extensive body of original empirical analyses of public and commercial databases and four papers from subject-matter experts, and held two public workshops. The empirical analyses were focused on describing and accounting for geographic variation in health care spending, utilization, and quality for the overall population, as well as for populations with specific diseases or conditions. The following seven subcontractors supported the committee’s analytic work: Acumen, LLC; Dartmouth Institute of Health Policy and Clinical Practice; Harvard University; The Lewin Group; Precision Health Economics, LLC (PHE); RAND; and the University of Pittsburgh.
In accordance with its statement of task, the committee examined variation within “areas of different sizes” to determine how different levels of geographic aggregation affect variation. Consistent with prior literature, this study evaluates variation at the level of three area units of measurement: hospital service areas (HSAs), hospital referral regions (HRRs), and metropolitan core-based statistical areas (CBSAs, also known as metropolitan statistical areas [MSAs]). Box S-1 defines these units.
BOX S-1
Definitions of Geographic Units Frequently Used in Health Services Research
• Hospital service areas (HSAs)—Created by Dartmouth and defined by assigning to an HSA the zip codes from which a hospital or several hospitals draw the greatest proportion of their Medicare patients. There are 3,426 HSAs.
• Hospital referral regions (HRRs)—Created by Dartmouth to represent regional health care markets for tertiary (complex) medical care. Dartmouth defined 306 HRRs by assigning HSAs to regions where the greatest proportion of major cardiovascular procedures were performed, “with minor modifications to achieve geographic contiguity, a minimum total population size of 120,000, and a high localization index.”
• Metropolitan statistical areas (MSAs, or metropolitan core-based statistical areas [CBSAs])—Created by the Office of Management and Budget using counties. Each of 388 MSAs includes one or more counties with one core urban area of 50,000 individuals or more, as well as “adjacent counties exhibiting a high degree of social and economic integration” (as measured by such factors as commuting patterns) with an urban core. Areas that do not qualify as MSAs are often classified as “outside” MSAs or non-MSAs. The Centers for Medicare &Medicaid Services (CMS) adjusts hospital payments according to a hospital wage index calculated for MSAs and non-MSAs.*
_________________
*CBSAs are geographic entities that the Office of Management and Budget implemented in 2003. The committee’s commissioned analyses used MSAs (a subcomponent of CBSAs also referred to as metropolitan CBSAs), as well as non-MSA “rest of state” regions. For simplicity, and in accordance with expert practice in this area, the committee uses the term “metropolitan CBSA” throughout this report.
EMPIRICAL ANALYSIS OF GEOGRAPHIC VARIATION
The subcontractors conducted a series of regression and correlation analyses to quantify geographic variation in spending, utilization, and quality across various populations, payers, and geographic units; evaluate known (and measurable) factors that account for variation; and identify the types of health care services with disproportionately high rates of variation that drive total variation. Specifically, the analyses examined the roles of such factors as patient health status and demographic characteristics, health plan, and price and market factors in accounting for geographic variation.
This report presents the committee’s findings based primarily on the commissioned analyses of traditional, fee-for-service Medicare (and to a
lesser extent Medicare Advantage, or Part C) and commercial insurance. It does not include separate analyses of variation in the Medicaid and uninsured populations, although estimates of spending by these two groups are included in the committee’s area-wide estimates of total health care spending (see the related discussion in Chapter 2).
CONCLUSIONS
Conclusion 2.1.3Geographic variation in spending and utilization is real, and not an artifact reflecting random noise. The committee’s empirical analyses of Medicare and commercial data confirm the robust presence of variation, which persists across geographic units and health care services and over time.
Prior research by Dartmouth researchers and by the Medicare Payment Advisory Commission (MedPAC) found that unadjusted Medicare spending per beneficiary is 50-55 percent higher in regions in the highest quintile of spending relative to those in the lowest quintile, while Medicare service utilization is approximately 30 percent greater in the highest quintile than in the lowest. These findings are corroborated by the committee’s commissioned analyses, which show that without adjustment for any differences among regions, the HRR in the 90th percentile of spending spent 42 percent more per Medicare beneficiary each month than the HRR in the 10th percentile. Analyses of commercial insurance data confirm the presence of similar spending variation (a 36-42 percent difference between the 90th and 10th percentiles of HRR-level spending) for all geographic units (HSA, HRR, and metropolitan CBSA), with greater variation at the smaller, HSA level. A separate analysis of Medicare Advantage (Medicare Part C), as well as an estimate of total health care spending in the United States, likewise found remarkable regional differences between the highest- and lowest-spending quintiles at the HRR level, with 90th/10th percentile ratios of 1.36 and 1.50, respectively.
Variation can be found at all geographic levels. Medicare spending, however, adjusted for regional differences in age, sex, and health status, is correlated only weakly with spending among the privately insured population (correlations of 0.08-0.11) at the HRR level. In other words, areas that are high spenders in Medicare are not necessarily high spenders in the commercial market and vice versa.
All of the subcontractors examined variation in the utilization of prescription drugs; imaging procedures; and inpatient, outpatient, and
_________________
3The committee’s conclusions are numbered according to the chapter of the main text in which they appear.
emergency department care. The Acumen Medicare analysis additionally evaluated variation in post-acute care services. The ratios of the 90th/10th percentiles of risk-adjusted utilization (measured as counts) point to the presence of regional variation across a number and variety of health care services within the Medicare and commercial payer populations.
The committee determined geographic variation to be a true signal rather than a result of random noise, as regional differences in health care spending and utilization persist over time. The subcontractor analyses demonstrate that growth rates of Medicare spending and utilization are consistent over time for high- and low-cost regions in the country. In other words, regions that were high- (or low-) cost in 1992 remained high- (or low-) cost in 2010. Further, area-level Medicare and commercial spending and utilization are highly correlated from one year to the next between 1992 and 2010, suggesting that geographic variation arises from systematic differences rather than randomness.
Conclusion 2.2. Variation in spending in the commercial insurance market is due mainly to differences in price markups by providers rather than to differences in the utilization of health care services.
Variation in health care spending reflects variation in both price and utilization (quantity of services). “Price” is the amount paid by insurers and beneficiaries to a provider per unit of health care services. Whereas CMS traditionally sets a uniform national base price, adjusting for the differences in input prices across geographic areas and for certain other factors, commercial prices are set through negotiations between providers and payers. Because negotiating power (on both sides) varies across areas, the variation in prices received by providers is substantially larger in the commercial sector than in Medicare.
Analyses conducted for this study support the results in the existing literature, which indicate that adjusting for regional differences in input prices has little effect on observed variation in Medicare spending. In the commercial market, however, regional differences in prices paid by insurers to providers, rather than utilization of health care, influence much of the overall regional variation in spending. Harvard’s analysis of commercial MarketScan data disaggregated unit price into its subcomponents and examined variation in input prices and markups (defined as the difference between input and transaction “output” prices). Harvard reports that 70 percent of variation in total commercial spending is attributable to price markups, most likely reflecting the varying market power of providers across HRRs. Although utilization of various services, particularly rates of inpatient admissions and emergency department visits, does contribute
to regional differences in spending, it has a notably smaller influence than price markups (see the related discussion in Chapter 2).
Conclusion 2.3. The committee’s empirical analysis revealed that after accounting for differences in age, sex, and health status, geographic variation is not further explained by other beneficiary demographic factors, insurance plan factors, or market-level characteristics. In fact, after controlling for all factors measurable within the data used for this analysis, a large amount of variation remains unexplained.
A number of factors contribute to geographic variation, and while many of these factors traditionally have been classified as “acceptable” or “unacceptable,” some sources of variation are ambiguous and do not fall neatly into either category. The committee’s analyses generally adjusted for acceptable variation, which results from factors beyond the control of the health care system in a region. To quantify these effects, the subcontractors conducted multiple regression analyses, adjusting for various “clusters” or groups of predictors. The results indicate that adjusting for age and sex (Cluster 1) has a negligible effect on geographic variation in Medicare spending. Beneficiary health status (Cluster 2), when measured using diagnoses recorded on claims, substantially reduces variation between high-and low-spending regions across both the Medicare and commercial payer sectors. This reduction in unexplained geographic variation is illustrated in Figure S-1. As indicated by the narrowed distribution of the 90th/10th percentile ratios (1.44 to 1.23) in the lower histogram, a greater number of HRRs (weighted by beneficiary months) fall in the middle range of Medicare spending after adjustment for age, sex, and health status.
As discussed in Chapter 2, other demographic factors, such as race, income, insurance and employer characteristics, and market factors, have a trivial effect on reducing variation once beneficiary health status is included in the model. Even after adjusting for all predictors measurable within the data used for this study and supported by the literature, a substantial amount of variation remains unexplained. PHE’s analysis of variation in total, input-price-adjusted health care spending attributable to known predictors reveals a pattern similar to that of Medicare- and commercial-only spending.
The subcontractors’ analyses do not distinguish between “acceptable” and “unacceptable” sources of variation. The residual unexplained variation unaccounted for here may have a causal connection with unobservable factors such as patient preferences, unmeasured regional differences in health status, market characteristics, or discretionary provision of inefficient care. However, the robust presence of variation, even with adjust-
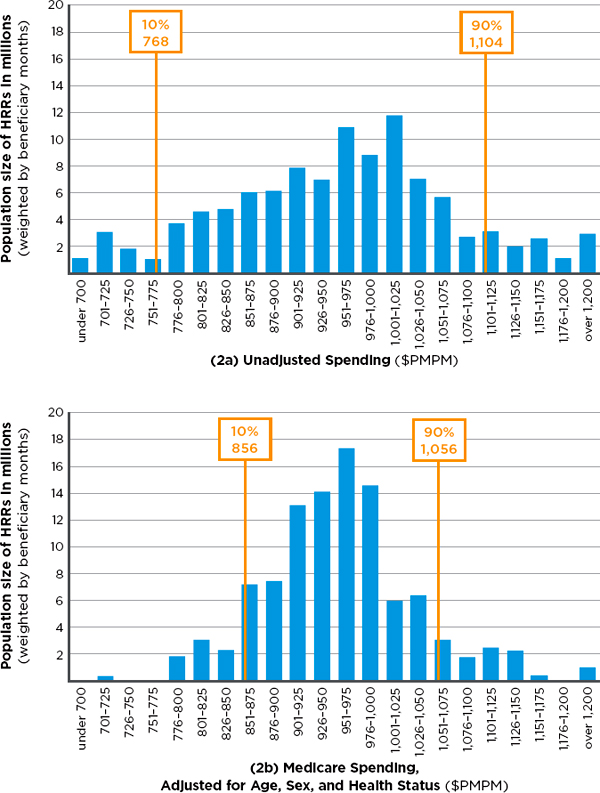
FIGURE S-1 Number of Medicare beneficiaries in hospital referral regions (HRRs) in 22 categories of monthly per capita spending, with input-price adjustment alone (2a— top) and with input-price adjustment plus adjustment for age, sex, and health status (2b—bottom).
NOTE: Medicare spending in both 2a and 2b have been adjusted for regional difference in input price. PMPM = per patient per month.
SOURCE: Developed by the committee and IOM staff based on data from Acumen Medicare analysis.
ment for more and more “acceptable” factors, creates a presumption that inefficiency may be one of the potential causes of variation.
Conclusion 2.4. Variation in total Medicare spending across geographic areas is driven largely by variation in the utilization of post-acute care services, and to a lesser extent by variation in the utilization of acute care services.
To determine the extent to which variation in particular health care services contributes to total variation in Medicare spending, the committee disaggregated price-standardized, risk-adjusted Medicare spending into seven types of services: (1) acute (inpatient) care, (2) post-acute care, (3) prescription drugs, (4) diagnostics, (5) procedures, (6) emergency department visits, and (7) other. The subcontractors’ analyses suggest that utilization of post-acute care services is a key driver of HRR-level variation in Medicare spending, with most of the remaining variation stemming from the use of acute (inpatient) care services.
As Table S-1 indicates, if there were no variation in post-acute care spending, the variation in total Medicare spending across HRRs would fall
TABLE S-1
Proportion of Variance Attributable to Each Medicare Service Category
| Adjusted Total Medicare Spending | |||
| Remaining Variance |
Reduction in Variance (%)* |
||
| Variation in Total Medicare Spending | 6,974 | — | |
| If No Variation in Post-Acute Care Only | 1,864 | 73 | |
| If No Variation in Acute Care Only | 5,085 | 27 | |
| If No Variation in Either Post-Acute or Acute | 780 | 89 | |
| If No Variation in Prescription Drugs | 6,374 | 9 | |
| If No Variation in Diagnostic Tests | 5,986 | 14 | |
| If No Variation in Procedures | 6,020 | 14 | |
| If No Variation in Emergency Department Visits/Ambulance Use | 6,972 | 0 | |
| If No Variation in Other | 6,882 | 1 | |
NOTE: Total Medicare spending and each component are input-price- and risk-adjusted using a diagnostic-based measure of risk (CMS—hierarchical condition categories [HCCs]). Each row shows the reduction in variance from eliminating only the variation in that service, with the exception of the acute and post-acute care rows.
*The individual reductions sum to more than 100 percent because of covariance terms.
SOURCE: Committee analysis of Medicare data.
by 73 percent. If there were no variation in acute care spending, but the variation in post-acute care spending were unchanged, the variation in total spending would fall by 27 percent. Finally, if there were no variation in either acute or post-acute care spending, variation in total spending would fall by 89 percent. Thus, the remaining services shown (e.g., diagnostic, which includes outpatient physician services; emergency room/ambulance service; prescription drugs) play only a small role in variation in Medicare spending.
Research and Data Limitations
The committee’s commissioned analyses evaluated quality of care using individual measures and the following nationally established composite quality indicators: a Prevention Quality Indicator (PQI), which measures the quality of ambulatory care; an Inpatient Quality Composite Indicator (IQI), which measures quality in an inpatient hospital setting; a Patient Safety Indicator (PSI), which measures the quality of inpatient care as it relates to preventable complications; and a Pediatric Quality Indicator (PDI), which reflects the quality of care among the pediatric population. Although these national quality indicators represent the “current state of the art in assessing the health care system as a whole,” performance measures based on administrative data have a number of limitations. Because of these limitations in measurement of quality composites and underlying data, this report does not quantify the amount of geographic variation in health care quality as it does for spending and utilization.
As noted earlier, a number of methodological challenges and a lack of data precluded thorough analyses of geographic variation among the Medicaid and uninsured populations. Although CMS has in recent years attempted to improve and simplify the process of obtaining historical data, significant operational, procedural, and financial barriers remain. Congress could help remove these barriers by supporting CMS’s efforts to expand the availability of Medicare and Medicaid data for research purposes. It would be particularly valuable if CMS were to release the previously unavailable or limited Medicare Part C and D databases that it maintains.
More research on health care outcomes and quality is needed, particularly in commercially insured populations. Many nationally established composite measures of quality are designed to measure process and outcomes in the Medicare population and are not necessarily applicable to privately insured beneficiaries. Further research is needed in this area, and this work would benefit from the availability of a national-level all-payer database. Moreover, combined use of Medicare and private administrative or claims data would allow for more accurate measurement of provider performance and quality of care.
RECOMMENDATION 1: Congress should encourage the Centers for Medicare & Medicaid Services (CMS), and provide the necessary resources, to make accessing Medicare and Medicaid data easier for research purposes. CMS should collaborate with private insurers to collect, integrate, and analyze standardized data on spending, as well as clinical and behavioral health outcomes, to enable more extensive comparisons of payments and quality and evaluation of value-based payment models across payers.
EVALUATION OF THE USE OF A GEOGRAPHIC VALUE INDEX
An important part of the committee’s statement of task and research framework focuses on “whether Medicare payment systems should be modified to provide incentives for high-value, high-quality, evidence-based, patient-centered care through adoption of a value index (based on measures of quality and cost) that would adjust payments on a geographic area basis.” To create a research framework that would generate useful information for policy makers, the committee needed to understand the dimensions of the geographically based value index described in its statement of task.
In general, a value index is a relative measure of value—for example, a measure of improvement in patient-centered clinical health outcomes per unit of resources used in one area relative to the national average. The committee defined health care value as the equivalent of net benefit: the amount by which overall health benefit and/or well-being produced by care exceeds (or falls short of) the costs of producing it. Those costs should incorporate the opportunity costs of resources used to produce medical services. But because opportunity costs seldom are observed directly, the committee defined “costs” for purposes of this study as Medicare or other payer spending for goods and services. These observed costs are based on payment formulas that bear some relation to opportunity costs, but they could differ considerably. Note also that economic efficiency reflects not only obtaining the most utility from a given set of inputs, but also investing the proper amount of inputs in a given activity relative to others. Thus, assessing value in health care requires a measure of society’s and/or an individual’s willingness to pay for certain services relative to others.
Assessing the value of health care goods and services is challenging, requiring appropriate measures of health benefits, well-being, and cost. To operationalize the committee’s definition of value, health benefit must be valued in a consistent fashion, typically using either dollars or quality-adjusted life years. Cost is valued in dollars. Because a health care system is designed to promote health through the provision of health care services, taking into account the system’s fiscal sustainability, health outcomes are a logical choice for assessing the overall health benefit or well-being at-
tributable to health care. However, it is rarely straightforward to ascertain the contribution of an individual health care service to a specific health outcome, particularly in the management of chronic conditions.
Value Indexes
Value indexes can take specific forms and serve many purposes. In health care, they can be used to adjust hospital or provider reimbursement rates based on measures of relative performance. For example, CMS’s hospital value-based purchasing program and physician payment modifier (authorized under Sections 3001 and 3007 of the ACA, respectively) adjust hospital and provider payments according to observed hospital and individual provider performance compared with national averages. Health benefit and well-being are, of course, affected by many factors other than the provision of health care services, such as individual behavior, biology, and genetics. If a value index influences health care payments, it is important that related measures of health outcomes be attributable to specific health care interventions. Therefore, clinical health outcomes (i.e., the health status of a patient resulting from health care) may be a preferred measure of health benefit or well-being.
As described above, this report focuses primarily on a geographically based value index. Section 1159 of the Affordable Health Care for America Act (H.R. 3962), on which the committee’s charge is based, asked the IOM to consider different value indexes, including a value index that would adjust provider payments based on regional composite measures of quality and cost. Thus, the committee limited its evaluation of a “geographically based value index” to a relative ratio that uses area-level composite measures of clinical health outcomes and cost to adjust individual hospital and provider payments under Medicare Parts A and B (“a geographic value index”).4
Conclusion 3.1. A geographically based value index is unlikely to promote more efficient behaviors among individual providers and thus is unlikely to improve the overall value of health care.
Health care decision making generally occurs at the level of the individual practitioner or organization (e.g., hospital or physician group), not at the level of a geographic region. A geographic value index is not designed
_________________
4Note that such an index differs from CMS’s hospital value-based purchasing program and physician payment modifier, as described above.
to target any level of actual decision making. Rather, it treats all providers in an area alike, assuming that area-level payment modifications will incentivize the various decision makers within an area to coordinate care and improve efficiencies across the area. However, two practical considerations suggest otherwise. First, collaboration among competing providers, absent clinical and financial integration, may raise antitrust issues. Second, payment modifications that target large areas do not always link individual physician behaviors to spending increases or decreases.
Although setting provider payments by geographic region is more targeted than the current sustainable growth rate (SGR) system, it raises similar practical concerns. In most cases, geographic regions (HRR, metropolitan CBSA) large enough to have stable year-to-year spending are too large for any individual provider to have enough influence over total expenditures to alter provider behavior patterns. When a single delivery system dominates in an area, payment policies targeting geographically based government units are functionally equivalent to targeting the relevant decision-making unit. In other cases, health care payment systems may appropriately target regional or community-based “collaboratives.” However, because such collaboratives often vary in size and structure and are not necessarily tied to central budgets within their communities, they may or may not comport with traditional geographic units.
Conclusion 3.2. Substantial variation in spending and utilization remains as units of analysis get progressively smaller.
A geographic value index for Medicare would have to generate hospital and provider payments perceived as fair. But area-level payments are fair only under certain conditions. First, all hospitals and providers within an area must be equally deserving of reward (or penalty), implying that they behave similarly. Second, assuming all providers are behaving similarly, performance levels in high-value areas must be achievable in low-value areas through elimination of inefficiencies. In other words, differences in measured value between low- and high-spending areas cannot include differences stemming from underlying health status and other acceptable sources of variation.
Spending Variation at Different Levels
Starting with HRRs, the committee examined amounts of variation within progressively smaller units of analysis (HSA, hospital, practice, and individual provider levels).
Spending Variation at the Hospital Service Area Level Within Hospital Referral Regions
The empirical analyses conducted for this study reveal evidence of substantial geographic variation in Medicare spending at the HSA level within HRR regions. As one measure of variability within an HRR, the committee examined the ratio of the highest-Medicare-spending to the lowest-Medicare-spending HSA within each HRR.5 In the 76 HRRs with the highest ratios (those above the 75th percentile), the highest-spending HSA within each HRR spends at least 36 percent more per Medicare beneficiary than the lowest-spending HSA within that HRR. The separate analysis by PHE found that approximately 40 to 70 percent of variation in spending and utilization remained after controlling for HRR characteristics. Collectively, these findings demonstrate considerable variation in spending and utilization that can be explained not by HRR-level factors but by factors at the smaller, HSA geographic level or even below that level, within HSAs.
Spending Variation at the Hospital Level Within Hospital Referral Regions
Hospitals within the same HRR vary substantially in their resource use, as can be seen from the committee’s analysis of Dartmouth data on variation in hospital spending for cohorts of patients treated for three major conditions—stroke, hip fracture, and heart attack.6 This variation among hospitals exists in both lower- and higher-spending HRRs, meaning there are high-spending hospitals in low-spending regions and low-spending hospitals in high-spending regions, as illustrated in Figure S-2.
Spending Variation Within Provider Practices
The committee could not examine variation below the hospital level (i.e., at the provider level) in its analyses of Medicare data because of privacy concerns. However, supplementary analyses of data from Blue Cross Blue Shield of Massachusetts indicate that variation among specialists working in the same group practice is as great as that among specialists across the entire state.
_________________
5This analysis was limited to HRRs with three or more HSAs.
6This analysis was limited to HRRs containing four or more hospitals with data on spending for a given condition.
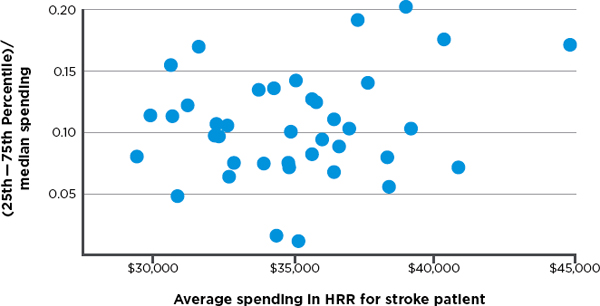
FIGURE S-2 Variation in price- and risk-adjusted Medicare spending for stroke in a hospital referral region.
SOURCE: Committee analysis of unpublished Dartmouth data.
Spending Variation at the Individual Provider Level Across Clinical Conditions
Even individual physician performance varies across different performance measures. A study by Partners Healthcare found substantial variation in utilization and quality of health care services even within a single practice group comprising six primary care physicians. The study analyzed nine distinct quality measures applied to diabetes, cholesterol, and hypertension control; ordering of radiology tests and generic prescriptions; and rates of admissions and emergency department visits. No single physician scored consistently high or low across all measures; instead, each was above average for some and below average for others. These data demonstrate the difficulty of using composite measures to classify individual physicians as high- or low-value providers.
Since providers within a region do not behave similarly, use of a geographic value index would raise a fairness issue, as low-value providers would be rewarded simply for practicing in areas that are on average high-value (the reverse would also be true). As a result, area-level performance calculations would likely mischaracterize the actual value of services delivered by many providers and hospitals, resulting in unfair payments.
Conclusion 3.3. Quality across conditions and treatments varies widely within HRRs; spending and utilization across conditions are moderately correlated within HRRs.
Although claims-based quality measures are sparse in some specialized clinical areas, they are plentiful and robust in others. Because a geographic value index calculates a composite quality score for a region, many providers in an area will be evaluated on measures not applicable to their own practices. Therefore, for a geographic value index to generate fair reimbursement rates, data would at a minimum have to indicate that performance across a wide range of quality measures was relatively consistent within an area.
The Medicare and Harvard analyses found that areas with high scores on some quality measures do not necessarily have high scores on others, particularly if the measures relate to conditions treated by different types of specialists. In the Medicare analyses, pairwise correlations between 18 condition-specific quality indicators showed that approximately 38 percent of quality measure pairs are negatively correlated with each other, 40 percent have correlation coefficients between 0 and 0.19, and only one-fifth have correlation coefficients above 0.20. Collectively, these findings suggest that an area in which providers deliver high-value treatment for one condition may well contain providers who deliver low-value treatment for other conditions. In other words, the findings confirm that provider performance is not homogeneous within an area.
Within an HRR, moreover, spending and utilization measures across conditions are more highly correlated than quality measures. Nonetheless, an HRR that uses many services to treat a given condition (e.g., prostate cancer) does not necessarily use many services to treat another (e.g., low back pain).
Conclusion 3.4. HRR-level quality is not consistently related to spending or utilization in Medicare or the commercial sector.
Use of a geographic value index would require that area-level performance be observable in reliable relationships between health care resource use and health care quality. Thus, assuming that composite measures of health care spending and health outcomes are used to measure value, the case for an area-wide payment adjuster is stronger if a payment change has consistent effects on the quality measures making up the composites.
The committee’s commissioned analyses did not reveal a consistent relationship between condition-specific utilization and condition-specific quality measures in the Medicare population. Positive correlations between utilization and quality measures varied from 0.005 for radiation therapy for breast cancer to 0.085 for disease-modifying antirheumatic drugs dispensed for arthritis (0.085). Negative correlations between utilization and quality measures ranged from .0.012 to -0.048. Similarly, Harvard’s MarketScan
analysis found both positive and negative correlations between spending and quality, depending on the specific measure tested.
In sum, acknowledging the limitations and challenges to interpretation of the quality analyses, overall the committee found no evidence of reliable associations between disease- or condition-specific measures of utilization and disease- or condition-specific measures of quality. Findings from the committee’s commissioned empirical analyses are consistent with those of a recent systematic review by Hussey et al.,7 demonstrating an inconsistent relationship between health care quality and cost. As a result, a geographic value index employing these measures could affect some health outcomes negatively and others positively.
RECOMMENDATION 2: Congress should not adopt a geographically based value index for Medicare. Because geographic units are not where most health care decisions are made, a geographic value index would be a poorly targeted mechanism for encouraging value improvement. Adjusting payments geographically, based on any aggregate or composite measure of spending or quality, would unfairly reward low-value providers in high-value regions and punish high-value providers in low-value regions.
PAYMENT AND ORGANIZATIONAL REFORMS TO IMPROVE VALUE
Those who characterize the U.S. health care system as highly inefficient cite evidence of underuse, overuse, and misuse of medical services throughout the health care delivery system. A number of factors contribute to inefficiency, including information asymmetries, fragmentation in the organization and delivery of health care services, and the widespread prevalence of fee-for-service reimbursement. The statement of task for this study asked the committee to recommend payment reforms that would promote the delivery of high-value care while taking into consideration the ACA and related changes already under way.
The delivery of health care involves myriad decisions by a wide range of decision makers, including solo practitioners, single-specialty group practices, multiple-specialty group practices, hospitals, health care systems, and in some cases community-based multistakeholder collaboratives. The committee’s research illustrates how variation in spending and quality exists in progressively smaller units, down to the hospital, single-specialty group practice, and even individual physician levels, suggesting that opportunities
_________________
7Hussey, P. S., S. Wertheimer, and A. Mehrotra. 2013. The association between health care quality and cost: A systematic review. Annals of Internal Medicine 158(1):27-34.
for value improvement exist at all levels of health care decision making. Depending on the organizational setting and degree of clinical integration, different decision makers have varying abilities to maximize efficiencies and improve value.
RECOMMENDATION 3: To improve value, the Centers for Medicare & Medicaid Services (CMS) should continue to test payment reforms that incentivize the clinical and financial integration of health care delivery systems and thereby encourage their (1) coordination of care among individual providers, (2) real-time sharing of data and tracking of service use and health outcomes, (3) receipt and distribution of provider payments, and (4) assumption of some or all of the risk of managing the care continuum for their populations. Further, CMS should pilot programs that allow beneficiaries to share in the savings due to higher-value care.
To improve value, payment reforms need to create incentives for behavioral change at the locus of care (provider and patient). Therefore, payment should target decision-making units, whether they be at the level of individual providers, hospitals, health care systems, or stakeholder collaboratives. A growing body of evidence leads to the conclusion that clinical and financial integration best positions health care systems to manage the continuum of care for their complex populations efficiently. Clinical integration denotes a minimum level of coordination and alignment of goals among providers (physicians, hospitals, and other practitioners) caring for a population. In clinically integrated environments, providers share clinical data, agree on plans of care, and collaborate to achieve favorable patient-centered outcomes. Hence, at minimum, they must foster care coordination among individual providers, as well as share data and track service use and outcomes to measure progress. Financial integration often hastens clinical integration. Financially integrated health care systems have the capability to receive payments and distribute them to individual care providers. Doing so allows health care systems to align financial incentives among providers within organizations.
However, financial integration is not a unitary goal; historically, financially integrated health care organizations lacking management, infrastructure, and processes for coordinating care (i.e., clinical integration) generally have not succeeded in substantially lowering costs or improving care quality. Clinical and financial integration may in some markets increase provider concentration, enabling providers in those markets to charge commercial carriers higher prices. Antitrust enforcement often raises a difficult trade-off between production efficiencies and market power, and health care is no
exception. Nonetheless, greater value clearly requires greater coordination among providers.
Therefore, payers can promote value through payment and organizational reforms that foster the above elements of clinical and financial integration. In fact, many payment reforms included in the ACA and tested in the commercial market (e.g., value-based purchasing, bundled payment, accountable care organizations, patient-centered medical home models, and dual-eligible care integration demonstrations) do just that. Table S-2 provides a brief description of selected payment reforms. Because these reforms are relatively new, evidence on their influence on value is limited. Early provider reaction has been positive, as reflected in the larger-than-anticipated number of organizations contracting with CMS to join pilot programs. However, the U.S. health care delivery system encompasses a diverse array of provider organizational relationships, which vary in size, level of integration (both clinical and financial), and ability/willingness to assume financial risk. Therefore, it is advisable for CMS to test payment
TABLE S-2
Payment Reforms Included in the Patient Protection and Affordable Care Act
| Payment Reform | Description |
| Value-based purchasing | Under a value-based purchasing program, providers—such as hospitals, medical groups, and nursing homes—receive greater reimbursement if they attain a high level of performance on quality or cost measures or improve their performance on such measures by a sufficient degree. |
| Bundled payment | Under bundled payment, a payer makes a single payment for all services (a bundle) provided during an episode of care. |
| Accountable care organizations (ACOs) | The ACO is a health care delivery and financing model currently being tested by the Centers for Medicare & Medicaid Services (CMS) and commercial insurers. ACO reforms target organized provider organizations and networks that assume responsibility for the quality, cost, and overall care of their patient populations. |
| Patient-centered medical home (PCMH) | The PCMH is a health care delivery model that organizes the care continuum around a practitioner team with the primary care provider at the center, helping patients coordinate care and manage chronic conditions. The PCMH also generally incorporates evidence-based medicine and quality improvement activities. |
| Dual-eligible care integration | CMS has provided grants to allow states to undertake care integration initiatives for dual-eligible populations. One goal of the demonstrations is to determine which care integration and payment models are most effective in improving the quality and efficiency of care for this heterogeneous population. |
models that are compatible with less as well as more clinically integrated providers to see how reforms impact the value of care in different settings.
Finally, patients are also health care decision makers, and can be encouraged through alternative cost-sharing arrangements to share in the savings derived from higher-value care. Introducing value-based cost sharing into a health care system may encourage patients to choose high-value providers and/or higher-value care options. However, increasing cost sharing has been shown to decrease utilization of both effective and ineffective services; thus, more information is needed on how best to tailor a program to encourage the selection of higher-value care options. To this end, CMS could pilot programs aimed at aligning patient cost-sharing arrangements with value.
RECOMMENDATION 4: During the transition to new payment models, the Centers for Medicare & Medicaid Services (CMS) should conduct ongoing evaluations of the impact on value of the reforms included in Recommendation 3 by measuring Medicare spending and beneficiaries’ clinical health outcomes. CMS should use the results of these evaluations to iteratively improve these payment models. CMS should also monitor how these reforms impact Medicare beneficiaries’ access to medical care.
By creating the Center for Medicare and Medicaid Innovation, the ACA generated a thousand pilot demonstrations of value-based payment models. It is too early to know which of these models will prove to control health care costs and improve quality. Evidence supporting the effectiveness of new payment models such as value-based purchasing, patient-centered medical homes, bundled payment, and accountable care organizations in controlling costs and improving health outcomes is limited. Given that these models are still in the early stages of development, however, it is critical that CMS continue to evaluate them and use the results to refine their design.
Further, as reforms transition from pilot demonstrations to broader programs, CMS will need to monitor Medicare beneficiaries’ access to care. Value-based payment reforms are designed to reward efficient providers of care and drive inefficient providers to improve care processes. Some providers/health systems will flourish with these new incentives; others will struggle and may fail. It is also likely that local market factors (e.g., population demographics, provider competition) will influence providers’ abilities to handle new payments, so models suited for some areas will face greater challenges in others. While some disruption to the current system is inevitable and even warranted, it is critical that Medicare beneficiaries’ access to care not be diminished.
RECOMMENDATION 5: If evaluations of specific payment reforms demonstrate increased value, Congress should give the Centers for Medicare & Medicaid Services the flexibility to accelerate the transition from traditional Medicare to new payment models.
Translating new payment models to national policy will be a challenge. If new payment models were mandated before a majority of health care providers had developed the required infrastructure, many organizational failures (e.g., bankruptcies) might result, negatively affecting Medicare beneficiaries’ access to care. Similarly, provider organizations will voluntarily accept new payment models only if they believe payments will cover their investment in the infrastructure required to achieve efficiencies, as well as generate bonuses or shared savings. Particularly in the beginning, therefore, instead of employing a mandatory approach, Congress might direct CMS to accelerate the adoption of payment reforms by authorizing differential payment updates for new payment models and traditional Medicare. It should also be noted that providers serving disproportionately low-income populations may face especially difficult challenges in accessing the necessary resources, and may require additional funding to build the organizational capacity to transition to the new payment models.
Additionally, Congress should give CMS the flexibility to experiment with the mix of payment mechanisms, rates, and performance metrics that will align provider incentives with high-value care. For example, CMS might test a blended payment model for patient-centered medical homes that combines fee-for-service payments, per-member-per-month care coordination fees, and bonuses for meeting quality and efficiency metrics (e.g., generic prescribing, reduced emergency room use, better management of selected chronic conditions). While evaluations are ongoing, CMS should be allowed to alter the levels and payment rates within models to determine those that are most effective.


