
4
CAREER PATTERNS
Upon completion of an advanced degree in a science or engineering discipline, an individual may choose to pursue either direct employment in the technical work force or postdoctoral study. In many institutions, postdoctoral appointees have an ill-defined status, and all too often nobody seems to be responsible for their progress and prospects. At the same time, employment of women scientists and engineers in the United States is not as high as for men. In general, women scientists and engineers are more likely to be underemployed or underutilized than their male counterparts. As noted earlier, they are promoted more slowly. In academe they are more likely to be in the lower faculty ranks and less likely to be tenured. Proportionally fewer women than men are employed in industry, and those few are less likely to attain management positions. Women's salaries are lower within the same rank, even when allowance is made for their being younger. Among the measures that have been found helpful to advancing the careers of women scientists and engineers are (1) the availability of female role models and mentors among the more senior S&E work force and (2) access to support networks. These statements have been well-documented, as will be discussed in this chapter. In summary, we believe a greater understanding is necessary of the unique problems encountered by women as they attempt to establish themselves as practicing scientists or engineers.
Postdoctoral Appointments
Postdoctoral appointments are special because they bridge the gap
between the Ph.D. and employment. A period (1-3 years) of postdoctoral research is regarded as almost a prerequisite for faculty positions in leading research departments in the physical sciences, the life sciences, and certain areas of engineering. As shown in Table 15, the percentage of U.S. citizens planning to accept postdoctoral positions prior to employment increased significantly between 1970 and 1985 but has remained relatively stable during the past five years.
Postdoctoral appointments are typically of two kinds: a true fellowship, often portable and with no duties attached; and a research appointment, which represents an extension of the standard graduate research assistantship position. Postdoctoral appointments are often prestigious and are sometimes viewed as a sort of glorious interlude between the vicissitudes of graduate study and the responsibilities of permanent employment, a period when a young scientist can enlarge and diversify her/his knowledge and capabilities without external pressure. According to Frank Press, president of the National Academy of Sciences,
Any beginning researcher who has not worked closely with an experienced scientist is missing one of the most important aspects of a scientific education. Similarly, any experienced researcher who does not pass on to younger scientists a sense of the methods and norms of science is significantly diminishing his or her contribution to the field's progress (NAS, 1989).
However, some researchers report that is increasingly difficult to find qualified young people to work as postdoctoral fellows, because fewer bright young Ph.D.s are going into science (Simon, 1991). The low compensation for university postdoctoral positions represents a common problem, although salaries for some of the special postdoctoral fellowships
TABLE 15: Postgraduation Plans of Science and Engineering Doctorates (U.S. citizens only), 1985-1989
|
|
With def plans (%) |
Total (N) |
Postdoc (%) |
Empl (%) |
|
1970 |
|
|
|
|
|
Total, S&E |
79.9 |
10765 |
21.4 |
78.6 |
|
Total, Sciences |
80.0 |
8901 |
24.9 |
75.1 |
|
Total, Engng |
79.4 |
1864 |
4.5 |
95.1 |
|
1985 |
|
|
|
|
|
Total, S&E |
72.6 |
8716 |
34.7 |
65.3 |
|
Total, Sciences |
72.2 |
7808 |
37.8 |
62.2 |
|
Total, Engng |
76.4 |
908 |
7.8 |
92.2 |
|
1986 |
|
|
|
|
|
Total, S&E |
74.3 |
8810 |
35.7 |
64.3 |
|
Total, Sciences |
74.2 |
7853 |
38.9 |
61.1 |
|
Total, Engng |
74.6 |
957 |
9.5 |
90.5 |
|
1987 |
|
|
|
|
|
Total, S&E |
73.4 |
8633 |
37.8 |
62.2 |
|
Total, Sciences |
73.4 |
7575 |
41.5 |
58.5 |
|
Total, Engng |
73.6 |
1058 |
11.3 |
88.7 |
|
1988 |
|
|
|
|
|
Total, S&E |
74.7 |
9097 |
38.1 |
61.9 |
|
Total, Sciences |
75.0 |
7888 |
42.3 |
57.7 |
|
Total, Engng |
73.0 |
1209 |
10.6 |
89.4 |
|
1989 |
|
|
|
|
|
Total, S&E |
75.8 |
9070 |
37.0 |
63.0 |
|
Total, Sciences |
76.2 |
7833 |
41.2 |
58.8 |
|
Total, Engng |
73.1 |
1237 |
10.7 |
89.3 |
|
SOURCE: Susan T. Hill, Science and Engineering Doctorates: 1960-89 (NSF 90-320), Washington, D.C.: National Science Foundation, 1990. |
||||
at national and industrial laboratories are nearly competitive with starting salaries in more permanent positions (NSF, 1990b; OSEP, unpublished data). Since the average age at doctorate completion now ranges from about 29 to 32, depending on field (Tuckman et al., 1990), a new science or engineering Ph.D. of either sex is likely to face family responsibilities, so that salary is an important consideration. Although many sponsors have made efforts to keep stipends competitive, financial problems remain. Zumeta (1985) found that the income loss sustained during a postdoctoral appointment was unlikely to be recovered later, relative to a new Ph.D. who entered employment directly.
The National Research Council's 1981 report on Postdoctoral Appointments and Disappointments looked at the issue from a slightly different perspective. It found that married men were less likely than single men to accept postdoctoral appointments, but that the reverse was true for women. This suggests that many men who must support families do not feel that they can sacrifice the additional income of a permanent position. However, women whose mobility is constrained by factors such as marriage and child-rearing may welcome postdoctoral opportunities as opposed to permanent positions, even when prolonged beyond the usual two-year period, as a viable alternative to leaving the profession. It appears that men are less likely to face such a choice. Nonetheless, despite various potential drawbacks, postdoctoral appointments remain a useful option for the increasingly frequent problem of dual-career couples seeking appointments in the same location or institution. This may explain the fact that, in the past, women were about 50 percent more likely to go into and remain in postdoctoral appointments than men.
In the past, there were substantial differences by sex in the rates of
seeking as well as finding postdoctoral appointments, but the most recent data suggest a virtual disappearance of these differences (Coyle, 1986). Hargens (1971) and Reskin (1976) found that postdoctoral fellowships are awarded to men more often and that men had far better career outcomes than women with similar training; but in that study, data from the late 1960s were used and the numbers of women scientists available for study were relatively small. The situation has changed in many respects since then: OSEP doctoral data show that there are now no significant sex differences in the frequency and duration of postdoctoral awards. Fields such as engineering, which have enjoyed high demand for some years, routinely show little or no sex difference in placements. On the other hand, information on the size of stipends is not available, and sex differences may exist there.
Still another issue is whether postdoctoral appointments contribute effectively to the career development of new Ph.D. recipients. Some people question whether completion of a postdoctoral appointment facilitates getting a good starting faculty position, but this is dearly field related. The 1981 NRC study found that many postdocs, ''like planes waiting to land, were stacked in a holding pattern" because there were not enough available jobs. This basic conclusion was confirmed four years later (Zumeta, 1985). As shown in Table 15, the percentage of Ph.D.s having definite plans for employment, versus postdoctoral appointments, has averaged about 60 percent in the sciences and 90 percent in engineering during the 1985-1989 period. This contrasts with the 75 percent and 95 percent reported for science and engineering, respectively, in the 1970-1975 period. Some individuals seek postdoctoral appointments when employment demand is low, which may be the case for the most recent period. However, the market seems not yet to have adjusted, since some research faculty report
that their postdoctoral fellows are having a difficult time in finding employment. As the number of unfilled openings in industry and academe increases, however, the problem of postdoctoral placement in permanent positions should largely disappear.
Employment In A Scientific Or Engineering Field
Current and projected levels of labor force participation indicate that women will continue to make up a significant portion of the U.S. work force. At the same time, women's position in the labor market, when measured by earnings, is relatively disadvantaged compared to men's. The increase in women's economic activity over recent decades, concomitant changes in household and family structure, and women's continued unequal status in the S&E labor force (as will be further documented) can raise crucial questions about many of the assumptions that underlie prevailing employment policies and related policies in such areas as the family and education. These policies, and their implications for both female and male scientists and engineers, need to be studied in light of the recent changes in women's participation in the labor market and in family structure, in order to determine whether they are meeting their aims and even whether their aims are still appropriate. Efforts to do so are already under way in the federal government and in a variety of organizations such as private foundations and women's groups. In fact, many changes in employment policies are beginning to be implemented, but these changes must be monitored.
The problem is not with getting women into S&E careers, but with helping them move up in those careers (Knapp, 1983). In all employment
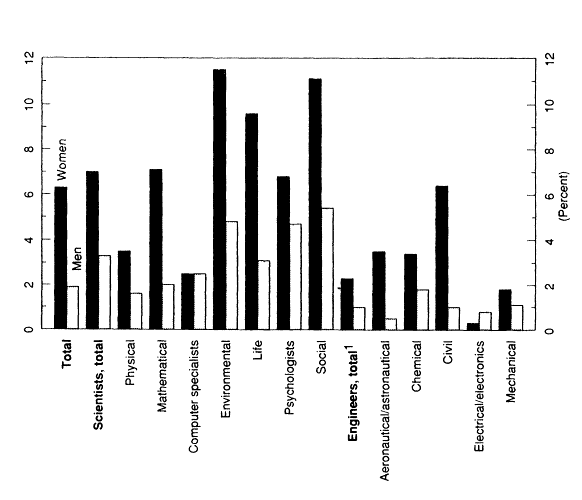
TABLE 16: Reasons Given for Not Being Employed Full-Time by Science and Engineering Doctorate Recipients, 1989
|
|
|
|
Male |
|
Female |
|
|
Reason Employed Part-Time |
Year |
Total |
Number |
Percent* |
Number |
Percent* |
|
TOTAL |
1989 |
21,562 |
12,727 |
59.0 |
9,135 |
41.0 |
|
Prefer Part-Time Employment |
1989 |
8,202 |
5,645 |
44.4 |
2,557 |
28.0 |
|
Full-Time Position Not Available |
1989 |
3,931 |
2,397 |
18.8 |
1,534 |
16.8 |
|
Family Responsibilities |
1989 |
4,058 |
443 |
3.5 |
3,615 |
39.6 |
|
Other |
1989 |
3,287 |
2,592 |
20.4 |
695 |
7.6 |
|
Combined Pref./Family Respons. |
1989 |
409 |
65 |
5.1 |
344 |
3.8 |
|
Combined Full-Time Not Avail./Family Respons. |
1989 |
90 |
0 |
0.0 |
90 |
1.0 |
|
No Report |
1989 |
1,885 |
1,585 |
12.5 |
300 |
3.3 |
sectors, women are promoted more slowly and paid less than comparable men (Vetter, 1989b; NSF, 1990b). Furthermore, over all employment sectors, more than three times as many women as men with S&E degrees are underemployed——defined as working not at all or in part-time positions (Figure 8). In 1986 the underemployment rates for men and women scientists and engineers were 1.9 percent and 6.3 percent, respectively——3.3 percent and 7.0 percent, respectively, in science and 1.0 percent and 2.3 percent, respectively, in engineering (NSF, 1990b).
Interestingly, labor force participation rates vary for women among S&E fields (Thurgood and Weinman, 1990; NSF, 1988). They are especially well utilized, for instance, in electrical/electronics engineering and computer science, which are large employment fields, but less well utilized in aeronautical/astronautical, chemical, civil, and mechanical engineering and in the mathematical, environmental, life, and social sciences. In general, the positions occupied by female scientists and engineers are not those of power and prestige or those that permit them to engage in policy making or consulting the activities that provide the greatest incentives and give the individual the greatest visibility outside his or her own institution (see, for instance, Woodward, 1990). In addition, women more often than men report that they are unemployed or working part-time bemuse of family responsibilities (Table 16).
Academe
Almost two-thirds of the women Ph.D.s on S&E faculties, as compared to about 40 percent of the men, either were not tenured or were
TABLE 17: Tenure Status of All U.S. Doctorate Recipients in Science and Engineering, 1989
|
Tenure Status |
Year |
Total |
Male |
Female |
||
|
|
|
|
Number |
Percent |
Number |
Percent |
|
TOTAL |
1989 |
221,784 |
181,541 |
82.0 |
40,243 |
18.0 |
|
Tenured |
1989 |
121,986 |
107,473 |
88.0 |
14,513 |
12.0 |
|
Year Granted |
|
|
|
|
|
|
|
1949 or earlier |
1989 |
15 |
15 |
100.0 |
0 |
0.0 |
|
1950-1954 |
1989 |
321 |
321 |
100.0 |
0 |
0.0 |
|
1955-1959 |
1989 |
1,733 |
1,673 |
97.0 |
60 |
3.0 |
|
1960-1964 |
1989 |
6,271 |
6,078 |
97.0 |
193 |
3.0 |
|
1965-1969 |
1989 |
14,145 |
13,430 |
95.0 |
715 |
5.0 |
|
1970-1974 |
1989 |
23,398 |
21,510 |
92.0 |
1,888 |
8.0 |
|
1975-1979 |
1989 |
25,298 |
22,530 |
89.1 |
2,768 |
10.9 |
|
1980-1984 |
1989 |
23,784 |
19,861 |
83.5 |
3,923 |
16.5 |
|
1985-1989 |
na |
na |
na |
na |
na |
na |
|
Year Not Reported |
1989 |
3,722 |
3,226 |
86.7 |
496 |
13.3 |
|
Not Tenured |
1989 |
64,131 |
45,645 |
71.2 |
18,486 |
28.8 |
|
Postdoc Appt |
1989 |
11,892 |
8,491 |
71.4 |
3,401 |
28.6 |
|
In Track |
1989 |
33,470 |
24,834 |
74.2 |
8,636 |
25.8 |
|
Not In Track |
1989 |
18,769 |
12,320 |
65.6 |
6,449 |
34.4 |
|
Tenure Not Applicable |
1989 |
16,178 |
11,765 |
72.7 |
4,413 |
27.3 |
|
No Report |
1989 |
19,489 |
16,658 |
85.5 |
2,831 |
14.5 |
|
SOURCE: Office of Scientific and Engineering Personnel, Survey of Doctorate Recipients. |
||||||
holding positions where tenure was not applicable (Table 17). To some extent, these numbers reflect the recent increases in women Ph.D.s in these
fields, though significant differences in rank, income, and tenure status remain after this factor is considered. According to one study, the lack of change within institutional structures has allowed sex inequities in the hiring, promotion, and tenuring of faculty to continue substantially unchanged (ACE, 1988). This is supported by the results of institutional self-assessments such as that recently completed by the Faculty of Arts and Sciences' Standing Committee on the Status of Women at Harvard University:
... while most no longer have to contend with blatant discrimination, aspiring women scientists still face barriers to advancement that their male colleagues do not....
''Many cases don't involve people of ill will, just people doing what they've always done and not realizing that the way in which they operated does shut certain people out," says Barbara J. Grosz, McKay professor of computer science, who chairs the committee.
Such tacit discouragement can involve anything from using "macho" stereotypes when describing research style to assigning traditionally female responsibilities——such as entertaining outside speakers and prospective faculty——to women members of a department.... In some departments, verbal and gender-specific harassment (e.g., discouraging women from pursuing scientific careers simply because they were women) are prevalent even though sexual harassment may not be.... the fewer women a department has to begin with, the harder it is to attract and retain others. With so few women in senior positions, women graduate students and junior faculty often feel lonely and isolated, unable to make the personal connections that successful careers often depend on, or to look to colleagues for support. The solution, says Grosz, is not to hire a few token role models but to achieve "critical mass" for women in every department. "Women need to know that it's a normal thing to be a scientist," she says (Harvard University, 1991).
Source: National Science Foundation, Women and Minorities i Science and Engineering (NSF 88-301), Washington, D.C.: NSF, 1988.
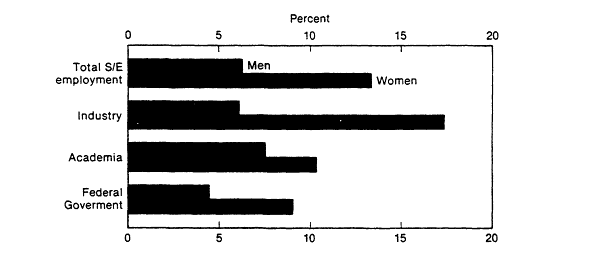
Figure 9. Average annual employment growth, by sector of employment and sex: 1976-1986.
Industry
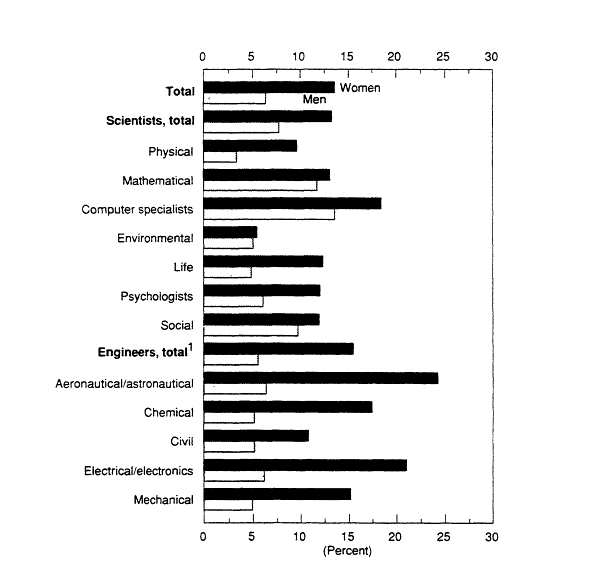
The position of women in industry may be described in similar terms to their position in academe, although their rate of employment in this sector has improved substantially since equal employment opportunity began to be implemented and monitored (Figure 9). In recent years, women's employment in science and engineering showed the greatest gain in the industrial sector (17 percent), with increases above 15 percent in the areas of computer science and engineering (particularly aeronautical/ astronautical, chemical, and electrical/electronics), as shown in Figure 10. By comparison, employment in industry by male scientists and engineers rose only by about 6 percent.
Micro- and macro-inequalities also exist in industry, although not necessarily identical to those in education and academic employment in the sciences and engineering. A blatant example appeared in The Wall Street Journal: when the retiring chairman of a major U.S. company was asked, ''Is there much of an opportunity for women in the steel industry?," his response was,
I can see a day when a lot of the top administrative positions——like treasury, law, accounting and public affairs——could dearly be handled very well with women. It is tougher for us to recruit women into manufacturing jobs. There are fewer engineers who are women. We don't start at 8 and go home at 5. Our manufacturing process goes 24 hours a day, 7 days a week. They're coming to work when it's dark, going home when it's dark. Let's face it, a lot of ladies don't find it too appealing (Schellhardt and Hymowitz, 1989).
The inequalities are usually more subtle. Reskin and Hartmann (1986) described inequities common to the workplace in general:
-
relying on informal referrals ("old boy network') rather than advertising directly to fill vacancies;
-
using that same network rather than standard performance evaluations when considering individual employees for promotions;
-
"precluding spouses from working in the same department of company"
-
linking promotions to one's length of employment;
-
condoning coworkers' remarks and actions "calculated to put [women] in their place by emphasizing their deviant gender status ... [in] occupations that have been defined as male;" and
-
excluding women from "informal networks in which information is shared and alliances develop."
In industry, the existence of such inequities contributes to a "company climate" that is often not as supportive of women employees as it could be.
It is well documented that women are much less likely to attain management positions than men (NRC, 1980; Dipboye, 1987; NSF, 1990b). This could be particularly discouraging for women scientists and engineers in light of NSF projections:
Over the 1988-2000 period, the number of jobs for scientists and engineers in private industry is expected to increase to over 600,000, with three-fifths of these new jobs to be located in the services-producing sector.... Between 1988 and 2000, the occupational composition of industry jobs is expected to change away from production and assembly-line jobs toward professional, managerial, and technical occupations (National Science Board, 1989).
Government
During the 1990 Workshop on Recruitment, Retention, and Utilization of Federal Scientists and Engineers at the National Academy of Sciences, John M. Palguta, deputy director of the U.S. Merit Systems Protection Board (MSPB) Office of Policy and Evaluation, noted that
Efforts to manage the federal work force today must operate in an environment that is significantly different from 20 years ago.... Shifting demographics, the rapidly changing international climate, and the declining image of federal employment all argue for some fundamental shifts in the way federal personnel management is carried out. This may be especially true as the government struggles to recruit, motivate, and retain a large cadre of well-qualified engineers and scientists (Palguta, 1990).
The White House Task Force on Women, Minorities, and the Handicapped in Science and Technology (1989), after studying 236,757 scientists and engineers employed full-time by the federal government in 1987, found that while employment of women and minorities had almost doubled during the previous decade, only 10 percent of the employed S&E Ph.D.s were women and, of that group, only 57 percent (compared to 75 percent of the same cohort of white males) earned $50,000 or more a year.
Data acquired by the Commission on Professionals in Science and Technology (Vetter, 1991) show that the participation of women scientists and engineers in the federal work force varies by occupational title from a low of 3.0 percent in agronomy, 3.8 percent in mining engineering, and 4.8 percent in metallurgy to highs of 50.5 percent in sociology, 44.1 percent in social science, and 41.6 percent in botany. Racial/ethnic minorities comprised 14.6 percent of the 263,892 federal S&E employees on September 30, 1990. The greatest numbers of minority women were found in chemistry, social science, general engineering, and general biological science. Minority women were least represented in ceramic engineering (3.0 percent), the biological science fields of ecology (3.5 percent) and botany (5.6 percent), sociology (3.9 percent), and the physical sciences of astronomy/space science (4.5 percent) and hydrology (5.4 percent). Furthermore, it was recently determined that only 5 of the 66 top government positions in science are held by women:
-
Administrator, National Telecommunications and Information Administration;
-
Surgeon General, Public Health Service;
-
Commissioner, Bureau of Labor Statistics;
-
Chairman, Consumer Products Safety Commission; and
-
Administrator for Pesticides and Toxic Substances, Environmental Protection Agency (Clemmit, 1990).
Though their numbers are small, one would expect federally employed women scientists and engineers to earn salaries equivalent to those of their male counterparts. However,
In federal employment, women earn only 65 percent of male wages.... When jobs are compared based on skill, responsibility, effort, and working conditions, pay for female jobs [the author hopes that this is defined as those jobs in which women arc actually employed, as opposed to those traditionally "assigned" to women] falls far short (AFL-CIO, 1990).
This confirms earlier reports that, in general, women employed by federal agencies earn only 79.2 percent of the average salary earned by males in chemistry, 78.7 percent in microbiology, and 73.9 percent in civil engineering (Babco, 1985, in Vetter, 1987).
The White House Task Force (1988) had recommended that the government tackle the potential problem of an inadequate S&E work force head-on by:.
-
using federal R&D programs to effect "a more diverse, world-class science and engineering work force;"
-
collecting and maintaining data in order to evaluate the participation of women, minorities, and disabled persons in those programs;
-
hiring and promoting scientists and engineers who are members of underparticipating groups; and
-
providing dependent care services to all employees.
One of the government's first responses was examination by the Federal Coordinating Council on Science, Engineering, and Technology (FCCSET) of the issue of underparticipating groups. FCCSET's Committee on Education and Human Resources has determined that federal agencies should allocate funds designed specifically to retain women, minorities, and the disabled within the science education pipeline.
Priority Issues
Perhaps the most critical issue confronting the U.S. economy today is the diversification of the work force. Opportunities are growing for women in a wide variety of R&D and S&E positions. CWSE has therefore given high priority to developing a program of activities that will facilitate positive changes in this area. Among the issues that the Committee has determined to be priorities are the following:
-
Postdoctoral appointments——
-
Are there currently differences in the postdoctoral appointments of men and women with regard to (1) size of stipend, (2) numbers of years in postdoctoral status, and (3) opportunities to work with first-class researchers in their field?
-
-
Employment policies——
-
CWSE will seek to integrate current efforts to examine critically employment policies. Are the politics still appropriate in light of recent changes in the number of women working and in family structure? Results of such efforts will be disseminated.
-
CWSE will collect and disseminate information about the
-
-
many changes that are already taking place in employment policies——for example, employer-sponsored women's support groups, employer-sponsored women's councils designed to suggest improvements in working conditions for women, changes in nepotism rules, availability of choice of benefits (cafeteria-style benefits), changes in maternity and adoption leave policies, employer-provided or sponsored dependent care, prorated benefits for part-time employees, changing tenure and promotion policies to reflect women's extra family responsibilities, and extended possibilities for part-time and flex-time employment.
-
CWSE will also undertake inquiries into less well studied areas of employment policy relevant to women in order to highlight major issues, develop research agendas, and suggest possible courses of action and their probable implications.
-
Broader issues——
-
barriers to the advancement of women scientists and engineers (the "glass ceiling");
-
reasons women scientists and engineers are less represented in industry than are men;
-
the importance of mentoring and role models;
-
retention patterns for women; and
-
particular problems in the work environment for women at the bachelor's and master's levels.
-
The Committee on Women in Science and Engineering would seek to integrate these efforts and to underscore the importance of the issues involved to policy makers and academic researchers.


