Page 19
1
What Is the Problem?
Natural Atmospheric Ozone
Ozone (O3) is a reactive oxidant gas produced naturally in trace amounts in the earth's atmosphere. The ozone molecule is composed of three oxygen atoms, in contrast to normal molecular oxygen (O2), which makes up roughly 21% of our air. Ozone forms when an atom of oxygen, O, usually produced in the troposphere by solar photodissociation of nitrogen dioxide (NO2), combines with molecular oxygen to form ozone. Ozone was discovered by C.F. Schönbein in the middle of the last century; he also was first to detect ozone in air (Schönbein, 1840; 1854).
Most of the earth's atmospheric ozone is found in the stratosphere—the portion of the atmosphere between about 10 and 50 kilometers (kin) altitude—where it plays a critical role in absorbing ultraviolet radiation emitted by the sun. A plot of ozone partial pressures and atmospheric mixing ratios as a function of altitude is shown in Figure 1-1 for a typical latitude profile (AFGL, 1985). The bulge shown in Figure 1-1, the stratospheric ozone layer, peaks in ozone concentration (partial pressure) at 20-30 km and prevents most solar radiation in the wavelength range of 200-300 nanometers (nm) from reaching the lower atmosphere and the earth's surface, where it would damage plant and animal life. Any significant weakening of the stratospheric ozone layer is predicted to lead to greatly increased instances of skin cancer in humans (NRC, 1982, 1984).
The lowest part of the atmosphere is called the troposphere; it begins at the earth's surface and extends upward to about 10 kin, cooling with altitude
Page 20
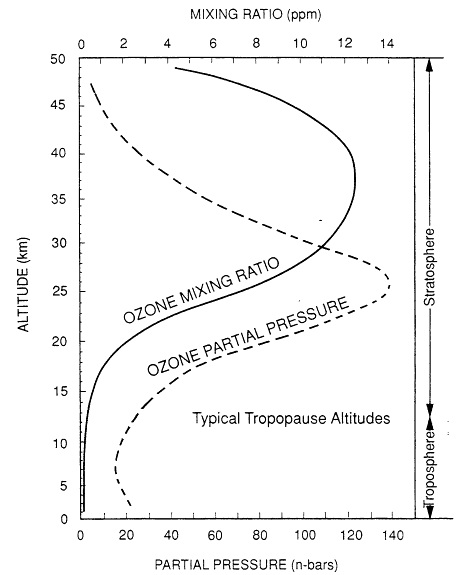
Figure 1-1
Typical global annual mean vertical ozone distribution. Source: Adapted from AFGL, 1985.
Page 21
at the rate of 6-8 kelvins (K) per kin. The stratosphere is much colder (mid-latitude temperatures are typically 210-270K [-82—26ºF]) and much lower in pressure (typically 0.25-0.0005 atmospheres) than the troposphere. The juncture of the troposphere and the stratosphere is called the tropopause, the upper limit of turbulent mixing for atmospheric gases. The tropopause is typically the coldest part of the lower atmosphere, and at midlatitudes, it is 10-14 km in altitude, as shown in Figure 1-1. The tropopause can be as low as 8 km at high latitudes, near the poles, and as high as 18 km in the tropics. The region above the tropopause is very stable and impedes the exchange of chemical species between the troposphere and stratosphere.
A much smaller portion of naturally occurring ozone is found in the troposphere. The data plotted in Figure 1-1 show that natural concentrations of tropospheric ozone are very small—usually a few tens of parts per billion (ppb) in mixing ratio1 (molecules of O3/molecules of air; 10 ppb = 2.5 × 10¹¹ molecules/cm3 at sea level and 298 K) compared with more than 10,000 ppb (10 parts per million (ppm)) typically found at peak stratospheric mixing ratios. However, the atmosphere thins out exponentially with altitude, which is why the peak in ozone mixing ratio occurs at a higher altitude than does its peak in partial pressure (concentration), as shown in Figure 1-1. Nevertheless, a significant amount of naturally occurring ozone, about 10-15% of the atmospheric total, is found in the troposphere (Chatfield and Harrison, 1977; Fish-man et al., 1990). Ozone was first accurately measured in the lower atmosphere by Strutt (1918), who used its ability to absorb ultraviolet light to quantify ozone at ground level over long atmospheric paths.
For the discussions presented in this report it is important to remember that ozone is truly a trace atmospheric species; if the entire atmospheric ozone volume, as plotted in Figure 1-1, were collapsed to a pressure of one atmosphere, it would form a layer only ![]() millimeters (mm) thick. Therefore, it is not surprising that naturally or anthropogenically induced changes in trace chemical emissions might cause changes in atmospheric chemistry which, in turn, could have a significant effect on atmospheric ozone concentrations.
millimeters (mm) thick. Therefore, it is not surprising that naturally or anthropogenically induced changes in trace chemical emissions might cause changes in atmospheric chemistry which, in turn, could have a significant effect on atmospheric ozone concentrations.
Changes in Stratospheric Ozone
Over the past 2 decades, our improved ability to monitor atmospheric
1Mixing ratios are reported on a volume basis in this report. The units of the mixing ratio will not show the volume designation (ppb instead of ppbv). "Concentration" is used throughout the report as a synonym for "mixing ratio," although in strict usage, "mixing ratio" is the correct term.
Page 22
ozone with ground-sited, aircraft-mounted, and satellite-borne instruments has led to several concerns about changes in the amounts of ozone found in the atmosphere. One highly publicized issue has been the catalytic destruction of significant portions of the stratospheric ozone layer, most dramatically seen each spring in the Antarctic ozone hole, which is the result of stratospheric halogen-induced photochemistry due largely to the decomposition of anthropogenic halocarbon compounds in the stratosphere (WMO, 1986, 1988, 1990). The current and projected loss of stratospheric ozone has stimulated a major, continuing global research program in stratospheric chemistry and an international treaty that restricts the release of chlorofluorocarbons into the atmosphere.
Changes in Tropospheric Ozone
This report is concerned with the problem of elevated tropospheric ozone concentrations, particularly in densely populated urban and suburban areas. Such elevated ozone causes damage to exposed people, plants, and animals. The scientific community has strong reason to believe that concentrations of tropospheric ozone generally are increasing over large regions of the country—extending over the northern midlatitudes. During the past decade, an increase of approximately 10% (1%/year) in ozone throughout the height of the troposphere has been demonstrated over Europe (WMO, 1986, 1990). If stratospheric ozone concentrations remained constant, the 10% increase in tropospheric ozone would increase the total column abundance of ozone by about 1%.
However, stratospheric ozone concentrations are declining, and increasing amounts of ultraviolet solar radiation are leaking through a thinning stratospheric ozone layer. An average decrease of 5% in the total column abundance of ozone at 50º N has been observed over the past decade (Stolarski et al., 1991). Thus, the additional tropospheric ozone is believed to have counteracted only a small fraction of the stratospheric loss, even if the trends observed over Europe are representative of the entire northern midlatitude region.
The build-up in tropospheric ozone has broad implications for atmospheric chemistry. Ozone and associated atmospheric oxidants play a significant role in controlling the chemical lifetimes and reaction products of many atmospheric species and also influence organic aerosol formation. In addition, tropospheric ozone is a greenhouse gas that traps radiation emitted by the earth and an increase in tropospheric ozone might contribute to a warming of the earth's surface.
Page 23
Some of the evidence for increased baseline levels of tropospheric ozone comes from Europe, where during the late 1800s there was much interest in atmospheric ozone. Because ozone was known to be a disinfectant, it was believed to promote health (Warneck, 1988). Measurements of atmospheric ozone made at Montsouris, near Paris, from 1876 to 1910 have been reanalyzed by Volz and Kley (1988), who recalibrated the original measurement technique. Their analysis showed that surface ozone concentrations near Paris 100 years ago averaged about 10 ppb; current concentrations in the most unpolluted parts of Europe average between 20 and 45 ppb (Volz and Kley, 1988; Janach, 1989). An analysis of ozone measurements made in relatively remote European sites indicates a 1-2% annual increase in average concentrations over the past 30 years (Janach, 1989).
The presence of tropospheric ozone is generally attributed to a combination of its in situ photochemical production and destruction coupled with regular incursions of ozone-rich stratospheric air (Logan, 1985). Worldwide expansions in agriculture, transportation, and industry are producing a growing burden of waste gases, most particularly oxides of nitrogen (especially NO and NO2, designated as NOx) and volatile organic compounds (including hydrocarbon and oxyhydrocarbon compounds, designated as VOCs), which enter the atmosphere and exacerbate the photochemical production of ozone. Computer models have been used to extrapolate the response of tropospheric ozone production as a function of atmospheric concentrations of VOCs and NOx, both backward and forward in time; these models estimate the low concentrations of tropospheric ozone of the past century and forecast increasing concentrations for the future, unless projected emissions of precursor trace gases are curbed (Hough and Derwent, 1990; Thompson et al., 1990).
The most critical aspect of the tropospheric ozone problem is its formation in and downwind of large urban areas, where, under certain meteorological conditions, emissions of NOx and VOCs can result in ozone concentrations as high as 200-400 ppb. Such production of ozone and related oxidant species is called photochemical air pollution; it was first recognized in the Los Angeles basin in the 1940s, when vegetable crops began to show damage. Work in the 1950s by Haagen-Smit and co-workers established the photochemical nature of the agents that were causing plant damage. This work elucidated the key roles of NOx and VOCs in ozone formation (Haagen-Smit et al., 1951, 1953; Haagen-Smit, 1952; Haagen-Smit and Fox, 1954, 1955, 1956). By 1961 the topic was well enough established to be presented comprehensively in a classic monograph by Leighton (1961).
Page 24
Understanding Tropospheric Ozone And Photochemical Air Pollution
By the. 1960s, major anthropogenic sources of VOCs that react in the atmosphere had been identified: motor vehicle exhaust, emissions from the commercial and industrial use of solvents, and fugitive emissions from the chemical and petroleum industries. Most of the original research was directed toward clarifying the nature of the problem using the Los Angeles basin as the classic example. Motor vehicle exhausts and stationary combustion system exhausts were identified as important NOx sources (OTA, 1989). Oxides of nitrogen are emitted into the atmosphere as nitric oxide (NO) and nitrogen dioxide (NO2) and cycled within the atmosphere through nitrate radical (NO3), organic nitrates, and dinitrogen pentoxide (N2O5), eventually forming nitric acid (HNO3); the sum of these atmospheric oxides of nitrogen is often designated as NOy. There is now a heightened appreciation of the importance of biogenic VOC emissions, whose reaction products react with NOx from anthropogenic and natural sources for regional and urban ozone production (Trainer et al., 1987; Chameides et al., 1988; Cardelino and Chameides, 1990).
Research throughout the 1960s, 1970s, and 1980s focused on several critical aspects of photochemical air pollution (Finlayson-Pitts and Pitts, 1977, 1986; Seinfeld, 1986, 1989) including: a detailed elucidation of photochemical mechanisms and rates (Hough, 1988; Dodge, 1989); the development of monitoring networks and measurement of ozone in urban centers; the measurement of ozone in suburban and rural settings (after the findings in Glens Falls, New York, by Stasiuk and Coffey [1974]), where ozone was observed in a relatively isolated rural community at concentrations similar to those observed in New York City); transport experiments for distances beyond 100 km; the creation of photochemical and transport models to predict the evolution of air pollution episodes (Seinfeld, 1988); and the development of field measurement techniques for monitoring photochemical reactants, intermediates, and products to test results from models.
The atmospheric chemistry of tropospheric ozone formation is complex and is presented, in detail, in Chapter 5 of this report. Briefly, reactive VOCs, represented as RH, react with hydroxyl radicals (OH) to form organic radicals (R):
![]()
Page 25
(Additional reactions of some RH species with ozone and the nitrate radical, NO3, also could be significant.) Organic radicals combine with molecular oxygen to form peroxy radicals (RO2), a process that usually requires an inert third body, M (e.g., N2 or O2):
![]()
Peroxy radicals react with nitric oxide (NO) to form nitrogen dioxide (NO2):
![]()
Nitrogen dioxide is photodissociated by solar radiation to release ground state oxygen atoms, O(3P), and reform nitric oxide:
![]()
Energy from solar radiation is represented by hv, the product of Planck's constant, h, and the frequency, v, of the electromagnetic wave of solar radiation. Finally, oxygen atoms combine with molecular oxygen, in the presence of a third body, to form ozone:
![]()
The process is a chain reaction: Ozone is photodissociated by near-ultraviolet solar radiation to form an excited oxygen atom, O(1D):
Page 26
![]()
which, in turn, can react with water vapor (H2O) to form two OH radicals:
![]()
The resulting OH radicals drive the chain process. Furthermore, reactions initiated by the RO radicals formed in Reaction 1.3 can, in the presence of NO, lead to further production of OH. With enough VOCs and NOx in the atmosphere, the chain reactions represented above can, in the presence of sunlight, lead to unhealthful concentrations of tropospheric ozone.
Because of the importance of precursors in ozone photochemistry, a comprehensive understanding of tropospheric ozone chemistry also requires knowledge of the atmospheric sources and sinks of VOCs and NOx. The sources include VOC emissions from vegetation, industrial and commercial facilities, and motor vehicles and NOx emissions from motor vehicles, power plants, industrial facilities, and to a lesser degree, biomass burning, soil, and lightning. Sinks include dry deposition of VOCs and NOy to vegetation, land, and water surfaces and wet (cloud, fog, and rain droplet) scavenging of oxygenated VOCs and NOy. Heterogeneous chemical transformations of precursors, which occur on aerosol particles and m clouds and fogs, are also important. The resulting chemical products can reenter the gas phase as cloud droplets evaporate, or can be deposited to the ground in precipitation. Figure 1-2 diagrams relevant photochemical and transport processes.
Understanding the ways in which ozone is formed, accumulates, and moves though space and time requires a conceptual framework. The basic processes of atmospheric chemistry that lead to ozone formation, the effects of local emissions of precursor compounds on the processes, and the transport of ozone and other species (precursors, radicals, and products) can be described using the hypothesis that there are different types of canonical regions where elevated concentrations of tropospheric ozone or its precursors can be found within the United States. Such canonical regions can be identified for a specific part of the country by determining the ambient concentrations of VOCs and NOx and how their reactivity affects ozone formation. However, the extent of ozone reduction depends on the effectiveness of strategies to control the VOCs and NOx both within a region and in regions which are upwind sources of ozone. These canonical regions are important to recognize and
Page 27
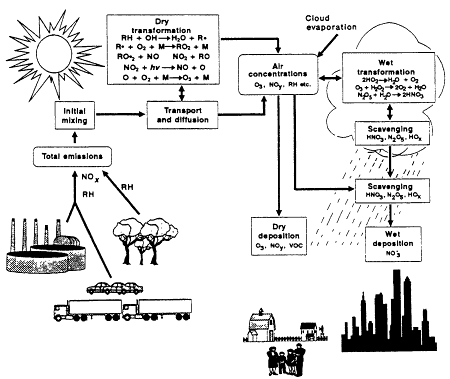
Figure 1-2
Photochemical air pollution, from emission to deposition.
evaluate because, as the relationships between source emissions and their atmospheric chemistry are better understood, certain consistencies in those relationships can provide opportunities for tailoring ozone precursor control strategies to specific cities or canonical regions.
Five types of canonical regions of ozone accumulation are relevant to the discussion in this report (see Figure 1-3). A brief discussion of each is presented below:
Central Urban Core.
These areas generally contain major and minor point sources and area sources of ozone precursors. In many instances there are low VOC/NOx ratios that lead to depressed ozone concentrations within the central core. These regions often include the densely populated residential or commercial sectors of large metropolitan areas.
Urban Perimeter.
The urban perimeter is marked by major transportation arteries that move people to and from the central urban core. There are
Page 28
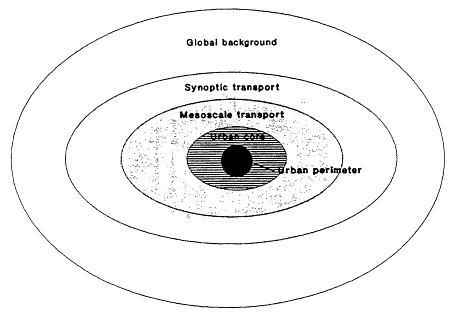
Figure 1-3
Conceptual canonical regions for evaluating tropospheric ozone formation and control.
lower population densities, but the people living in these areas rely heavily on motor vehicles for most personal and business transportation. Major point sources of precursors can be present. The perimeter would be considered the first region to receive ozone produced from precursor-laden air that is photolyzed as it moves away from the central core.
Mesoscale Transport Region.
This is a much more diverse kind of area affected by ozone. It is defined by major geographical and topographical boundaries, specific precursor sources, and specific meteorological conditions. A mesoscale transport region could include a valley, a corridor of urban areas, an ocean shoreline, forests or large parks, agricultural land, and isolated major point sources, such as power stations and factories. The definition of boundaries is difficult, but these regions must be considered because the ozone present in a specific location can either influence or be affected by other canonical regions. Sustained patterns in the chemistry and meteorology of the region might affect the ozone concentration in such areas for several days.
Synoptic-Scale Transport Region.
Processes associated with large-scale weather systems control the characteristics and intensity of ozone chemistry
Page 29
and transport in this kind of region. Such weather processes include frontal activity, subsidence, and the anticyclonic and cyclonic flows associated with high- and low-pressure systems, respectively. As discussed in Chapter 4, high-pressure systems allow ozone to accumulate, and storms associated with low-pressure systems can disperse or scavenge ozone within a radius of approximately 400 kin. The occurrence and duration of such weather systems provide the basis for each photochemical smog episode.
Background.
The tropospheric ozone concentrations in specific regions of the globe are affected by several processes, including methane and carbon monoxide oxidation, movement of ozone from the stratosphere, and other persistent natural activities that produce or scavenge ozone. The apparent rate of increase in continental background ozone concentrations of 1-2% each year will not help ozone reduction efforts in urban areas.
Each description of a canonical region includes the geographic and land-use characteristics that can contribute to severe episodes of ozone pollution. Because the sources of precursors are not uniform, each area must be examined to determine the most important contributors to high concentrations of ozone. The canonical regions framework does not provide a rigid format for examining tropospheric ozone, but it does provide necessary building blocks to elucidate both the situations described throughout this report and areas that could be affected by increased ozone concentrations in the future.
Ozone And Air-Quality Regulations
The high concentrations of ozone, coupled with lesser, but still serious, concentrations of other smog products, including NO2, nitrate radical (NO3), N2O5, peroxyacetyl nitrate (PAN), and nitric acid (HNO3), created during serious urban and regional photochemical pollution episodes, pose significant threats to human health. Accordingly, ozone has been identified in the Clean Air Act as a common and widespread air pollutant. In 1971, as required by the Clean Air Act, the U.S. Environmental Protection Agency (EPA) established primary (human health) and secondary (welfare) national ambient air-quality standards (NAAQS) for oxidants. Oxidants (e.g., hydrogen peroxide (H2O2)) are defined as those compounds giving a positive response using the iodide oxidation technique. For the primary standard the concentration of oxidants not to be exceeded was 80 ppb for any 1-hour period in a year. In 1978, the standard was changed to a standard for ozone—an indicator for all oxidants—and the concentration limit was raised to 120 ppb for any 1-hour period, which was not to be exceeded more than once each year. This relax-
Page 30
ation of the primary standard temporarily reduced the number of regions that were out of compliance, without necessarily improving air quality. The secondary standard for welfare effects was also changed in 1978; it is identical to the primary standard.
An area is said to be in attainment of the ozone NAAQS if the expected number of days per year with a maximum 1-hour average concentration of ozone exceeding 120 ppb is less than or equal to one. The expected number of days per year with ozone concentrations above 120 ppb is calculated by averaging over 3 years of monitoring data. Thus, any area with 4 or more days having 1-hour ozone concentrations above 120 ppb during 1987 through 1989 would exceed the NAAQS in 1989, regardless of when those 4 days occurred during the 3-year period.
The Clean Air Science Advisory Committee (CASAC) of the EPA Science Advisory Board has recommended to the EPA administrator that the 1-hour averaging time for the ozone NAAQS be retained and that the maximum allowed concentration be set between 80 and 120 ppb. However, there is significant support in the scientific community and the CASAC for EPA to continue research on the criteria for two primary (health-based) standards: an acute-exposure standard and a chronic-exposure standard—both with averaging times of more than 1 hour. The Committee on Tropospheric Ozone Formation and Measurement has recognized the legal requirement to meet the current NAAQS, but its members also are aware that different standards could be adopted or at least considered that would achieve the same end, and that careful consideration is required of the types of precursor control strategies necessary to achieve different standards.
The Clean Air Act states that the responsibility for attaining the NAAQS is to be borne by a federal-state partnership. EPA develops the NAAQS, and the states formulate and enforce cleanup strategies to bring each nonattaining area into compliance. Some states, notably California, set stricter emission and air-quality standards for ozone than those mandated nationally.
National Trends in Ozone
Two indicators that current practices do not achieve their goals in controlling the production of ozone are the number of areas that exceed the NAAQS and the frequency and magnitude of high concentrations in each location. EPA has summarized the trends in second-highest daily maximum ozone concentrations from 1978 through 1989. (See Chapters 2 and 3 for a description of the methods used to determine and track compliance with the ozone NAAQS.) EPA (1991a) has reported a trend toward lower concentrations for
Page 31
the period from 1980 through 1989, with what have been described as anomalous years in 1983 and 1988. Bemuse the trend analysis covers only a 10-year period, however, the increases in 1983 and 1988 cannot be considered true anomalies.
The number of areas not meeting the NAAQS from 1982 through 1989 is shown in Table 1-1. The table is based on an analysis using consistent area boundaries. In 1988, the number of areas not meeting the NAAQS jumped to 101 from 63 the year before. Photochemical pollution conditions in 1988 were extensive enough to cause violations in locations where the NAAQS had not been exceeded in the past. EPA reported that, in 1990, based on revised designations of area boundaries, 98 areas were not in attainment of the NAAQS (EPA/OAQPS, 1991).
The trends in various sections of the country have not necessarily been the same. For example, in Figure 1-4 it is apparent that the 26 sites in the Los Angeles basin have shown a consistent, although slight, downward trend. The two sites in Atlanta and 11 sites in the Washington, D.C., metropolitan area show an upward trend since 1985. For the metropolitan New York-New Jersey area, the number of ozone excursions above the NAAQS increased substantially in 1988 because of the summer heat wave. In contrast, in 1989 the number of days on which maximum 1-hour ozone concentrations were above 120 ppb fell to a low for the decade.
Although generally reliable data on urban ozone concentrations have been collected, corollary data on ozone precursors (VOCs and NOx) are not generally available. Thus, we do not know whether the factors that suggest increased precursor emissions, such as higher population density, automobile use, and industrial activity, have been successfully offset by emission controls. We know when ozone concentrations go up or down, but not necessarily why.
Detrimental Effects of Ozone
Although the harm caused by tropospheric ozone to humans, animals, and plants is not a focus of this report, a brief summary of the current understanding of its effects on human health and plant viability is presented below to put the tropospheric ozone problem into perspective.
Health Effects of Atmospheric Ozone
Concentrations of ozone above and below the maximum allowed NAAQS concentration of 120 ppb have been shown to be associated with transient
Page 32
| TABLE 1-1 | |
| Year | Number of areasc |
| 1982 | 96 |
| 1983 | 90 |
| 1984 | 84 |
| 1985 | 77 |
| 1986 | 64 |
| 1987 | 63 |
| 1988 | 101 |
| 1989 | 96 |
| aThe number of areas not meeting the NAAQS in a given year is determined by averaging over three years of monitoring data. For example, the determination of the number of areas not meeting the NAAQS in 1989 is based on monitoring data from 1987, 1988, and 1989. | |
| bThe monitoring network for ozone has expanded significantly during the past 10 years. According to EPA, the estimates of the number of areas not meeting the ozone NAAQS for 1985 and earlier have not been subject to the same level of quality assurance and monitoring network review as the estimates for more recent years. | |
| cAreas, whose boundaries are designated by EPA, have consisted of Metropolitan Statistical Areas (MSAs), Consolidated Metropolitan Statistical Areas (CMSAs), and counties. The table is based on an analysis using consistent area boundaries (W. Freas, pets. comm., EPA, November 1991). Boundary designations were changed in 1991 (56 Federal Register 56694). Based on these new designations, 98 areas did not meet the NAAQS in 1990 (EPA/OAQPS, 1991). | |
| Source: EPA, Aerometric Information Retrieval System, 1987, 1991. | |
effects on the human respiratory system. Of those documented, the most significant are the dose-response relationships established for decrements in pulmonary function of individuals while they participate in light to heavy exercise. The more important findings from human studies were summarized
Page 33
in a review by Lippmann (1989). The review discussed field health studies that showed equivalent or greater decrements in pulmonary function per exposure concentration of ozone than were observed in the control population. Possible reasons are the longer durations of exposure and the increased effect of ozone due to the presence of other pollutants in smog-laden ambient air. Each reason should be considered in examining current modeling results and measurement data when defining the transport and transformation processes that can place populations at risk to health damage induced by high concentrations of ozone.
For the entire suite of human experiments, acute effects have been observed after exposure that lasted from less than I hour up to several days and at concentrations above and below 120 ppb. Changes have occurred in functional lung capacity, lung flow rate, epithelial permeability, and reactivity to bronchial challenges. In some cases, the effects persisted for many hours or days after exposure during exercise stopped.
Chronic effects that have resulted from recurrent seasonal exposure to ozone have been studied only to a limited degree. Most of the current evidence is derived from animal responses to chronic ozone exposures. The most revealing evidence to date is from chronic toxicologic studies in rats and monkeys at exposures of ˜1,000 ppb that showed persistent functional and morphologic changes in the gas exchange region (terminal bronchioles and alveoli) of the lung. These changes must be studied further, but they suggest that the scientific research community must formulate measurement and modeling approaches that can be used in conjunction with health indices to detect or predict annual increments of improvement or degradation of human health.
Human Exposure Issues
The occurrence of ozone concentrations that exceed 120 ppb in various regions of the United States indicates that many people could be exposed to potentially harmful concentrations of ozone. Although the daily maximum concentration usually occurs between 12 noon and 5 p.m. in most central or downtown urban settings, areas downwind of those settings have experienced occasional excursions above 120 ppb, and these can occur well into the evening. This is illustrated for a multiday episode of high concentrations of ozone in an isolated small city, Montague, Massachusetts, that was affected by transported ozone (Figure 1-5).
EPA estimated that about 67 million people lived in areas with second-highest daily maximum 1-hour ozone concentrations above 120 ppb in 1989
Page 34
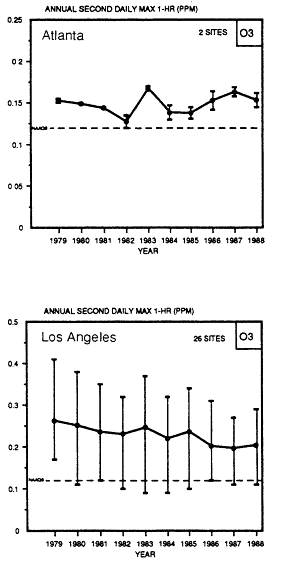
Figure 1-4
Trends in the annual second-highest daily maximum 1-hour
concentration of ozone in Atlanta, Los Angeles, and Washington,
D.C., metropolitan areas (Source: EPA, 1990a).
(EPA, 1991a). Using the National Exposure Model (NEM), EPA has estimated that 13 million moderately exercising adults are at risk from exposure to ozone in excess of 120 ppb for at least 1 hour per week during the summer (Paul et al., 1987). Because ozone gradually builds and decreases over the course of the day in urban and nonurban areas, varying degrees of population
Page 35
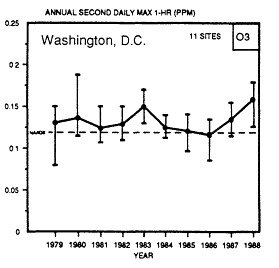
Figure 1-4
(continued)
exposure are associated with the 1-hour maximum. In addition, there are multiple opportunities for individuals to be exposed to a 1-hour value above 120 ppb (Figure 1-6). This fact alone is enough to warrant concern, but as shown in the brief summary on the potential human health effects of ozone, concerns have been raised about public health risks due to exposures to ozone concentrations that are in compliance with the NAAQS.
Lioy and Dyba (1989) and Berglund et al. (1988) have demonstrated that there are places in the United States, especially in the Northeast, where at times the NAAQS of 120 ppb for 1 hour is not violated, but the workplace

Figure 1-5
Three-day sequence of hourly ozone concentration at Montague, Massachusetts.
Sulfate Regional Experiment (SURE) station showing locally generated midday peaks
and transported late peaks. Source: Martinez and Singh, 1979.
Page 36
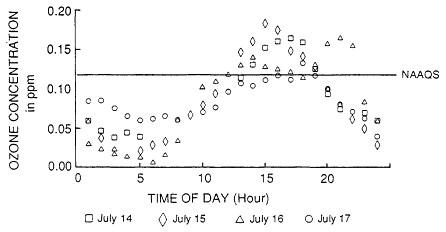
Figure 1-6
The diurnal variation in ozone concentration during the summer 1982 ozone
episode at Mendham, New Jersey, associated with the health effects study
conducted by Lioy et al., 1985. (Source: Lioy and Dyba, 1989).
permissible exposure limit (PEL) of 100 ppb for 8 hours is exceeded in outdoor air. Their analyses indicated that in 25% of the cases where the PEL was violated, the NAAQS was not violated. Controlled human studies and field health studies have indicated that the potential for producing transitory pulmonary effects is greater than originally projected and have indicated the need to consider a demonstration period longer than 1 hour for exposure to ozone.
The discussion of ozone's effects must also consider the relative importance of indoor ozone concentrations and the potential duration of exposure. Total exposure to ozone is made up of contact in the indoor and outdoor environments. It must be remembered, however, that a single hour or several hours of exposure to ozone in the outdoor environment is sufficient to cause respiratory effects. Indoor exposures are important for many of the other five criteria pollutants listed in the Clean Air Act and for toxic air pollutants, but generally not for ozone. Therefore concern for possible effects will remain associated with outdoor air. The areas of greatest concern will be open spac-
Page 37
es within the urban, suburban, and rural regions in and around the major metropolitan areas of the United States.
Effects on Vegetation
Elevated ozone exposures affect agricultural crops (Heck et al., 1982; EPA, 1986a) and trees (EPA, 1986a). Short-term, high-concentration exposures are identified by many researchers as being more important than long-term, low-concentration exposures (Heck et al., 1966; Heck and Tingey, 1971; Bicak, 1978; Henderson and Reinert, 1979; Nouchi and Aoki, 1979; Reinert and Nelson, 1979; Bennett, 1979; Stan et al, 1981; Musselman et al., 1983, 1986; Ashmore, 1984; Amiro et al., 1984; Tonneijck, 1984; Hogsett et al., 1985a). Although little is known about the ozone distribution patterns that affect trees, support for the hypothesis that peak concentrations are an important factor in determining the effects of ozone on trees comes from the work of Hayes and Skelly (1977), who reported injury to white pine in rural Virginia, and from Mann et al. (1980), who described oxidant injury in the Cumberland Plateau. Work by Hogsett et al. (1985b) with two varieties of slash pine seedlings suggested that exposures to peak ozone concentrations elicit a greater response than do exposures to mostly lower concentrations over similar time periods. Miller et al. (1989) showed that better air quality in the central valley of California has led to improved viability in stands of ponderosa and Jeffrey pine.
The search for a vegetative exposure index for plant response has been the subject of intensive discussion in the research community (EPA, 1986a; Lefohn and Runeckles, 1987; Hogsett et al, 1988; Tingey et al., 1989). Both the magnitude of a pollutant concentration and the length of exposure are important; however, there is evidence that the magnitude of vegetation responses to air pollution depends more on the magnitude of the concentration than on the length of the exposure (EPA, 1986a). Several exposure indexes have been proposed. The 7-hour (0900 and 1559 hours) mean, calculated over an experimental period, was adopted as the statistic of choice by EPA's National Crop Loss Assessment Network (NCLAN) program (Heck et al., 1982). Toward the end of the program, NCLAN redesigned its experimental protocol and applied proportional additions of ozone to its crops for 12-hour periods. The results of the NCLAN experiments have been used to estimate agricultural crop losses (Adams et al., 1985, 1989).
Recently, attention has turned from long-term seasonal means to cumulative indexes (exposure measurements that sum the products of concentrations multiplied by time over an exposure period). Oshima (1975) and Lefohn and
Page 38
Benedict (1982) proposed similar cumulative indexes. NCLAN data have been used to test the usefulness of cumulative indexes to describe ozone exposure (Lee et al., 1988; Lefohn et al., 1988; Lee et al., 1989).
Purpose of This Report
In this report the committee systematically examines trends in tropospheric ozone measurements within the United States; reviews current approaches to control ozone by regulating ozone precursors; and assesses the present understanding of the chemical, physical, and meteorological influences on tropospheric ozone. Based on this current understanding, the committee provides a critique of the scientific basis of current regulatory strategies and lists recommendations for improving the scientific basis of future regulatory strategies. The committee determined that a coherent, integrated research program is needed to clarify further the factors that control tropospheric ozone formation within the context of changing regional and global environmental conditions. The committee also recommends increased air-quality measurement and modeling to systematically devise and check future regulatory strategies.
In this report, the committee does not critique the current NAAQS for ozone or other criteria pollutants, but is sensitive to issues associated with the magnitude and form of current and anticipated standards. It also does not address the technologic, economic, or sociologic implications of current or potential ozone precursor control strategies.
Subsequent chapters in this report address the following questions:
Chapter
2 What are the trends in tropospheric concentrations of ozone in the United States?
3 What criteria should be used to design and evaluate ozone reduction strategies?
4 What are the effects of meteorology on tropospheric ozone?
5 What is the atmospheric chemistry of ozone and its precursors?
6 What is the maximum mount of ozone that can form from a given initial mixture of VOCs and NOx?
7 How well can we measure tropospheric ozone and its chemical precursors?
8 What VOC/NOx ratios are found in the atmosphere?
9 What are the emissions that result in ambient concentrations of ozone?
Page 39
10 What is the role of air-quality models in determining ozone reduction strategies?
11 What is the trade-off between control of VOCs and of NOx?
12 Can alternative fuels for transportation improve air quality?
13 What is the interaction between tropospheric ozone concentrations and global change?
14 Is a comprehensive, long-term research program on tropospheric ozone formation and measurement necessary?
The committee presents data and arguments to address these questions and help focus the continuing national debate over devising an effective program to provide healthful air over the United States.


