Page 251
9
Emissions Inventories
Introduction
According to the air quality management approach in environmental regulation, emission limits are set according to the stringency needed to achieve a desired concentration of an atmospheric pollutant. Such an approach is based on an understanding of the quantitative relationship between atmospheric emissions and ambient air quality. The task of evaluating this relationship is straightforward for primary pollutants, such as sulfur dioxide (SO2) or carbon monoxide (CO), whose ambient concentrations are directly related to emissions because the pollutant of interest in the atmosphere is the pollutant that is emitted. For many large emission sources of SO2, it is possible to measure simultaneously emissions and ambient air quality in the affected region. With CO, which is emitted mostly by mobile sources—cars and trucks—data on the actual emission rates by source (real-time) axe not available, and the source contribution is much more ubiquitous, but real-time ambient measurement is possible.
The air quality management approach for secondary pollutants, such as ozone, introduces issues additional to those raised for primary pollutants. These issues result from the added complexity introduced by the coupled chemical relationship between ozone production and precursor emissions. One class of the primary emitted precursors—the oxides of nitrogen (NOx), which have attributes similar to those described above for CO—is measurable in the ambient air, and subject to limitations in real-time source monitoring. Point source NOx emissions make up approximately 57% of the national
Page 252
(California's Inspection/Maintenance program) inventory, and 82% of the point sources emit 5000 tons or more annually; 43% of the NOx inventory is generated by mobile sources (EPA, 1989a). Volatile organic compounds, in contrast, are less well characterized from both a real-time emissions and ambient monitoring perspective.
This chapter provides an overview of the anthropogenic emissions inventory: how it is compiled, what the. major contributing sources are, and where uncertainties lie. There is a similar overview of the inventory of biogenic emissions, and finally a review of efforts to evaluate the accuracy of emissions inventories.
Compilation of Emissions Inventories
In 1971, the U.S. Environmental Protection Agency (EPA) established the National Emissions Data System (NEDS) on sources of airborne pollutants. This system was to summarize annual cumulative estimates of source emissions by air quality control region, by state, and nationwide for the Clean Air Act's five criteria pollutants: particulate matter, sulfur oxides, nitrogen oxides, VOCs, and carbon monoxide. At that time the developers did not envision the evolving demands on emissions inventories that have become common with the advent of increasingly sophisticated air quality models. The original intent to compile annual national trends in the emissions of VOCs, NOx, SO2, CO, and particulate matter has been expanded and amended by the need for chemical speciation of VOCs, consideration of additional chemical species, more detailed information on spatial and temporal patterns of inventoried species, and techniques to project trends in emissions.
An estimate of emissions of a pollutant from a source is based on a technique that uses ''emission factors,'' which are based on source-specific emission measurements as a function of activity level (e.g., amount of annual production at an industrial facility) with regard to each source. For example, suppose one wants to sample a power plant's emissions of SO2 or NOx at the stack. The plant's boiler design and its Btu (British thermal unit) consumption rate are known. The sulfur and nitrogen content of fuel burned can be used to calculate an emissions factor of x kilograms (kg) of SO2 or NOx emitted per y megagrams (Mg, or metric tons) of fuel consumed.
EPA has compiled emission factors for a variety of sources and activity levels (such as production or consumption), reporting the results since 1972 in "AP-42 Compilation of Air Pollutant Emission Factors," for which supplements are issued regularly (the most recent was published in 1985) (EPA, 1985). Emission factors currently in use are developed from only a limited
Page 253
sampling of the emissions source population for any given category, and the values reported are an average of those limited samples and might not be statistically representative of the population. As illustrated in Figure 9-1 (Placet et al., 1990), 30 source tests of coal-fueled, tangentially fared boilers led to calculations of emission factors that range approximately from 5 to 11 kg NOx per Mg of coal burned. The sample population was averaged and the emission factor for this source type was reported as 7.5 kg NOx per Mg coal. The uncertainties associated with emission factor determinations can be considerable. They are discussed later in this chapter.
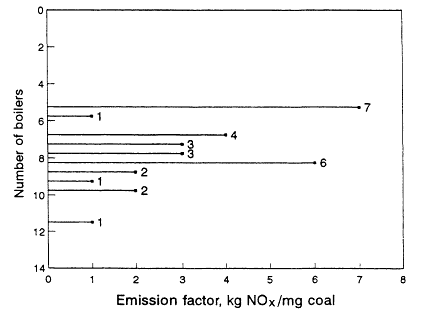
Figure 9-1
Results of 30 NOx-emissions tests on tangentially-fired boilers that use coal.
An average of 7.5 kg NOx/Mg coal was obtained. Source: Placet et al., 1990.
The formulation of emission factors for mobile sources, the major sources of VOCs and NOx, is based on rather complex emission estimation models used in conjunction with data from laboratory testing of representative groups of motor vehicles. Vehicle testing is performed with a chassis dynamometer, which determines the exhaust emission of a vehicle as a function of a specified ambient temperature and humidity, speed, and load cycle. The specified
Page 254
testing cycle is called the Federal Test Procedure (FIT) (EPA, 1989b). Based on results from this set of vehicle emissions data, a computer model has been developed to simulate for specified speeds, temperatures, and trip profiles, for example, the emission factors to be applied for the national fleet average for all vehicles or any specified distribution of vehicle age and type. These data are then incorporated with activity data on vehicle miles traveled as a function of spatial and temporal allocation factors to estimate emissions. The models used to estimate mobile source emissions have been developed primarily by EPA; California has developed its own model. Recent versions of the EPA and California mobile source emission factor models are MOBILE4 (EPA, 1989b) and EMFAC7E (CARB, 1986; Lovelace, 1990), respectively.
The basic approach in estimating emissions therefore is derived from a simple calculation that requires an estimate of an activity level, an emissions factor, and, if the source has a pollution control device, a control factor:
Emission =
activity level × emission factor × control factor
Although obtaining an estimate of the activity level can be simple and as direct as monitoring fuel use or power plant load for a specified period, it also can be quite complex and indirect, requiring spatial aggregation or disaggregation of estimated activity measures, which may depend on the source type or category and its emission rate. Essential data elements compiled as part of the National Acid Precipitation Assessment Program (NAPAP) point source emissions file are presented in Table 9-1; data elements related to area source compilations are presented in Table 9-2.
Anthropogenic Emissions Inventories
The 1985 NAPAP emissions inventory prepared by EPA for NAPAP (EPA, 1989a), includes emissions from the U.S. and Canada for 1985. It was developed to provide information for assessment and modeling objectives of the national program. The inventory listed emissions of CO, SO2, NOx, VOCs, total suspended particulate matter, ammonia (NH3), primary sulfate (SO4-2), hydrogen chloride (HCl), and hydrogen fluoride (HF). Of specific interest to this report are the NOx, VOC, and CO emissions, which are summarized by source category in Figure 9-2 and by state in Figure 9-3. The specifics of the compilation are discussed by EPA (1989a) and are only briefly reviewed in this report.
The U.S. emissions data were derived primarily using existing methodologies previously developed by EPA (Zimmerman et al., 1988a; Demmy et al.,
Page 255
| TABLE 9-1 |
| Plant Data |
| State, county, air quality control region, and UTMa zone codes |
| Point Data |
| Point identification number |
| Standard industrial classification (SIC) code |
| UTM coordinates |
| Stack, plume data (height, diameter, temperature, flow rate) |
| Points with common stack |
| Boiler design capacity |
| Control equipment (devices and control efficiencies by pollutant) |
| Operating schedule (season, hr/day, days/week, weeks/year) |
| Emissions estimates for criteria pollutants (method) |
| Process Data |
| Source classification code (SCC) |
| Operating rates (annual, maximum hourly design) |
| Fuel content (sulfur, ash, heat, nitrogen) |
| aUTM, Universal Trans Mercator, a type of map projection. Source: Placet et al., 1990. |
1988) and use the NEDS point and area source inventory as a stating point for modification and refinement in the development of the 1985 inventory.
Anthropogenic Vocs
Forty percent of anthropogenic VOC emissions result from transportation, according to the 1985 NEDS and NAPAP emissions inventories (see Figure 9-2); light-duty cars and trucks make up the largest contributing fraction. Solvent emissions, which are distributed across a broad group of sources,
Page 256
| TABLE 9-2 |
| Source Category Data |
| Stationary (residential, commercial, institutional, and industrial fuel emissions less than 25 tons per year) |
| Mobile (highway and off-highway vehicles, locomotives, aircraft, marine) |
| Solid waste (on-site incineration and open burning) |
| Miscellaneous (gasoline marketing and evaporation of solvents used by consumers, unpaved roads and airstrips, construction, wind erosion, forest fares, agricultural and managed burning, structural fares, orchard heaters) |
| Other (publicly owned treatment works; hazardous-waste treatment, storage and disposal facilities; fugitive emissions from petrochemical operations; synthetic organic chemical manufacturing and bulk terminal storage facilities; process emissions from bakeries, pharmaceutical, and synthetic fiber manufacturing; oil and gas production fields; and cutback asphalt-paving operations) |
| Activity Level Data |
| Fuel use (by gross vehicle weight and type, by state and county) |
| Vehicle miles of travel (VMT, by road type and speed, by state and county) |
| Surrogate geographic and economic data (population, dwelling units, vehicle registration, manufacturing employment, commercial employment, solvent user category employment) |
| aCutback asphalt refers to asphalt that is thinned with volatile petroleum distillates, such as kerosene. Adapted from Placet et al., 1990. |
contribute 32% of total VOC emissions; the remaining 28% result from other sources such as industrial manufacturing activities and fuel combustion.
An independent analysis by the Congressional Office of Technology Assess-
Page 257
ment (OTA, 1989), reported that 94 cities exceeding the ozone National Ambient Air Quality Standard (NAAQS) during 1986 to 1988 generated 44% of VOC emissions nationwide. In these cities 48% of VOC emissions were from mobile sources, and an additional 25% came from the evaporations of organic solvents and the application of surface coatings. Because these three categories alone account for about 75% of the total estimated VOC emissions in cities where the NAAQS was not met, significant attention to the quality and accuracy of the estimates seems warranted.
VOCs emitted from motor vehicles are mainly hydrocarbons that result from the incomplete combustion of fuel or from its vaporization. These contributions are generally categorized and reported as exhaust and evaporative emissions. Within the exhaust emissions category are included the unburned and partially burned fuel and lubricating oil in the exhaust and gases that leak from the engine. The evaporative emissions category includes fuel vapor emitted from the engine and fuel system that can be attributed to several sources: vaporization of fuel as a result of the heating of the fuel tank, vaporization of fuel from the heat of the engine after it has been turned off (hot-soak emissions), vaporization of fuel from the fuel system while the vehicle is operating (running losses), fuel losses due to leaks and diffusion through containment materials (resting losses), and fuel vapor displacement as a result of filling fuel tanks (refueling losses) (EPA, 1990f).
Only recently has it been recognized that running losses are not treated adequately in EPA's emissions estimating (MOBILE) models (Black, 1989; EPA, 1989b). The magnitude of running-loss emissions will depend on ambient temperature, gasoline volatility, operating cycle, and engine and emission control system design. An OTA study (1989) reported that, using preliminary emission factors provided by EPA for fleet average running losses, for ambient temperatures of 79ºF (26ºC) and gasoline volatility of 11.5 pounds per square inch (psi), MOBILE4 model estimates of VOC emissions were 1.5 grams per mile (g/mi). In assuming ambient temperatures of 87 ºF and gasoline volatility of 11.7 psi, however, the resulting estimate of VOC emissions increased to 2.9 g/mi, a 93% change. Because of the difference in these estimates it has been suggested that past emissions inventory compilations underestimated mobile source VOC contributions by as much as 30% on hot summer days (OTA, 1989).
The use of organic solvents in the dry cleaning industry, in metal degreasing, in cutback asphalt paving, and in a variety of consumer and commercial product manufacturing contributed about 15% of the total VOC emissions in the 1985 national inventory. These sources are difficult to inventory, because almost half of their emissions are estimated to come from facilities that emit less than 50 tons (45 Mg) annually.
The emissions of VOCs from surface-coating-related industries contributed
Page 258
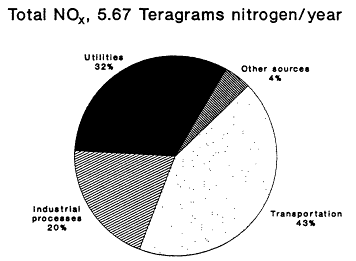
Figure 9-2a
NAPAP 1985 national emissions inventory for NOx
and VOCs by source category. Source: Placet et al., 1990.
about 9% of the total in the 1985 national inventory. The sources include automotive, furniture and appliance manufacturing, printing, and metal and plastic fabrication industries. As with stationary-source solvent evaporation, this source category is not well quantified, and the combined contributions of the two categories are expected to have significant uncertainties.
Voc Speciation by Source Category
The evolving knowledge of the chemical reaction mechanisms that provide quantitative information on the VOC-NOx relationship to ozone production has highlighted the need for compound-specific information on the chemical composition of the compounds in the VOC emissions inventory. The methods developed to generate compound-specific information are similar to those
Page 259
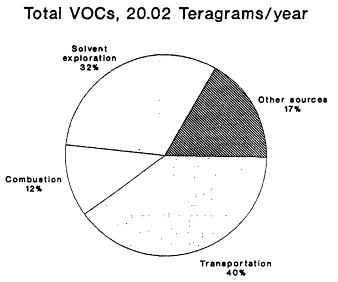
Figure 9-2b
NAPAP 1985 national emissions inventory for NOx
and VOCs by source category. Source: EPA, 1989c.
used for emission factors.
Each point or area VOC emissions source, identified by its source classification code (SCC), has an associated VOC speciation profile, which provides a weight-percent breakdown of the individual compounds that contribute to total VOC mass emissions from the source. Speciation profiles are derived typically from compilations of detailed gas chromatographic analyses of the VOC emissions from sources in representative categories. The data sets used to derive the speciation profiles are quite limited and within a given source category can be highly variable. The current profile data base (Shareef et al., 1988), although the most comprehensive to date, suffers from major uncertainties in estimating compound-specific emissions. Shareef et al. (1988) used a rating procedure considered in EPA's AP-42 emission factor analysis technique (mentioned above) to assign subjective data quality rankings to the speciation profiles used in the NAPAP 1985 inventory. They used a scale of
Page 260
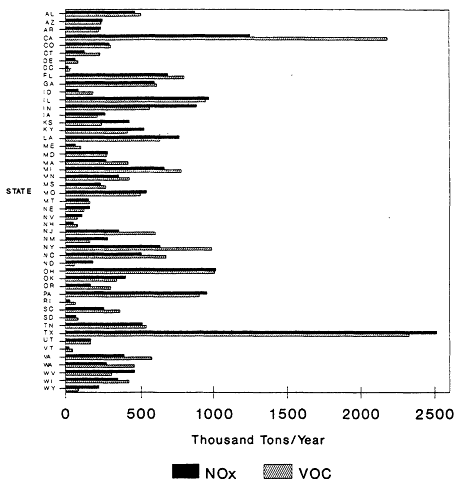
Figure 9-3
NAPAP 1985 national emissions inventory for NOx and VOCs by state. NOx
emissions are reported as thousand tons NO2/ year. Based on data from EPA, 1989c.
A through E, for the highest to the lowest quality, respectively, and their subjective analysis indicates that about 50% of the national VOC emissions of the most reactive chemical species would fall into the class B quality rating. The scale does not have quantitative error estimates associated with the letter ratings. Uncertainty issues associated with the chemical speciation will be discussed further in a later section.
Page 261
Anthropogenic Nox
Nitric oxide (NO) is formed by high-temperature chemical processes during combustion of fossil fuels, from both the nitrogen present in fuel and from oxidation of atmospheric nitrogen. Detailed inventories are available for Canada, the United States, and western Europe that describe the spatial patterns of NOx emissions from combustion of fossil fuels and from industrial processes (Lubkert and Zierock, 1989; Placet et al., 1990). Table 9-3 lists several estimates (cf. Placer et al., 1990) of NOx emissions associated with fossil fuel combustion in the United States. Between 40 and 45% of all NOx emissions in the United States are estimated to come from transportation, 30-35% from power plants, and about 20% from industrial sources. About half the NOx emissions associated with transportation come from light-duty gasoline trucks and cars and approximately one-quarter are from heavy-duty gasoline and diesel vehicles.
| TABLE 9-3 | ||||
| Source category | Emissions (teragrams of nitrogen/year) | |||
| NAPAP Inventorya | EPA Trendsb | MSCETc | EPRId | |
| Electric utilities | 1.8 | 2.1 | 1.9 | 2.2 |
| Nonutility combustion | 1.1 | 1.0 | 1.1 | 1.3 |
| Transportation | 2.4 | 2.7 | 2.3 | 2.4 |
| Other sources | 0.3 | 0.2 | 0.2 | 0.4 |
| Total | 5.6 | 6.0 | 5.5 | 6.3 |
| aEPA 1989a. | ||||
| bEPA 1990a. | ||||
| cMSCET Month and State Current Emissions Trends; Kohout et al. 1990. | ||||
| dEPRI Electric Power Research Institute Heisler et al. 1988. Amounts are for 1982. The other amounts presented in the table are for 1985. | ||||
| Source: Placet et al. 1990. | ||||
Page 262
Emissions have been measured from typical sources for most of the important combustion and industrial processes. These are used to derive emission factors, which are then applied to statistics for fuel consumption and industrial production by various sectors of the economy. The states are responsible for providing estimated emissions for all major point sources and for area sources by county (EPA, 1981). These estimates are subsequently disaggregated to provide emissions data of greater spatial resolution for models. For mobile-source emissions, measured emissions were also used to calculate emission factors.
There are many uncertainties involved in the estimates. For example, NOx emissions from vehicles vary with temperature and vehicle speed. Although the emission factors take this into account, different emission factor models use different assumptions about vehicle speed and ambient operating temperature.
Although the NAPAP NOx inventory for 1985 is considered the most reliable to date, some researchers have tried to estimate its uncertainty. Placet et al. (1990) published a statistical analysis of the measured differences in the emission factors used to construct the -annual NOx emissions inventory for power plants in the United States. That study indicated an uncertainty of approximately 10% in the NAPAP emissions estimates for these large point sources. Such a detailed analysis was not possible for the other sources due to insufficient data. A subjective estimate of the level of uncertainty can be obtained from the relative differences in the various estimates of the emissions for the source categories listed in Table 9-3. It should be noted that the source estimates compiled in Table 9-3 have not generally been compiled independently of one another, and have a considerable amount of shared resource data. Therefore estimates of uncertainty by this comparative approach must be viewed as a lower limit. In addition, such estimates of uncertainty would be larger if made for smaller spatial domains (less than the area of the U.S.) and shorter time periods (less than a year). Finally, in assessing the value of this approach for estimating the uncertainty in an emissions inventory, it must be recognized that using a statistical estimate of uncertainty assumes that there are no systematic biases in the emission factors that are used to construct the inventories. Moreover, this uncertainty applies to an annual emissions estimate constructed for a particular year, 1985. It does not indicate the variability in estimates that could be expected from year to year based on market/economic and climatic factors.
Page 263
Estimates of Biogenic Emissions
In 1960, F.W. Went (1960) first proposed that natural foliar emissions of VOCs from trees and other vegetation could have a significant effect on the chemistry of the earth's atmosphere. Since that study, numerous investigators have focused on biogenic VOCs. Researchers have investigated the speciation of natural VOCs (Rasmussen and Went, 1965; Rasmussen, 1970, 1972), their rate of emission (Tingey et al., 1979, 1980; Zimmerman, 1979, 1981; Arnts and Meeks, 1981; Tingey, 1981; Lamb et al., 1986, 1987; Zimmerman et al., 1988b; Monson and Fall, 1989), and the fate and distribution of these compounds in the atmosphere (Arnts and Meeks, 1981; Duce et al., 1983; Hov et al., 1983).
Measurements of wooded and agricultural areas coupled with emission studies from selected individual trees and agricultural crops have demonstrated the ubiquitous nature of VOC emissions and the variety of organic compounds that can be emitted. The VOCs emitted by vegetation are primarily in the form of highly reactive, and therefore relatively short-lived, olefinic compounds. One compound typically emitted by deciduous trees is isoprene (C5H8); conifers typically emit terpenes such as a-pinene and b-pinene (Rasmussen and Went, 1965). However, foliar VOC emissions are by no means limited to these compounds; often 50% or more of the VOC mass emitted by vegetation is made up of other VOCs, and a significant fraction of the mass can be composed of VOCs whose structure and chemistry have not yet been determined. Table 9-4, taken from a study of VOC emissions from vegetation in California's Central Valley (Winer et al., 1989), illustrates the complex mix of organic species that can be emitted.
Not only do the isoprene and terpenoid emissions vary considerably among plant species, but the biochemical and biophysical processes that control the rate of these emissions also appear to be quite distinct (Tingey et al., 1979, 1980). Isoprene emissions appear to be a species-dependent by-product of photosynthesis, photorespiration, or both; there is no evidence that isoprene is stored within or metabolized by plants. As a result, isoprene emissions are temperature and light dependent; essentially no isoprene is emitted without illumination. By contrast, terpenoid emissions seem to be triggered by biophysical processes associated with the amount of terpenoid material present in the leaf oils and resins and the vapor pressure of the terpenoid compounds. As a result, terpene emissions do not depend strongly on light (and they typically continue at night), but they do vary with ambient temperature. The dependence of natural isoprene and terpenoid emissions on temperature can result in a large variation in the rate of production of biogenic VOCs over the course of a growing season. An analysis of emissions data by Lamb et al. (1987) indicates that an increase in ambient temperature from 25 to 35ºC can result in a factor of 4 increase in the rate of natural VOC emissions from
Page 264
isoprene-emitting deciduous trees and in a factor of 1.5 increase from terpene-emitting conifers (Figure 9-4). This analysis aptly illustrates the fact that, all other factors being equal, natural VOC emissions are generally highest on hot summer days, when the weather-also favors ozone generation.
| TABLE 9-4 | |
| Isoprene | ACETATES |
| Bornylacetate | |
| MONOTERPENES | Butylacetate (tentative)b |
| cis-3-Hexenylacetate | |
| Camphene | |
| D3-Carerie | ALDEHYDES |
| d-Limonene | n-Hexanal |
| Myrcene | trans-2-Hexenal |
| cis-Ocimene | |
| trans-Ocimene | KETONESc |
| a-Phellandrene | 2-Heptanone |
| b-Phellandrene | 2-Methyl-6- methylene-l,7- |
| a-Pinene | octadien-3-one (tentative)b |
| b-Pinene | Pinocarvone (tentative)b |
| Sabinene | Verbenone (tentative) |
| a-Terpinene | |
| g-Terpinene | ETHERS |
| Terpinolene | 1,8-Cineole |
| Tricyclene or a-Thujene (tentative)b | p-Dimenthoxybenzene (tentative)b |
| Estragole (Tentative)b | |
| SESOUITERPENES | p-Methylanisole (tentative)b |
| b-Caryophyllene | |
| Cyperene | ESTERS |
| a-Humulene | Methylsalicylate (tentative)b |
| ALCOHOL'S | n-ALKANES |
| p-Cymen-8-ol (tentative)b | n-Hexane |
| cis-3-Hexen-1-ol |
|
| Linalool | |
(Table continued on next page)
Page 265
(Table continued from previous page)
| ALKENES | |
| 1-Decene | |
| 1-Dodecene | |
| 1-Hexadecene (tentative)b | |
| p-Mentha-l,3,8-triene (tentative)b | |
| 1-Pentadecene (tentative)b | |
| 1-Tetradecene | |
| AROMATICS | |
| p-Cayman | |
| aUnless labeled ''tentative'' identifications were made on the basis of matching full mass spectra and retention times with authentic standards. | |
| bTentative identifications were made on the basis of matching the mass spectra (and retention order when available) with published spectra (Adams et al., 1989). | |
| cAcetone was tentatively identified from the gas chromatography-flame ionization detection analysis on the GS-Q column (see text for details). | |
| Source: Winer et al., 1989 | |
Biogenic Voc Inventories
As with anthropogenic emissions, an accurate inventory of natural VOC emissions is needed to help quantify their part in fostering episodes of ozone pollution. Also similar to the case of anthropogenic emissions inventories, natural VOC inventories typically are developed first by determining an emission factor (actually an emissions rate per unit area) for specific kinds of sources (in the case of biogenic emissions, the source types are biomes such as deciduous forests, coniferous forests, mixed forests, grasslands, and agricultural lands) and then extrapolating to an integrated region-wide emissions rate or inventory, using landuse statistics to determine the extent of each source type or biome within the region.
Three field methods have been used to determine VOC emission factors for individual biomes. The most widely used was developed by Zimmerman (1979, 1981): A teflon bag is placed around a live branch of known biomass and the rate of emissions per unit biomass of the species is determined from the rate at which VOCs are found to accumulate in the bag (Figure 9-5). These data can then be coupled with a detailed biomass survey of the immediate area to deduce an emissions rate per unit area for the specific biome. Table 9-5 gives the emission factors for mixed forests derived by Zimmerman
Page 266
(1979) from a study (one of the first comprehensive studies of its kind) done in the Tampa-St. Petersburg area of Florida during the summer.
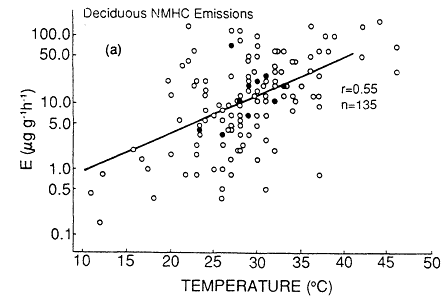
Figure 9-4
Total nonmethane hydrocarbon emissions (NMHC) (a) from deciduous trees and
(b) from conifers. Multiple data points (points based on more than one measurement)
are shown as dosed circles. Single data points are shown as open circles. The solid
line is the best fit of the data based on least-square regression. r is the Pierson correlation
coefficient. n is the number of data points. These are total NMHC emissions as a function
of temperature, in units of micrograms (mg) of NMHC per g of dry leaf biomass per hour.
Source: Lamb et al., 1987.
Although the enclosure method is relatively simple to implement and interpret, it has some distinct disadvantages. The placement of an enclosure on the plant may disturb the leaf surface or alter the plant's physical environment (for example, the temperature and humidity) and thus cause anomalous emission rates. There are also uncertainties associated with the large extrapolation that must be made to derive an emission rate for an entire forest from the rates measured for a fixed number of branches and trees. For this reason other approaches have been used, and although they have their own drawbacks, they can at least serve as an independent check on the enclosure technique.
Page 267
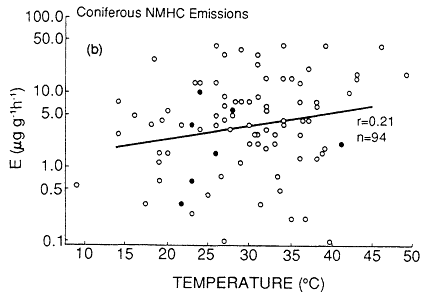
Figure 9-4
(continued)
One such method is the micrometeorological approach (Lamb et al., 1985; Knoerr and Mowry, 1981), which uses measurements of the vertical gradient of natural VOCs near the earth's surface; this measured gradient, coupled with micrometeorological data such as the local wind and temperature profile, can be used to estimate a local emission rate. Another technique (Lamb et al., 1986) uses the release of a tracer, such as sulfur hexafluoride (SF6), coupled with downwind measurements of the tracer and VOC concentrations. The natural VOC emission rate is then calculated from the tracer release rate multiplied by the ratio of the VOC concentration to the tracer concentration measured at the downwind location. These two methods integrate data from trees throughout a region, but they are much more complex to carry out and interpret than the enclosure method; they also require specific meteorological conditions with a well-defined and relatively homogeneous wind profile and, in the case of the micrometeorological approach, cannot be carried out in regions with complex terrain (such as mountainous areas). Despite the inadequacies of each method and the spatial and temporal inhomogeneity inherent in biogenic emissions, the emission factors yielded by the different approaches have all been reasonably consistent; emissions rates obtained by these approaches agree within a factor of two or three (Lamb et al., 1987).
Once the emission factors for all the biomes in a region have been deter-
Page 268
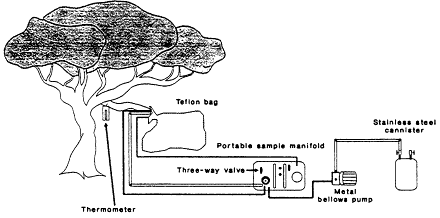
Figure 9-5
Biogenic emissions sampling collection system. Source: Zimmerman, 1979.
mined, a biogenic VOC inventory for the region can estimated by combining these results with landuse data on the amount of the earth's surface covered by the biomes in the region. This information can come from a variety of sources, including the Geoecology Data Base (Olson, 1980) or digitized satellite images, such as those available from LANDSAT. Typical of this approach is the work of Lamb et al. (1987), who estimated county-by-county the emissions of biogenic VOCs into the atmosphere over the entire continental United States; the results of this study are illustrated in Figures 9-6 and 9-7.
It is interesting to note that the characteristics of the biogenic emissions change from one region of the country to another. The South, with its dense vegetation and high temperatures, has relatively high natural VOC emissions. Furthermore, although the inventories for the other regions of the nation are dominated by a-pinene and other nonmethane VOCs, with relatively small emissions of isoprene, isoprene emissions comprise almost 50% of the total biogenic inventory for the South.
| TABLE 9-5 | ||||
| Day | Night | |||
| Compound | ER | S2 | ER | S2 |
| TNMHCa | 5969.490 | 2532520.0 | 1745.940 | 439545.0 |
(Table continued on next page)
Page 269
(Table continued from previous page)
| Day | Night | |||
| Paraffins | 573.827 | 21846.0 | 411.475 | 10462.6 |
| Olefins | 4953.520 | 2139170.0 | 1024.990 | 376886.0 |
| Aromatics | 423.550 | 11713.9 | 298.629 | 5638.1 |
| Methane | 830.981 | 75674.0 | 798.813 | 71427.9 |
| a-Pinene | 462.466 | 134816.0 | 348.456 | 69977.9 |
| b-Pinene | 428.301 | 168643.0 | 311.320 | 82895.6 |
| d-Limonene | 53.234 | 2243.0 | 36.998 | 1085.5 |
| Isoprene | 3539.270 | 1372810.0 | 0.000 | 0.0 |
| Myrcene | 7.806 | 1030.3 | 5.426 | 498.1 |
| Unknown Terpenes | -4.658 | 614.625 | -2.832 | 285.2 |
| 21A | 2.196 | 0.0 | 1.531 | 0.0 |
| 18 | 0.170 | 0.668 | 0.115 | 0.313 |
| 20 | 0.081 | 0.153 | 0.055 | 0.072 |
| 21 | 90.549 | 62997.8 | 61.404 | 31599.1 |
| 22 | 4.063 | 170.0 | 2.749 | 79.9 |
| 23 | 1.261 | 6.479 | 0.880 | 3.156 |
| 24 | 2.179 | 35.7 | 2.179 | 35.7 |
| 27 | 0.756 | 1.593 | 0.525 | 0.767 |
| 28 | 1.427 | 1.879 | 0.991 | 0.907 |
| 29 | 6.719 | 132.4 | 3.997 | 55.8 |
| D3-Carene | 102.137 | 13875.9 | 71.374 | 6695.7 |
| 26A | 10.842 | 2253.4 | 7.522 | 1083.7 |
| 29A | 21.210 | 227.0 | 14.714 | 109.0 |
| aTNMHC, total nonmethane hydrocarbons | ||||
| Source: Zimmerman (1979) | ||||
Page 270
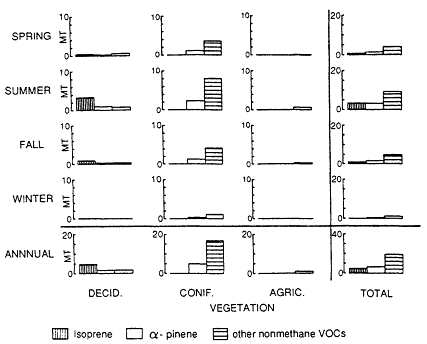
Figure 9-6
Nonmethane VOC emissions in Montana by season and source type. Source: Lamb et al., 1987.
Placet et al. (1990) estimated that biogenic emissions integrated over the entire continental United States add approximately 30,000,000 tons (27.4 Tg) of carbon per year to the atmosphere. This rate is comparable to the estimated input of VOCs from anthropogenic sources discussed earlier in this chapter. Because of their extensive land area and high biomass density, forests are by far the major contributor to the biogenic VOC inventory; agricultural crops contribute only a few percent.
In addition to being a significant source of VOCs in the continental United States as a whole, biogenic emissions can also represent a significant source of VOCs in urban airsheds. For example, in Atlanta, Georgia, where almost 60% of the metropolitan area is wooded, anthropogenic and biogenic VOC emissions have been estimated to be roughly comparable; each contributes 10-60 kg C/km2-day (Chameides et al., 1988). This is qualitatively consistent with the analysis of VOC concentration data presented in Chapter 8, which also implies a significant role for biogenic VOCs in a variety of urban areas, including Atlanta.
Page 271
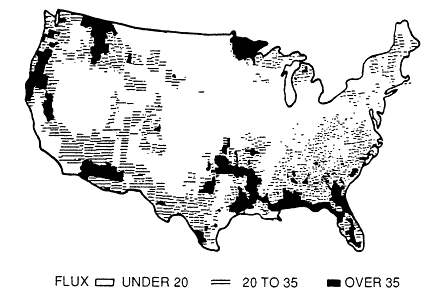
Figure 9-7
Average nonmethane VOC flux (kg/hectare) during the
summer in the United States. Source: Lamb et al., 1987.
Uncertainties in Biogenic Inventories
The magnitude of biogenic VOC emissions, coupled with the high reactivity and ozone-forming potential of these compounds (see Chapter 5), suggests that they can have a significant effect on ozone formation that should be accounted for in any ozone control strategy. However, biogenic emissions inventories for yearly or seasonal periods are not yet well-quantified and could be in error by as much as a factor of two or three (Placet et al., 1990). Moreover, because of the extreme variability in emissions that can occur over the growing season, much larger errors can be incurred when annual or even seasonal inventories are applied to a given single- or multiple-day episode of high concentrations of ozone.
The uncertainties in biogenic inventories arise from a variety of causes. In addition to the experimental uncertainties associated with the biogenic emission measurements, there are also significant uncertainties associated with the
Page 272
interpretation of these measurements as well as with the related biomass and land use data used to derive the total emission rates from the experimentally measured data.
Probably the largest source of uncertainty in biogenic VOC inventories involves the empirically derived models used to calculate emission factors for individual biomes and the adjustments that must be made to account for variable environmental conditions throughout a region of interest. A large amount of variation in biogenic emissions has been reported (cf. Placet et al., 1990). The challenge is to develop a statistically robust algorithm to account for the variability in emissions caused by environmental factors. Although the mechanisms responsible for biogenic emissions of VOCs are complex and many environmental factors must play a role, temperature and light intensity are the only factors included in current models, even though they account for only 30-50% of the variability observed in emissions rates (Lamb et al., 1987). The remaining variability, which is caused by some combination of environmental as well as biologic factors, is not accounted for in current biogenic emissions models and must therefore be removed by averaging to obtain a "representative" emission factor. However, because the variability is so great, the averaging method can affect the resulting emission factors; it has been found, for instance, that emission factors formed by using a geometric mean of the data—which tends to minimize the influence of members of the sample population found to be gross or large emitters—is typically a factor of two or three lower than are emission factors formed from an arithmetic mean of the data (Placer et al., 1990). It is not now clear which averaging procedure is most appropriate. To address this problem, a good deal more laboratory and field work will be needed to illuminate the mechanisms responsible for biogenic emissions and thus account for the variability of the emissions data so that more accurate and robust models can be developed.
Another complication arises from the application of the temperature- and light-dependent algorithm to actual environmental conditions. Although observed ambient temperatures and light levels might be appropriate for leaves at the top or edge of a forest canopy, they are not appropriate for leaves within a canopy. To account for the reduced temperatures and light intensifies inside a canopy, temperatures and light intensities observed at the top of the forest must be adjusted by a model that simulates the flow of light and heat through the forest canopy. The current generation of these models (such as that documented by Pierce and Waldruff, 1991) are highly simplified treatments of the meteorology within a forest canopy and as such might introduce some as yet undefined error into the resulting emission factors.
Another significant source of uncertainty in biogenic VOC inventories is associated with their speciation. As noted above, in addition to isoprene, a-
Page 273
pinene, and b-pinene, plants emit a wide variety of other VOCs. Furthermore, a significant fraction of the mass of the natural emissions is in forms that have not yet been identified. It also should be noted that for the VOCs that have been identified, very little is known of the specific chemical mechanisms by which they are oxidized in the atmosphere (see Chapter 5). To accurately assess the chemical effect of these emissions, the complex mix of hydrocarbons emitted by different species of vegetation and the atmospheric chemistry of these hydrocarbons must be better elucidated.
Natural Sources of Nox
Biomass burning generates NOx and other chemically and radiatively important species, including carbon dioxide (CO2), carbon monoxide (CO), methane (CH4), VOCs other than CH4, and nitrous oxide (N2O). In 1980, Seiler and Crutzen published the first estimate of the amount of CO2 emitted from biomass burning. Since then, considerable progress has been made toward quantifying the compounds emitted by burning vegetation (Crutzen et al., 1979, 1985; Greenberg et al., 1984; Andreae et al., 1988).
Biomass burning is a significant source of NOx in tropical and subtropical regions. Most is associated with agriculture and the clearing of land for agricultural use. By contrast, in the United States, most of the NOx associated with biomass burning comes from wildfires. The sporadic and unpredictable nature of wildfires precludes their assembly into a meaningful inventory. In any event, although the occasional large forest fire can be a significant regional source of NOx, on average, wildfires are believed to be a minor source of NOx in the United States (Logan, 1983).
The release of energy generated by lightning produces the extremely high temperatures required to convert nitrogen (N2) and oxygen (O2) to nitric oxide (NO). For the purposes of this discussion, it is useful to discriminate between two types of lightning: intracloud (IC) and cloud-to-ground (CG) discharges (Kowalczyk and Bauer, 1982; Boruki and Chameides, 1984). IC lightning is more frequent but less efficient at converting N2 and O2; it accounts for approximately one-third of the NOx generated. However, because IC lightning occurs at relatively high altitudes, removal processes are reasonably slow, and IC-lightning-generated NOx is transported over long distances. The remaining two-thirds of lightning-produced NOx is generated by CG discharges. These NOx emissions, which are generated at lower altitudes, and thus are similar to those from anthropogenic sources, are more readily removed from the atmosphere and therefore less available for long-distance transport.
Page 274
Lightning shows strong spatial and seasonal variations. Equatorial regions have the highest concentrations; about 60% of the earth's lightning occurs between 20º south and 20º north (Hameed et al., 1981). Less than 10% occurs over North America, and of that, about 75% occurs from May to September (Logan, 1983).
Quantitative estimates of NOx from lightning usually are derived from a combination of three factors: the frequency of lightning flashes (a flash consists of one or more strokes closely spaced in time), the energy dissipated per flash, and the NOx produced per energy unit dissipated. A thorough review of this calculation procedure resulted in an estimate of global emissions from lightning of 2.6 Teragrams of nitrogen (Tg-N)/year within a range of 0.8 to 7.9 Tg-N/year (Boruki and Chameides, 1984). Albritton et al. (1984) used a different approach to estimate the amount of NOx production attributable to lightning. They used nitrate deposition data from remote oceanic and polar sites where NOx from IC lightning is believed to be the dominant nitrate precursor. The values obtained were approximately 5.5 Tg-N/year globally and 0.5 Tg-N/year in North America.
Based on the literature cited above, an estimate of the NOx-generated lightning over North America has been calculated by Placet et al. (1990). They estimated seasonal emissions of NOx from lightning over the United States as a function of latitude and longitude (Table 9-6) by using the lightning distribution of Turman and Edgar (1982) and assumed total global NOx formation from lightning to be 6 Tg-N/year. The estimates shown in Table 9-6 are reported for 10º × 10º grid cells that extend from 30º north to 60º north, and from 80º west to 120º west. The estimates indicate that the total NOx produced by lightning over North America is 0.36 Tg-N/year, that NOx production peaks in the summer, and that the largest rate of production is in the Southeast.
Page 275
| TABLE 9-6 | ||
| Latitude | Longitude | Flux (0.001 Tg-N) |
| Winter (January, February, and March) | ||
| 30-40 | 80-90 | 4.8 |
| 30-40 | 90-100 | 4.4 |
| 30-40 | 100-110 | 3.8 |
| 30-40 | 110-120 | 3.3 |
| 40-50 | 80-90 | 3.5 |
| 40-50 | 90-100 | 3.2 |
| 40-50 | 100-110 | 3.0 |
| 40-50 | 110-120 | 2.7 |
| 50-60 | 80-90 | 2.8 |
| 50-60 | 90-100 | 2.6 |
| 50-60 | 100-110 | 2.5 |
| 50-60 | 110-120 | 2.4 |
| Total | 39 | |
| Spring (April, May, June) | ||
| 30-40 | 80-90 | 18.2 |
| 30-40 | 90-100 | 15.3 |
| 30-40 | 100-110 | 12.3 |
| 30-40 | 110-120 | 9.4 |
| 40-50 | 80-90 | 10.1 |
| 40-50 | 90-100 | 8.7 |
| 40-50 | 100-110 | 7.2 |
| 40-50 | 110-120 | 5.7 |
| 50-60 | 80-90 | 6.0 |
| 50-60 | 90-100 | 5.3 |
| 50-60 | 100-110 | 4.6 |
| 50-60 | 110-120 | 3.9 |
| Total | 107 | |
(Table continued on next page)
Page 276
(Table continued from previous page)
| Latitude | Longitude | Flux (0.001 Tg N) |
| Summer (July, August, and September) | ||
| 30-40 | 80-90 | 25.9 |
| 30-40 | 90-100 | 21.6 |
| 30-40 | 100-110 | 17.2 |
| 30-40 | 110-120 | 12.9 |
| 40-50 | 80-90 | 14.0 |
| 40-50 | 90-100 | 11.8 |
| 40-50 | 100-110 | 9.7 |
| 40-50 | 110-120 | 7.5 |
| 50-60 | 80-90 | 7.9 |
| 50-60 | 90-100 | 6.9 |
| 50-60 | 100-110 | 5.8 |
| 50-60 | 110-120 | 4.7 |
| Total | 146 | |
| Fall (October, November, and December) | ||
| 30-40 | 80-90 | 12.6 |
| 30-40 | 90-100 | 10.7 |
| 30-40 | 100-110 | 8.8 |
| 30-40 | 110-120 | 6.8 |
| 40-50 | 80-90 | 7.3 |
| 40-50 | 90-100 | 6.4 |
| 40-50 | 100-110 | 5.4 |
| 40-50 | 110-120 | 4.5 |
| 50-60 | 80-90 | 4.6 |
| 50-60 | 90-100 | 4.2 |
| 50-60 | 100-110 | 3.7 |
| 50-60 | 110-120 | 3.2 |
| Total | 78 | |
| U.S. Total: 0.37 Tg-N/year | ||
| Source: Placet et al., 1990 | ||
Page 277
These results can be compared with estimates of NOx generated by lightning during a specific period over an area of the eastern United States (Placet et al., 1990). The estimates were done for a case study between July 1, 1988, and Sept. 30, 1988, for an area between latitudes 30º north and 40º north and longitudes between 80º west and 90º west. Their calculation used ''visible'' lightning flashes recorded for this area during the period (a total of 8,723,258 flashes), as taken from the State University of New York at Albany, Lightning Data Base. The assumptions made for the calculation were as follows:
(1) Each recorded cloud-to-ground flash produces 4 × 10¹⁰ joules of energy (see Boruki and Chameides, 1984).
(2) Each joule yields 9 × 10¹⁶ molecules of NO (see Boruki and Chameides, 1984).
(3) An additional amount of NO is generated by "unseen" cloud-to-cloud flashes (as estimated by Bauer, 1982).
This calculation yields a total nitrogen source for this area and period of 0.0073 Tg-N as compared with the corresponding estimate of 0.026 Tg-N from Table 9-6. The difference, almost a factor of four, provides a gauge of the uncertainty and the variability that can be expected for the estimates of NO produced by lightning.
NOx is produced in soils by the microbial processes of nitrification and denitrification and by several chemical reactions that involve nitrite (Galbally and Roy, 1978; Galbally, 1989). The local variables that frequently influence NOx emissions are soil temperature, moisture content, soil nutrient level, and vegetation cover (Johansson, 1984; Johansson and Granat, 1984; Slemr and Seller, 1984; Galbally et al., 1985; Anderson and Levine, 1987; Galbally et al., 1987; Williams et al, 1987; Johansson et al., 1988; Kaplan et al., 1988; Williams et al., 1988). The wider scale factors that influence NOx emissions to the atmosphere include climate (through temperature and rainfall), plant growth and decay, clearing of forests, biomass burning (Anderson et al., 1988), and fertilization.
Several observations can be made about the measurements of soil emissions of NOx. NO is the principal nitrogen species emitted by soils. Overall, the source of NO2 is a small fraction (< 10%) of the NOx emissions. The published results cited above show a large range of variability in fluxes. The averages reported by the various investigators range from 0.034 ng (nanograms)-N/m2-second (Williams and Fehsenfeld, 1991) for a tidal marsh to 60 ng-N/m2-second (Williams and Fehsenfeld, 1991) for a recently fertilized corn field. For the set of 26 measurements reported, there was an average emission of 8.1 ng-N/m2-second and a standard deviation of 13.7 ng-N/m2-second.
Page 278
Various approaches have been used to estimate the annual soil emission of NOx globally and for North America. The earliest meaningful estimate was based on the field measurements of NOx emissions in Australian pasture land during the spring and autumn (Galbally and Roy, 1978). Extrapolation of these measured rates to all seasons and land areas yielded a global estimate of about 9 Tg-N/year. A refinement of this method, which included field measurements for two other ecosystem types and covers the growing season, resulted in a much smaller estimate of 1 Tg-N/year (Johansson, 1984), with an estimated range of uncertainty of 0.2 to 3.2 Tg-N/year. Another study (Slemr and Seiler, 1984) used relatively high measured flux rates to estimate about 11 Tg-N/year. In view of recent measurements of high rates of emissions from soils in the tropics (Duffy et al., 1988; Johansson and Sanhueza, 1988; Johansson et al., 1988), the current consensus favors larger values for global emissions—about 12 Tg-N/year. In view of the extreme variability of emission rates, the limited data base, the uncertainty about the controlling biogenic processes, and the lack of detailed global geoecologic data, this value must be considered as an estimate that is accurate within a factor of 10. It gives a range for global NOx emissions from soils of 33 to 18 Tg-N/year. Based on the fraction of global land area occupied by North America, an approximate value for soil emission of NOx of 0.6 Tg-N/year for North America can be inferred.
However, given the increasing number of measurements of NOx emissions from soil by type, a somewhat more detailed estimate of NOx soil emissions for the continental United States is now feasible. Despite variability and uncertainties, various distinct patterns emerge. The four local variables that frequently influence NOx emission are soil temperature, soil moisture content, soil vegetation cover and soil nutrient level (Johansson, 1984; Johansson and Granat, 1984; Slemr and Seiler, 1984; Galbally et al., 1985; Anderson and Levine, 1987; Galbally et al., 1987; Williams et al., 1987; Johnasson et al., 1988; Kaplan et al., 1988; Williams et al., 1988). One variable that can be accounted for systematically is soil temperature. Williams et al. (1992a) deduced a simple relationship between soil temperature and NOx emissions for different measurement sites. This relationship greatly reduces the variation of data taken at individual sites by different investigators. By separating the results of the NOx soil emissions measurements according to the biome associated with those measurements, it is possible to identify biome-characteristic emissions patterns. With temperature effects taken into account, the NOx emissions measured for the biomes are relatively consistent. Making allowances for seasonal temperature variations, it is possible to estimate the seasonal NOx soil emissions for those biomes. Finally, using data which characterize biomes for the United States, it is possible to identify areas of the United
Page 279
States that correspond to the biomes included in the study of soil temperature and NOx emissions.
The biomes within the United States are classified as forests, grasslands, wetlands, and agricultural lands. The forests, grasslands (including grazing lands), and wetlands make up 53.5% of land area in the United States; agricultural lands make up 16.0%. Agricultural lands are further subdivided into four crop types, reflecting the farming practiced—particularly the amount and kinds of fertilization. The crop types are corn, cotton, wheat, and unfertilized harvested feed crops (soybeans, alfalfa, and hay). The growing season is assumed to extend from May 1 to August 31. Outside the active growing season, the NOx emissions from these agricultural lands are assumed to be the same as for the grasslands. Excluded from the inventory is the remaining 30.6% of the total land area of the United States. This includes largely arid lands and deserts where limited NOx flux measurements have been made. Because of the very low moisture content of the soils, these lands are not expected to be major sources of NOx.
The estimates of NOx emissions from soil for the 10 EPA regions are listed in Table 9-7. This inventory estimates annual emissions in the continental
| Table 9-7 | ||
| Region | Annual emissions, Tg-N/year | Percentage of region inventoried |
| 1-3 | 0.015 | 76.83 |
| 4 | 0.033 | 79.58 |
| 5 | 0.079 | 75.57 |
| 6 | 0.055 | 50.69 |
| 7 | 0.082 | 74.42 |
| 8 | 0.067 | 64.38 |
| 9 | 0.012 | 27.23 |
| 10 | 0.003 | 60.55 |
| Total = 0.346 Tg-N/year | ||
| Placer et al., 1990 | ||
Page 280
United States at 0.36 Tg-N/year. Given uncertainties, it is estimated that the annual flux of NOx from the soils in the United States is between 0.11 and 1.1 Tg-N/year.
The prevailing conditions for the high fluxes appear to be high temperatures and bare soil or open crops. The lowest fluxes are observed in flooded soils or under cool conditions and in the presence of extensive vegetation cover of the soil surface. Indeed, the presence of heavy vegetation covering the soils and the subsequent deposition of NO2 on the surface of the vegetation, particularly when wet, could prevent the escape of NOx above the vegetation canopy. Thus, even in relatively remote unpolluted regions, forests represent a net sink for NOx. This is expected to hold for most forested regions of the United States. Hence, forested regions in the United States will represent net sinks of NOx even when there are modest emissions of NOx from the soils of the forest floor.
Accuracy of Emissions Inventories
Knowledge of the precision and accuracy of emissions estimates for VOCs and NOx is essential to quantify the relationship of these precursor species to ozone air quality. The desired accuracy and precision of the emissions inventory is governed by its intended application. The analysis of emissions and air quality trends for primary emitted pollutants has performance criteria different from those for air quality management applications and each is likely to stress different elements of the methods of estimating emissions inventories. For example, an urban photochemical airshed model is used in an air quality management application. The input data for that model require oxidant precursor emissions data that have accurate and precise spatial and temporal distributions and chemical speciations. Such requirements are significantly more rigorous than those needed to specify the overall annual emissions of precursors within an urban region in an emissions trend analysis.
Because of extensive costs and lack of proven measurement techniques to test the accuracy and precision of emissions data, the uncertainty of emissions inventories is estimated. In lieu of field verification and direct intercomparison testing of the methods, estimates of uncertainty have been developed for the data inputs for the modeling algorithms used in estimating emissions from various sources.
Under the aegis of NAPAP, Placet et al. (1990) have summarized results of an uncertainty analysis of the emissions models that support the NAPAP 1985 emissions inventory. Sources of emission uncertainty identified in the estimation process include variability in each of the individual components
Page 281
contributing to the estimate, systematic errors associated with the emissions factor, variability in the accuracy and precision of data required to generate emissions estimates, and the limited number of methods available to treat uncertainties in emissions estimates. A list of the potential sources of variability is provided in Table 9-8.
| TABLE 9-8 |
| Emission Factor Variability |
| Temporal variability as a result of operating conditions |
| Inherent variations within source category due to equipment configuration |
| Location specific factors: ambient temperature, wind speed, or fuel characteristics |
| Variability in Btu and sulfur content of fuel |
| Annual Activity Level Variability |
| Temporal variability in fuel consumption or production levels |
| Variability in activity values disaggregated using surrogate activity levels |
| Variability of Allocation Factors |
| Temporal variability due to changes in demand or production distribution, maintenance, and random outages |
| Variability in chemical speciation due to process changes and product variability |
| Variability of Emission Control Efficiency |
| Variability in removal efficiency due to changes in operating conditions, equipment failures, and fuel characteristics. |
| Adapted from Placer et al., 1990 |
Estimates of uncertainty in emissions data have been derived mainly from subjective judgments of the variability of the various components identified in
Page 282
Table 9-8 combined with subjective estimates of uncertainties associated with the emissions estimation parameters (for example, fuel consumed, vehicle miles travelled, and number of vehicles produced). Statistical methods have been used to characterize uncertainties by aggregating the uncertainty values of components in Equation 9-1 assuming independence among components. The validity of this assumption has allowed the application of Goodman's formula in the treatment of combined uncertainties in the emissions uncertainty estimation process.1 Although applying Goodman's formula provides a methodological approach to aggregating the various uncertainties associated with components contributing to the emissions estimate, the lack of quantitative estimates of these uncertainties has limited the credibility of the approach. Estimates of coefficients of variation for the National Annual NOx Emissions Inventory by economic sector are given in Table 9-9, along with the 90% relative confidence intervals that can be inferred from the coefficients of variation. The confidence intervals are presented as a measure of uncertainty. However, they do not account for systematic error or nonrepresentative samples.
| TABLE 9-9 | |||
| Sector | National Annual NOx Emissionsa (Tg) | Coefficient of Variation | 90% RCI |
| Lower variability caseb | |||
| Electric Utilities | 6.09 | 0.07 | 0.11 |
| Industrial Combustion | 2.25 | 0.15 | 0.25 |
| Industrial Process | 0.84 | 0.25 | 0.41 |
| Residential/ | 0.62 | 0.30 | 0.49 |
| Commercial | 8.03 | 0.02 | 0.03 |
| Transportation | |||
| All Other | 0.81 | 0.40 | 0.66 |
(Table continued on next page)
1An illustrative example showing the application of Goodman's formula to two power plants with varying CVs (coefficient of variation; CV = standard deviation/mean) with respect to their activity levels and emission factors can be found in Placer et al. (1990).
Page 283
(Table continued from previous page)
| Sector | National Annual Nox Emissionsa (Tg) | Coefficient of Variation | 90% RCI |
| Aggregate | 18.64 | 0.04 | 0.06 |
| Higher variability caseb | |||
| Electric Utilities | 6.09 | 0.09 | 0.15 |
| Industrial Combustion | 2.25 | 0.20 | 0.33 |
| Industrial Process | 0.84 | 0.25 | 0.41 |
| Residential/Commercial | 0.62 | 0.30 | 0.49 |
| Transportation | 8.03 | 0.10 | 0.16 |
| All Other | 0.81 | 0.40 | 0.66 |
| Aggregate | 18.64 | 0.06 | 0.10 |
| aEmission values are for 1985 and were taken from a preliminary version of the report by Kohout et al. (1990). The values were slightly modified after their use in this uncertainty analysis; however, slight changes in the emission values do not strongly affect the uncertainty estimates. | |||
| bThe lower and higher variability cases refer to alternative uncertainty assumptions regarding low NOx burners and the variability of emissions from the industrial combustion and transportation sectors. | |||
| Source: Placet et al., 1990. | |||
The development and refinement of methods for estimating emissions is a fundamental element in the implementation of the regulatory approach to air quality management. Demonstrating the accuracy of emissions estimates has been the Achilles' heel in evaluating the effectiveness of air quality management control strategies and is a fundamental flaw in the regulatory process.
Motor Vehicle Emissions
Accurately estimating emissions from the population of motor vehicles in an area is one of the most difficult problems in the entire emissions inventory process. The problem is compounded because motor vehicle emissions typi-
Page 284
cally account for about 40% of the total VOC and NOx emissions in any region. Moreover, motor vehicle emissions result not only from tailpipe exhaust but also from evaporation of fuel from various locations in the fuel tank-engine system, and total emissions depend critically on the mode of operation of the vehicle, its state of repair, and the ambient temperature. As noted earlier, the motor vehicle emissions inventory for a region is a compilation of the emissions and driving cycle of each vehicle. (A driving cycle provides a specific pattern of activity—for example, acceleration and speed profiles and trip duration—for defined segments of the motor vehicle population.) Although this section addresses only vehicle emissions and not driving cycles, it is important to note that determination of a representative cycle for an area is an essential aspect of the overall motor vehicle emissions inventory and is generally overlooked, due to expense and a lack of proven techniques.
Dynamometer testing of new and in-use vehicles has been performed over the years on limited numbers of vehicles to assess pre- and postcontrol tail-pipe emissions, emissions control deterioration factors, and inspection and maintenance programs (Bonamassa and Wong-Woo, 1966; Black and High, 1977,1980; Sigsby et al., 1987). Dynamometer testing is the key source of emissions rate data used in the development of exhaust emissions factors for use in mobile-source emissions models. As a tool for measuring mobile-source exhaust emissions under operating conditions, dynamometer testing cannot be widely used because of the expense. Sigsby et al. (1987) reported one example of a dynamometer test of 46 state-owned vehicles, model years 1975-1982. In that test, only 17% of the vehicles met their exhaust emission standards for CO, VOCs, and NOx.
Ashbaugh et al. (1990) reported the results of the 1989 California Random Roadside Inspection Survey Program, which has been carried out each year since 1983 to evaluate the effectiveness of California's Inspection/Maintenance program (I/M, called Smog Checks). The 1989 survey was done at 60 urban locations and involved about 4500 vehicles. It was found, for the no-load 1000 rpm idle test performed; that 10% of the vehicles were responsible for about 60% of the exhaust idle CO, and that another (not necessarily the same) 10% were responsible for about 60% of the exhaust VOCs. The results showed only a weak relationship between vehicles that emit large amounts of CO and those that emit large amounts of VOCs, based on the idle test.
Tunnel Studies
Ambient measurements of VOCs, CO, and NOx in parking garages and roadway tunnels have been used to determine emissions from motor vehicles
Page 285
within these somewhat controlled environments. This approach serves to reduce the uncertainties associated with atmospheric chemistry and transport of emissions from their source to the location where they are measured. Because the concentrations of compounds found in these contained environments are large, many of the uncertainties associated with measurement of ambient concentration are circumvented, such as the inability of an instrument to measure a low ambient concentration accurately.
Tunnel studies were conducted as early as 1970 (Lonneman et al., 1974) and have been carried out from time to time since then (Pierson et al., 1978; Gorse and Norbeck, 1981; Hampton et al., 1983; Gorse, 1984; Lonneman et al., 1986). The studies have been done in the Lincoln Tunnel, which connects New York and New Jersey, and the Allegheny Mountain Tunnel on the Pennsylvania Turnpike, among others. Most recently, a tunnel in Van Nuys, California, a suburb of Los Angeles, was sampled (Ingalls, 1989; Ingalls et al., 1989) as part of the Southern California Air Quality Study (SCAQS).
The SCAQS tunnel study consisted of measurements of CO, VOCs (excluding methane), and NOx in a tunnel and a parking garage to evaluate emissions factors and to assess methods for evaluating total vehicle emissions. From the measurements it was possible to deduce emissions factors appropriate to California vehicles and to compare these with emissions factors that were being used for the California Air Quality computer program (EMFAC7C).
According to the SCAQS tunnel study, measured CO and VOC emissions rates in the tunnel were a factor of 2.7 ± 0.7 and 3.8 ± 1.5 higher, respectively, than predicted by CARB's EMFAC7C model for estimating emissions from on-road vehicles; NOx emissions rates agreed reasonably well with model predictions. The EMFAC7C emission factors were calculated with the assumption that all the vehicles in the tunnel had reached their stable operating temperature. The actual fraction of vehicles in the cold operating mode was not known. Inclusion of cold operating mode, (contributing increased CO and VOC emissions) and running losses (contributing increased VOC emissions) would reduce the discrepancies between measured and predicted CO and VOC. Pierson (1990) has considered the extent to which inclusion of both cold operation and running evaporative losses could reconcile the discrepancies between measured and predicted CO and VOC emissions. He showed that even if 100% of the vehicles in a tunnel were operating in the cold mode, the VOC data could not be explained on this basis. Thus, no admixture of cold and hot start can account for the discrepancies between experiment and predictions using EMFAC7C. With regard to running losses, Pierson (1990) considered methane and the sum of C4 hydrocarbons (a subset of VOCs) from the tunnel experiment, together with published abundances of methane and total C4 hydrocarbons in exhaust and evaporative emissions, and conclud-
Page 286
ed that running-loss evaporative emissions could have been no more than about 30% of the hydrocarbon mass.
Pierson et al. (1990) have analyzed results from past tunnel studies, including the SCAQS tunnel study, to compare the studies' measured emissions with those predicted by mobile-source emissions models. The instances in which on-road CO and VOC measurements have been directly compared with model predictions are only the 1979 and 1981 Allegheny Tunnel, 1983 North Carolina, and the 1987 Van Nuys (SCAQS) tunnel experiments. Aside from the SCAQS tunnel study, a dear underprediction of absolute CO or VOC emission rates exists in only one-fourth of the cases (Pierson, 1990). Underprediction of CO/NOx or VOC/NOx, however, is found without exception. CO/ NOx is underpredicted consistently by a factor of about two. The inescapable conclusion from the comparison between on-road data and the results from emissions models is that vehicles on the road have higher CO/NOx and VOC/ NOx ratios, or "run richer," than the models predict.
Roadside Measurements
Three approaches to monitoring roadway vehicle emissions for the purpose of evaluating emissions factors and emissions models have been considered. Two methods use ambient measurements near roadways to estimate vehicle emissions indirectly; a third uses remote sensing to monitor vehicle emissions directly on the road.
The first approach uses field measurements designed on the principle of conservation of mass. The experimental design requires measuring the vertical concentration profiles of chemical constituents and appropriate meteorological parameters (for example, wind speed and direction, temperature, and turbulence) upwind and downwind of the road, the source region. Such measurements allow the determination of the net mass flux (in units of mass/area-time) due to vehicle emissions on the roadway. This technique has been used (Bullin et al., 1980; Hlavinka and Bullin, 1988) to determine CO emissions factors along an interstate highway, and the results have been compared with the MOBILE3 emissions model.
The use of an added inert tracer, sulfur hexafluoride (SF6), released by a pace car in traffic to determine dilution effects is another technique (Cadle et al., 1976; Zweidinger et al., 1988) that has been applied to study on-road vehicle emissions. By using measurements of ambient concentrations of the tracer and the vehicle source gases, with knowledge of the tracer emission rate, it is possible to estimate the emissions rate of the composite vehicle fleet on the road.
Page 287
The third and by far most promising development in roadway vehicle emissions testing has evolved from new real-time in situ remote-sensing instruments that measure CO emissions from thousands of vehicles during normal on-road operation (Bishop et al., 1989; Bishop and Stedman, 1990; Lawson et al., 1990a; Stephens and Cadle, 1991). The technique uses a collimated infrared source placed to direct a beam across the road about 0.33 meters above the road surface to an infrared detector filtered appropriately for the spectral absorption regions of interest (CO and CO2). The equipment also monitors the reference source. The Bishop et al. (1989) instrument uses a rotating gas filter correlation cell with one detector to alternately sample infrared intensity at two separate spectral regions; the Stephens and Cadle (1991) instrument uses three separate detectors to monitor the attenuated infrared beam over the spectral regions specified. A limited intercomparison of the two techniques (Stephens and Cadle, 1991) showed good agreement, with 294 direct measurement comparisons of CO/CO2.
Field tests of the remote-sensing technology have been performed in Denver, Colorado (Bishop and Stedman, 1990), and in the Lynwood area of Los Angeles (Lawson et al., 1990a). The Denver study sampled CO emissions from 117,000 vehicles at two locations in the area. The study reported that half of the CO emissions produced by the sampled vehicle population were from 7.0-10.2% of the vehicles, depending on location and time of day. More than 70% of the vehicles were measured to be emitting less than 1% CO. During the testing period of the state's oxygenated fuels program, a statistically significant decrease of 16±3% in average CO emissions was observed at the two locations and was independent of initial emissions for the 25% highest emitters in the fleet and insignificant for the remaining 75%.
The Lynwood study was a pilot to assess the accuracy of the remote-sensing technique and to demonstrate its application in performing roadside vehicle inspections. Specially equipped vehicles were used to make on-board exhaust CO measurements in a series of blind and double- blind tests. The remote-sensing technique performed with an accuracy of ± 10%. The remote sensing of 2771 vehicles on La Cienega Boulevard in the Lynwood study showed that 10% of the sample population was responsible for 55% of the total CO emissions, averaged on a basis of grams CO per gallon of fuel burned. The 10% all registered CO emissions values greater than 4%. In a limited sample of 60 vehicles, it was found that most vehicles for which the remotely sensed CO reading was greater than 2% failed on-site roadside inspections. The roadside data set was compared with data from the biennial smog-check tests (California's Inspection/Maintenance program) for the same vehicles. It was observed that CO and exhaust VOCs from high-emitting vehicles were much higher than when the vehicles received their routine inspections. Further-
Page 288
more, for the high-emitting vehicles in the data set, the length of time since the biennial smog check had little influence on the cars' emissions in the roadside inspection.
Measurements from roadside tests, tunnel studies, and remote sensing of in-use vehicles present consistent and compelling evidence that vehicles on the road have substantially higher CO and VOC emissions than current emissions models predict. Moreover, data from roadside tests and remote sensing indicate that the problem is with a relatively small number of high-emitting vehicles; 10% of the vehicles are responsible for almost 60% of the CO. Another 10%, but not necessarily the same vehicles, are responsible for almost 60% of the VOCs. Although new cars are required to emit no more than 0.04 g/mile of VOCs, the vehicle fleet has an average nearly two orders of magnitude higher. The higher-than-predicted CO/NOx and VOC/NOx ratios in tunnel and roadside tests suggest richer operation of on-road vehicles than predicted or than observed in the vehicle dynamometer tests that serve as the model inputs. Issues that must be addressed to make the emissions models more realistic include (Gertler et al., 1990):
• Representativeness of volunteer fleets used in dynamometer testing
• Speed correction factors
• Running loss evaporative emissions
• Limitations in sampling statistics
Also, the FTP is designed to provide vehicle certification using a dynamometer, which is not a real-world driving simulation, so results from the FTP must be used with great caution when extrapolating to actual on-road conditions.
Atmospheric Measurements Versus Emissions Inventories
The distribution of chemical compounds in the atmosphere is governed by source characteristics and locations, air mass transport patterns, and the nature of the processes through which individual species are removed. All of these processes acting in concert must be understood in detail if the atmospheric measurements of the compounds are to be used to extract information concerning any one of them. This section reviews existing atmospheric measurements and their potential usefulness in addressing questions about the accuracy of emissions estimates for various sources.
The relative composition of VOCs in ambient air has been used as an
Page 289
indicator of different source contributions to the atmosphere by Stephens and Burleson (1967, 1969), Altshuller et al. (1971), and Mayrsohn and Crabtree (1976). Lonneman et al. (1968), Pilar and Graydon (1973), and Ioffe et al. (1979) discussed the use of the ratio of toluene-to-benzene concentration measured in ambient air to discern the contribution of automobile exhaust to VOCs measured in urban air. Whitby and Altwicker (1978) reviewed the use of acetylene as a tracer of urban pollution and discussed the use in numerous studies of compound ratios to acetylene as applied to source determination. A critique of the approaches that are used to deduce these and other quantities from atmospheric measurements has been published by McKeen et al. (1990).
The ozone precursors, VOCs (excluding CH4) and NOx, are introduced into the atmosphere from a variety of natural and anthropogenic sources. The anthropogenic emissions of these compounds are concentrated, usually around urban areas, and emissions are reasonably uniformly distributed throughout the year. The natural sources, by contrast, tend to be widely dispersed, highly variable, and seasonal, with peak emissions usually occurring in the summer.
In the case of the VOCs the principal compounds emitted from natural sources, the terpenoid compounds, are not emitted by anthropogenic sources. As a consequence, if the measurement of the VOCs in the atmosphere also determines the identities of the compounds, the attribution of these compounds to natural or anthropogenic sources is straightforward.
Urban Measurements
Because most of the concern to date about elevated ozone concentrations has focused on urban pollution, most measurements have been made in urban areas, which have large anthropogenic sources of ozone precursors. The concentrations of these compounds in the urban atmosphere are large and easily measured. However, because the measurement sites are embedded in a complex matrix of different sources, the measurements are highly variable, and there is little prospect of successfully estimating the strength of a particular source, such as automobiles, or a particular compound, such as NOx, from the atmospheric measurements of that compound. The aim rather has been to establish the relative emissions of the various classes of ozone precursors—NOx, VOCs and CO—from the combination of all the sources of those compounds in the urban area, and interpretations have focused on the relative concentrations of the compounds.
Many of the uncertainties associated with source analyses can be reduced by examining a well-defined plume from a concentrated source, undertaking
Page 290
measurements when removal processes are at a minimum, or by making measurements with more reliable and sensitive measuring techniques.
Measurements made in the free atmosphere are much less definitive in establishing the relative importance of emission sources. Most of the measurements carried out in the atmosphere were not designed to determine source strength, distribution, or allocation, but rather to establish concentrations of the compounds for model simulations of ozone production or to elucidate the photochemical processes that control ozone production.
The range and variability found in VOC/NOx is reflected in measurements made in 29 cities across the eastern and southern United States during the summers of 1984 and 1985 (Baugues, 1986). VOC/NOx was determined in 10 of the cities both years. The measurements were made during the morning rush hours, between 6:00 a.m. and 9:00 a.m. By measuring in the early morning, the effects of daytime photochemistry on the relative concentration of the compounds would be minimized. However, because most of these samples were taken in urban centers, the contribution of auto exhaust emissions relative to emissions from heavy vehicles or from stationary industrial sources may very well be overemphasized.
The results of these measurements are shown in Figures 9-8 and 9-9. The figures show the average and median VOC/NOx, along with the standard deviation of the ratios. Excluding one set of measurements (West Orange, Texas), which was judged to be inaccurate, the average VOC/NOx in the 29 cities studied was found to vary between 7.9 (Cleveland, Ohio; 1985) and 69 (Beaumont, Texas; 1985). In general, the largest ratios were found in the cities in Tennessee and Texas. These cities have industrial petrochemical sources, and higher ratios of VOC to NOx are found there than are found from the typical mix of source categories in other urban areas.
Baugues (1986) used acetylene as a mobile-source tracer to establish the percentage of the VOC emissions associated with mobile sources. Tunnel studies show that acetylene accounts for approximately 3.7% of the VOC emissions from mobile sources (Whitby and Altwicker, 1978; Baugues, 1986). The results from the Baugues study of such comparisons for seven cities are listed in Table 9-10.
In all cases, the percentage of VOCs from mobile sources is much greater than the percentage of the mobile-source emissions used in each State Implementation Plan. Again, this difference is attributed to higher emissions of VOCs from operating vehicles than are estimated from emission factors deduced from measurements made on test vehicles.
Because of the choice of urban locations for these studies, little attention was given to emissions from natural sources. However, when biogenic emissions were measured, they usually represented a very small fraction of the
Page 291
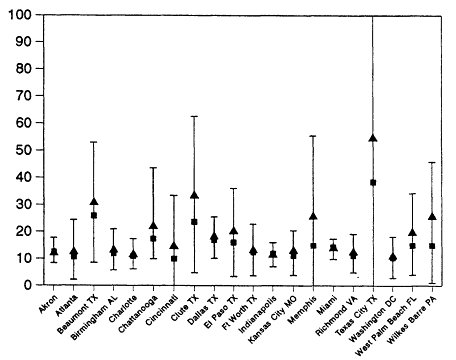
Figure 9-8
VOC/NOx ratios measured in urban locations in the United States during the
summer of 1984. (VOCs do not include methane.) These measurements were
made during the morning rush hour, 6:00 a.m. to 9:00 a.m. The triangles are the
averages of the measurements made at each site and the bars show the standard
deviation. The squares are the median. Adapted from Baugues, 1986.
total. Measurements by Baugues (1986) determined the concentrations of the VOCs found in the urban sites. The medians of the mixing ratios (in parts-per-billion carbon) of isoprene and a-pinene for 10 cities that were studied during the summers of 1984 and 1985 are listed in Figure 9-10. For comparison with the anthropogenic VOCs, the percentage concentrations of the natural VOCs to the total are plotted in Figure 9-11 for these 10 cities. The natural VOC fraction ranged between 0.23% (Indianapolis, Indiana, 1984) and 1.9% (West Orange, Texas, 1985) of the total VOCs. (Beaumont, Texas recorded 9.9% of the total NMHCs as natural in 1985, but these data are considered questionable). Baugues (1986) presented the data as support for the
Page 292
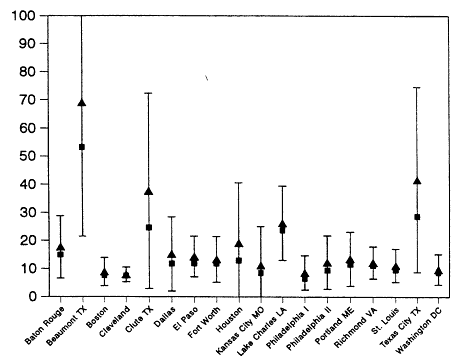
Figure 9-9
VOC/NOx ratios measured during summer 1985. (VOCs do not include methane.)
These measurements were made during the morning rush hour, 6:00 a.m. to 9:00
a.m. The triangles are the average of the measurements made at each site and the
bars show the standard deviation. The squares are the median. Adapted from Baugues, 1986.
contention that anthropogenic emissions are the predominant sources for the ambient VOCs concentrations recorded in urban areas.
In assessing the implications of this finding, several factors must be considered. First, as discussed in Chapter 5, the natural VOCs are, in general, more reactive than are the anthropogenic VOCs. As a consequence, any chemical processing of the VOCs that occurs before early-morning samples are taken will tend to increase the concentrations of the anthropogenic VOCs relative to those of the more reactive natural VOCs. Second, because of their greater reactivity, the natural compounds tend to be discriminated against in the sampling method (container sampling) used to collect the data. This discrimination tends to reduce the measured concentrations of natural VOCs relative
Page 293
| TABLE 9-10. | |||
| City | Percentage of 1980 emissions inventory | Estimated from measurements | Year |
| Boston, Massachusetts | 46 | 82 | 1985 |
| Philadelphia, Pennsylvania | 32 | 50 | 1984 |
| 69 | 1985 | ||
| Washington, D.C. | 66 | 87 | 1984 |
| 96 | 1985 | ||
| Cincinnati, Ohio | 41 | 50 | 1984 |
| Cleveland, Ohio | 45 | 70 | 1985 |
| Houston, Texas | 26 | 39 | 1985 |
| St. Louis, Missouri | 27 | 63 | 1985 |
| Source: Baugues 1986 | |||
to the anthropogenics. Third, because of the temperature and light dependence, the emissions of the natural VOCs will tend to increase during the daytime and peak during the periods of greatest photochemical activity. Finally, the concentration of samplers near street-level in downtown areas tends to discriminate against natural VOCs, whose sources tend to be concentrated in areas outside the core city. These measurements, therefore, might not be a reliable gauge of the importance of the natural compounds in the portion of the atmosphere responsible for the ozone sampled at these urban locations.
Page 294
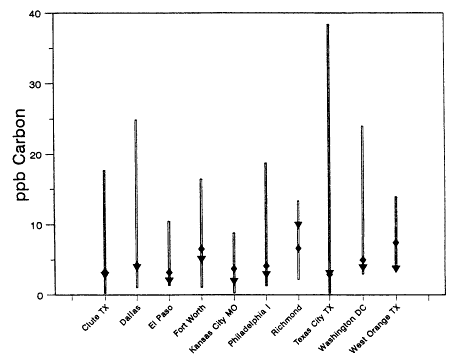
Figure 9-10
Biogenic VOC concentrations (ppb Carbon) measured during the summers of
1984 and 1985. The medians of the concentrations of isoprene and a-pinene
are listed for 10 cities studied during both summers. The 1984 measurements
are the triangles; the 1985 measurements are the diamonds. Bars represent the
range of concentration. Adapted from Baugues, 1986.
Rural Measurements
As air masses leave the urban areas, they mix with air masses from other urban centers that can contain a somewhat different mix of ozone precursors. To this mixture are added the emissions from more isolated industrial sources or power plants, with their characteristic emission patterns. In addition, there is a relatively large input of natural compounds; in particular, the emissions of VOCs from forests. Photochemical processing and deposition serve to reduce the concentrations of the more reactive and polar compounds relative to the less reactive and nonpolar compounds. Finally, as the concentrations of the compounds are reduced through dilution, chemical destruction, and
Page 295
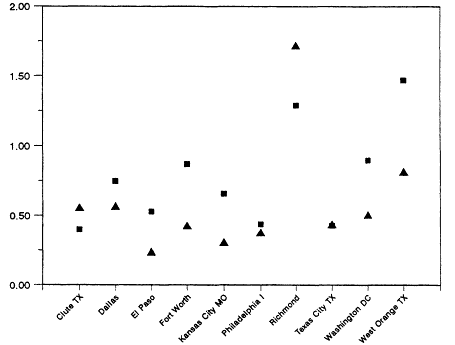
Figure 9-11
Percentage of biogenic VOCs compared with total VOC measured during the summers
of 1984 and 1985. (The VOCs do not include methane.) The medians of the percentage
contribution of isoprene and a-pinene to the total VOCs for 10 cities studied during
both summers are listed. The 1984 measurements are the triangles; the 1985 measurements
are the squares. Adapted from Baugues, 1986.
deposition, the difficulties associated with measurement increase the chance of sizable errors in measurement. This makes the extraction of useful information for emissions inventories extremely difficult. However, large data sets measured with high-quality instruments afford some interesting insights.
As is the case in the urban studies, atmospheric measurements made in rural areas are not very reliable for establishing the relative importance of emissions sources. Most of the measurements are not designed to determine source strength, distribution, or allocation, but rather to establish air concentrations of the compounds for model simulations of ozone production or to indicate the photochemical processes that control ozone production. In addi-
Page 296
tion, there have been no long-term studies of rural areas that reveal the trends in the emissions of these compounds.
Dodge (1989) suggested that aged urban air reaching rural locations has a ratio of VOC to NOx of 17:1. To this would be added local emissions dominated by stationary rather than mobile sources with VOC/NOx ratios of 2:1. In those simulations natural VOCs also were added in varying amounts to test sensitivities of the mechanism to the compounds. This scenario would suggest that the VOC to NOx ratio in rural areas depends strongly on the photochemical processing of the compounds and on the effect of urban versus local anthropogenic or natural sources.
During the summer of 1986, D.D. Parrish (pets. comm., NOAA, 1990) observed a daytime VOC/NOx ratio of 7.2:1 at a rural site in western Pennsylvania. Of the total non-methane hydrocarbons, 45% were identified as natural, with the dominant natural compound being isoprene. The bulk of the remaining compounds were alkanes (39%) and aromatics (8%), presumably anthropogenic. Neglecting the biogenic hydrocarbons, the VOC/NOx ratio was approximately 4:1. This is much lower than the ratios typically registered in the urban locations.
A principal-components analysis was carried out on a similar data set obtained at this site in 1988 (M.P. Buhr, pets. comm., University of Colorado, 1990). This analysis indicated that the atmospheric concentrations of alkanes, aromatics, and CO correlated with each other, suggesting they are dominated by anthropogenic, probably mobile, sources. NOx on the other hand correlated most strongly with SO2, suggesting that NOx was most strongly associated with stationary anthropogenic sources.
By contrast, in 1987 similar measurements were carried out at a rural site in the Colorado mountains (D.D. Parrish, pers. comm., NOAA, 1990). In this case VOC/NOx was 15.2:1. Of the total VOCs, 28% were identified as natural, principally terpenes. Neglecting the biogenic compounds, VOC/NOx was approximately 11:1. This is very similar to the ratios typically registered in the urban locations. The bulk of the remaining compounds were alkanes (58%) and aromatics (9%), presumably of anthropogenic origin. A principal-components analysis was carried out on a similar data set obtained at this site in 1989 (M.P. Buhr, pets. comm., University of Colorado, 1990). This analysis indicates that the anthropogenic VOCs and NOx correlated with each other, suggesting they are dominated by an anthropogenic urban source, the Denver metropolitan area.
It must be recognized that these rural measurements are strongly biased. The measurements were made at the surface in forest clearings. Hence, they tend to amplify the concentration of the natural VOCs relative to anthropogenic VOCs. A much lower relative concentration of these compounds could
Page 297
be expected on average throughout the boundary layer.
In addition to the VOCs, CO was measured at the rural locations in Pennsylvania and Colorado, as well as a suburban site near Boulder. The lifetime of CO in the atmosphere is long enough that there is a global background concentration, which is known to vary systematically with season because of photochemical processing. For Northern Hemisphere midlatitudes, the CO concentration varies between 127 parts per billion in winter and 84 ppb in summer (Seller et al., 1976). For this reason the amount of CO relative to NOx or VOC measured in the atmosphere will be greater than the relative amounts contained in the primary emissions depending on the degree of photochemical processing that has occurred between the point that the emissions entered the atmosphere and the location where this air mass is sampled. Thus, when the concentrations of NOx and the NMHCs are large near anthropogenic sources, the ratio of NOx or NMHCs to CO will approach the ratio of compounds expected for that source. Likewise, in so far as NOx, the NMHCs, and CO are derived from anthropogenic sources, when NOx or the NMHCs become quite sparse the concentration of CO will approach background levels.
Figure 9-12 shows the mixing ratio of CO versus NOy (NOx + PAN + HNO3 + ...) measured near Boulder (Parrish et al., 1991). NO. is the more conserved atmospheric reservoir of the primary NOx emissions because NOy comprises NOx as well as its oxidation products. The curves on the graph show the expected relationship between CO and NOx if the CO concentration is equal to the wintertime CO background mixing ratio, 127 ppb, along with the CO emitted by sources that have a CO/NOx ratio of 5:1, 10:1, or 20:1. During this period, when photochemical processing is reduced, the data indicate that the sources of anthropogenic emission influencing the atmospheric concentrations of these compounds have a CO/NOx ratio of 10:1 to 20:1. This can be compared with a CO/NOx ratio for the Denver metropolitan area of 7.3:1 estimated by the 1985 NAPAP inventory or 8.2:1 estimated by the Colorado Department of Health (R. Graves, pers. comm., 1990).
Atmospheric Measurements Versus Emissions Inventories
Fujita et al. (1990) compared CO/NOx and VOC/NOx derived from ambient measurements taken between 7:00 a.m. and 8:00 a.m. at eight sites in the South Coast Air Basin of California during the summer phase of the 1987 South Coast Air Quality Study (SCAQS) (Lawson, 1990) with corresponding ratios derived from the day-specific, gridded emissions inventory for the same
Page 298
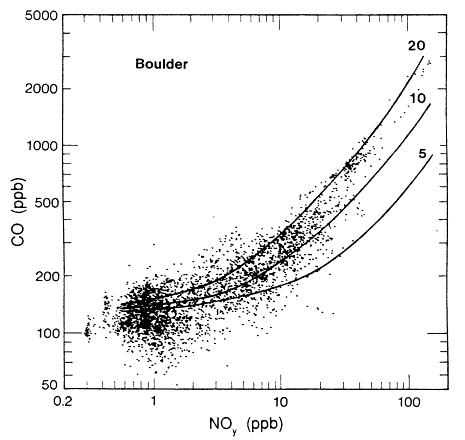
Figure 9-12
Correlation between CO and NO measured at a suburban site in Boulder. NOy
comprises NOx and its oxidation process. The individual 5-min averages of the
measurements are shown. The background CO concentration for this season was
taken to be 130 ppb. The curves indicate the various emission ratios of CO and NOy
being added to this background CO concentration. Source: Parrish et al., 1991.
period. Similar ambient CO/NOx ratios at each of the monitoring locations measured at the same times suggested a common emissions source. Both the ambient CO/NOx and VOC/NOx ratios were about 60-80% higher than corresponding ratios derived from emissions inventories (Figures 9-13 and 9-14). The accuracy of the VOC speciation was evaluated by comparing the
Page 299
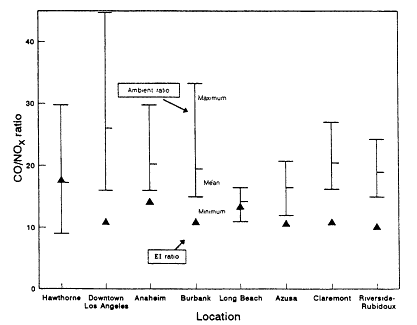
Figure 9-13
Ambient versus inventory CO/NOx ratios, South Coast Air Basin, August 1987.
Excludes NOx concentrations <50 ppb. EI refers to CO/NOx ratios derived from
emissions inventory data (![]() ). Ambient ratio refers to ratios obtained from ambient
). Ambient ratio refers to ratios obtained from ambient
measurements taken between 7:00 a.m. and 8:00 a.m. Source: adapted from Fajita et al., 1990.
composition of emissions at the monitoring sites with the observed ambient composition.
Figure 9-15 is a comparison of VOC/NOx derived from ambient measurements and the emissions inventory for seven cities (Morris, 1990); the mismatch is believed to be a nationwide phenomenon.
Summary
For 2 decades, EPA has compiled inventories of emissions of volatile organic compounds (VOCs), oxides of nitrogen (NOx), and other airborne pollutants. As sophisticated air quality models have been developed, emissions inventories have been expanded to provide detailed information on
Page 300
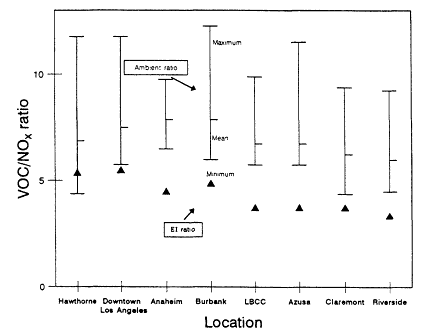
Figure 9-14
Ambient versus inventory VOC/NOx, South Coast Air Basin, August 1987.
Excludes NOx concentrations <50 ppb. EI refers to VOC/NOx ratios derived
from emissions inventory data (![]() ). Ambient ratio refers to ratios obtained from ambient
). Ambient ratio refers to ratios obtained from ambient
measurements taken between 6:00 a.m. and 9:00 a.m.
chemical speciation of VOCs, spatial and temporal patterns of inventoried species, and projected trends in emissions. The development of sound ozone control strategies requires knowledge of the precision and accuracy of emissions estimates. However, estimates of the uncertainty in emissions data have, for the most part, been highly subjective. The methods used to estimate emissions have not been adequately checked by intercomparison or field measurements.
Ambient monitoring data from many urban and rural areas of the United States, along with data from roadside motor vehicle emissions tests, tunnel studies, and remote sensing studies of on-road vehicle exhaust, show that current inventories underestimate anthropogenic VOC and carbon monoxide (CO) emissions by large margins. The motor vehicle portion of the emissions inventory has been demonstrated conclusively to underestimate VOC and CO emissions. Moreover, roadside tests and remote-sensing data indicate that
Page 301
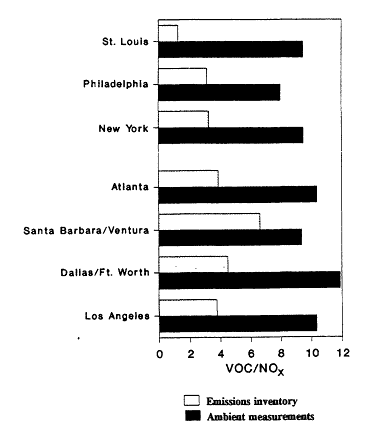
Figure 9-15
Comparison of VOC/NOx ratios derived from ambient measurements and
emissions inventories for seven cities. Source: Morris et al., 1990.
approximately 10% of the vehicles on the road contribute at least 50% of the CO and VOC emissions. The VOC bias in current emissions inventories is a serious impediment to progress in designing effective ozone reduction strategies.
These findings have substantial national implications for strategies to control VOCs. A rigorous program to resolve differences between on-road emissions and those predicted by emission models must be undertaken immediately. Resolution of the on-road versus model-predicted vehicle emission rates will have to account for the mass emission rate differences as well as the
Page 302
emission rate ratios that imply rich on-road operation. Issues such as super-emitters, speed-dependent emission rates, and off-cycle operation must be considered.
Biogenic VOC emissions appear to be of comparable magnitude to anthropogenic VOC emissions in the United States as a whole. Biogenic emissions can also be a significant source of VOCs in urban airsheds. For yearly or seasonal periods, these emissions are not well quantified. Moreover, because of the large variability in emissions that can occur over the growing season, much larger errors can be incurred when annual or seasonal inventories are applied to a given single- or multiple-day episode of high ozone concentrations. Because natural VOC emissions tend to be highly reactive and to increase during the day, past measurements of these emissions may have understated their importance relative to anthropogenic VOC emissions. Much research is needed to improve the methods used to calculate biogenic VOC emissions.
If VOC emissions have been underestimated as much as the studies discussed in this chapter suggest, then VOC emission reductions in many areas of the United States will be less effective than was previously believed (see Chapters 6 and 11). Hence a major upward revision in VOC emissions inventories could force a fundamental change in the nation's ozone reduction strategy, which has been based primarily on VOC control.


