
Page 41
2
Trends in Tropospheric Concentrations of Ozone
Introduction
Various levels of government monitor the concentration of ozone in the ambient air (the troposphere) to document the severity of the ozone problem and to measure progress in reducing ozone concentrations. The U.S. Environmental Protection Agency (EPA) has developed a National Ambient Air Quality Standard (NAAQS) for ozone that is intended to provide a margin of safety for the protection of public health and welfare, and its attainment has been pursued in many areas of the country.
Despite comprehensive local, state, and national regulatory initiatives over the past 20 years, ambient ozone concentrations in urban, suburban, and rural areas of the United States continue to be a major environmental and health concern. Sixty-three areas did not meet the ozone NAAQS in 1987; 101 areas were out of compliance in 1988, 96 areas in 1989, and 98 areas in 1990 (see Table 1-1 and Figure 2-1) (EPA, 1990a; EPA, 1991a; EPA/OAQPS, 1991). The nationwide extent of the problem, coupled with the increased public attention resulting from the high concentrations of ozone over the eastern United States during the summer of 1988, add to the urgency for developing effective approaches to reduce the risk to public health and welfare (as measured by the effects of pollution on vegetation, materials, and visibility). The 1990 amendments to the Clean Air Act present a broad ozone attainment strategy that will require areas violating the ozone NAAQS to demonstrate reasonable further progress in reducing precursor emissions (see Chapter 3). The success of these efforts to control the precursors to ozone will be of vital
Page 42
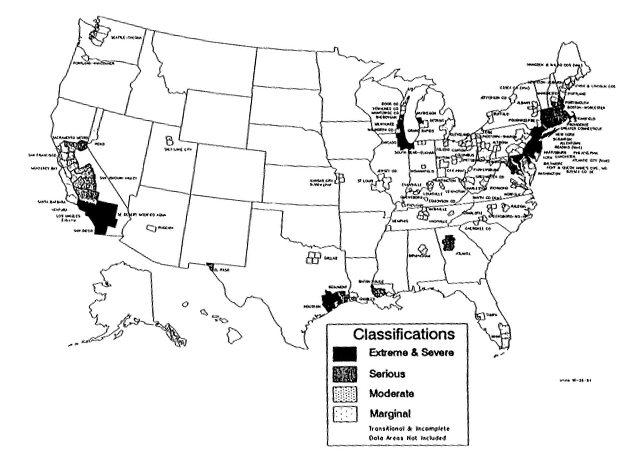
Figure 2-1
Nonattainment areas
Page 43
concern to Congress; to federal, state, and local regulatory agencies; to industry, and to the public.
It is important that areas not in attainment of the NAAQS be able to track their progress in reducing ozone. A downward trend in ozone concentrations over several years might suggest that emission controls are having the desired effect, whereas the absence of such a trend might suggest the need for additional controls. However, analyses of ambient-air-monitoring data for ozone in major U.S. cities indicate that. the number of days on which ozone concentrations exceed the NAAQS 1-hour average concentration of 120 parts per billion (ppb) varies widely from one year to the next (Stoeckenius, 1990). EPA's principal statistical measure of ozone trends, the composite average of second-highest daily maximum 1-hour concentrations in a given year, also varies considerably from year to year. Furthermore, there is no discernible downward trend (EPA, 1991a). A substantial portion of this variability is attributable not to year-to-year changes in precursor emissions, but to natural fluctuations in the weather. Meteorologically induced variability makes it difficult to identify underlying trends in ozone concentrations that could result from changes in the amount, type, and geographical distribution of precursor emissions. This chapter outlines the existing form of the ozone NAAQS, summarizes studies on ozone trends, evaluates recent efforts to screen meteorological influences on ozone trends, and highlights research needs for more robust indicators of progress in reducing ozone concentrations.
National Ambient Air Quality Standard For Ozone
To guide in monitoring and controlling ambient concentrations of ozone, EPA has developed ambient air quality standards for ozone. The national form of the ozone NAAQS is explicitly defined in the U.S. Code of Federal Regulations (40 CFR 50.9(a)), in part:
The [ozone] standard is attained when the expected number of days per calendar year with a maximum hourly average concentration above 0.12 part[s] per million (235 µg/m3) is equal to or less than 1, as determined by Appendix H [of the regulations].
Appendix H provides a method to account for incomplete monitoring data and allows the number of days exceeding the standard each year to be averaged over the past 3 calendar years. An area is in compliance as long as this average remains less than or equal to one (McCurdy and Atherton, 1990).
Page 44
A complete standard requires at least eight attributes, as shown in Table 2-1 for ozone (McCurdy, 1990). Although not all of them are formally specified for many NAAQS or for other air pollutant standards, each can be important in developing a standard to protect the public health, in assessing the attainment status of a region, or in determining progress in reducing exposure concentrations.
The first, second, and fifth attributes shown in Table 2-1 are those most commonly considered in relation to the ozone NAAQS. For the existing ozone NAAQS, the averaging time is 1 hour, but ozone trends have been examined using averaging times of 7, 12, and 24 hours for a given day, and the Occupational Safety and Health Administration exposure standard for ozone is based on an 8-hour averaging period. The second attribute does not have a good name, but was described by McCurdy (1990) as the period over which short-term monitoring data are aggregated for purposes of comparison with the standard. Only the highest hourly value in a day is compared with the NAAQS concentration evaluation level (CEL), the fifth attribute, to determine whether the CEL of 120 ppb is exceeded. In some cases, monthly or quarterly averages of the daily maximum value have been used as a basis for determining a trend.
The third attribute of a NAAQS, the frequency of repeated peaks allowed before a violation is declared, has not been applied to the ozone NAAQS. The fourth attribute, the epoch, is the period over which ozone exceedances can occur and in which ozone data can be collected. This attribute is important when percentile rank statistics are used to evaluate trends. (A percentile rank is the percent of measurements out of the total that fall at or below that rank.) For example, Korsog and Wolff (1991) have reported that the 95th percentile statistic used in California (yearly monitoring), would correspond to the 80th percentile in areas where only 3 months' data were collected, because the top five percentile points for yearly monitoring correspond to the top twenty percentile points for 3 months' data.
The sixth and seventh attributes shown in Table 2-1 are the standard statistics and the allowed violation rate. For the ozone NAAQS, these correspond to a maximum of 1 expected day per year exceeding the daily CEL, averaged over a 3-year period. Thus, 4 days exceeding the CEL over 3 years constitute a violation of the NAAQS. The last attribute is a combination of data handling and analyses methods that are used to determine NAAQS violations (and design values as discussed in Chapter 3). Decisions needed for this determination might be whether to use the highest monitor reading in a region or an average of all readings; what analytical method to use to monitor for ozone; and how to record, average, or round off the data.
As discussed in Chapter 1, alternatives to the current 1-hour averaging time
Page 45
| Table 2-1 | |||
| Attribute | Current NAAQS | Alternative NAAQS formulations | |
| SUMO6 | 8-hour mean | ||
| Sampling averaging time | Clock hour | Clock hour | Clock hour |
| Temporal aggregation period | Maximum hour in each day | None | Maximum 8-hour average in |
| (1-hour daily maximum) | each day (8-hour daily | ||
| maximum) | |||
| Frequency of repeated peaks | a | a | a |
| Epoch | Ozone seasonb | Three consecutive months | April-October |
| Concentration evaluation level | 120 ppb | 60 ppb | a |
| (CEL) | |||
| NAAQS standard statistic | Expected exceedances of CEL | Number of hours | Mean of all 8-hour daily |
| maximums | |||
| Allowed violation rate | Three-year mean of annual | a | a |
| expected exceedances | |||
| Data-handling and analysis | Defined by Appendix H of | a | a |
| conventions | 40 CFR 50 and EPA guide- | ||
| line documentsc | |||
| aThe attribute is not used or is not yet defined;bOzone season is based on calendar months and varies by state; season length varies from 5 to 12 months; 'Includes such items as what constitutes a valid day of data, how missing values are handled, and what rounding conventions are to be used. | |||
| Source: McCurdy, 1990 | |||
Page 46
for the ozone NAAQS are being assessed as new health and ecological effects studies are completed and as new standards are considered. McCurdy (1990) reported that when all the attributes of a NAAQS are considered over a 3-year period, most short-term standards (those that use averaging times of less than 1 day) show a good correlation to the existing I-hour standard. However, the 1-hour maximum is not as well correlated to longer averaging times (monthly to seasonal).
National Trends In Tropospheric Concentrations of Ozone
As discussed above, an area is out of attainment with the ozone NAAQS when the expected number of days per year exceeding the allowed ozone concentration, averaged over the past 3 years, is greater than one anywhere in that area. Areas are defined by EPA and may consist of counties, Metropolitan Statistical Areas (MSAs), or Consolidated Metropolitan Statistical Areas (CMSAs). According to EPA, the number of areas in violation of the current NAAQS showed a general downward trend from 1984 until 1987, then increased substantially in 1988. Table 1-1 in Chapter 1 lists the number of areas not meeting the NAAQS from 1982 through 1989.
Little national progress is apparent in the number of areas reaching attainment between 1982 and 1989. Because attainment is based on an average of 3 years of data, high ozone concentrations in 1 year, such as 1988, will increase the number of areas exceeding the NAAQS for the following 2 years (1989 and 1990). Although the definition of areas was modified in 1987, the number and definitions of base areas remained fairly constant from 1987 to 1990.
Two kinds of measures are commonly used to monitor year-to-year trends: concentration indicators (such as the second highest 1-hour maximum ozone concentration) and threshold indicators (such as the number of days on which the I-hour daily maximum of 120 ppb is exceeded).
To complement its annual report on the number of areas out of attainment, EPA issues an annual analysis of trends for ozone and other criteria pollutants over the preceding decade. In 1991, the trends report included the 1989 data and a partial analysis of the 1990 data (EPA, 1991a). EPA's principal statistical measure of ozone concentrations is the composite nationwide average of second highest 1-hour daily maximum concentrations in a given year. EPA reported that this composite average decreased by 14% between 1980 and 1989 (Figure 2-2). However, according to the previous year's trends report (EPA, 1990a), ozone concentrations increased by 1% between 1979 and 1988. EPA also reported a decrease during the 1980s in the composite average of
Page 47
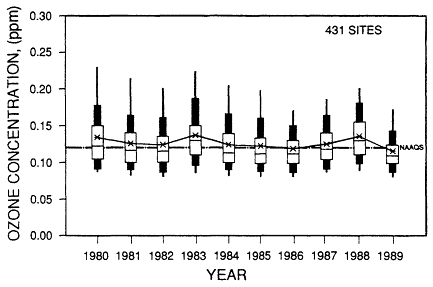
Figure 2-2.
Boxplot comparisons of trends in annual second highest daily maximum 1-hour
ozone concentration at 431 monitoring sites, 1980-1989. The trends in ambient
air quality, presented as boxplots, display the 5th, 10th, 25th, 50th (median), 75th,
90th, and 95th percentiles of the data, as well as the composite average. The 5th,
10th, and 25th percentiles depict the ''cleaner'' sites; the 75th, 90th, and 95th
depict the "higher" sites; and the median and average describe the "typical"
sites. For example, 90% of the sites would have concentrations equal to or lower
than the 90th percentile. Source: EPA, 1991a.
the expected number of days exceeding the maximum allowed 1-hour concentration of 120 ppb. From 1980 to 1989, the expected number of days exceeding the standard for the 431 ozone monitoring sites in the analysis fell by 53% (Figure 2-3). However, the number of days exceeding the standard increased by 38% between 1987 and 1988.
EPA has acknowledged that the trend has never been smooth. There are year-to-year fluctuations, and in some years (1983 and 1988, for example), ozone concentrations are much higher than average. Ozone concentrations in 1989 were much lower than in 1988 and were possibly the lowest of the decade. It has been suggested that meteorological variations can explain the high in 1988 and the low in 1989 (EPA, 1991a).
Page 48
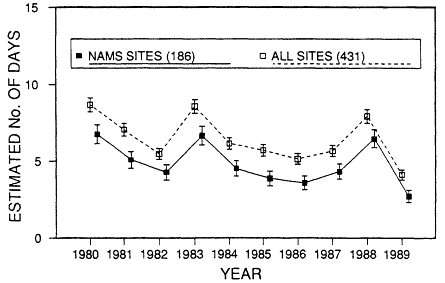
Figure 2-3.
National trend in the composite average of the estimated number of days exceeding
the ozone NAAQS concentration during the ozone season at monitoring sites, with
95% confidence intervals, 1980-1989. The National Air Monitoring Stations (NAMS)
sites were established through monitoring regulations promulgated by EPA (44
Federal Register 27558, May 10, 1979). The NAMS are located in areas with high
pollutant concentrations and high population exposures. These stations must
meet EPA's criteria for siting, quality assurance, equivalent analytical methodology,
sampling intervals, and instrument selection. "All sites" includes sites having
complete data for at least 8 of the 10 years under consideration. Source: EPA, 1991a.
Trends In Precursor Emissions
EPA has annually presented a trends analysis of emissions of oxides of nitrogen (NOx) and of VOCs (EPA, 1991a) to accompany its analysis of ozone. Between 1980 and 1989, annual VOC emissions were reported to have decreased by 19% (Figure 2-4), while annual NOx emissions were reported to have decreased by 5% (Figure 2-5). As discussed later in the report, however, the methods EPA uses to estimate precursor emissions are flawed (see Chapter 9). In particular, it is believed that emissions of anthropogenic and biogenic VOCs have been significantly underestimated.
Page 49
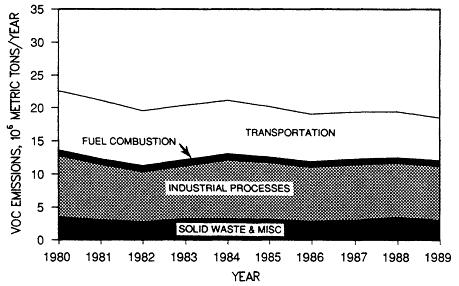
Figure 2-4.
National trend in VOC emissions, 1980-1989. Source: EPA, 1991a.
Although nationwide reductions in precursor emissions and ozone concentrations between 1980 and 1989 have been reported, little relationship has been demonstrated between year-to-year variations in ozone concentrations and changes in estimated precursor emissions. For example, there was no increase in precursor emissions to accompany the large increase in ozone concentrations observed between 1987 and 1988. This increase, as discussed above, is believed to have been primarily the result of unusual weather in 1988.
There also has been a lack of correlation between changes in ambient concentrations of precursors and in emissions inventories. For example, in the California South Coast air basin, Kuntasal and Chang (1987) estimated that NOx emissions decreased by only 1% between 1970 and 1985, whereas ambient concentrations of NOx decreased by 30%. For VOCs, measured as non-methane hydrocarbons (NMHCs), ambient concentrations decreased by 33% and estimated NMHC emissions decreased by 40% during this period. The ambient concentrations of NMHCs decreased continuously, whereas estimated emissions of NMHCs have decreased much faster since the late 1970s. The discrepancy between measured precursor concentrations and emissions inventories is discussed further in Chapter 9.
Page 50
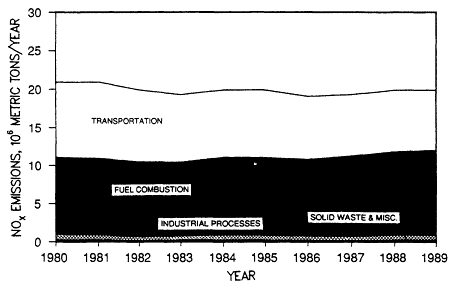
Figure 2-5.
National trend in NOx emissions, 1980-1989. Source: EPA, 1991a.
Ozone Trends Normalized For Meteorological Variation
The formation of ozone is heavily dependent on meteorological conditions (see Chapter 4). In fact, in most areas of the country, monitoring for ozone is not required during the 6 to 9 months when atmospheric conditions are not conducive to the formation of ozone.
The effect of weather on ozone formation has been studied a good deal over the past 20 years (e.g., Ludwig et al., 1977; Zeldin and Meisel, 1978). The most frequently examined relationship has been that between ozone formation and atmospheric temperature. For example, this relationship has been studied for the South Coast Air basin (Kuntasal and Chang, 1987), New England (Wolff and Lioy, 1978; Atwater, 1984; Wackter and Bayly, 1988), and Philadelphia (Pollack, 1986). Generally, the relationship of daily ozone concentrations to temperature is nonlinear. Ozone concentrations appear to show no dependence on temperature below 70-80ºF, but they become strongly dependent on temperature above 90ºF (Figure 2-6).
As discussed above, the current principal statistical measure of ozone concentrations, the composite average of second highest daily maximum 1-hour
Page 51
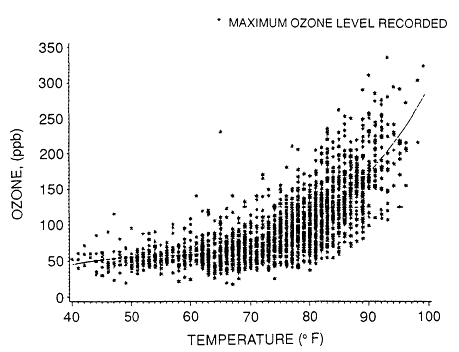
Figure 2-6
Connecticut daily maximum ozone vs. daily maximum temperature, 1976-1986.
Temperatures represent the average daily maxima at three inland sites. Source:
Wackter and Bayly, 1988.
concentrations, is highly sensitive to meteorological fluctuations. This measure masks underlying trends and is therefore not a reliable indicator of an area's progress in reducing ozone over several years. The following sections discuss various approaches to obtaining a measure of ozone concentrations that accounts for variations in meteorology. Three general approaches are discussed:
• Measurement—electing an ozone indicator that is less sensitive to variations in meteorology
• Classification—classifying ozone measurements by meteorological conditions
• Regression—correlating ozone measurements to meteorological conditions.
Page 52
Measurement Approaches: A More Robust Ozone Indicator
One way to account for weather is to use a more robust indicator of ozone trends, defined as an indicator that is not as strongly dominated by a single unusual meteorological event (Chock, 1988; see also Walker, 1985). Chock (1991) has emphasized that the meteorological fluctuations that result in large year-to-year variations in ozone concentrations are beyond human control. He has proposed that the number-of-exceedances statistic be replaced by a percentile rank order statistic (such as the 95th percentile) to determine the attainment status of a region, essentially replacing the more variable extreme-value statistic by a less variable, less extreme statistic. Reducing the influence of random fluctuations in the weather could assist in the establishment of consistent emission reduction strategies.
Several other potentially robust indicators of ozone trends have been proposed (Figure 2-7). These include the 95th percentile of the daily maxima (Chock, 1988) if data for a full year are collected or the 80th percentile (Korsog and Wolff, 1991) if data for only 3 months are collected. In companion studies to the EPA trends report, Niemann (1988) looked at 9-year trends (1979 to 1987) for selected urban and rural regions of the United States using monthly averages of a 1-hour maximum and 7-, 12-, and 24-hour averaging periods. McCurdy (1990) reported that nationwide, on the basis of the number of areas meeting the NAAQS, an 8-hour maximum concentration of 95 ppb would correspond to a 1-hour maximum of 120 ppb. Curran and Frank (1990) examined trends from 1979 to 1988 using a different set of alternative indicators, including the 99th, 95th, and 90th percentiles as well as the seasonal mean and the median. The trends for the seasonal mean were flat, but the trends for the three percentile indicators were similar to those observed for the second highest maximum ozone concentration (Figure 2-7). Little reduction in the overall year-to-year variation would be observed by using one of these percentile indicators.
One comprehensive study (Larsen et al., 1990), chartered under the California Clean Air Act of 1988, characterized the intrinsic uncertainty or "native variability" of 27 air-quality-related indicators in 43 areas within the state and determined the uncertainty intrinsic to each indicator in the absence of reduction of ozone concentrations. From this characterization, a list of approved indicators could be used to estimate progress in the attainment of air quality standards. About two-thirds of the measures examined were "concentration indicators" (95th-percentile concentration, annual average, mean daily maximum 1-hour concentration, etc.). The remainder were "threshold indicators" (number of days or hours exceeding a concentration threshold). As expected,
Page 53
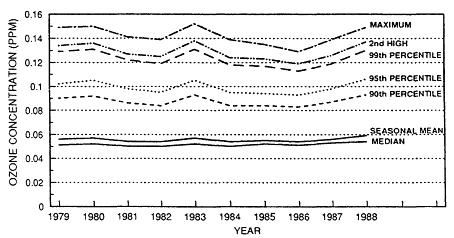
Figure 2-7
Ten-year trends in various ozone summary statistics. Ozone concentrations
represent composite nationwide averages for each summary statistic. Source:
Chock, 1988.
the most robust indicators were those that depend less on extreme values. The threshold indicators (with a native variability of 7-150% of the average number of exceedances) were much more variable than were the concentration indicators (with a variability of 1-20% of the average concentration). The indicator judged to be most promising was based on percentile-centered means (an average of 30 points centered around a percentile value of the distribution of ambient ozone concentrations).
In the South Coast air basin of California, progress has been evaluated by the South Coast Air Quality Management District (SCAQMD, 1989) using exposure measurements such as hours at or above 130 ppb (and above 200 or 350 ppb) for the average resident (Figure 2-8), and per capita ozone exposure in the basin (Figure 2-9). Exposure was presented in units of concentration multiplied by time (ppm-hours). In the former analysis (Figure 2-8), significant reductions in the number of hours above all concentrations were reported, with the number above 350 ppb reaching zero during 1986 and 1987 (from a high of 1.9 for 1978 and 1979). In the latter analysis (Figure 2-9), for the period from 1975 to 1987, it was reported that the basin's per capita exposure of ozone concentrations exceeding 0.12 ppm (120 ppb) showed an overall decrease of 38% (from 42.1 ppm-hours to 26.1 ppm-hours, respectively).
The robustness of an ozone trends indicator depends on its separation from the extreme values associated with the NAAQS. However, extreme ozone
Page 54
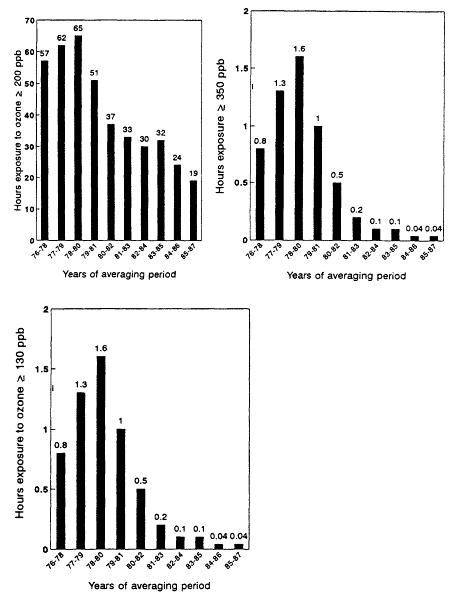
Figure 2-8
Three-year running mean of South Coast basin population-weighted ozone exposure hours
for the average resident. Source: SCAQMD, 1989.
Page 55
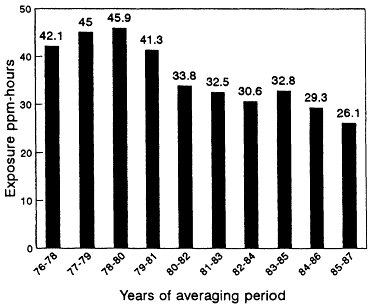
Figure 2-9
Three-year running mean of per capita ozone exposure in South Coast basin,
1976-87 (for all hours exceeding 120 ppb ozone). Source: SCAQMD, 1989.
concentrations threaten human health and welfare. Hence, it is a challenge to find a robust indicator that is not a mere statistical entity. To be a useful measure of an area's progress in reducing harmful concentrations of ozone, an indicator must bear some relation to those harmful concentrations.
Classification Techniques
Classification techniques move a step beyond the measurement approaches described above in that they attempt to account more explicitly for meteorological variability.
The first step necessary to account for meteorological effects is to determine what ozone data should be used in an analysis. Data often are selected to reduce the dependence of the analysis on the extreme values generally associated with the existing ozone NAAQS. Thus, trends are developed from violations of standards based on lower concentration cutoffs (105 ppb or 80 ppb) or using percentile distributions. Most of these measures have some
Page 56
association with the existing ozone NAAQS, in the form of either threshold violations or ozone concentrations. For threshold violations, Jones et al. (1989), Kolaz and Swinford (1990), and Wakim (1990) used the number of days on which the maximum ozone concentration was above 120 ppb (on any monitor in a city); Stoeckenius (1990) used the number of times during the year that the daily summary statistics exceeded 80 ppb or 105 ppb; Zeldin et al. (1990) used the number of days in California when the ozone concentration exceeded 200 ppb. Many ozone concentration measures have been used in trend analyses:
• The single highest daily maximum recorded by any monitor in a city (wakim, 1989)
• The average of the daily maxima for all monitors in a network, and the annual average of the daily measurements (Stoeckenius, 1990)
• The network average of the daily maximum hourly ozone concentration (Zeldin et al., 1990)
• The 75th percentile value from three months of daily 1-hour maxima from the highest monitor in a network (Korsog and Wolff, 1991)
• Three-month averages of the 1-hour daily maxima for 6, 9, and 13 stations in the South Coast Air Quality Management District (Kuntasal and Chang, 1987)
• The basinwide daily maximum oxidant concentrations (Chock et al., 1982; Kumar and Chock, 1984)
The simplest way to account for meteorological effects would be to determine the meteorological conditions associated with those days when there are high concentrations of ozone, then predict high- or nonhigh-ozone days, based on observed meteorological conditions. An ozone trend would be developed by normalizing the actual ozone data relative to the weather conditions that are conducive to high concentrations of ozone. The goal of this approach would be to determine the "ozone-conducive days" (Kolaz and Swinford, 1990) or high-ozone days (Chock et al. 1982; Pollack 1986). Kolaz and Swinford (1990) have classified days as ozone-conducive or not based on a meteorological index that requires several cutoffs to be exceeded. Chock et al. (1982) have calculated an ozone formation potential for the South Coast air basin that includes high, moderate, and low concentrations, then related this potential to five meteorological parameters. Korsog and Wolff (1991) have examined the significance of eight meteorological parameters for eight cities on the East Coast to select the high-ozone days for use in the trend analysis. Table 2-2 summarizes the weather conditions found to be important in classifying high-ozone days.
Where meteorological information is used to normalize ozone data collected on conducive days, the variability in the ozone trend can be reduced, but
Page 57
| Table 2-2 | |||||
| Meteorological Parameter | Chock et al. (1982) | Pollack | Korsog and Wolff | Kolaz and Swinford (1990) | |
| Temperature | X | X | X | X | |
| Upper air temperature | X | ||||
| Dew point temperature | X | ||||
| Wind speed | X | X | X | X | |
| Solar radiation or cloud cover | X | X | |||
| Relative humidity or precipitation | X | ||||
| Wind direction | X | ||||
in some cases, significant variation remains (Pollack, 1986). In none of the cases were the high-ozone years (1983, 1987, and 1988) fully accounted for by normalizing for ozone-conducive days alone. For example, Kolaz and Swinford (1990) reported that in Chicago, June 1984 and June 1987 had about the same number of ozone-conducive days (10 and 12, respectively). In June 1984, however, there were no days with 1-hour concentrations above 120 ppb, and in June 1987, there were eight. Apparently, the ozone-conducive days of June 1987 were more prone to ozone formation than were the ozone-conducive days of June 1984. An important problem that impedes the routine prediction of ozone concentrations is that the ozone associated with transport cannot always be related to weather. The amounts and types of ozone precursors transported into an impacted area often change during a major episode of ozone pollution.
After an initial classification of the ozone and meteorological data, further subdivision of the ozone-conducive days is possible. One such approach is to
Page 58
develop a regression tree, such as the CART (classification and regression trees) methodology (Stoeckenius, 1989, 1990). Through a series of binary splits, a decision tree is grown by continuously splitting the ozone data into two groups based on the value of a single predictor variable. The particular meteorological variable and the cutoff value are selected to produce the best possible split of the data at that point. The binary splits continue until the data are subdivided such that the ozone concentrations on days within each final group are sufficiently uniform. While the regression tree does not reduce all the year-to-year variability, it does highlight the results from individual years that have unusual meteorological conditions, such as 1980, 1983, and 1988.
Another approach is based on the hypothesis that the probability of an ozone-conducive day exceeding the allowed threshold concentration increases as the magnitude of specific meteorological parameters exceeds the threshold values of those parameters. In this approach, a meteorological intensity index (MII) would measure the deviation of the observed meteorological parameters from the average conditions of an ozone-conducive day and relate these parameters to the distribution of ozone-conducive days and days exceeding the threshold. The higher the value of the MII, the greater the probability that an ozone-conducive day would exceed the threshold concentration. An MII of 1.0 would correspond to the average conditions of an ozone-conducive day. When the MII is above 1.65, it would be a virtual certainty that the day would exceed the threshold. By applying this index to all days in the year, the number of expected violations of the standard for the year can be calculated, and compared with the actual number of days exceeding the standard. This approach, when used by Kolaz and Swinford (1990) for the Chicago area, substantially reduced the variation in the 3-year running average (Figure 2-10) and showed that substantial improvement had been made in reducing ozone concentrations in the area in the period from 1979 to 1981, but that little progress had been made since. Only after the meteorological variability was removed did the earlier progress and later stabilization become apparent. These and similar modified classification techniques appear to have promise in normalizing ozone trends for meteorological variability and should be evaluated for application to other geographic areas.
Regression Techniques
A more refined way to account for meteorological effects on ozone concentrations is to correlate ozone air quality to one or more aspects of meteorology and use the subsequent association to estimate what change would occur
Page 59
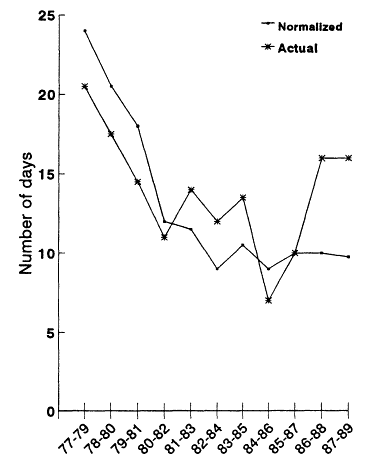
Figure 2-10
Number of days exceeding the ozone NAAQS concentration in the
Chicago area, 1977-1989. Normalized data were obtained by removing
meteorological variability. Source: Kolaz and Swinford, 1990.
in the ozone indicator given a change in meteorology. Such approaches were proposed shortly after trend analyses began. The most important variable used in these analyses is temperature. Several studies were conducted with temperature (in some form) being the only variable used to adjust the ozone trend. Jones et al. (1989) used such an approach to compare the days with ozone concentrations above 120 ppb in several cities in the United States to the days with temperatures above 90ºF. By accounting for temperature using a simple ratio of the two measures, Jones reported that many areas of the
Page 60
United States showed a downward trend in ozone concentrations from 1980 to 1988 (Figure 2-11). In one independent use of this approach for philadelphia, Pollack et al. (1988) adjusted the number of days when the average maximum ozone concentration was above 105 ppb by the number of days when the maximum temperature was above 90ºF, and the trend was even more variable. A direct linear dependence of high ozone concentrations on temperature could be difficult to develop because temperature is often related to other factors that influence ozone formation (Whitten and Gery, 1986), such as dear skies, light winds, mixing height, and thunderstorm activity.
Kuntasal and Chang (1987) performed a regression of ozone concentrations against temperature (at an atmospheric pressure of 850 rob) for the California South Coast air basin and reduced variability in the ozone concentration trend for the period from 1968 to 1985 (Figure 2-12). Wakim (1989) performed a regression analysis of high ozone concentrations against temperature for three cities: Houston, New York, and Washington. He explored 32 different configurations of temperature in his analysis, including the daily maximum temperature, the daily daylight temperature, and the daily average temperature. The best fit for the period from 1980 to 1987 was for ozone concentrations in New York, which, when normalized in this manner, showed a clear downward trend over the 7-year period. Generally, it can be observed that a high temperature is a necessary but not a sufficient condition for the occurrence of high ozone concentrations (Pollack et al., 1988), and other meteorological variables often need to be considered.
When other meteorological variables are considered, a regression equation (Chock et al., 1982; Kumar and Chock, 1984; Wakim, 1990; Zeldin et al., 1990; Korsog and Wolff, 1991) can be developed:
![]()
Equation 2.1 considers temperature (TEMP), wind speed (WS), relative humidity (RH), and sky cover (SKY); other variables that could be accounted for are wind direction, dew point temperature, sea level pressure, and precipitation. In some cases, transport variables (wind direction, pressure gradient) also are important, but seldom are meteorological conditions associated with the previous day considered. As expected, the dominant variable aspect in this analysis is temperature (Korsog and Wolff, 1991).
In most cases, after correction for changes in the meteorological conditions, ozone trends showed reduced variability. In many cases (Wakim, 1990), downward trends in the corrected ozone data were observed.
Page 61
One potential drawback associated with the use of a regression analysis to normalize a trend has been discussed in follow-up analyses (Pollack et al., 1988; Stoeckenius, 1990). It has been observed that high ozone concentrations are consistently underpredicted by the regression model. This is attributed to the least-squares fitting procedure used in linear regression, which is designed to limit the overall mean square error. Because high ozone values (100 ppb or more) are generally extreme values and occur only rarely, they might not be important in determining the regression coefficients. This was reported to be the case even when the meteorological data had first gone through an initial classification to remove the majority of the low ozone days (Pollack et al., 1988) (see Figure 2-13).
Without adjusting for meteorology, it is difficult to establish a relationship between ozone concentrations and precursor emissions (or ambient concentrations) over a period of a few years or less—for example, by comparing 1987 with 1988 or 1989. After adjustments for meteorology, consistent downward trends in ozone concentrations have been reported for some areas, supporting the view that meteorological conditions were more conducive during 1987 and 1988 than in other years to generating ozone. To make such adjustments, which could help areas reliably evaluate their progress in reducing ozone, additional meteorological data might need to be collected in some areas.
Summary
Regulatory and pollution control efforts to attain the National Ambient Air Quality Standard (NAAQS) for ozone have not succeeded. In 1990, 98 areas exceeded the NAAQS. EPA (1991a) has reported a trend toward lower nationwide average ozone concentrations from 1980 through 1989, with anomalously high concentrations in 1983 and 1988. Concentrations in 1989 were possibly the lowest of the decade. However, since the trend analysis covers only a 10-year period, the high concentrations in 1983 and 1988 cannot be considered true anomalies. It is likely that meteorological fluctuations are largely responsible for the highs in 1983 and 1988 and the low in 1989. Meteorological variability and its effect on ozone make it difficult to determine from year to year whether changes in ozone concentrations result from changes in the weather or from precursor emission reductions.
The current principal statistical measure of ozone trends-the second-highest daily maximum 1-hour concentration-is highly sensitive to fluctuations in weather patterns and therefore is not a reliable measure of underlying trends. If the effectiveness of a program to reduce ozone concentrations in a particular area is to be tracked over a period of several years, then some way is needed to account for the effects of meteorological fluctuations. The condi-
Page 62
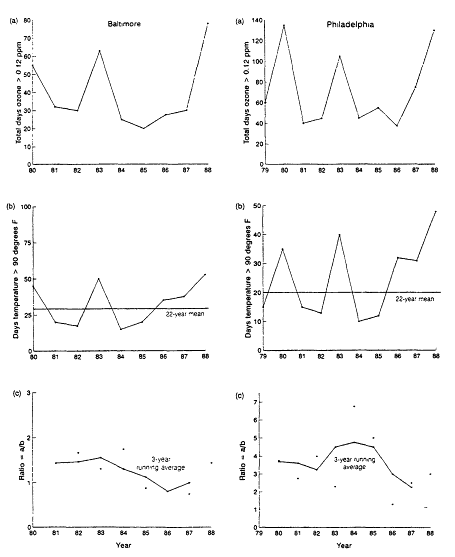
Figure 2-11
Ozone and temperature trends for four cities, 1980-1988. For each city, the number of
days per year with ozone concentration greater than 0.12 ppm is shown in a. The
number of days per year with temperatures greater than 90ºF is shown in b. The ratio
of data corresponding to the same year from a and b is shown in c. Source: Jones et al., 1989.
Page 63
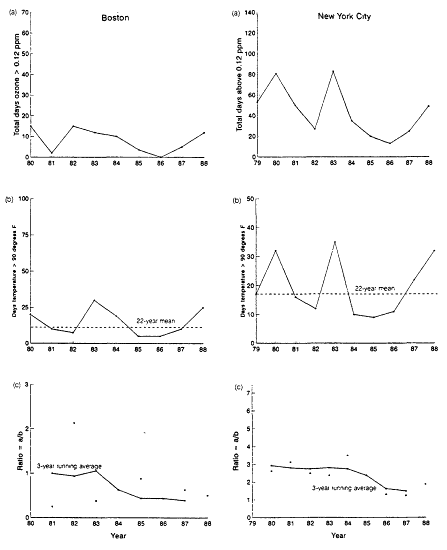
Figure 2-11
Ozone and temperature trends (continued).
Page 64
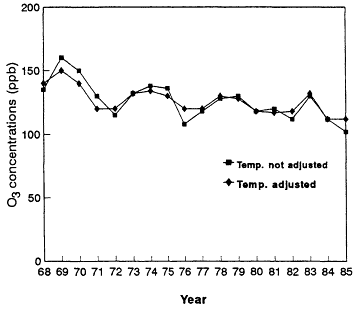
Figure 2-12
Trends in ozone concentrations (temperature-adjusted and unadjusted) at nine
sites in the California South Coast air basin, 1968-1985. Composite monthly
averages of daily maximum I-hour concentrations of ozone for July, August,
and September were used. Atmospheric pressure was 850 millibars. Source:
Kuntasal and Chang, 1987.
tions conducive to high ozone concentrations include high temperature, low wind speeds, intense solar radiation, and an absence of precipitation. The ozone-forming potential of a given day can generally be estimated using these factors as a starting point.
Support should be given to the development of methods to normalize ozone trends for meteorological variation. Several techniques that have shown promise for individual cities or regions could be useful on a national scale. In some cases, exposure indicators more robust than those associated with the NAAQS should be used to monitor ozone trends. One particularly promising approach in developing a relationship between ozone concentrations and meteorological
Page 65
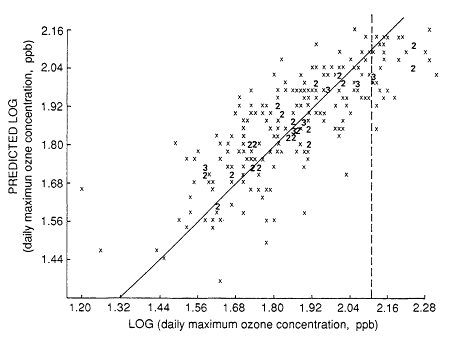
Figure2-13
Predicted vs. actual maximum ozone concentration for days that passed
the screening test at Bridgeport, Connecticut. The diagonal line is the line
of equality between the predicted and actual values. The dashed vertical
line indicates the log of the NAAQS concentration for ozone. Plotted numbers
indicate the frequency of overlapping data points; no more than three points
overlap at any one location. Source: Pollack et al., 1988.
variations is first to classify days as ozone-conducive or nonconducive and then further subdivide the conducive days using a binary decision tree or a regression equation to measure the degree to which the weather conditions of each conducive day deviate from the norm.


