
Comparing Grizzly Bears and Black Bears
|
Use a real world context for data Organize unordered data in meaningful way Compare data sets |
Suggested time allotment
One class period
Student social organization
Students working alone or in pairs
Task
Assumed background: This item assumes that children have had extensive experience with analyzing sets of data, and, especially, with drawing the type of graph sometimes called a line plot. Students should be accustomed to deciding what kinds of analytic approaches to take. That is, their background
should go beyond creating graphs and computing averages to include making decisions about what kinds of computations or visual representations are appropriate in a given situation.
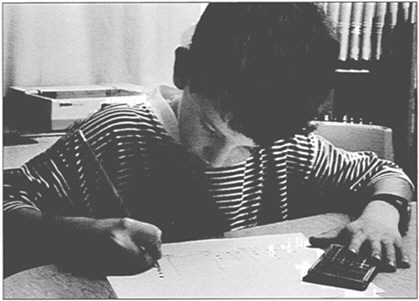
Presenting the task: The teacher should provide a short introduction to the subject matter of the assessment task — two kinds of bears that live in the Rocky Mountains of Montana. Rangers and biologists sometimes collect data on samples of bears. The task is to analyze two lists of data from individual grizzly bears and black bears.
As always, pencils, rulers, graph paper, calculators, etc., should be available.
Student assessment activity: See the following pages.
Name ________________________________________ Date _____________
The data below give the weights of some grizzly bears and black bears living in the Rocky Mountains in Montana.
|
Grizzly bears |
Black bears |
||||
|
Bob |
Male |
220 lbs. |
Blackberry |
Female |
230 lbs. |
|
Rocky |
Male |
170 lbs. |
Greta |
Female |
150 lbs. |
|
Sue |
Female |
210 lbs. |
Freddie |
Male |
140 lbs. |
|
Linda |
Female |
330 lbs. |
Harry |
Male |
230 lbs. |
|
Wilma |
Female |
190 lbs. |
Ken |
Male |
170 lbs. |
|
Ed |
Male |
180 lbs. |
Hilda |
Female |
220 lbs. |
|
Glenda |
Female |
290 lbs. |
Grumpy |
Male |
160 lbs. |
|
Bill |
Male |
230 lbs. |
Blackfoot |
Female |
150 lbs. |
|
|
|
|
Marcy |
Female |
170 lbs. |
|
|
|
|
Grempod |
Male |
200 lbs. |
-
Organize these data in a way that would help you find which kind of bear is heavier — grizzly bears or black bears. (You can use another piece of paper to do this. Please be sure to put your name on it!)
-
Write down three things that you can tell about the weights of the bears. (You may want to use your answer from question 1 to help you.)
Rationale for the mathematics education community
The task requires students to analyze a fairly complex set of measurements obtained from a "real world" context that is appealing to children of this age group. Rather than simply reading individual values on a graph or from a table, they must view the data set as a whole. More specifically, the problem reveals students' ability to create a representation that shows these data on a reasonable scale in a way that allows comparison of the two groups. (Some students may also find ways to show males and females within each group, thereby coping with one numerical and two categorical variables.)
A second reason for including the task in this collection is that it pushes the curriculum to include work in data analysis, specifically:
-
organizing unordered data in a representation that reveals the overall shape and characteristics of the data set;
-
describing data sets;
-
summarizing data in a way that enables one to compare two data sets.
As with the other tasks in the collection, it requires students to communicate their thinking verbally and graphically.
Task design considerations: Note that there are not the same number of bears of each type, which forces the student to consider more than just the total weights. In fact, the data have been adjusted so that the sums of the weights are the same. This will serve as a subtle hint to the child who adds the two columns of figures and is tempted to stop at that point.
The heaviest bear in the entire set is a grizzly, which is the heaviest kind of bear. When looking at student responses, one must be careful to distinguish reasoning that relies on the difference between the central values of the weights from reasoning that simply cites the heaviest bear.
Even though many of the difficulties associated with performing computations on data have been obviated by the advent of inexpensive hand-held calculators, finding suitable "real world" data is still tricky. Of course children should have
many opportunities to collect their own data, but occasionally one will have to create plausible data from scratch. (Actually, zookeepers and forest rangers do not often weigh adult bears because of the danger involved.) The data in this task come partly from the University of Montana's Office of Grizzly Bear Recovery, supplemented by additional reasonable weights.
Variants and extensions: Other kinds of questions can be asked about the data that are provided here: for example, "What can you say about the weights of male and female bears?" A deeper kind of question deals with age: "Do you think that all these bears are the same age? Explain why you think so."
Going beyond this set of data on bears, there are innumerable sources that can be used in creating data-analysis tasks — animal sizes, building heights, river lengths, and so forth. One must be careful, however, to be sure that whatever the objects are, they are equally familiar (or unfamiliar) to the students who are being assessed.
The teacher should be encouraged to follow up the assessment task with appropriate activities. In this case, one might want children to organize oral or written reports to the class using information about the other kinds of bears, perhaps illustrated with graphic displays, posters, etc.
Protorubric
This protorubric is based on the assumption that the child will interpret the task as one calling for the creation of some sort of graph.
Characteristics of the high response:
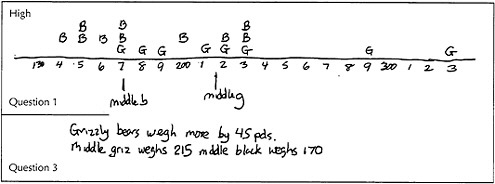
The graph represents the data clearly and accurately, with the scale and intervals chosen appropriately.
The description of the grizzly bears and black bears includes accurate observations about the ranges of the two sets of data and the way each set of data is distributed over its range (that is, some comments about center and spread, although these may not be in formal statistical terms).
The general conclusion reached is that grizzly bears are generally heavier than blacks, but some blacks weigh more than some grizzlies.
A number or range is chosen that represents the difference between the central values or central clumps of the two sets of data. A median, mean, or less formal measure of center is used (e.g., "Most of the grizzly bears clump around 200 pounds even though there are a few bigger ones and a few smaller ones, so I said that a typical grizzly bear is 200 …").
Characteristics of the medium response:
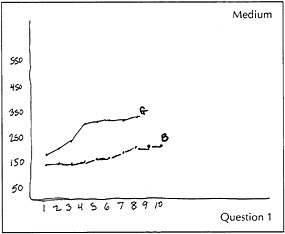
The scale or intervals chosen are not chosen so as to show the data as clearly as possible, or there are a few inaccuracies in plotting the data.
The description of the blacks and grizzlies does not include some of the important aspects about the range and center of the data.
The general conclusion reached could be interpreted to mean that all grizzlies weigh more than all blacks (that is, the overlap of the data is not noted).
A reasonable answer is given (that a typical grizzly bear weigh about 30 to 50 pounds more than a typical black bear) but the explanation is inadequate.
Characteristics of the low response:
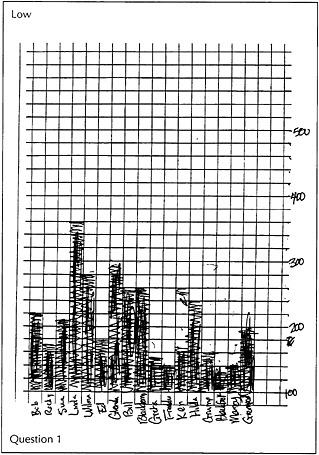
The graph has major flaws that significantly impede comparisons of the two kinds of bears — for example, incorrectly plotted data, mislabeled axes, or inadequate distinction between the two types of bears.
The description of the data focuses on individual values rather than capturing features of the whole data set.
Either the wrong kind of bear is identified as the heavier one, or no reference is made to the graph at all in support of the conclusion. No attempt is made to consider the ''typical" bear of either type; for example, two specific bears are chosen and the difference of their weights reported.
References
The "Used Numbers: Real Data in the Classroom" project at TERC.


