
6
Pesticide Residues
DATA ON DIETARY LEVELS of pesticide residues combined with food consumption estimates provide the basis for exposure estimates used by the Environmental Protection Agency (EPA) to assess the risks of pesticide exposure in the diet. Thus, sampling and residue testing methods to estimate levels of pesticide residues in the food supply are extremely important components of the risk assessment process.
The committee examined pesticide usage, residue sampling and testing methods, and the data pesticide residues to
-
understand the relative quality of data sets available to EPA as a foundation for recommending practical improvements in data collection and testing;
-
identify the foods in the diets of infants and children with residues of pesticides that cause the greatest public-health concern;
-
assess the need for residue sampling methods and residue testing procedures that can provide the data needed to ensure the protection of infants and children;
-
recommend residue monitoring methods that could be incorporated into an exposure assessment methodology that would ensure the protection of infants and children;
-
identify steps to improve risk assessment and establish priorities for those steps; and
-
determine which, if any, data are sufficient quality to support risk assessment models designed to protect infants and children.
SOURCES OF DATA ON USAGE
Despite the importance pesticides have attained in agricultural production, data on the amount and distribution of their use are remarkably
scanty. There is no single, comprehensive data source, derived from actual sampling, on pesticide usage for all crops and all chemicals.
The U.S. Department of Agriculture's (USDA) Economic Research Service (ERS) conducted national surveys of pesticide use in 1964, 1966, 1971, 1976, and 1982; smaller areas and fewer crops have been included in successive surveys. The 1964, 1966, and 1971 surveys included field crops, fruits, vegetables, and livestock. In 1976 fruits and vegetables were excluded from the survey, and in 1982, only major field crops (e.g., corn, soybeans, cotton, wheat, barley, oats, peanuts, tobacco, alfalfa, and hay) were sampled (Osteen and Szmedra, 1989). The foci of later reports on pesticide usage are even narrower: vegetable, melon, and strawberry crops in Arizona, Florida, Michigan, and Texas (USDA, 1991); fruits and nuts, in 12 states (USDA, 1992a); and eight field crops (corn, cotton, peanuts, potatoes, rice, sorghum, soybeans, and wheat) in different numbers of states, ranging from 47 states for corn down to 2 states for rice and 1 for durham wheat (Osteen and Szmedra, 1989).
Resources for the Future maintains a county-based file of annual pesticide usage estimates by county and by crop for the 184 widely used pesticides that appear on EPA's list for the National Ground Water Survey and the California Priority Pollutant List (Gianessi, 1986). The usage information was derived from the limited ERS surveys and from the annual California survey (State of California, 1981), which included only restricted-use of chemicals until 1991, when the state's reporting system was extended to all pesticides, including unrestricted chemicals. Resources for the Future has also estimated the amounts of pesticides applied to lawns and in nurseries.
The data in Table 6-1 illustrate the variation in the kind and amount of pesticides used on crops in various geographic regions. The corn belt, for example, accounted for 39% of all pesticides used on major crops in 1982. Most of this volume was represented by herbicides; fungicides constituted only 2% of total usage. In contrast, the southeast accounted for only 8% of total pesticide applications but for 66% of fungicides used. There are similar differences in use patterns between other regions.
The implications for residue and exposure estimation are more clearly illustrated in Table 6-2, which focuses on one crop (fall potatoes) and one class of pesticides (fungicides) and their application in the northeast, midwest, and western regions of the United States. In 1991, 96% and 90% of croplands planted with potatoes in the northeast and midwest, respectively, were treated with fungicides, while only 52% of croplands in the west were treated. Fungicides were also applied more times during the growing season in the northeast and midwest. As a result, the northeast, which accounts for 11% of the hectares planted with potatoes, accounts for 30% of all fungicide hectare treatments
TABLE 6-1 Regional Distribution of Pesticide Use on Major Crops in Selected Regions in 1982
|
|
Amounts of Active Ingredient Used (1,000 lbs.) and (Percent) of Total, by Geographic Region |
|
|
Total Usage |
|||||||
|
Pesticide |
Northeast |
Lake |
Corn Belt |
No. Plains |
Appalachia |
Southeast |
Delta |
So. Plains |
Mountains |
lbs. (1,000) |
% |
|
Herbicides |
14,727 (3) |
62,778(14) |
197,894 (43) |
53,107 (12) |
34,142 (7) |
22,884 (5) |
41,168 (9) |
17,554 (4) |
11,315 (2) |
455,569 |
99a |
|
Insecticides |
1,915 (3) |
3,800 (5) |
17,307 (24) |
7,784 (11) |
5,833 (8) |
13,460 (19) |
11,567 (16) |
7,149 (10) |
2,418 (3) |
71,233 |
99a |
|
Fungicides |
<10 (<1) |
80 (1) |
147 (2) |
38 (1) |
849 (13) |
4,331 (66) |
923 (14) |
213 (3) |
12 (2) |
6,593 |
102a |
|
Other |
<10 (<1) |
<10 (<1) |
72 (<1) |
130 (1) |
11,540 (47) |
2,533 (10) |
4,863 (20) |
2,422 (12) |
2,247 (9) |
29,307 |
102a |
|
Total |
16,642 (3) |
66,658 (12) |
215,420 (39) |
61,059 (11) |
52,364 (9) |
43,208 (8) |
58,521 (10) |
27,838 (5) |
15,992 (3) |
557,702 |
100 |
|
NOTE: Major crops included corn, soybeans, cotton, wheat, barley, oats, peanuts, tobacco, alfalfa, and hay. a Totals do not add up to 100 due to rounding. SOURCE: Based on data from Osteen and Szmedra, 1989. |
|||||||||||
TABLE 6-2 Total Fungicide Use on Fall Potatoes in the United States, 1991
|
|
Production |
|
Hectares Treated |
|
|
|
|
Regiona |
Planted (1,000 ha) |
% of Total Planted Hectares |
No. (1,000 ha) |
% in Region |
Average No. of Applications |
% of Total Hectare Treatmentsb |
|
Northeast |
51 |
11 |
49 |
96 |
5 |
30 |
|
Midwest |
133 |
29 |
119 |
90 |
4 |
42 |
|
West |
269 |
59 |
141 |
52 |
2 |
28 |
|
Total |
453 |
99 |
309 |
|
4 |
100 |
|
NOTE: Numbers do not add up to 100 due to rounding. a Northeast: Maine, New York, Pennsylvania; Midwest: Michigan, Minnesota, North Dakota, Wisconsin; West: Colorado, Idaho, Oregon, Washington. b Hectare treatment: number of hectares treated times number of applications per year. SOURCE: Derived from USDA, 1992c. |
||||||
In contrast, the west, which accounts for 59% of all hectares planted with potatoes, accounts for only 28% of total fungicide hectare treatments. This variation of pesticides used on the same crop grown in different regions means that the amount and kind of residues will depend not only on the crop, but also on where it is grown.
THE OCCURRENCE AND FATE OF PESTICIDE RESIDUES
Pesticide residues originate when a crop or food animal (commodity) is treated with a chemical or exposed unintentionally by drift, in irrigation water, in feed, or by other routes. The size of the residue depends on the exposure level (treatment rate), its dissipation rate, environmental factors, and its physical and chemical properties. For example, an insecticide sprayed on apples any volatilize into the atmosphere. This is influenced by the insecticide's volatility or vapor pressure and the temperature and wind movement in the orchard. Removal by rainfall or overhead irrigation is governed by the insecticide's water solubility and the amount of rain or irrigation water. The chemical may also degrade (as influenced by the molecular makeup of the insecticide and by such factors as sunlight, moisture, and temperature) or it may dissipate by growth dilution (e.g., as the fruit becomes larger, the residue concentration will decrease even in the absence of physical or chemical dissipation). In farm animals and some plants, metabolism and excretion are the primary mechanisms. The
degradation products become the major constituents of the remaining residue. In a few cases, chemical residue concentrations may actually increase over time after exposure ceases. This would result from weight loss by the commodity, e.g., loss resulting from the conversion of grapes to raisins after treatment with a relatively stable, nonvolatile chemical.
The overall dissipation rate is a composite of the rate constants of the individual processes (e.g., volatilization and degradation). Typically, overall residue concentrations (parent plus degradation products) decrease over time after exposure ends. Because most individual dissipation processes follow first-order kinetics, overall dissipation will have the characteristics of first-order kinetics. In first-order decline, the logarithm of concentration is linearly related to time, and a plot of concentration remaining versus time is asymptotic with respect to the time coordinate. Thus, residue concentrations will approach zero over time but in theory will never cease to exist entirely (Zweig, 1970). Stated simply, a commodity treated with or exposed to a pesticide theoretically can never totally be rid of all traces of residue. In time, however, the residue will cease to be detectable because of the limitations of current measuring instrumentation and the continuing asymptotic decline processes. This limit of detection (LOD) will therefore vary according to the sensitivity of the analytical method used. (LODs are described below under ''Detection Limits.")
Conventionally, residues in raw commodities are monitored until they have declined to a concentration approximately 1/10th that of the legal maximum—that is, the tolerance or action level. Very little public monitoring is intended to identify the residues that the consumer may ingest, which may range from the legal maximum to 1/10th, 1/100th, 1/1,000th, or smaller fractions of that level on foods prepared for consumption. One can expect that consumers are exposed to small residues if their food was treated with or exposed to pesticides during production, processing, or preparation; however, we do not always know the quantity of those residues either because they are lower than the LOD or because there are no monitoring data available. For these reasons, it is difficult to estimate actual dietary exposure to pesticides and any associated risk with a high degree of certainty.
PESTICIDE REGISTRATION AND THE DEVELOPMENT OF ANALYTICAL METHODS
Early in the development of a pesticide, the manufacturer must identify the analytical methods used to ascertain the concentrations of chemicals in formulations (formulation methods) and the fate of the material on target crops, in laboratory animals and livestock, and in environmental media (soil, water, air) that might be exposed to the chemical (residue
methods). Most companies that develop and register chemicals employ staffs to develop these analytical methods, whereas others hire or fund commercial or university laboratories for this purpose.
Development of analytical methods is a lengthy and technically difficult process because the methods must account for the parent chemical or control agent as well as toxicologically significant formulation impurities, metabolites, and environmental conversion products. The impurities and products may not be known early in the development phase and thus must be included later but before registration is sought from EPA. Before a pesticide can be registered under the Federal Insecticide, Fungicide, and Rodenticide Act (FIFRA), a tolerance level must be established for each food use or an exemption granted, e.g., for a pesticide that is essentially nontoxic. To obtain a formal tolerance level, pesticide manufacturers must submit their analytical methods to EPA, which then verifies that the pesticide can be detected at a certain tolerance level for each proposed food use. It is not unusual for a food tolerance level to include the parent chemical and several breakdown products. In such cases, versatile residue detection methods must be available to detect the various tolerance levels in every food or feed product for which registration is being sought. Typically, the primary method will have several variations extending it to soil, water, air, and nontarget organisms such as fish and wildlife.
The manufacturer applies these methods to determine the rate of dissipation or decline of the pesticide on target crops in field trials. The results are submitted to EPA with the registration data for use in establishing a tolerance level for the raw agricultural commodity and determining the interval required between the last application of the pesticide and harvest to achieve residues below that tolerance.
Field trials are conducted in several geographical regions of the United States that typify areas in which the crop is produced, so that different climatic conditions and soil types are represented. The test plots are treated with pesticides in concentrations high enough to eradicate a large percentage of the target pest(s). If the trials are not complete, if the data are too variable, if conversion products are not adequately included, or if the analytical methods themselves are considered imprecise, inaccurate, not sufficiently sensitive, or otherwise deficient, registration may be denied. EPA may base its judgment on the data submitted by the manufacturer, or it may inspect the company's raw data in accordance with the FIFRA provision for data audits. Field trial data are further evaluated in Chapter 7.
Methods must be provided by the manufacturer when requested by any federal or state regulatory agency and may be included in the Pesticide Analytical Manual, Volume II (PAM II): Methods for Individual Residues,
which was first published by the Food and Drug Administration (FDA) in 1968 but has been updated in a series of revisions since then. These methods do not need to fit within the available multiresidue methods (MRMs) used by the FDA to screen food or feed products entering commerce (see section on "Methods for Sampling and Analysis," below, for a further discussion of MRMs). More recently, EPA has asked pesticide manufacturers to determine whether new compounds are detectable by existing MRMs. If they are not, however, the registration process is not impeded.
Interregional Project Number 4
Use of pesticides on some crops (e.g., strawberries, hops, artichokes, cranberries) may be too limited to provide the economic incentive needed for chemical companies to develop the analytical methods and residue data required for registration. In such cases, this work is performed by Interregional Project Number 4 (IR-4), which operates within State Agricultural Experiment Stations (SAES) with funding from USDA's Cooperative State Research Service (CSRS) and Agricultural Research Service (ARS). The nation's four IR-4 leader laboratories are located at Cornell University, the University of Florida, the University of California at Davis, and Michigan State University. Several participating laboratories are situated at other land-grand institutions and within ARS.
The IR-4 laboratories use methods provided by manufacturers to EPA for pesticide residues on the major crops listed on the chemical's label. If the method fails on the minor crop, they modify the company method to make it fit the minor crop situation. Occasionally, they develop new methods for minor crops of interest.
SAES or ARS field scientists establish the plots, sample the commodity at harvest, and provide samples to IR-4 laboratories, which then conduct the analyses. All data are submitted to EPA. If the petition is approved, the minor crop is added to the pesticide label. IR-4 actions annually account for approximately half of the petitions processed by EPA.
Universities and the ARS
Several U.S. universities and the ARS conduct research on pesticides to study their field behavior, formation of breakdown products, persistence during food processing and storage, and analytical behavior, Many advances in food residue chemistry (e.g., detection of previously unrecognized toxic metabolites) and new approaches to residue analysis (e.g., the immunoassay) result from this basic research. In addition, this academic
environment provides the training ground for pesticide scientists who eventually enter the industrial, government, and commercial sectors.
METHODS FOR SAMPLING AND ANALYSIS
Sampling
Sampling should be conducted
-
by persons trained in the practice of sampling;
-
randomly, so that all individuals in the population sampled have an equal chance of selection in the final analysis;
-
with replication, so that analytical results can be treated statistically;
-
in such a manner as to maintain sample integrity by adequate containment, preservation, and prevention of contamination; and
-
with care and attention to record keeping, including visual observations, sample preservation, and safeguards against cross-contamination.
Usually omitted from reports are the manner of collecting samples (where, by whom, and how) and information on compositing, subsampling, preservation of samples and subsamples, and other important matters. Lykken (1963) generalizes, however, that all residue monitoring programs operate somewhat as follows:
-
Several commodity units (e.g., bunches of grapes, oranges, heads of cabbage) are taken from the field or lot to be sampled.
-
These commodity units are composited to form to gross sample.
-
The gross sample is reduced in size to produce the composite sample.
-
The composite units are then peeled, husked, or further reduced in size by cutting or chopping in accordance with the Code of Federal Regulations, which identifies the portion(s) of the commodity to which the tolerance applies.
-
The individual parts of the commodity may then be quartered to reduce bulk and perhaps subdivided to smaller aliquots. These samples are generally frozen or preserved in some other way, transported to the laboratory, and preserved further until analyzed. If a freezer stability test is to be conducted (a recent Good Laboratory Practice [GLP] requirement; 40 CFR Part 160), control samples may be spiked at this point and then handled the same as the treated sample. This is usually done when field plots are sampled to determine residues for registration requirements, but less frequently for monitoring and enforcement of tolerance levels for registered chemicals. Sampling and sample handling for field trials are described by the National Agricultural Chemicals Association (NACA, 1988).
-
At the time of analysis, individual subsamples may be more extensively chopped or blended or reduced further in size prior to extraction with a solvent and analysis.(See PAM I or II for more detailed description.)
The absence of uniform training has likely led to haphazard sampling or bias resulting in samples that are neither random nor representative. To rectify this situation, FDA and most state agencies are taking steps to improve their training and written sampling guidelines. Furthermore, true replication, with three or more field composites, appears not to have been common practice, evidenced by the fact that averages and standard deviations are absent from virtually all residue monitoring reports. Sample handling has improved since implementation of GLP protocols; but again, without accompanying quality assurance records, older data must be questioned for reliability. EPA and FDA are now training and certifying field inspectors to ensure proper sampling by all personnel engaged in work to meet FIFRA requirements. In addition, the American Chemical Society's Committee on Environmental Improvement has prepared a comprehensive volume dealing with the basics of environmental sampling (Keith, 1988).
Analysis
Methods for analyzing pesticides are expensive, time consuming, and difficult, and they require a skilled analyst. Furthermore, methods are tailored to specific purposes (e.g., monitoring, enforcement, or registration). As a result, considerable variability is associated with the methodology. In many cases, descriptions of differences among the specific methods used do not accompany the residue data, thus diminishing public confidence in the data. Furthermore, the committee found no analytical program directed toward water specifically as an ingredient of foods or as a component added to foods. This results in an important gap in the residue data, since water represents such a large part of the diets of infants and children.
There are two general types of analytical methods for determining residues in foods: single residue methods and multiresidue methods. These are described in the following sections.
Single Residue Methods
Single residue methods (SRMs) are used for the quantitative determination of a single pesticide (and its toxicologically important conversion products, e.g., through metabolism or degradation) in all foods for which tolerance levels have been established. This is generally the type of method
submitted by the manufacturer to EPA and eventually published in PAM II after registration is secured. It may also be the method used (sometimes in modified form) for IR-4 petitions.
Multiresidue Methods
Multiresidue Methods (MRMs) are capable of detecting and quantifying more than one pesticide in more than one food. These methods are commonly used by government agencies for surveillance and monitoring to determine which pesticides (and how much) are present in a given food sample. FDA's MRMs are published in PAM I; the MRMs of state agencies, foreign governments, private industry, and academia are published in the open literature or in special reports. Some MRMs are rapid; others are more comprehensive and therefore more time consuming. In general, MRMs may be used for screening and quantitation. In screening, MRMs are used to determine rapidly if any pesticide is present near or above the tolerance level. This approach usually precedes a more detailed analysis. Cholinesterase enzyme inhibition tests screen for organophosphorus and carbamate insecticides; insect bioassays screen for any insecticide residue. Immunoassays may be used in the future for targeted chemicals or classes of chemicals. In quantitation, MRMs are used to detect and measure multiple pesticide residues and their metabolites that might be present in a given sample. These MRMs are usually based on gas or liquid chromatography or both. FDA and other agencies often use simplified versions of MRMs in their surveillance program to determine if violations exist in given samples before proceeding to full quantitation with a more elaborate version. Because all MRMs can accommodate only a limited number of chemicals, agencies use SRMs for targeted pesticides that are not included in the MRM. They also use SRMs in special circumstances such as when public health is endangered by a single pesticide or when a single pesticide comes under special review and, thus, special scrutiny is required for its presence in foods.
Most laboratories improvise when using an MRM, and the improvisations are often not subject to peer review or published. Requesting the latest method from an agency is usually the only way to obtain up-to-date information on the method being used, the number of pesticides it can accommodate, and its LOD. MRMs used by regulatory laboratories are frequently modified in response to changing availability of solvents and analytical instrumentation within the laboratory and the need to expand the MRM's coverage or lower its detection limit.
Criteria for Selecting a Method
Single Residue Methods or Multiresidue Methods?
SRMs are selected when the sample is known or believed to contain the residue of a chemical not included in the MRM. MRMs are used when the residue history of the sample is unknown and the presence and quantity of pesticide residues must be determined. MRMs will provide information on a much broader range of pesticides than an SRM for the same investment of time, energy, and resources.
Breadth of Applicability
MRMs most commonly used by the FDA can determine roughly 50% of the approximately 300 pesticides with EPA tolerances and other chemicals for which no tolerances have been established. Some of the MRMs can also detect many metabolites, impurities, and alteration products of pesticides with and without tolerances (FDA, 1991). Typically not included are polar chemicals of high water solubility (e.g., paraquat, glyphosate), very volatile chemicals (e.g., fumigants), and compounds that are unstable to Florisil chromatography (e.g., some carbamates). An aliquot of the sample (or its extract) must be analyzed separately so that these chemicals can be included in the analytical report.
Detection Limits
All analytical methods have a limit below which the chemical could not be detected even if present. This limit of detection (LOD) is the lowest concentration that can be determined to be statistically different from a blank. Elsewhere in this report, the committee refers to the limit of quantification (LOQ), which differs from the LOD in that it refers to the concentration above which quantitative results may be obtained with a specified degree of confidence.
The LOD is influenced by extraneous, background material that is always present in the sample and the sensitivity of the instrumentation used for detection and quantification. Moreover, the LOD may vary according to application. LODs are determined by analyzing background (untreated) samples of the food products of interest and spiked samples, which contain known amounts of the chemicals. LODs for a given method will vary with the type of sample, the chemical, and the extent of sample cleanup provided.
LODs can be as low as twice the background reading. That is, a signal
that is twice the background could be measured and result in a calculated residue value. In practice, however, most laboratories set an LOQ that is several time higher than the theoretical LOD. Keith (1983) provides general guidelines for establishing the LOQ, but in practice, the criteria for setting the LOQ varies among laboratories.
To be of regulatory use, detection limits must be below established tolerance levels. The California Department of Food and Agriculture sets LODs at approximately one-tenth the tolerance level; FDA generally sets them at 0.1 to 0.01 ppm, depending on the chemical; and Florida's Department of Agriculture and Consumer Services sets them at or just below tolerance in order to screen large numbers of samples for clear violations. Unfortunately, LODs are not always specified in residue reports so that samples with no detectable residue levels cannot be assigned an upper limit of finite residue content. Furthermore, the reports do not clearly describe the extent to which residues below tolerance but above LOD are quantitated and confirmed, and they may not include a complete list of the pesticides that were not found but could have been detected had they been present. A report of pesticides not found (i.e., below the LOD) is usually not included in descriptions of the results of the overall programs but is done when there is special regulatory interest in specific pesticide residues (McMahon and Burke, 1987). Reporting only positive findings leads to a bias in the residue results.
Accuracy and Precision
Accuracy refers to agreement between a measured value and the true value. In residue methods, accuracy is often defined as the percentage recovery. Acceptable residue methods will give 80% to 120% recovery, indicating that if 1 ppm of a chemical were present, the analytical method would yield results between 0.8 and 1.2 ppm. Precision refers to reproductibility and the variability existing in a set of replicate measurements. Precision errors caused by variable reproducibility in residue methods tend to run high, with relative standard deviations (expressed as a percent of the mean) of 25% or more. The total error (accuracy plus precision) ideally should not exceed 100%. This must be assessed by the analyst running replicate spiked samples through the method.
Speed and Cost
Regulatory agencies require fast-response methods that can produce results in an 8-hour workday or less so that produce does not spoil when awaiting the results of an analysis. These faster methods are less expensive because they require less of an analyst's time. Needless to say, however,
the quickest, least expensive analytical method may not be the best one in terms of other criteria. As a result, many of the methods used are compromises of speed for quality.
Instrumentation
Most regulatory agencies rely on element-selective gas chromatography determination. The more rigorous methods based on mass spectrometry are not practical, especially for screening, given the cost of the equipment. The expense is becoming less of a barrier, however, as analytical laboratories acquire more sophisticated instruments and as the cost of technician time overtakes capital costs of instruments as the primary budgetary consideration.
Validation
Methods should be validated before they are used routinely for regulatory purposes. The most rigorous level of validation is a collaborative study of the method by several different laboratories. The Association of Official Analytical Chemists conducts such studies and publishes the validated method as "official" in the Official Methods of Analysis . Because this is a time-consuming process, most methods are validated less rigorously—perhaps by one cross-check either by investigators in the same laboratory or by one outside laboratory. For example, the MRM used by the California Department of Food and Agriculture was developed in-house and had not been subjected to outside collaborative validation when put into service.
MONITORING
The following discussion of monitoring activities for pesticide residues is based primarily on information that existed for 1988 and earlier. The committee realizes that changes in the design and scope of monitoring programs have occurred after 1988 but, unfortunately, information on more recent developments was not generally available for inclusion in the committee's discussion.
Federal Activities
Four federal agencies have primary jurisdiction over pesticide residues in food—the EPA, the FDA, and the USDA's Food Safety and Inspection Service (FSIS) and Agricultural Marketing Service (AMS). Their efforts are supported by USDA's ARS and CSRS and the U.S. Fish and Wildlife
Service (FWS). CSRS has its own programs through land-grant universities. All these agencies have some analytical capability associated with pesticide monitoring in foods (FDA, FSIS) or pesticide research.
Following is a list of the principal responsibilities of each agency:
The Environmental Protection Agency
-
registers pesticides under FIFRA;
-
sets pesticide tolerance concentrations for individual commodities, including meat and poultry, and for processed foods (the tolerance concentration for individual commodities is established by EPA for raw produce at the farm gate; as produce is processed into finished foods, pesticide concentrations may either decrease, increase, or remain the same);
-
serves as lead agency for enforcement;
-
reviews manufacturers' registration data, including analytical methods; and
-
conducts research on the environmental fate of residues.
The Food and Drug Administration
-
enforces compliance with residue tolerance concentrations in food, except meat and poultry, and feed;
-
monitors residues in domestic and imported food; and
-
develops analytical methods for monitoring.
The Food Safety and Inspection Service (USDA)
-
enforces residue tolerance concentrations in meat and poultry;
-
monitors residues in meat and poultry;
-
develops analytical methods for monitoring; and
-
gathers information on the incidence and concentrations of pesticide residues in the food supply.
The Agricultural Marketing Service (USDA)
-
enforces compliance with residue tolerance concentrations and monitors residues in raw egg products.
The Agricultural Research Service (USDA)
-
conducts research on pesticides, including efficacy and residue fate, and
-
conducts ARS segment of IR-4 and National Agricultural Pesticide Impact Assessment Program (NAPIAP) operations.
The Cooperative State Research Service (USDA)
-
oversees and funds NAPIAP and IR-4, both of which operate at land-grant universities.
The Fish and Wildlife Service
-
monitors pesticides in fish and wildlife.
The accomplishments and shortcomings of all programs in sampling and analyzing pesticide residues in foods were reviewed by the Office of Technology Assessment (OTA, 1988). Much of the following description is based on that report.
EPA does not monitor pesticide residues in food. The agency's residue chemistry section within the Office of Pesticide Program's Registration Division reviews registration data compiled by pesticide manufacturers, and its laboratories in Beltsville, Maryland, and Bay St. Louis, Mississippi, may test the methods with spiked samples. Acceptable methods are submitted for publication in PAM II. EPA has for some time been studying the feasibility of combining the wide array of data bases in existence to maximize their utility for scientific and regulatory purposes. In 1989, for example, the agency contracted with Dynamac Corporation to compile and summarize residue data obtained from Agriculture Canada, FDA's state monitoring program, and the National Food Processors Association (NFPA). Together these sources provided data on 286 pesticides in an estimated 49,857 samples. In a report prepared for the EPA, Dynamac (1989) noted the difficulties encountered in attempts to compare these data bases, especially the differences in information reported and sampling methods. It made three fundamental recommendations intended to improve the utility of the data with minimum cost increases: that standard residue sampling protocols be used by state and federal agencies to facilitate comparison, that certain minimal information be provided with each sample (for example, identification of sample, purpose of sampling, and analytical method used), and that a standard data coding system and data base format be used.
EPA recognizes the need for uniform record keeping, sampling, and analytical methods in order to determine exposure and assess risk, especially for infants and children. It is important to this effort that EPA information be made compatible with FDA data. The utility of the data for estimating exposure and risk varies with the intended purpose of the monitoring programs. At present, EPA is evaluating the feasibility of drawing on the many and varied food intake and dietary exposure data bases to improve assessments of total human exposure. This information-gathering activity is one component of a larger effort to design a national human exposure survey that, among other things, will measure the route, magnitude, duration, and frequency of human exposure to environmental chemicals.
In May 1988, FDA's MRMs included 316 pesticides for which tolerance levels had been set, 74 pesticides with temporary and pending tolerances, 56 pesticides with no EPA tolerance levels (those previously canceled or those used only in foreign countries), and 297 metabolites, impurities,
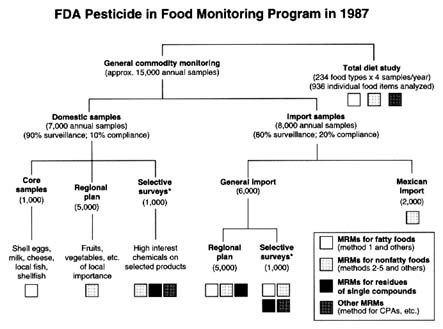
FIGURE 6-1 Structure of the FDA program to monitor pesticides in foods.
SOURCE: McMahon and Burke, 1987. Reprinted from the Journal of the AOAC, Volume 70, Number 6, pages 1072–1081, 1987. Copyright 1987 by AOAC International.
inert ingredients, and other pesticide-associated chemicals (OTA, 1988). Of these, 35% to 40% were covered by five primary FDA MRMs: one liquid chromatographic method used primarily for N-methyl carbamate pesticides and four gas chromatographic methods—one for organophosphorus pesticides and metabolites, one for both polar and nonpolar pesticides involving a variety of selective detectors, and two for nonpolar (primarily organochlorine and organophosphorus) pesticides in fatty and nonfatty foods.
In its monitoring program in 1987, FDA analyzed approximately 15,000 commodity samples in its 16 laboratories (Figure 6-1). Most samples were collected at random; the remainder were taken from targeted food sources after a violation or suspected violation. Approximately 7,000 of the samples are domestic and 8,000 are imported.
Since the early 1960s, FDA has gathered its information on pesticide residues through its Total Diet Study (TDS), also called the Market Basket Study, in which the dietary intakes of pesticide residues (as well as some
industrial chemicals, toxic substances, and essential minerals) are estimated for eight age and sex groups from infants to senior citizens. To accomplish this, FDA personnel purchase foods from local supermarkets or grocery stores four or five times per year in three cities in each of four different geographic regions of the United States. The cities are changed each year. Each market basket contains 234 food items intended to be representative of the diet of the U.S. population. The foods are prepared for consumption, e.g., by peeling bananas or making beef and vegetable stew, and then are analyzed for pesticide residues. The results, combined with food consumption data, provide a model of dietary intakes. Because of the limitation of the food intake data and residue monitoring methods, coverage is not complete. Human exposure to all pesticides cannot be estimated because some pesticides cannot be detected by the analytical methods used. It is even more difficult to derive estimates of human exposure for population subgroups.
FDA's program has been criticized as being too slow in terms of analyses, in need of better sampling and enforcement of imported foods (GAO, 1992), and too limited in the numbers and types of pesticides detected (GAO, 1986a,b,c). Despite these criticisms and the age of the data, this program proved to be an important source of information for the committee's purposes. If the TDS were improved, risk from exposure to dietary residues could be better assessed. Increased funding for TDS would almost certainly be required to improve it. Later in this chapter, the committee addresses how the sampling program might be restructured to provide the data necessary to estimate the exposures of infants and children.
FSIS in its National Residue Program annually analyzes approximately 50,000 samples for about 100 residues of pesticides, animal drugs, and environmental contaminants in meat, poultry, and raw egg products. About one-third of the samples are analyzed for pesticides. Most samples are collected at random by FSIS inspectors located at slaughterhouses. The results are reported in the Journal of the Association of Official Analytical Chemists and in a series of annual reports entitled ''Residues in Foods" issued by FSIS.
State Activities
Thirty-eight states monitor pesticide residues in food but vary widely in the number of samples they process and the purposes of their programs. Figure 6-2 shows the range of sampling activity for 10 states in 1987. California has the largest and oldest program, which is designed to monitor the major raw commodities produced in, or imported into, the state. Its purpose is to enforce tolerance levels for residues on both domestic and imported commodities. This program is administered by the California
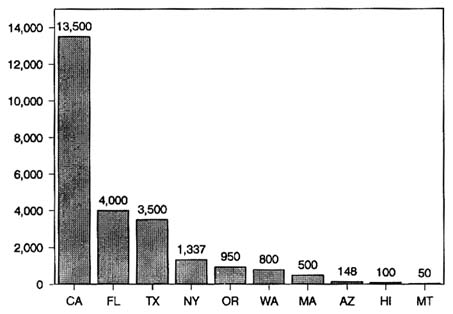
FIGURE 6-2 The number of food samples analyzed for pesticide residues in monitoring programs conducted by 10 states in 1987. SOURCE: OTA, 1988.
Department of Food and Agriculture, which in 1987 analyzed 13,500 samples of fresh fruits, nuts, and vegetables (State of California, 1987). Although routine postharvest monitoring is the largest component of the California program, efforts also include considerable preharvest monitoring (for early detection and deterrence), focused monitoring (to determine levels of specific chemicals of primary health concern), and foods to be processed (samples destined for processing and taken up to the point of actual processing).
Florida's Department of Agriculture and Consumer Services began monitoring raw agricultural commodities for pesticide residues in 1960. That program is targeted to potential problem areas in contrast to the random sampling conducted in California.
Many states have much more extensive pesticide analysis programs than is apparent in Figure 6-2, since they incorporate nonfood pesticide monitoring such as programs for farm worker health and safety and for groundwater contamination. To coordinate pesticide residue data from states and the FDA, the Mississippi State Chemical Laboratory, with FDA funding, has developed two U.S. data collection and dissemination programs: FeedCon provides information on contaminants in animal feeds;
FoodContam provides similar information for human foods. Participation in these programs is voluntary. At present, 21 states participate in FoodContam. There is an effort to enlist all states and agencies as data sources (Minyard et al., 1989).
Food Processing Industry Activities
The food processing industry has a special interest in pesticide residues in produce. If processed and packaged foods are found to contain illegal residues or residues with the potential to cause adverse health effects, entire lots may need to be recalled from distribution centers and even from grocer's shelves. Tolerance levels must be established for any residue that concentrates during food processing (e.g., milling, cooking, and dehydrating). The behavior of residues during processing is evaluated based on processing studies required of the pesticide manufacturer before registration. Nevertheless, continual surveillance is needed to detect any unanticipated behavior, such as the formation of a previously unrecognized metabolite (Elkins, 1989).
The National Food Processors Association (NFPA) represents nearly 600 companies, including most of the major food processing companies in the United States. Approximately 450 of these companies are involved in processing common foodstuffs. Since 1960 the food processing industry has used the NFPA Protective Screen Program—detailed recommendations for preventing illegal and unnecessary residues, published annually in the Almanac of the Canning, Freezing and Preserving Industry (see, e.g., Judge, 1992). The recommendations involve washing, blanching, and processing steps, and emphasize proper use of chemicals at the farm source. NFPA operates National Food Labs in Dublin, California, in Washington, D.C., and in Seattle, Washington, to which food processors may submit fresh and processed commodities. Many food manufacturers and trade associations maintain analytical programs and data bank resources to accomplish the same purpose wherever possible and generally use the same multiresidue procedures as FDA. For example, NFPA uses the Luke method (PAM 212-3) to analyze for chlorinated hydrocarbons, organophosphates, carbamates, and substituted areas.
In 1988 EPA enlisted the help of NFPA and other groups to determine the availability and quality of data on pesticide residues in foods. Data were collected from 16 companies, including 3 major baby food companies, on more than 86,000 samples. Results indicated that 81% of these had no detectable residues (E. Elkins, NFPA, personal commun., 1992). More than half of the samples (47,737) were classified as fruit. Vegetables (14,037), tomatoes (8,424), and meat (8,215) were the next highest categories.
Potatoes (964) were given a separate category. The balance of the samples (6,947) were combined under miscellaneous; these were mostly flour samples in which the pesticide of interest was ethylene dibromide (EDB). In the fruit category, 8,573 of the samples were fresh or juice concentrates that were analyzed for Alar from 1985 to the present. Of these, 8,056 were negative for Alar.
From 1988 to the present, NFPA has been building a new pesticide residue data base that currently contains almost 74,000 samples, 97.5% of which had residues below the limit of quantification (LOQ) of the method used (E. Elkins, NFPA, personal commun., 1992). In the current data base, only 20% of the samples are raw foods. The balance is processed. Data from NFPA members usually pertain to crops on which the pesticide is known to have been used, but other data are random.
The data have been obtained from the food industry, from NFPA, and from other sources. NFPA plans to add data from the FDA/USDA APHIS monitoring and expects to eventually have more than 100,000 samples.
The pesticide residues reported so far include aldicarb on bananas, potatoes, and oranges; benomyl on apples and tomatoes; guthion on tomatoes and peaches; methamidophos in tomatoes; malathion on wheat; and diazenon on apples and tomatoes. The concentrations reported were at or near the LOQ.
Private, for-profit certification programs serve as third parties to verify the retailer's claims regarding residues on their produce. Some of the programs also certify growers who comply with a full disclosure statement of chemical usage and allow sample testing of their produce at random. Some large farming operations and commodity groups are beginning to do their own monitoring to ensure acceptability of their produce.
Private Laboratories
Commercial analytical laboratories have flourished in recent years, especially in analyses for pesticides and other toxicants in foods, water, soil, and waste sites. These laboratories must undergo a rigorous EPA certification procedure if they are to analyze groundwater/drinking water contamination by the pollutants of priority interest to the agency. There has been no similar certification for food residue analyses by either the FDA or any other agency. However, some states (such as California) are now instituting laboratory certification programs that involve inspection, performance standards, and adherence to GLPs. As a result of these certification programs, the data generated by these laboratories are becoming more consistent than in the past and promise greater reliability and more standardized operating procedures in the future.
QUALITY CONTROLS
All analytical laboratories (government, academic, and private) performing work of a regulatory nature must comply with GLPs as set forth in the Federal Register. In practice, this requires written protocols for
-
sample preservation;
-
sample processing and extraction;
-
sample preparation, including cleanup, concentration, and derivatization;
-
sample determination, including instrument tune-up and operating parameters, and confirmatory measures; and
-
data handling, including maintenance and interpretation of records.
Quality assurance/quality control (QA/QC) procedures specify that the method be validated by spiking-recovery experiments designed to assess each portion of the overall method from sample preservation through tabulating and interpreting numerical results. A QA officer must oversee the analyst and analysis. Records must be kept so that an outsider can reconstruct the analysis, including calculation of final results.
Because the GLPs and the quality assurance and control procedures are relatively recent developments, the quality and completeness of recent data may differ considerably from those produced from analyses done 3 or more years ago (Garner and Barge, 1988). In the past, for example, a zero was entered into the NFPA data base when no residue was detected, and the zero was entered into the NFPA data base when no residue was detected, and the zero was averaged with the positive values. Today, the term None Detected replaces the zero and the method's detection limit is stated. Furthermore, NFPA data were sometimes obtained by nonstandard methods (e.g., methods not in PAM) or without stated recoveries, detection limits, or quality assurance measures. At present, however, NFPA is requiring that each contributor of data complete a residue report form for each reported pesticide-food combination. Among the information required are the analytical method used, detection limits, quantitation limits, and recovery information. In addition, there has been no coordination with federal and state monitoring efforts but, as noted above, NFPA plans to include FDA and USDA in the future. Thus, NFPA's findings have added considerably to the data base on exposure to residues in food because the samples were "as-served," finished products, and the ongoing effort promises to be even more useful because of the new requirements.
MRMs used by individual agencies or laboratories may be modified, usually are not peer reviewed, and usually are not externally validated. Although this does not necessarily make them less reliable or of lesser quality than standard methods, the lack of external quality assurance
makes it difficult to assess their reliability. Improvements can be seen as a growing number of analytical laboratories adopt GLP. Compliance data may have the best quality because they require more stringent methodological control.
In general, the lack of quality control procedures limits assessments of data quality. Confidence intervals cannot be assigned to monitoring results because of the general lack of sample replication, and degrees of uncertainty cannot be clearly defined.
LIMITATIONS OF THE DATA
Sources of Error
All residue determinations are subject to error caused by limitations in the training or skill of the analyst, in laboratory glassware and other equipment, in the reference standards used as the basis for quantitation, and in the instruments (chromatographs and spectrometers) used in the final determination. Error is also partially attributable to difficulty in identifying a relatively low response above a high (and variable) background noise from nonpesticide materials in the sample. As noted previously, total errors of 50% or more are not uncommon, even for standard procedures in the hands of experienced analysts. For example, a method that gives 80 ± 20% recovery (20% relative error and 20% relative standard deviation) yields a total error of 60%. In most cases, this is quite acceptable for laboratory validation of a new method. Such errors can be dealt with by running a larger number of replicate samples—a costly solution that is not often used.
Another source of error or uncertainty is the large, difficult-to-gauge variability due to sampling. This variability may be small in well-designed field experiments in which a chemical is applied by a calibrated sprayer to a uniform stand of grapes, or it may be unknown (but almost certainly large) when samples are taken from large shipping bins of grapes from several fields treated with different chemicals and applied by a variety of spray equipment. It is difficult to estimate the sampling error in random sampling of a field or lot, especially because of differences in the training of personnel and sampling protocols. A sampling error of 100% is probably conservative. When added to an analytical error of 50 to 100%, the overall uncertainty in a given analysis of a single commodity may be 200% or more. This is in addition to the inherent variability of residues due to uneven field applications of pesticides to the commodity of interest. Thus, a residue analysis that yields a 1-ppm level should be assigned a range of 0.3 to 3 ppm in the absence of any accompanying data relating to the actual error limits (Keith, 1983; Hance, 1989). This error tends to swamp
TABLE 6-3 Consequences of Averaging Fictitious Residue Data Sets in Which Nondetectsa Are Used at LOQ, 0, and 0.5 of LOQ
the generally small variation in the data sets in which LOQ, 0, or 0.5 of LOQ are used to compute averages. This can be seen in Table 6-3, which shows the consequences of averaging fictitious residue data when nondetects are assumed to be at the LOQ, zero, or one-half the LOQ.
Other Limitations
The limitations of the residue data derive also from the lack of consistency among methods used for sampling, analyzing, and processing residue data. The lack of commonality among the analytical methods used by agencies to monitor food for residues, in the number of chemicals included in the studies, especially metabolites and degradation products, or in the limits of detection of the methods impedes comparability of data and limits the utility of the data for exposure assessment. Thus the basic validity of the sample, including the extent to which it represents the population sampled, is frequently difficult to assess. This contributes to the uncertainty in the final residue report.
Federal, state, and industry groups differ considerably in their processing and reporting of data on residue levels. Residues that exceed established EPA tolerance levels are subject to confirmation and are included in the residue reports. Residues below the tolerance levels are usually reported but are not always confirmed. When a given method includes chemicals that are not present above the LOD, these absences are not always specified in the final residue report.
In calculating averages, some laboratories use only positive data (above the LOD), some include the LOD for nondetectables, and others enter a zero for nondetectables. The rigor with which positives and nondetectables are recorded, and positives are confirmed, varies from laboratory to laboratory. Thus it is difficult to judge the quality associated with individual residue results or averages. These are some of the reasons why it is not always possible to assess a given data set or to include its data in calculating average dietary exposures of the U.S. population.
Data are collected for different reasons and from clearly different populations. Random sampling of consumption data reflects overall estimates of dietary and pesticide intake. Surveillance or compliance samples are directed to problem areas suspected of violating tolerance levels and therefore involve intense appraisal of products to which the compounds have been applied.
The biases that exist in terms of the number (frequency) and types of samples collected are apparent. Negative observations are more frequent in a truly random sampling program. On the other hand, surveillance, targeted, or compliance sampling may provide primarily positive values. Residues are expected in these types of sampling because they are designed primarily to intercept violations of FIFRA and related federal and state codes. Identification, separation, and calculation of the discrete observation categories are essential, because data are drawn from clearly different populations. Yet many residue report compilations do not discriminate between the categories, or reasons, for sampling.
The results of many residue data sets are clearly skewed due to inadequate sampling plans or a heavy emphasis on pesticides or products that have high potential for violation or health risk. Sampling may be biased to seek positive results when application of the pesticides is known. Sampling intensity tends to decrease when the potential for a measurable residue does not exist, for example, when the pesticide is not used. This impedes assessment of residue exposure of children or infants, whose primary food items may not be sampled frequently enough to provide a broad data base of residue information.
A lack of detectable residues may be an important signal that the compound is not used because of a lack of approval, local practice, or lack of a need to control pests. Several factors may lead to uneven, or no, use of a pesticide, even when it has been granted regulatory clearance. Prominent among these are climatic conditions, agricultural practices, and economic exclusion. Because pesticide costs account for a relatively large portion of the total cost of growing crops, unneeded pesticides or excessive quantities of pesticides are rarely used and expensive products are replaced by less costly compounds when available. Furthermore, pesticide usage may be governed by recommendations issuing from a state
university extension program or a licensed pest control advisor and by the preference of the grower.
Agricultural practices can also be influenced by regulatory matters, consumer attitude (e.g., toward Alar), and manufacturer decision (e.g., about benomyl). Approvals may have been terminated for a specific use of a compound. Examples include ethylenebisdithiocarbamates (EBDCs) and 1,3-dichloropropene (1,3-D). 1,3-D was suspended by only one state (California); its use was continued in others. Integrated pest management programs also favor some chemicals over others, or result in the increasing substitution of nonchemical control measures for chemical compounds.
When applied according to recommendation and practice, some pesticides are used to maintain soil conditions and are not absorbed by the plants. For example, when applied to soil according to specifications, aldicarb maintains soil activity and is not absorbed systemically by all produce. Some pesticides dissipate so rapidly that residues are usually not detectable at harvest.
Knowledge of the relationship between residue level and the amount actually consumed is incomplete. This stems from a generally inadequate understanding of residue behavior during the storage, processing, and preparation of foods as influenced by biological constituents, pH, temperature, moisture levels, and heat treatment. Data on residue behavior provided by registrants are not adequate. Extrapolation of the limited data to population subgroups may be subject to major sources of error.
PESTICIDES IN WATER
Because more water is consumed per kilogram of body weight than any other item in the diet (see Chapter 5), it is an important medium to consider in assessing total dietary exposure. For the pesticides examined in the Nonoccupational Pesticide Exposure Study (Immirman and Schaum, 1990), "exposure [to pesticides] from drinking water appeared to be minimal." (See Chapter 7, section on "Nondietary Exposure to Pesticides.") Unfortunately, however, the contribution of pesticide residues in drinking water is difficult to assess because of the variety of water sources (surface water and groundwater; public and private water systems) and because of the geographic differences and seasonal variations in pesticide use and consumption patterns. Moreover, no single survey of pesticides in food commodities has included both surface and groundwater sources of drinking water. As a consequence, it is not yet possible to estimate with any degree of certainty all the variations that must be considered in assessing dietary exposure to pesticide residues in water used in the processing and preparation of foods. The data that have been produced are discussed in the following paragraphs.
Groundwater
Approximately 53% of the U.S. population (more than 97% in rural areas) draws its drinking water from groundwater sources (USGS, 1988), which supply 40.1% of the water in public systems (USGS, 1990). This source of water has been the subject of several studies.
Hallberg (1989) reported that residues of 39 pesticides and their degradation products have been detected in the groundwater of 34 states and Canadian provinces. The sources of these data ranged from controlled field studies to ongoing programs to monitor public water systems. The pesticides most frequently reported were mobile or volatile compounds used in soil treatments, such as aldicarb and its products, which were detected in 24 states from California to Maine. EDB was found in 12 states, 1,2-dichloropropane (1,2-D) in 7 states, and dibromochloropropane (DBCP) in 5 states. Also prominent were herbicides widely used in the humid regions of the corn belt. These included alachlor, atrazine and its products, cyanazine, dicamba, dinoseb, metolachlor, metribuzin, simazine, trifluralin, and 2,4-D. The most frequently detected pesticides were the triazine herbicides atrazine, cyanazine, and simazine.
Most of the herbicides found in groundwater in these studies are still widely applied (USDA, 1992b); however, many of the fumigants and nematicides are no longer in use. According to a study conducted for the EPA by Williams et al. (1988), registrations of 16 pesticides have been canceled or their use severely restricted, including the fumigants and nematicides 1,2-D, DBCP, and EDB.
In a compilation of data from groundwater monitoring studies conducted by pesticide registrants, universities, and government agencies, Williams and colleagues confirmed detections of 46 pesticides in the groundwater of 26 states resulting from normal agricultural use and 32 pesticides in 12 states attributed to point sources or pesticides misuses. Most frequently reported were atrazine (normal use, 13 states; point source, 7 states) and alachlor (normal use, 12 states; point source, 7 states). The median and maximum concentrations reported as a result of normal use were 0.90 ppb and 113 ppb for alachlor and 0.50 ppb and 40 ppb for atrazine.
In mid-1987, the Monsanto Company, manufacturer of alachlor, initiated the National Alachlor Well Water Survey (Holden and Graham, 1990). Its purpose was to estimate the proportion of private rural domestic wells that contained detectable residues of alachlor and other herbicides (atrazine, cyanazine, metolachlor, and simazine). The investigators used a three-stage, stratified, unequal probability selection procedure to obtain samples of 1,430 wells from the estimated 6 million private, rural, domestic
wells located in the 89 counties in 45 states where alachlor was sold in 1986. These wells serve 6.5 million households consisting of 20 million people. The wells located in areas of highest alachlor use and in areas of groundwater vulnerability had a higher probability of selection. Most counties were located in the midwest, northeast, and southeast, where pesticides containing alachlor are used primarily to control annual grasses and certain broadleaf weeds in corn, soybeans, and peanuts.
The results indicated that 100,000 people in the sampled area are consuming water from wells with detectable concentrations of the compound. They also suggest that an estimated 36,000 people are exposed to minimum concentrations of 0.2 µg/liter and that 3,000 people are exposed to concentrations at or exceeding 2 µg/liter—the maximum contaminant level (MCL).
The investigators found that 12.95% of the wells contained detectable residue levels of herbicides, the five highest being atrazine in 11.68%, alachlor in 0.78%, metolachlor in 1.02%, cyanazine in 0.28%, and simazine in 1.6%. Not only was atrazine detected in the highest percentage of the wells, it also exceeded the proposed MCL level by the highest percentage (0.09%), compared with alachlor (0.02%) and simazine (0.01%). Metolachlor and cyanazine were not found in levels higher than the MCL (Holden et al., 1990).
In 1990 the EPA completed a 5-year National Survey of Pesticides in Drinking Water Wells, the first survey undertaken to estimate the frequency and occurrence with which pesticides and their degradation products as well as nitrate were detected in drinking water wells (EPA, 1990). The investigators sampled 1,349 drinking water wells for 126 pesticides and products as a statistical representation of the more than 10.5 million rural domestic wells and 94,600 wells operated by the 38,300 community water systems that use groundwater. Their findings indicate that 10.4% [6.8–14.1%, 95% CI (confidence interval)] of the community water system wells and 4.2% (2.3–6.2%, 95% CI) of the rural domestic wells contain more than one pesticide.
The pesticides most frequently detected were the degradation products of the herbicide 2,3,5,6-tetrachloro-1, 4-benzenedicarboxylic acid dimethyl ester (DCPA), which were found in 6.4% of the community wells sampled and in 2.5% of the rural domestic wells. Next highest was atrazine (1.7% of the community wells and 0.7% of the domestic wells). Simazine, prometon, and DBCP were also found in both sources of groundwater, but with considerably lower frequency. Other pesticides found at lower frequencies were hexachlorobenzene and dinoseb in community wells and EDB, γ-hexachlorocyclohexane (γ-HCH), ethylene thiourea (ETU), bentazon, and alachlor in domestic wells in the United States.
Reported levels of DCPA products ranged from 0.35 to 0.89 µg/liter
in community systems and 0.22 to 0.63 µg/liter in domestic wells. Atrazine concentrations were 0.20 to 0.81 µg/liter and 0.18 to 1.04 µg/liter in community and domestic wells, respectively. The level of at least one pesticide was found to exceed the MCL or health advisory level (HAL) in 0.6% of the domestic wells and 0.8% of the community wells.
The EPA survey was designed to examine the relationships among contamination, groundwater vulnerability, and intensity of agriculture. Although the survey was stratified by patterns of pesticide use and groundwater vulnerability, the number of positive samples was generally too low to be considered representative of groundwater contamination or that could be used effectively by the committee in the estimation of exposure through groundwater.
Surface Water
Surface water contributes 59.9% of the water in public water systems (USGS, 1990) and supplies drinking water to approximately 47% of the U.S. population (USGS, 1988). The data on this source of the nation's water supply are even sparser than those for groundwater.
In addition to his study of groundwater, Hallberg (1989) compiled data on pesticide detections in raw and finished drinking water drawn from surface water supplies in Illinois, Iowa, Kansas, and Ohio. In most state samples, the detection rate for the herbicides alachlor, atrazine, cyanazine, metolachlor, and 2,4-D exceeded 67% in both raw and finished water. Less frequently detected were the herbicides butylate, dicamba, linuron, metribuzine, simazine, and trifluralin and the insecticides carbofuran and chlorpyrifos. Alachlor was detected in 54% of 334 raw water samples in Illinois, 67% of 15 raw water samples and 52% of 33 treated samples in Iowa, and 100% of 3 raw water and 4 treated samples in Kansas. Atrazine was found in raw water in 77% of the Illinois samples, in 93% of the Iowa samples, in 100% of the Kansas samples, and in lower percentages of the samples obtained in 12 other states (Hallberg, 1989).
Seasonal variations in pesticide concentrations in surface water are striking (Figure 6-3). Baker and Richards (1989) reported that time-weighted concentrations of atrazine, alachlor, and metolachlor peaked during the late spring and early summer months in the Maumee River, the Sandusky River, and Honey Creek—all in Ohio. Atrazine, alachlor, and metolachlor concentrations exceeded maximum contaminant levels and health advisory levels during that period but were well below them during the rest of the year (Figure 6-3). Similar seasonal patterns were noted in statewide observations of atrazine concentrations in Illinois (Good, 1988).
During the reporting period (1983 through 1988) in the Ohio study, the
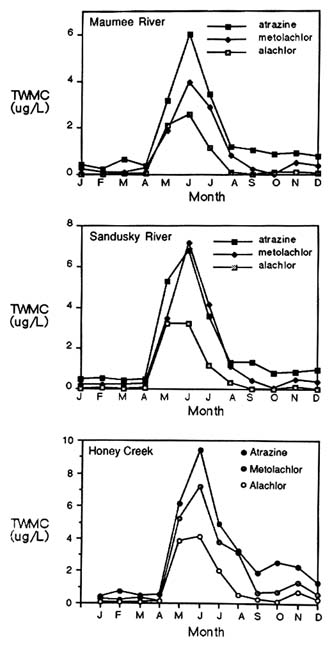
concentrations of the three pesticides also varied extensively from year to year. In the Sandusky River, for example, a time-weighted mean atrazine concentration of 7.81 µg/liter was reported in 1986 compared with 0.90 µg/liter in 1988. In general, the highest mean concentrations for all pesticides in all rivers were highest in 1986 and 1987, dropping in 1988 to levels lower than those recorded at the beginning of the observation period in 1983. The authors attributed these differences to variations in the timing, intensity, and amount of rainfall.
Thurman et al. (1991) reported similar results from a study of a much larger watershed encompassing most of the corn belt region (parts of South Dakota, Nebraska, Kansas, Minnesota, Iowa, Missouri, Wisconsin, Illinois, Michigan, Indiana, Kentucky, and Ohio). During May and June (the planting period), median concentrations of atrazine, alachlor, cyanazine, and metolachlor were 10 times higher than levels reported in March and April (before planting) and in October and November (after harvest).
The occurrence of herbicides (primarily molinate and thiobencarb) in California's Sacramento River has been monitored extensively. Peak concentrations, which occur during May and June, have declined over the past decade because of the initiation of water management programs designed to minimize herbicide runoff from rice fields (Department of Fish and Game, State of California, 1990).
The Importance of Water Data to Infants and Children
As demonstrated in Chapter 5, water is an important component of the diets of infants and children. Water consumed by itself, water added to infant formula, and water used in the preparation of foods may represent a significant source of pesticide exposure by ingestion. However, because of the limited information on pesticide residues in water and the lack of monitoring data on water intake by infants and children, quantitative risk estimates cannot be made at this time. The committee noted, however, that water residues tend to run in the low or sub-ppb levels when present, so that the contribution of waterborne residues to ingested food prepared by using water will generally be expected to be low, except in specific locations where water contamination is far above the U.S. average.
PESTICIDES IN INFANT FORMULA
Infant formula is one of the most important processed foods fed to babies not breastfed because it is usually their sole source of nutrition during the first few months of life. Although pesticide application to some components of processed foods is likely to have occurred at some point (e.g., field applications to crops used as infant formula ingredients), measurements
have consistently demonstrated that no pesticides are detected in finished infant formulas (Gelardi and Mountford, 1993). These invariably negative analytical findings are attributable to ingredient selection and processing procedures that reduce the potential for pesticide residues to appear in the finished product.
In preparing ingredients for use in infant formula, manufacturers use numerous separation and purification procedures and heat treatments that reduce pesticide residues in raw agricultural commodities (Swern, 1979; Pancoast and Junk, 1980; Considine and Considine, 1982a,b; Snyder and Kwon, 1987). Chemical and physical processes of refinement and purification include washing, solvent extraction, filtration (including carbon filtration), acidification, basic extractions, clarification (centrifugation), crystallization, deodorization, evaporation, spray drying, and heat treatments such as ultra-high temperature (UHT). Because of processing and the relatively low levels of the individual ingredients in finished products (e.g., soybean oil constitutes only 1.7% of some formulas), any likely pesticide residues in or on raw agricultural commodities are reduced below detectable limits.
Water is the principal ingredient (by weight and volume) of all liquid infant formulas. For example, ingredient water comprises approximately 87% of commercial ready-to-feed infant formulas. Ingredient water used in the processing of most infant formula is passed through activated carbon filtration columns. Analysis of influent and effluent for trihalomethanes (THMs) has shown the columns to be highly efficient at removing THMs from the water. THMs are among the most difficult compounds to remove from water by activated carbon filtration (McGuire and Suffer, 1983). Water treated in this manner is therefore considered by the manufacturers to be free of pesticide residues.
Infant formulas are broadly classified into two categories: those based on cow's milk and those based on soy protein. The manufacturing systems for producing the protein and carbohydrate ingredients used in the two formula types are quite different.
Infant Formula Based on Cow's Milk
The principal ingredients of infant formula based on cow's milk include cow's milk solids (after milk fat is removed), lactose (derived from cow's milk), and a combination of fats to provide an optimal lipid source for infants. In some cases, whey proteins derived from cow's milk are also a part of the formulation. The composition of a typical infant formula based on cow's milk is shown in Figure 6-4.
The effects of processing (e.g., fat removal, isolation of lactose, isolation of whey proteins) on any potential residues of pesticides of interest can
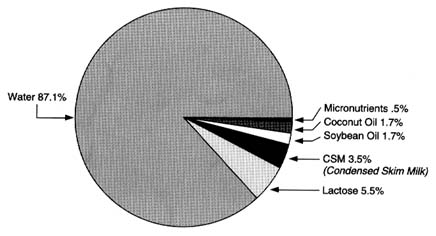
FIGURE 6-4 The composition of a typical infant formula based on cow's milk.
SOURCE: Infant Formula Council, Atlanta, Georgia, unpublished.
be logically postulated from the chemistry of the pesticides and the effects of various stages of processing. The production of lactose and whey protein concentrate is illustrated in Figure 6-5. Figure 6-6 illustrates the production of condensed skim milk and nonfat dry milk from raw cow's milk. Temperature extremes and highly effective purification processes, such as crystallization, can be expected to reduce any pesticide residues (Buchel, 1983; Hartley and Kidd, 1983; Hayes, 1975).
The likely effect of processing potential pesticide residues in raw cow's milk and the contribution of ingredients derived from cow's milk is illustrated in the following example. Assume that chlorpyrifos is present at its tolerance level of 0.020 ppm in raw cow's milk (FDA, 1989). Processing of milk to lactose could be expected to reduce that residue to 0.0002 ppm in the lactose (R.C. Gelardi, Infant Formula Council, personal commun., 1990). This is based on the assumption that 99% of any residue present would remain in the curd along with the lipids during the processing of milk into lactose (see Figure 6-5) because of the hydrophobic nature of chlorpyrifos (79% solubility in isooctane compared with 0.0002% in water). Similarly, processing is likely to reduce the residue in raw milk to 0.0005 ppm in condensed skim milk, assuming that 99% of any residue present would remain in the cream along with the lipids during the processing of milk into condensed skim milk (see Figure 6-6) because of the hydrophobic nature of chlorpyrifos (R.C. Gelardi, Infant Formula Council, personal commun., 1990). A concentration factor of 2.5 is assumed for finished
condensed skim milk, resulting in a concentrating effect of the 1% of the residue assumed to reside in the skim milk fraction. Because infant formula contains 5.5% lactose and 3.5% condensed skim milk, the total possible theoretical contribution of these two milk-derived ingredients to the formula is 0.00003 ppm. This calculation is based on the preceding worst case assumptions and the percentages of lactose and condensed skim milk in a typical cow's milk-based infant formula, as noted in Figure 6-4. Thus, although condensed skim milk and lactose are major ingredients in infant formulas based on cow's milk, they are not expected to contribute greatly to potential pesticide residues.
The primary sources of lipids used in these formulas are soy oil and coconut oil. As with lactose and condensed skim milk, the contribution of these oil ingredients to pesticide residue levels in the finished product can be theoretically predicted. For example, the EPA tolerance concentration for malathion on soybeans is 8 ppm. Processing is expected to reduce the residue level in soybean oil to 4 ppm. And since infant formula based on cow's milk contains about 1.7% soybean oil, the theoretical maximum concentration of this pesticide in the soybean oil contained in the finished product would be 0.068 ppm.
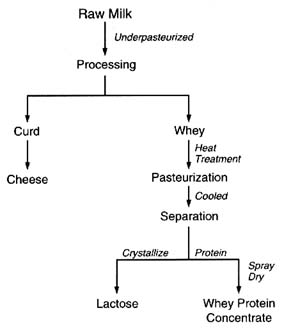
FIGURE 6-5 Steps in the production of lactose and whey protein concentrate from raw cow's milk.
SOURCE: Infant Formula Council, Atlanta, Georgia, unpublished.
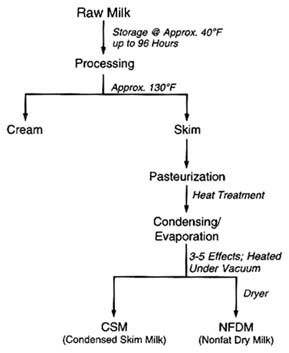
FIGURE 6-6 Steps in the production of condensed skim milk and nonfat dry milk from raw cow's milk.
SOURCE: Infant Formula Council, Atlanta, Georgia, unpublished.
Soy-Based Infant Formula
The composition of a typical soy-based infant formula is shown in Figure 6-7. The principal ingredients include soy protein isolate and soy oil (the predominant ingredients derived from soybeans) as well as corn syrup solids, sucrose, and coconut oil. Soy protein isolate is a specific protein fraction derived from soybeans. Following isolation, purification and modification are required to provide a protein source that will be nutritionally beneficial to infants. The soy protein isolation process involves several physical and chemical operations that effectively decrease any pesticide concentrations (Figure 6-8). Flaking and drying (heat treatment) are used to physically alter beans to an extractable form. Hexane extraction is used to separate the oil (lipid) fraction of the soybean flakes from the nonfat portions. Any lipophilic pesticide residues that have survived previous treatment can logically be expected to be carried into the solvent phase in this operation. Residual hexane is removed from the protein-containing solids by evaporation (heat treatment). The protein is
then extracted from the solids with alkali (destructive to alkaline-sensitive residues), and the proteins are then precipitated by adjusting the pH to their isoelectric point. This step reduces acid-sensitive residues, and water-soluble survivors are partitioned into the aqueous supernatant.
The acid protein precipitate constitutes the basis for the soy protein isolate. This protein fraction is further processed by UHT treatment, neutralization, and spray drying, which result in the finished soy protein isolate. It is therefore not likely that significant residues on the raw agricultural product (soybean) would still be present in the finished product.
The following example illustrates the extent to which processing can reasonably be expected to diminish residues that have survived harvest and are present at the soybean processing plant. The tolerance concentration for malathion on soybeans is 8 ppm. Processing can be expected to reduce the level of malathion in soy protein isolate to 0.016 ppm, assuming that 30% of any initial malathion residue would be extracted into hexane and an additional fraction (approximately 50% of the original residue) would be decomposed in the alkaline extraction of protein from the defatted meal. Only 1% of the remaining residue (or 0.2% of the original residue of 8 ppm at the tolerance concentration) would be expected to precipitate with the soy protein isolate (R.C. Gelardi, Infant Formula Council, personal commun., 1990). Since soy protein isolate typically constitutes 2% of soy-based infant formulas, the potential maximum possible level of
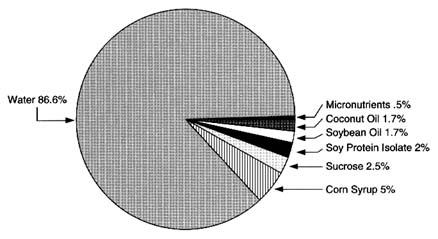
FIGURE 6-7 The composition of a typical soy-based infant formula.
SOURCE: Infant Formula Council, Atlanta, Georgia, unpublished.
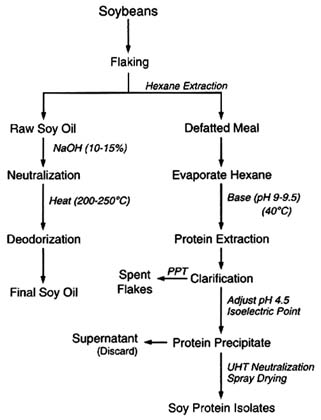
FIGURE 6-8 The physical and chemical operations involved in the isolation of soy protein.
SOURCE: Infant Formula Council, Atlanta, Georgia, unpublished.
malathion (contributed by soy protein isolate) in the final product would be 0.0003 ppm.
Thus, the reductions of pesticide residues achieved by processing raw agricultural commodities combined with the relatively low concentrations of these ingredients in infant formulas account for the extremely low residue levels that can theoretically be predicted for infant formula, assuming maximum pesticide residue at EPA tolerances are initially present on the raw agricultural commodity. As stated earlier, extensive analytical testing of infant formula has failed to result in the detection of any pesticide residues.
Theoretical Maximum Residue Contributions
In numerous instances, a pesticide residue will be substantially diminished—or traces of the compound eliminated—as a result of processing
TABLE 6-4 Theoretical Maximum Residue Contributions and Limits of Quantification
|
Pesticide (ppm) |
Predicted Potential Maximum (ppm) |
Limit of Quantificationa |
|
Captan |
0.017 |
0.006–0.050 |
|
Malathion |
0.068 |
0.002–0.050 |
|
Methylparathion |
0.001b |
0.002–0.050 |
|
Diazinon |
0.002b |
0.002–0.050 |
|
Carbaryl |
0.056 |
0.002 |
|
Disulfoton |
0.005b |
0.020 |
|
Dimethoate |
0.0002b |
0 |
|
Atrazine |
0.0002b |
0.002–0.060 |
|
Dichlorvos |
0.015b |
0.020 |
|
Daminozide |
0.002b |
0.5–1.0 |
|
Alachlor |
0.014 |
0.005 |
|
Carbofuran |
0.024 |
0.002 |
|
Aldicarb |
0.002b |
0.050 |
|
Benomyl |
0b |
0.1 |
|
Oxamyl |
0.0007b |
0.002 |
|
Methidathion |
0.002 |
0.002 |
|
a Detection limits vary with the method used and the criteria for definition. b Predicted potential maximum is below limit of quantification. SOURCE: Data from Infant Formula Council, 1993. |
||
steps such as evaporation, distillation, partitioning, isoelectric separation, or oxidation-reduction. Such changes have been observed during the isolation of soy protein and deodorization of oil (Swern, 1979; Snyder and Kwon, 1987). Enriched samples are used to evaluate residue losses that may occur during processing. Residue levels present in unenriched samples are typically below the limit of detection, since compounds are either not used on the food or are removed through processing. Theoretical maximum residue contributions in infant formula and limits of quantification are shown in Table 6-4.
PESTICIDES IN HUMAN MILK
Tissue concentrations of chlorinated organic pesticides are found in most people in the United States, although generally in declining levels in recent years as chlorinated pesticide use in the United States and worldwide has declined. The highest levels appear in regions where these pesticides are most commonly applied. Many of these lipid-soluble compounds are not cleared rapidly. Human milk is one route of elimination, but unfortunately that route increases the exposure of infants (Jensen,
1983; Wolff, 1983; Jensen and Slorach, 1990). In 1951, Laug et al., were the first to report an analysis of pesticides in human milk, in this case the presence of DDT and its metabolites. Since then, there have been many surveys of pesticides in human milk—some in response to episodes of food or dairy product contamination. The data from these surveys have been used to compare pesticide concentrations in human milk to allowable daily intakes.
In general, the more recent surveys of pesticides in human milk have demonstrated that the concentrations are lower than was observed in previous surveys. Despite this decrease in concentrations, more effort is needed to characterize the potential adverse effects of the low concentrations of chlorinated pesticides found in human milk. Initial attempts at estimating such effects associated with low concentrations have recently been described by Mattison (1990a,b, 1991) and Rogan et al. (1991).
DDT and Metabolites
DDT is an effective pesticide that has fairly low acute toxicity and has a long history of use worldwide (WHO, 1984; Murphy, 1986; Kurtz et al., 1989; Baker and Wilkinson, 1990). Concern over reproductive effects of DDT and its breakdown product DDE in birds and its long biological persistence led to the cessation of DDT use in the United States approximately 20 years ago (Hayes, 1975). Despite the two-decade ban, this pesticide and its metabolites continue to be found in human milk in the United States at decreasing concentrations over time, demonstrating the remarkable biological persistence of these halogenated organic compounds.
Surveys conducted before 1986 (Jensen, 1983; Wolff, 1983; Jensen and Slorach, 1990) demonstrated that p,p'-DDT or its metabolite p,p' -DDE were present in quantifiable concentrations in essentially all human milk samples assayed. Among samples analyzed in Arkansas in 1986, quantifiable concentrations of p,p'-DDT were found in 19%, and the metabolite p,p'-DDE was found in all samples surveyed (Mattison et al., 1992). The range of means of p,p'-DDT and p,p'-DDE reported in surveys of human milk in the United States before 1986 varied from 0.2 to 4.3 ppm and 1.2 to 14.7 ppm in milk fat, respectively. The mean concentrations among quantifiable samples from the survey in Arkansas were at the low end of these means. Among all samples, the mean concentrations were considerably lower than those previously reported.
The mean concentration of p,p'-DDT in all samples assayed in Arkansas was 0.039 ppm; the highest quantified level was 0.203 ppm (Mattison et al., 1992). In earlier surveys conducted in the United States, investigators found the mean concentration of p,p'-DDT to be between 0.2 and 4.3 ppm and p,p'-DDE to be between 1.2 and 14.7 ppm. Among all samples surveyed in Arkansas, the mean concentration of p,p'-DDE was 0.952
ppm. Among those with quantifiable concentrations, the mean was 0.954 ppm. This appears to show a continued decrease in DDT concentrations in human milk over the years.
Dieldrin
Dieldrin is an oxygenated metabolite of aldrin that persists in adipose tissue. Because of its persistence and toxicity, the parent compound, aldrin, has generally been removed from use in developed countries (Murphy, 1986; Kurtz et al., 1989; Baker and Wilkinson, 1990). Previous surveys conducted in the United States have identified detectable levels in 0.04% to 100% of the human milk samples analyzed (Jensen, 1983; Jensen and Slorach, 1990). Mean dieldrin concentrations ranged from 0.05 ppm to 0.24 ppm in milk fat (Jensen, 1983; Jensen and Slorach, 1990). The mean concentration in the 2% of Arkansas samples with quantifiable levels was 0.071 ppm. The mean concentration among all samples was 0.001 ppm (Mattison et al., 1992).
Lindane
Lindane is one component of a mixture of various isomers of hexachlorocyclohexane (HCH). The composition of the commercial pesticide is α-HCH or lindane (53–70%), γ-HCH (3–14%), µ-HCH or lindane (11–18%), δ-HCH (6–10%), and other isomers (3-10%) (Reuber, 1980). Lindane has been used as a substitute for DDT. In previous surveys conducted in the United States, HCH isomers were found in quantifiable concentrations in 4 to 68% of the human milk samples analyzed (Jensen, 1983; Wolff, 1983; Jensen and Slorach, 1990). α-HCH and γ-HCH, because of more rapid clearance, are generally found in fewer samples and in lower concentrations. This was also observed among the samples analyzed in Arkansas. However, because of its persistence, there are typically more samples with quantifiable levels of β-HCH and higher mean concentrations. For example, the β-HCH isomer was found in 27% of the human milk samples tested from Arkansas women (Mattison et al., 1992). Among those with quantifiable levels, the mean concentration was 0.12 ppm and among all samples, the concentration was 0.03 ppm. Lindane's agricultural uses in the United States have been virtually eliminated by changes in regulation over the past 20 years.
Hexachlorobenzene
Hexachlorobenzene is a persistent chemical with a variety of sources, including its previous use as a pesticide and its presence as an impurity in several other pesticide formulations. This compound can disrupt porphyrin
metabolism (Jensen, 1983; Jensen and Slorach, 1990). Fatal cases of infant poisoning have been reported from ingestion of highly contaminated human milk. Because of persistence and fat solubility, hexachlorobenzene has been detected in many surveys of adipose tissue and human milk (Jensen, 1983; Jensen and Slorach, 1990). Despite the fact that hexachlorobenzene has been detected in human adipose tissues in the United States, few studies have explored the presence of this chemical in human milk. Among previous surveys conducted in the United States, the mean concentration was 0.04 ppm in milk fat (range, 0.018 to 0.063). Among the 6% with quantifiable levels in Arkansas, the mean was 0.03 ppm, and among all samples, the mean concentration was 0.002 ppm; both are lower than earlier reports (Mattison et al., 1992). Hexachlorobenzene is no longer registered for agricultural use, and its occurrence as a formulation impurity in other registered products has been greatly curtailed.
Other Cyclodiene Pesticides
Heptachlor, chlordane, and their metabolites (heptachlor epoxide, oxychlordane, trans-nonachlor) are closely related cyclodiene pesticides (WHO, 1984; Murphy, 1986; Kurtz et al., 1989; Baker and Wilkinson, 1990). Surveys conducted in the United States have demonstrated that between 25% and 100% of human milk samples analyzed had quantifiable concentrations of heptachlor or heptachlor epoxide ranging from 0.035 to 0.13 ppm (Jensen, 1983; Jensen and Slorach, 1990). A somewhat greater proportion of samples (46% to 100%) had quantifiable concentrations of chlordane and oxychlordane (range, 0.05 to 0.12 ppm), perhaps reflecting frequent use as a termiticide in houses (WHO, 1984; Murphy, 1986; Kurtz et al., 1989; Baker and Wilkinson, 1990). Among samples surveyed in Arkansas, 5% had quantifiable concentrations of heptachlor (mean, 0.03 ppm) and 74% had quantifiable concentrations of heptachlor epoxide (mean, 0.06 ppm) (Mattison et al., 1992). Two percent of the samples in that study contained quantifiable concentrations of chlordane; 77% and 84% had quantifiable concentrations of trans-nonachlor and oxychlordane, respectively. The mean concentrations among quantifiable samples measured in Arkansas for trans-chlordane, cis-chlordane, and oxychlordane were 0.18, 0.15, and 0.06 ppm in milk fat respectively.
In most studies, heptachlor and/or heptachlor epoxide were detected in human adipose tissue samples. Curley et al. (1973) measured the concentration of chlorinated insecticides in fat samples from 241 Japanese people and found heptachlor epoxide concentrations that ranged from =0.01 ppm to 0.2 ppm (mean, 0.02 ppm). In Finland, Mussalo-Rauhamaa et al. (1984) demonstrated mean human adipose tissue concentrations of heptachlor epoxide as 2.7 µg/kg in males and 1.9 µg/kg in females. The
difference in male and female mean concentrations may represent different volumes of adipose tissue or elimination via breastfeeding among the women studied.
In a study of approximately 1,500 women, Savage et al. (1981) explored regional differences in the pesticide content of human milk. In the southeast region of the United States, including Arkansas, 76% of the samples tested had detectable levels of heptachlor epoxide. The distribution of heptachlor epoxide concentrations in samples was also higher in that southeast region. Only 23% of the samples tested contained trace or undetectable concentrations. Half of the samples (52%) had heptachlor epoxide concentrations ranging from 0.001 ppm to 0.1 ppm. The remainder (approximately 25%) contained concentrations above 0.1 ppm. This was the highest of all regions in the United States. The mean concentration of heptachlor epoxide in these samples with detectable levels was 0.128 ± 0.209 ppm, also the highest mean level of all the regions surveyed in the United States.
Similar studies of human milk in Pennsylvania (Kroger, 1972) and Missouri (Jonsson et al., 1977) have demonstrated mean heptachlor epoxide concentrations of 0.16 ppm and 0.0027 ppm, respectively. Studies conducted in Hawaii (Takahashi et al., 1981; Takahashi and Parks, 1982) whose inhabitants have also been exposed to heptachlor and heptachlor epoxide in dairy products have demonstrated levels ranging from 0.001 ppm to 0.067 ppm (range, 0.036 ppm) among women on Oahu, and from 0.015 ppm to 0.052 ppm (mean, 0.031 ppm) among women on neighboring islands.
With the exception of endosulfan, which does not exhibit the persistence and bioconcentration characteristics of other chemicals in the group, virtually all agricultural uses of the cyclodiene pesticides have been eliminated or greatly restricted by regulatory actions over the past 20 years.
Risks to Infants from Pesticides in Human Milk
Breastfeeding has substantial benefit (Lawrence, 1989), including psychological, immunological, and general health promotion. In many countries, breastfeeding confers measurable benefit such as decreased rates of infectious disease and increased rates of growth and development. Despite the concentrations of pesticides found in human milk, no major studies have demonstrated that these pesticide concentrations have led to adverse health outcomes in the children exposed through breastfeeding. Therefore, although there is concern that exposure to pesticides in human milk may carry some potential for adverse health effects for the mother and for the nursing infant, it is important to recognize that the benefits of breastfeeding are clear and have been demonstrated. Furthermore, surveys conducted
in the United States over the past four decades have shown that the number of samples with detectable pesticide concentrations have fallen—even when improved analytical methods with increased sensitivity have been used.
PESTICIDES IN FOODS
Recognizing the wide variation in sampling and analytical methods, size, and the overall design and objectives of existing residue testing programs, the committee requested residue data for its review from a variety of sources, including FDA, state regulatory agencies, the infant formula and baby food industries, the food processing industry, retail distributors, the agricultural chemical industry, and commodity associations. The most comprehensive and best recorded data were those collected through FDA's market basket sampling and analysis.
No single data bank provides ideal residue values. Residue analyses are complex, difficult to perform, and expensive. All data should be judged within this perspective. It is therefore important that samples be carefully identified and described, their processing and application history defined, and the capability and periods of analyses provided. Evaluation of the data bases provided to the committee emphasized the need for uniform sampling, collection, and reporting to reflect adequately the data's quality.
The FDA Surveillance Data
The FDA monitors pesticide residues in all food other than meat, milk, and eggs. The agency's monitoring program is not designed to determine dietary exposure to pesticides. Rather, its objective is to enforce compliance with EPA's tolerance levels. The usual point of sampling is the commercial warehouse, border crossings, points of importation, or some similar point after, but as close as possible to, the harvest. Table 6-5 shows the total number of samples and positive detections in FDA's surveillance program in 1988 and 1989. The ranges in both parameters are so wide that comparisons are very difficult. For example, dicrotophos samples were 100% positive, but the number sampled (15) is too small to be representative. For those pesticides with larger (>1,000) sample numbers, the highest percentages positive were found for benomyl (28.5%), EBDC (11.6%), and acephate (9.6%).
The committee reviewed FDA residue data on more than 100 different pesticides and selected a smaller subset for further analysis. The purpose was to isolate specific compounds for more extensive studies. Criteria for evaluation were
TABLE 6-5 Total of Samples and Positive Detections in FDA Residue Data
|
|
Samples |
||
|
Chemical |
Total No. Sampled |
No. Positive |
Percent Positive |
|
Bromophos-ethyl |
113 |
1 |
0.9 |
|
Dichlorvos |
763 |
1 |
0.1 |
|
Prothiofos |
1 |
1 |
100.0 |
|
Trichlorfon |
1 |
1 |
100.0 |
|
Cyanophos |
912 |
2 |
0.2 |
|
Ethoprop |
1,927 |
2 |
0.1 |
|
Atrazine |
669 |
4 |
0.6 |
|
Fonofos |
290 |
4 |
1.4 |
|
Fenthion |
267 |
6 |
2.2 |
|
Phenthoate |
2,328 |
10 |
0.4 |
|
Carbophenothion |
7,332 |
11 |
0.1 |
|
O-ethyl-O-p-nitrophenyl phenyl-phosphorothioate |
6,912 |
12 |
0.2 |
|
Mecarbam |
16 |
14 |
87.5 |
|
Dicrotophos |
15 |
15 |
100.0 |
|
Ethylene Thiourea (ETU) |
22 |
15 |
68.2 |
|
Fenitrothion |
5,171 |
30 |
0.6 |
|
Quinalphos |
40 |
30 |
75.0 |
|
Methoxychlor |
5,643 |
36 |
0.6 |
|
Phorate |
40 |
36 |
90.0 |
|
Phosphamidon |
3,499 |
63 |
1.8 |
|
Chlorfenvinphos |
9,299 |
66 |
0.7 |
|
Methomyl |
2,706 |
69 |
2.5 |
|
Aldicarb |
1,141 |
76 |
6.7 |
|
Phosalone |
11,857 |
82 |
0.7 |
|
Profenofos |
9,689 |
105 |
1.1 |
|
Disulfoton |
15,121 |
117 |
0.8 |
|
Daminozide |
514 |
125 |
24.3 |
|
Primiphos-methyl |
4,449 |
176 |
3.9 |
|
Monocrotophos |
18,617 |
191 |
1.0 |
|
Dicofol |
12,430 |
216 |
1.7 |
|
Parathion-methyl |
30,361 |
240 |
0.8 |
|
Benomyl |
1,023 |
292 |
28.5 |
|
Ethylenebisdithiocarbamate (EBDC) |
2,539 |
296 |
11.6 |
|
Phosmet |
15,604 |
335 |
2.1 |
|
Methidathion |
15,948 |
437 |
2.7 |
|
Azinphos-methyl |
15,320 |
474 |
3.1 |
|
Parathion |
40,029 |
591 |
1.5 |
|
Carbaryl |
11,212 |
632 |
5.6 |
|
Diazinon |
35,896 |
648 |
1.8 |
|
Ethion |
30,588 |
699 |
2.3 |
|
Malathion |
39,226 |
1,161 |
2.9 |
|
Mevinphos |
25,639 |
1,320 |
5.1 |
|
Dimethoate |
40,496, |
1,418 |
3.5 |
|
Captan |
30,108 |
1,499 |
5.0 |
|
Chlorpyrifos |
45,418 |
2,180 |
4.8 |
|
Acephate |
39,940 |
3,845 |
9.6 |
|
SOURCE: Based on FDA Surveillance Data, 1988–1989, unpublished. |
|||
-
volume of use and potential exposure,
-
route of exposure (food, water),
-
type of residue (surface, systemic),
-
toxic potency,
-
toxicity of particular concern with regard to infants and children,
-
general toxic end point (cancer, cholinesterase inhibition),
-
ability to characterize the potential risks that could arise from metabolic and physiologic differences between infants and adults, and
-
utility of the data in evaluating different risk assessment models.
The subset of pesticides considered further by the committee includes
-
total organophosphates and carbamates (high volume of use; some are easily detected by commonly used MRMs; and a common acute toxicity end point is cholinesterase inhibition);
-
EBDCs and their metabolites, e.g., ETU (EBDCs are used on foods such as apples, bananas, and other fruits and vegetables consumed in large amounts by infants and young children; ETU is a possible carcinogen);
-
benomyl (systemic residue; used on fresh fruits, berries, vegetables, and in fungicide problem areas; high percentage of residue occurrence in FDA surveillance program);
-
captan (used on foods such as apples, peaches, and pears, which are consumed in large amounts by infants and young children; potential reproductive effects; high percentage of residue occurrence in FDA surveillance program);
-
aldicarb (most acutely toxic pesticide registered; systemic residue presents high probability for exposure, potential for water-based exposure because it leaches into groundwater; used on citrus fruits, sugar beets, peanuts, pecans, and a variety of field crops and ornamentals);
-
atrazine (widely applied pesticide; used on grasses, grains, corn, macadamia nuts, and guava; detected in ground and surface water; putative hormonal effects); and
-
alachlor (widely applied pesticide; used on potatoes, corn, beans, peas, peanuts, and cotton; detected in groundwater; carcinogenic effects in animals).
Aldicarb, benomyl, and organophosphates were ultimately selected for the examples presented in Chapter 7.
The committee compared FDA's sampling frequency and sample sizes with the 18 foods shown to be most eaten by nursing and nonnursing infants in the USDA's 1977–1978 Nationwide Food Consumption Survey (NFCS) (see Chapter 5). As shown in Table 6-6, of the 18 foods most consumed by nursing and nonnursing infants under 1 year old, only
four—apples, peaches, peas, and green beans—are among the top 18 foods sampled by the FDA. This emphasizes the importance of certain foods in the diet and, hence, their potential for contributing pesticides to the diet. A more focused and specific monitoring system is indicated for targeting foods in infant diets.
FDA monitoring is focused on crops with a history of residues exceeding EPA tolerance levels, residues with no EPA-established tolerances, and crops harboring the greatest number of different pesticides. The committee could not determine if the high number of pesticides found on some frequently sampled foods was influenced by the larger sample size and, therefore, if larger sample sizes from other crops would lead to a finding of more pesticides on them also.
The committee recognized that the 1988–1989 FDA residue data were
TABLE 6-6 Comparison of 18 Foods Most Sampled by FDA and Those Most Consumed by Nursing and Nonnursing Infants
|
Foods Most Consumed by Infants Starting with the Highesta |
Foods Most Sampled by FDAb |
|
Milk, nonfat solids |
Peppers |
|
Apple juice |
Lettuce |
|
Apples, freshc |
Tomatoes |
|
Orange juice |
Apples, freshc |
|
Pears, fresh |
Beans, succulent, greenc |
|
Milk, fat, solids |
Peas, succulent, gardenc |
|
Peaches, freshc |
Grapes |
|
Carrots |
Strawberries |
|
Beef, lean |
Cantaloupe |
|
Milk sugar (lactose) |
Squash |
|
Bananas, fresh |
Pineapples |
|
Rice, milled |
Potatoes |
|
Peas, succulent, gardenc |
Oranges |
|
Beans, succulent greenc |
Eggplant |
|
Oats |
Broccoli |
|
Soybean oil |
Cucumbers |
|
Coconut oil |
Eggs |
|
Wheat flour |
Peaches, freshc |
|
NOTE: Foods are expressed as raw agricultural commodities (RACs) aSOURCE: Based on data from USDA, (See Tables 5-6 and 5-7 in Chapter 5). bSOURCE: Based on FDA Surveillance Data, 1988–1989, unpublished. c Foods both sampled and consumed the most by infants. |
|
collected for compliance purposes and were therefore not appropriate for comparisons with other residue data sets and for risk calculation. Nevertheless, the FDA data were valuable in comparisons with the 1977–1978 NFCS data on food consumption and provided the committee with useful information on residues in the food supply.
The committee then reviewed FDA's sample sizes and positive detections in the 18 foods most consumed by infants for aldicarb, benomyl, captan, chlorpyrifos, dimethoate, the EBDCs and their breakdown product ETU, and parathion-methyl (see Table 6-7). In general, the pesticides most frequently detected were benomyl, captan, chlorpyrifos, dimethoate, and EBDCs. Highest residues were found for EBDC (succulent peas), captan (fresh peaches), ETU (succulent peas), and captan (fresh apples). The pesticide with no positives was aldicarb. Parathion-methyl occurred at a very low frequency at very low levels. In just a few cases did maximum residues exceed tolerance, and in only one case (EBDC in succulent peas) was the maximum residue substantially above tolerance (23 compared with 7 ppm). In a few cases, residues were found for a chemical/ commodity for which no tolerance had been established; an example is dimethoate, which was found at very low frequency in fresh peaches, fresh bananas, and orange juice. The sources of occasional residues of dimethoate in food crops for which it has no tolerance was not known to the committee, although misuse or drift from neighboring fields is a possibility.
Number of FDA Samples
Adequate numbers of randomly selected samples are fundamental to developing good residue estimates for exposure and are essential to a statistically reliable basis for risk assessment. Because the FDA residue monitoring system is not designed to produce statistically reliable survey data on pesticide residues in food, sample sizes for individual foods are often small. This is true for several foods that are prominent in the diets of infants and children and for several pesticides with known toxicity.
FDA has recently to increase its focus on gathering information on pesticide residues in infant foods and other foods eaten by infants and children. The agency has summarized regulatory monitoring conducted in FYs 1985–1991 on eight fruit, fruit juice, and milk foods that are prominent in the diet of infants and children; incidence/level monitoring of approximately 900 prepared infant foods collected and analyzed in FY 1990–1991; and Total Diet Study (TDS) results for 33 different types of infant foods (strained/junior) collected and analyzed in FYs 1985–1991 (Yess et al., 1993). Infant foods analyzed under TDS and through the incidence/level monitoring showed that residue levels were well below EPA tolerances and that residue intakes are well below ADIs set by the
TABLE 6-7 Seven Pesticides Sampled by FDA in the 18 Foods Most Consumed by Nursing and Nonnursing Infants
|
|
|
|
Residue Levels, ppm |
|
|
|
Foods |
Pesticide Sampled |
No. Positive/ No. in Sample |
Mean |
Maximum |
EPA Tolerance Level |
|
Milk, nonfat solids |
Captan |
0/76 |
0 |
0 |
NT |
|
Chlorpyrifos |
0/399 |
0 |
0 |
NT |
|
|
Dimethoate |
0/7 |
0 |
0 |
0.0002a |
|
|
Parathion-methyl |
0/394 |
0 |
0 |
NT |
|
|
Apple juice |
Dimethoate |
9/110 |
0.0066 |
0.2800 |
NT |
|
Milk sugar (lactose) |
(No samples) |
|
|
|
|
|
Apples, fresh |
Aldicarb |
0/133 |
0 |
0 |
NT |
|
Benomyl |
35/134 |
0.1635 |
2.64 |
7.0 |
|
|
Captan |
125/978 |
0.0352 |
3.4000 |
25.0 |
|
|
Chlorpyrifos |
116/968 |
0.0064 |
0.9000 |
1.5 |
|
|
Dimethoate |
10/959 |
0.0006 |
0.1900 |
2.0 |
|
|
EBDC |
2/16 |
0.0937 |
0.7700 |
7.0b |
|
|
ETU |
0/1 |
0 |
0 |
NT |
|
|
Parathion-methyl |
37/957 |
0.00176 |
0.2600 |
1.0 |
|
|
Orange juice |
Chlorpyrifos |
105/551 |
0.0248 |
0.5000 |
NT |
|
Dimethoate |
5/537 |
0.0003 |
0.0500 |
NT |
|
|
Parathion-methyl |
6/544 |
0.0008 |
0.1780 |
NT |
|
|
Peaches, fresh |
Aldicarb |
0/34 |
0 |
0 |
NT |
|
Benomyl |
13/26 |
0.2095 |
1.1100 |
15.0 |
|
|
Captan |
48/574 |
0.1329 |
9.6900 |
50 |
|
|
Chlorpyrifos |
14/581 |
0.0013 |
0.1300 |
0.05 |
|
|
Dimethoate |
2/561 |
0.0001 |
0.0875 |
NT |
|
|
EBDC |
1/13 |
0.0154 |
0.2000 |
10.0b |
|
|
Parathion-methyl |
4/570 |
0.0024 |
0.0900 |
1.0 |
|
|
|
|
|
Residue Levels, ppm |
|
|
|
Foods |
Pesticide Sampled |
No. Positive/ No. in Sample |
Mean |
Maximum |
EPA Tolerance Level |
|
Pears, fresh |
Aldicarb |
0/13 |
0 |
0 |
NT |
|
Benomyl |
1/23 |
0.0691 |
1.5900 |
7.0 |
|
|
Captan |
18/431 |
0.0155 |
1.0000 |
25 |
|
|
Chlorpyrifos |
6/454 |
0.0003 |
0.0400 |
0.05 |
|
|
Dimethoate |
10/455 |
0.0024 |
0.3850 |
2.0 |
|
|
EBDC |
0/3 |
0 |
0 |
7.0b |
|
|
Carrots |
Aldicarb |
0/41 |
0 |
0 |
NT |
|
Benomyl |
0/1 |
0 |
0 |
0.2 |
|
|
Captan |
1/390 |
0.0021 |
0.8300 |
2.0 |
|
|
Chlorpyrifos |
2/402 |
0.0001 |
0.0200 |
NT |
|
|
Dimethoate |
0/375 |
0 |
0 |
NT |
|
|
EBDC |
0/34 |
0 |
0 |
7.0b |
|
|
Parathion-methyl |
1/394 |
0.00003 |
0.0100 |
1.0 |
|
|
Milk, fat solids |
Captan |
0/76 |
0 |
0 |
NT |
|
Chlorpyrifos |
0/424 |
0 |
0 |
0.05a |
|
|
Dimethoate |
0/7 |
0 |
0 |
0.002a |
|
|
Parathion-methyl |
0/419 |
0 |
0 |
NT |
|
|
Beef, lean |
Aldicarb |
0/1 |
0 |
0 |
0.01 |
|
Captan |
0/1 |
0 |
0 |
0.05 |
|
|
Chlorpyrifos |
0/1 |
0 |
0 |
2.0 |
|
|
Dimethoate |
0/1 |
0 |
0 |
0.02 |
|
|
ETU |
0/1 |
0 |
0 |
NT |
|
|
Parathion-methyl |
0/1 |
0 |
0 |
NT |
|
|
Soybean oil |
(No Samples) |
||||
|
Rice, milled |
Aldicarb |
0/6 |
0 |
0 |
NT |
|
Captan |
0/24 |
0 |
0 |
NT |
|
|
Chlorpyrifos |
0/29 |
0 |
0 |
NT |
|
|
Dimethoate |
0/14 |
0 |
0 |
NT |
|
|
Parathion-methyl |
0/27 |
0 |
0 |
NT |
|
|
Coconut oil |
(No samples) |
|
|
|
|
|
Bananas, fresh |
Aldicarb |
0/48 |
0 |
0 |
0.3 |
|
Benomyl |
8/72 |
0.0672 |
0.8200 |
1.0 |
|
|
Captan |
0/344 |
0 |
0 |
NT |
|
|
Chlorpyrifos |
16/347 |
0.0011 |
0.0400 |
0.05 |
|
|
Dimethoate |
2/347 |
0.0058 |
2.0000 |
NT |
|
|
EBDC |
4/100 |
0.0331 |
1.6000 |
0.50b |
|
|
Parathion-methyl |
0/347 |
0 |
0 |
NT |
|
|
Wheat flour |
Captan |
0/3 |
0 |
0 |
NT |
|
Chlorpyrifos |
0/5 |
0 |
0 |
NT |
|
|
Dimethoate |
0/1 |
0 |
0 |
NT |
|
|
Parathion-methyl |
0/5 |
0 |
0 |
NT |
|
|
Peas, succulent, garden |
Aldicarb |
0/31 |
0 |
0 |
NT |
|
Benomyl |
2/6 |
0.1000 |
0.4100 |
NT |
|
|
Captan |
2/705 |
0.0014 |
0.5900 |
2.0 |
|
|
Chlorpyrifos |
9/751 |
0.0017 |
0.4800 |
NT |
|
|
Dimethoate |
70/720 |
0.0341 |
2.8775 |
2.0 |
|
|
EBDC |
49/124 |
2.5964 |
23.000 |
7.0b |
|
|
ETU |
3/4 |
2.0075 |
4.2050 |
NT |
|
|
Parathion-methyl |
5/732 |
0.0009 |
0.5500 |
1.0 |
|
|
|
|
Residue Levels, ppm |
|
|
|
Foods |
Pesticide Sampled |
No. Positive/ No. in Sample |
Mean |
Maximum |
EPA Tolerance Level |
|
Beans, succulent, green |
Aldicarb |
0/45 |
0 |
0 |
NT |
|
Benomyl |
0/6 |
0 |
0 |
2.0 |
|
|
Captan |
3/776 |
0.0028 |
1.0000 |
NT |
|
|
Chlorpyrifos |
23/834 |
0.0027 |
0.5650 |
0.05 |
|
|
Dimethoate |
43/805 |
0.0120 |
2.3450 |
2.0 |
|
|
EBDC |
2/24 |
0.1042 |
2.0000 |
10.0b |
|
|
ETU |
1/1 |
0.2200 |
0.2200 |
NT |
|
|
Parathion-methyl |
5/809 |
0.0001 |
0.0700 |
1.0 |
|
|
Oats |
Captan |
0/12 |
0 |
0 |
NT |
|
Chlorpyrifos |
0/16 |
0 |
0 |
NT |
|
|
Dimethoate |
0/4 |
0 |
0 |
NT |
|
|
Parathion-methyl |
0/16 |
0 |
0 |
1.0 |
|
|
NOTE: NT, no tolerance level has been established by the EPA. a Tolerance for milk is given in the absence of tolerances for specific components. b EPA tolerance for Maneb, Zineb, and Ziram. SOURCE: Based on FDA Surveillance Data, 1988–1989, unpublished. |
|||||
Food and Agriculture Organization (FAO) and the World Health Organization (WHO). FDA's increased focus on residues in infant/ children foods, exemplified by information in the cited paper, is a positive development toward improving the quality and quantity of data available to ascertain dietary exposures of infants and children to pesticides.
Milk, apple juice, and orange juice rank high in the diets of infants but do not appear in the list of foods most often sampled (Table 6-6). In fact, during the 2-year period (1988–1989) covered by the FDA data , milk constituents had been sampled only for captan, dimethoate, parathion-methyl, and chlorpyrifos in sample numbers ranging from a high of 424 for chlorpyrifos in milk fat solids to 7 for dimethoate in milk nonfat and fat solids.
FDA sampled foods (commodities) as consumed. The agency did not sample milk sugar (lactose), soybean oil, or coconut oil, which are frequently components of infant food but are not consumed as individual commodities by infants and children. The FDA program would require restructuring in order to provide the data required to estimate exposure of infants and children for use in risk assessment.
Aldicarb, ETU, EBDCs, and benomyl cannot be detected by FDA's routine multiresidue methods; they require a single residue method. As shown in Table 6-7, the sample numbers for these pesticides are small (<25) for many of the foods most consumed by infants. These low numbers of samples can be of concern when pesticides are found on a high percentage of the samples and a large percentage of the crop acreage has been treated with the pesticides. Sample numbers higher than 25 are shown in Table 6-8 along with the percentage of positive detections in those samples. Overall, the FDA data appear to be adequate for the Committee's purposes, except for the low number of milk and juice samples. They are useful for comparison and discussion; however, the low number of samples does emphasize the need for careful selection and reporting. More complete and reliable information would be required for a comprehensive risk assessment.
Positive Detections
The ability of a survey to detect pesticide residues depends on at least three factors: the percentage of crop acreage treated with the pesticide, the sampling design of the survey, and the analytical limit of detection for the pesticide in that food. Other factors include the stability of the chemical; the time between pesticide application, harvest, and sampling; and the degree of postharvest processing. FDA laboratory staff that tests for pesticide residues in food have no prior knowledge of the pesticides applied to the crop being treated. The testing and sampling protocol is not designed to provide statistically valid sampling data.
TABLE 6-8 The Percentage of Positive Detections for Six Pesticides in Various Foods for Samples Larger than 25
|
|
|
|
Positive Samples |
|
|
Chemical |
Foods |
No. in Sample |
No. |
% |
|
Ethylenebisdithiocarbamate |
Peas |
124 |
49 |
40 |
|
Bananas |
100 |
4 |
4 |
|
|
Benomyl |
Apples |
134 |
35 |
26 |
|
Peaches |
26 |
13 |
50 |
|
|
Bananas |
72 |
8 |
11 |
|
|
Captan |
Apples |
978 |
125 |
13 |
|
Peaches |
574 |
48 |
8 |
|
|
Pears |
431 |
18 |
4 |
|
|
Carrots |
390 |
1 |
0.3 |
|
|
Peas |
705 |
2 |
0.3 |
|
|
Beans |
776 |
3 |
0.4 |
|
|
Chlorpyrifos |
Apples |
968 |
116 |
12 |
|
Peaches |
581 |
14 |
2 |
|
|
Pears |
454 |
6 |
1 |
|
|
Carrots |
402 |
2 |
0.5 |
|
|
Bananas |
347 |
16 |
5 |
|
|
Peas |
751 |
9 |
1 |
|
|
Beans |
834 |
23 |
3 |
|
|
Dimethoate |
Apples |
959 |
10 |
1 |
|
Peaches |
561 |
2 |
0.4 |
|
|
Pears |
455 |
10 |
2 |
|
|
Bananas |
347 |
2 |
0.6 |
|
|
Peas |
720 |
70 |
10 |
|
|
Beans |
805 |
43 |
5 |
|
|
Parathion-methyl |
Apples |
957 |
37 |
4 |
|
Peaches |
570 |
4 |
0.7 |
|
|
Beans |
809 |
5 |
0.6 |
|
|
Peas |
732 |
56 |
0.7 |
|
|
SOURCE: From FDA Surveillance Data, 1988–1989, unpublished. |
||||
Nonetheless, thousands of data points are generated by FDA. For the pesticides in the infant diet examined by the committee, the data show that positive pesticide residue detections are clearly more common in fresh fruits and vegetables, specifically in apples, peaches, pears, bananas, peas, green beans, and carrots (see Table 6-7), than in other commodities. Closer examination reveals that positive detections were less than 10% in most crop-pesticide combinations with 2-year samples larger than 25 (Table 6-8). However, the percentage of positive detections for these fruits and vegetables varies by pesticide and crop. The range extends from 0.3% positive for captan on carrots and peas to 50% positive for benomyl on peaches.
Residue Levels
Ultimately, it is the levels of residues on foods that are of concern in estimating exposure and risk. FDA data indicate that most of the residues detected in food are well below the established EPA tolerance levels (Table 6-9). In general, values most dramatically below those tolerances are residues of pesticides long used, such as captan and the EBDC fungicides. Rather high tolerances were established for these chemicals in the late 1950s without the benefit of current data on the health effects of pesticide residues.
The variability and small numbers (<25) of many of the 2-year samples of the foods and pesticides of concern make it difficult to calculate residues with any certainty. When the samples were of sufficient size for calculation, the mean residues were always below the EPA tolerance level.
Following the pattern of positive detections, the infant-food crops with the highest mean residues are fresh fruit and vegetables—specifically peas, apples, peaches, pears, carrots, and green beans (Table 6-9). Sometimes, residues were found on foods for which no tolerance levels had been set—benomyl on peas, captan on beans, chlorpyrifos on carrots and peas, and dimethoate on peaches. Six of the maximum residues shown in Table 6-9 exceeded the EPA tolerance levels—EBDC on peas, chlorpyrifos on peaches and beans, and dimethoate on peas and beans. In all these cases, however, the mean concentrations were considerably below the established EPA tolerance level and therefore represented a very small number of the samples. The only chemical for which mean residues approached tolerance was EBDC on succulent peas, for which the mean (2.6 ppm) was only slightly less than half the tolerance (7.0 ppm). This demonstrates the inappropriate application of tolerances, which were intended for another purpose—not to provide a margin of safety for infants and children.
Residue Distribution
Understanding the distribution of residues in the food supply is a key factor for estimating exposure accurately. As indicated in the preceding discussions, residues are skewed toward a relatively small portion of the food supply. To better understand this distribution, the committee looked at frequency distributions for pesticide residues throughout the entire food supply and on individual crops.
Effects of Processing
Processing may exert no effect on pesticide residues in foods, or it may increase or decrease concentrations. Therefore, the effects of processing
TABLE 6-9 Six Foods Among the 18 Most Consumed by Infants and the Tolerances and Residue Levels of Six Pesticides Detected in Them
on pesticide residues in food must be considered in a critical evaluation of the dietary exposure of infants and children to pesticides. Earlier in this chapter, the committee discussed the effects of processing on pesticide residues on the ingredients used in infant formula.
Elkins (1989) reported NFPA data on the effects of food processing operations on the residues of pesticides permitted on raw agricultural commodities. In most instances, washing by itself was shown to reduce residues, blanching reduced them even further, and the canning process led to even further decreases. These data indicated that in tomatoes and green beans subjected to each of these three steps, levels of malathion were reduced 99% and 94%, respectively, and carbaryl concentrations decreased 99% and 73%. Levels of parathion were reduced 66% in spinach and 10% in frozen broccoli. Elkins also pointed out that some processing activities can actually increase levels in certain instances. For example, levels of ETU were increased 94.5% in frozen turnip greens as a result of maneb degradation during cooking in a saucepan.
Elkins noted that the distribution of different pesticides in a product is also an important consideration. In tomatoes, for example, malathion tends to concentrate in the peel or waste, while carbaryl, a fairly polar compound, is easily removed by washing and does not tend to concentrate in waste material. Table 6-10 lists the residues of both pesticides in the washed and unwashed product, in the peeled tomato, and in waste material.
The committee reviewed unpublished data provided by the NFPA on pesticide residues found in foods used in processed baby foods. These foods, along with infant formula, comprise a large proportion of the infant's diet. Of the 6,580 samples tested in 1987, NFPA members found residues in 165 samples (2.5%) distributed among a total of 7 foods (Table
TABLE 6-10 Pesticide Concentrations in Washed and Unwashed Tomatoes, in Peeled Tomatoes, and in Waste Material
|
Tomato Product |
Malathion, ppm |
Carbaryl, ppm |
|
Unwashed |
15.9 |
5.2 |
|
Washed |
0.8 |
0.14 |
|
Peeled |
0.1 |
Trace |
|
Waste |
5.3 |
0.1 |
|
SOURCE: Elkins, 1989. Reprinted from Journal of the AOAC, Volume 72, Number 3, pages 533–535, 1989. Copyright 1989 by AOAC International. |
||
TABLE 6-11 Number of Samples and Detections for Foods Used in Baby Food
|
Product |
Sample Size |
No. of Ratio of Samples with Detected Residues |
Ratio of Maximum Detection to LOQ |
|
Apples, fresh |
1,560 |
27 |
11 |
|
Apples, juice |
1,602 |
24 |
5.6 |
|
Apricots, fresh |
260 |
0 |
— |
|
Bananas, fresh |
472 |
39 |
4.1 |
|
Beans, succulent, green |
28 |
0 |
— |
|
Carrots |
183 |
0 |
— |
|
Corn, sweet |
2 |
0 |
— |
|
Grapes, juice |
3 |
0 |
— |
|
Oats |
36 |
0 |
— |
|
Orange, juice |
220 |
0 |
— |
|
Peaches, fresh |
356 |
21 |
13.6 |
|
Pears, fresh |
328 |
47 |
140 |
|
Peas (garden), green immature |
1 |
0 |
— |
|
Pineapples, fresh, juice |
1 |
0 |
— |
|
Plums-Prunes, dried |
78 |
0 |
— |
|
Plums (Damsons), fresh |
193 |
0 |
— |
|
Rice, milled |
42 |
0 |
— |
|
Squash, summer |
226 |
0 |
— |
|
Squash, winter |
174 |
2 |
3.2 |
|
Sweet potatoes (including yams) |
815 |
5 |
4.2 |
|
SOURCE: National Food Processors Association, 1987, data unpublished. |
|||
6-11). As shown in the table, the largest number of positive samples and the highest ratio of detected residue to the LOQ were noted for fresh pears. The ratio represents a comparison of the highest concentration of amitraz found in pears to the relatively low (1 ppb) LOQ. The highest concentration found—140 ppb—is considerably lower than the EPA tolerance of 3,000 ppb.
A comprehensive study of the effects of processing on food residues is badly needed. This study should be undertaken by EPA, FDA, or USDA working through grants and contracts to university and private laboratories. The committee believes that the information presently available needs to be brought together in a review document and then supplemented with additional studies. However, this requirement is beyond the time and resources available to the committee. The committee therefore opted to provide some brief examples of the type of information that can be obtained on many of the foods consumed by infants and young children.
In these examples, the committee applies basic and deliberately simplified explanations of several processes involved in food preparation and processing.
In addition to infant formulas, which have already been discussed, the most critical and highly consumed foods are apple-based processed products and cereal-based foods. Following are brief overviews of the processing factors that influence pesticide residues in these foods.
Apple-Based Foods
Apple-based foods constitute a substantial portion of foods consumed by infants and young children, as shown in Chapter 5. Knowledge of the form in which these products are consumed is important to the understanding of residue data. Virtually all the foods consumed by infants are processed, and most are manufactured by a limited number of processors, who exercise stringent controls. The processing of apples for applesauce (which forms the basis for many foods) and apple juice is specific, and the controls for the finished products are extensive.
Steps in processing of apples for use in foods for infants and children involve washing, blanching, peeling, pressing (for juice), finishing (removal of fibrous or indigestible material), and heating (sterilization). The washing process removes the exterior (nonsystemic) compounds, and is effective in the removal of many pesticides. Blanching is done with steam or hot water, primarily to inactivate enzyme systems and to prevent discoloration. It involves treatment at high temperature for a relatively short time. The skin is removed by abrasion or by peeling with a knife. A substantial portion of nonsystemic pesticides is concentrated at the surface of the apple or in the peel. The calix (or core) is removed by actually cutting or by removing seeds and fibrous material with a finisher. Physical pressure, usually accompanied by heat or enzyme treatment, is used to separate clear juice from cellulose, fibrous (pectin), and protein material to yield a clear, light-colored juice. Pressing is conducted through a filter press with paper filtration or by ultrafiltration. Substantial pesticide concentrations are removed with the fibrous or protein fractions of apple solids. Thus, estimates at the farm gate are not reflective of the residue content of foods that have undergone such processing steps.
Infant Cereal
Infant cereal is consumed by a large percentage of infants. The lack of large pesticide residues detected in these products probably reflects the extensive and unique processes to which they are subjected.
The basic ingredient of infant cereal is flour, which is the dehulled and
fractionated grain (rice, oat, or barley) that has been milled. The flour is formed into a slurry, treated with a hydrolyzing enzyme (a-glucosidase), then heated to cook the cereal, destroy enzyme activity, and sterilize the food. The slurry is then dried on a steam-heated drum, which effectively distills off into steam any volatile material subject to partition.
The resulting product is a sterile, precooked, partially hydrolyzed cereal-based food. Clinical trials of usage have established the acceptance and digestibility of cereal for infant consumption. There has been no relationship established between retention of components in original grain to finished, processed infant cereal.
CONCLUSIONS AND RECOMMENDATIONS
Data on residues on foods are collected by FDA, state agencies, the food industry, private organizations, and in university programs such as IR-4. Other government, industry, and academic sources were identified by the committee for specific categories such as water, infant formula, and human milk, which are particularly important in the diets of infants and children. The committee also reviewed the complex and varied methods for pesticide residue analysis and sampling performed by these groups.
Conclusions
-
There is no comprehensive data source, derived from actual sampling, on pesticide residue levels in the major foods consumed by infants and children.
For example, of the foods (expressed as commodities) most consumed by nursing and nonnursing infants under 1 year of age, data showing the 18 foods most frequently tested for pesticide residues in the FDA Surveillance Program (Table 6-6) include only 4 of the 18 major foods consumed by this age group.
-
Data on pesticide residues in foods are extensive, but are difficult to interpret because of variation in sample selection, analytical methods, and quality control procedures. The extensive data available from numerous testing programs for pesticide residues in food would be far more useful in profiling residues in the diet if they were presented in a more complete and coherent form.
Food samples analyzed for pesticide residues may have been selected for surveillance, compliance, or other purposes. Analytical methods, their limits of quantification, and their degrees of precision and accuracy may therefore differ among laboratories. Record-keeping practices in pesticide
-
residue monitoring programs are generally not uniform and not well articulated.
-
Many of the existing data on pesticide residues were generated for targeted compliance purposes. Although these data may be appropriate for enforcement, they have limited usefulness in generation- or population-based evaluations of actual exposure. For example, the sampling technique over represents suspected violators and does not adequately represent foods eaten in large quantities by infants and children.
-
The limited data available suggest that pesticide residues are generally reduced by processing; however, more research is needed to define the direction and magnitude of the changes for specific pesticide-food combinations.
-
Infant formulas and processed baby foods are routinely monitored to ascertain pesticide residue levels. Although sampling and analytical techniques lack the desirable degree of uniformity, residues were not generally detected in these products.
-
Human milk is a food whose constituents are subject to wide variation, depending on the diet, medical history, and exposure of the mother. For some infants this may represent the primary route of exposure. Ongoing surveillance indicates that pesticide concentrations in human milk continue to decline over time, especially since organochlorine pesticide use in the United States has been reduced.
-
Pesticide residues in water—both drinking water and water used in food preparation—have previously been largely overlooked in assessing dietary exposure of infants and children.
Recommendations
-
A computerized data base for pesticide residue data collected by laboratories in the United States should be established.
If standardized reporting procedures were developed and adopted, pesticide residue data could be accumulated in a national data bank in a form accessible for future use.
-
In future applications of residue data, consideration should be given to the development of a standardized reporting format for use by all laboratories involved in residue analyses. Since pesticide residue data are
-
collected by a variety of laboratories using different methods for sampling and analyses, it would be desirable to maintain records of sample collection, analytical methods used, the basis of detection, and the precision and accuracy of the results obtained.
Reports of pesticide residue testing should indicate
-
food commodity analyzed (and whether it is processed or unprocessed),
-
Ranalytical method used,
-
compounds tested including metabolites),
-
quality assurance-quality control (QA-QC) notation, and
-
limit of quantification (LOQ).
These reports should follow a standard format, should be timely and consistent, and should include not only the LOQ but also all negative and positive findings. The methods of reporting must also be consistent (e.g., using similar computer software).
-
Food residue monitoring programs should target a special market basket survey designed around the diet of infants and children. The methods to be used in this survey should be validated using fortified samples circulated among the participating laboratories.
-
Residue analysis methods need to be standardized in a timely manner through an independent review and validation process conducted by a government or professional organization.
-
FDA, working with USDA, EPA, and state and other federal agencies, needs to create:
-
a clearly explained sampling strategy that could be used to ascertain the representativeness of the results of food residue analyses;
-
guidelines for those generating, processing, and using residue data to ensure that an explanation of LOQs and nondetectables are provided with all reports and are uniformly used in data analyses (e.g., in averaging);
-
a residue data management system that will improve the quality, accessibility, and comparability of food residue data, including those generated by the commercial sector; and
-
a repository of information on the fate of compounds during food processing and preparation.
-
-
Laboratories performing pesticide residue analysis for regulatory purposes should participate in QA-QC programs, including regular quality control checks by an independent, external organization.
REFERENCES
Baker, D.B., and R.P. Richards, 1989. Herbicide concentration patterns in rivers draining intensively cultivated farmlands of northwestern Ohio. Pp. 103–119 in Pesticides in Terrestrial and Aquatic Environments, D. Weigmann, ed. Blacksburg, Va.: Virginia Water Resources Research Center, Virginia Polytechnic Institute and State University.
Baker, S.R., and C.F. Wilkinson, eds. 1990. The Effect of Pesticides on Human Health. Advances in Modern Environmental Toxicology Ser.: Vol. XVIII. Princeton,N.J.: Princeton Scientific Publishing Co. 438 pp.
Buchel, K.H., ed. 1983. Chemistry of Pesticides. New York: John Wiley & Sons. 618 pp.
Considine, D.M., and G.D. Considine, eds. 1982a. Maize (corn) processing. P. 1132–1139 in Foods and Food Production Encyclopedia. New York: Van Nostrand Reinhold.
Considine, D.M., and G.D. Considine, eds. 1982b. Soybean processing. Pp. 1870–1883 in Foods and Food Production Encyclopedia. New York: Van Nostrand Reinhold.
Curley, A.V., W. Burse, R.W. Jennings, E.C. Villanueva, L. Tomatia, and K. Akazaki. 1973. Chlorinated hydrocarbon pesticides and related compounds in adipose tissue from people of Japan. Nature 242:338–340.
Department of Fish and Game, State of California. 1990. Hazard Assessment of the Rice Herbicides Molinated and Thiobencarb to Aquatic Organisms in the Sacramento River System. Environmental Services Division, Administrative Report 90-1. Sacramento: California Department of Fish and Game .
Dynamac. 1989. Anticipated Pesticide Residues in Food. Draft Final Report, Volume 1. Rockville, MD.: Dynamac Corp.
Elkins, E.R. 1989. Effect of commercial processing on pesticide residues in selected fruits and vegetables. J. Assoc. Off. Anal. Chem. 72(3):533–535.
EPA (U.S. Environmental Protection Agency). 1990. National Survey of Pesticides in Drinking Water Wells. Phase I. NTIS Doc. No. PB-91-125765. Springfield, Va.: National Technical Information Service.
FDA (Food and Drug Administration). 1989. Food and Drug Administration Pesticide Program. Residues in foods—1987. J. Assoc. Off. Anal. Chem. 72:133A–152A.
FDA (Food and Drug Administration). 1991. Food and Drug Administration Pesticide Program; Residue Monitoring 1991. Washington, D.C.: Food and Drug Administration.
GAO (General Accounting Office). 1986a. Pesticides: Better Sampling and Enforcement Needed on Imported Food. (GAO/RCED-86-219) Washington, D.C.: U.S. Government Printing Office.
GAO (General Accounting Office). 1986b. Pesticides: EPA's Formidable Task to Assess and Regulate their Risks. (GAO/RCED-86-125, Apr. 18) Washington, D.C.: U.S. Government Printing Office.
GAO (General Accounting Office). 1986c. Pesticides: Need to Enhance FDA's Ability to Protect the Public from Illegal Residues. GAO/RCED-87-7. Washington, D.C.: U.S. Government Printing Office.
GAO (General Accounting Office). 1992. Pesticides: Adulterated Imported Foods Are Reaching U.S. Grocery Shelves. Washington, D.C.: U.S. Government Printing Office.
Garnet, W.Y., and M.S. Barge. 1988. Good Laboratory Practices: An Agrochemical
Perspective. ACS Symposium Series 369. Washington, D.C.: American Chemical Society.
Gelardi, R.C., and M.K. Mountford. 1993. Infant formulas: Evidence of the absence of pesticide residues. Regul. Toxicol. Pharmacol. 17:181–192.
Gianessi, L.P. 1986. A National Pesticide Usage Data Base. Washington, D.C.: Resources for the Future.
Good, G., 1988. IEPA surface water monitoring support programs for pesticides. Pp. 97–107 in Pesticides and Pest Management, D. Cavanaugh, ed. Springfield, Ill.: Illinois Department of Energy and Natural Resources.
Hallberg, G.R. 1989. Pesticide pollution of groundwater in the humid United States. Agric. Ecosyst. Environ. 26:299–368.
Hance, R.J. 1989. Accuracy and precision in pesticide analysis with reference to the EC ''water quality" directive . Pest. Outlook 1:23–25.
Hartley, D., and H. Kidd, eds. 1983. The Agrochemicals Handbook. Nottingham, England: Royal Society of Chemistry.
Hayes, W.J., ed. 1975. Toxicology of Pesticides. Baltimore, Md.: Williams & Wilkins.
Holden, L.R., and J.A. Graham. 1990. Project Summary for the National Alachlor Well Water Survey. Monsanto Final Report NSL-9633. St. Louis, Mo.: Monsanto.
Holden, L.R., J.A. Graham, and D.I. Gustafson. 1990. The National Alachlor Well Water Survey. Part C, Statistical Analysis. Monsanto Final Report MSL-9629. St. Louis, Mo.: Monsanto.
Immerman, F.W., and J.L. Schaum. 1990. Nonoccupational Pesticide Exposure Study (NOPES), U.S. Environmental Protection Agency Order No. PB-90-152 224/AS. Springfield, Va.: National Technical Information Service.
Infant Formula Council. 1993. Infant formula: Evidence of the absence of pesticide residues. Unpublished paper prepared for the Infant Formula Council, Atlanta, Ga.
Jensen, A.A. 1983. Chemical contaminants in human milk. Pp. 1–128 in Residue Reviews: Residue of Pesticides and Other Contaminants in the Total Environment, F.A. Gunther and J.D. Gunther, eds. New York: Springer-Verlag.
Jensen, A.A., and S.A. Slorach. 1990. Contaminants in Human Milk. Boca Raton, Fla.: CRC Press. 288 pp.
Jonsson, V., G.J.K. Liu, J. Armbruster, L.L. Kettelhut, and B. Drucker. 1977. Chlorohydrocarbon pesticide residues in human milk in greater St. Louis, Missouri, 1977. Am. J. Clin. Nutr. 30:1106–1109.
Judge, D.P., ed. 1992. The Almanac of the Canning, Freezing, Preserving Industries. Vol. 2. Westminster, Md.: Judge & Sons.
Keith, L.H. 1983. Principles of Environmental Analysis. Washington, D.C.: American Chemical Society.
Keith, L.H., ed. 1988. Principles of Environmental Sampling. Washington, D.C.: American Chemical Society.
Kroger, M. 1972. Insecticide residues in human milk. J. Pediat. 80:401–405.
Kurtz, P.J., R. Deskin, and R.M. Harrington. 1989. Pesticides. In Principles and Methods of Toxicology, 2nd ed., A.W. Hayes, ed. New York: Raven.
Laug, E.P., F.M. Kunze, and C.S. Prickett. 1951. Occurrence of DDT in human fat and milk. A.M.A. Arch. Indust. Hyg. 3:245–246.
Lawrence, R.A. 1989. Breastfeeding: A Guide for the Medical Profession, 3rd ed. St. Louis: C.V. Mosby. 652 pp.
Lykken, L. 1963. Important considerations in collecting and preparing crop samples for residue analysis. Residue Rev. 3:19–34.
Mattison, D.R. 1990a. Estimate of Cancer Risk from Halogenated Pesticides in Human Breast Milk: Arkansas 1986. Society for Risk Analysis Annual Meeting, October 7–10, New Orleans, La.
Mattison, D.R. 1990b. Pesticides in Human Breast Milk: Population Based Estimates of Excess Lifetime Cancer Risk. Society for Risk Analysis Annual Meeting, October 7–10, New Orleans, La.
Mattison, D.R. 1991. Pesticides in Human Breast Milk: Changing Patterns and Estimates of Cancer Risk. Washington, D.C.: Society for Gynecologic Investigation.
Mattison, D.R., J. Wohlleb, T. To, Y. Lamb, S. Faitak, M.A. Brewster, R.C. Walls, and S.G. Selevan. 1992. Pesticide concentrations in Arkansas breast milk. J. Ark. Med. Soc. 88(11):553–557
McGuire, M.J., and I.H. Suffer, eds. 1983. Treatment of water by granular activated carbon. In Advances in Chemistry—Series 202. Washington, D.C.: American Chemical Society.
McMahon, B.M., and J.A. Burke. 1987. Expanding and tracking the capabilities of pesticide multiresidue methodology used in the Food and Drug Administration's pesticide monitoring programs. J. Assoc. Off. Anal. Chem. 70:1072–1081.
Minyard, J.P., Jr., W.E. Roberts, and W.Y. Cobb. 1989. State programs for pesticide residues in foods. J. Assoc. Off. Anal. Chem. 72:525–533.
Murphy, S.D. 1986. Toxic effects of pesticides. Pp. 519–581 in Casarett and Doull's Toxicology: The Basic Science of Poisons, 3rd ed., C.D. Klaassen, M.O. Amdur, and J. Doull, eds. New York: Macmillan.
Mussalo-Rauhamaa, H., H. Pyysalo, and R. Moilanen. 1984. Influence of diet and other factors on the levels of organochlorine compounds in human adipose tissue in Finland . J. Toxicol. Environ. Health 13:689–704.
NACA (National Agricultural Chemicals Association). 1988. Guidelines for Conducting Agricultural Chemical Residue Field Trials in the USA. Washington, D.C.: National Agricultural Chemicals Association.
Osteen, C.D., and P.I. Szmedra. 1989. Agricultural use trends and policy issues. In Agricultural Economic Report No. 622. Resources and Technology Division, Economic Research Service. Washington, D.C.: U.S. Department of Agriculture.
OTA (Office of Technology Assessment). 1988. Pesticides in Food: Technologies for Detection. Washington, D.C.: U.S. Government Printing Office.
Pancoast, H.M., and W.R. Junk. 1980. Handbook of Sugars, 2nd Ed. Westport, Conn.: AVI Publishing.
Reuber, M.D. 1980. Carcinogenicity of benzene hexachloride and its isomers. J. Environ. Pathol. Toxicol. 4:355–372.
Rogan, W.J., P.J. Blanton, C.J. Portier, and E. Stallard. 1991. Should the presence of carcinogens in breast milk discourage breast feeding? Regul. Toxicol. Pharmacol. 13:228–240.
Savage, E.P., T.J. Keefe, J.D. Tessari, H.W. Wheeler, F.M. Applehans, E.A. Goes, and S.A. Ford 1981. National study of chlorinated hydrocarbon insecticide residues in human milk. Am. J. Epidemiol. 113:413–422.
Snyder, H.E., and T.W. Kwon. 1987. Soybean Utilization. New York: AVI Publishing.
State of California. 1981. Pesticide Use Report, Annual. Sacramento: California Department of Food and Agriculture.
State of California, 1987. Perticide Residue Annual Reports. Sacramento: State of California.
Swern, D., ed. 1979. Bailey's Industrial Oil and Fat Products. New York: John Wiley & Sons.
Takahashi, W., and L.H. Parks. 1982. Organochlorine pesticide residues in human tissues, Hawaii, 1968–1980. Hawaii Med. J. 41:P250–251.
Takahashi, W., D. Saidin, G. Takei, and L. Wong. 1981. Organochlorine pesticide residues in human milk in Hawaii, 1979–80. Bull. Environ. Contam. Toxicol. 27:506–511.
Thurman, E.M., D.A. Goolsby, M.T. Meyer, and D.W. Kolpin. 1991. Herbicides in surface waters of the midwestern United States: The effect of spring flush. Environ. Sci. Technol. 25:1794–1796.
USDA (U.S. Department of Agriculture). 1983. Nationwide Food Consumption Survey. Nutrient Intakes: Individuals in 48 States, Year 1977–78. Report No. I-1. Hyattsville, Md.: Consumer Nutrition Division, Human Nutrition Information Service.
USDA (U.S. Department of Agriculture). 1991. Agricultural Chemical Usage 1990. Vegetables Summary. Economic Research Service Ag Ch 1(91). Washington, D.C.: U.S. Department of Agriculture.
USDA (U.S. Department of Agriculture). 1992a. Agricultural Chemical Usage 1991. Fruits and Nuts Summary. Economic Research Service, Ag Ch 1(92). Washington, D.C.: U.S. Department of Agriculture.
USDA (U.S. Department of Agriculture). 1992b. Agricultural Chemical Usage 1991. Field Crops Summary Economic Research Service, Ag Ch 1(92). Washington, D.C.: U.S. Department of Agriculture.
USDA (U.S. Department of Agriculture). 1992c. Pesticide Use on 1991 Fall Potatoes. Pp. 26–28 in Agricultural Resources: Inputs Situation and Outlook Report. Economic Research Service, AR-25. Washington, D.C.: U.S. Department of Agriculture.
USGS (U.S. Geological Survey). 1988. National Water Summary 1986: Hydrologic Events and Ground-water Quality. U.S. Geological Survey Water Supply Paper 2325. Denver, Colo.: U.S. Government Printing Office.
USGS (U.S. Geological Survey). 1990. National Water Summary 1987: Hydrologic Events and Water Supply and Use. U.S. Geological Survey Water Supply Paper 2350. Denver, Colo.: U.S. Government Printing Office.
WHO (World Health Organization). 1984. Environmental Health Criteria 38, Heptachlor. Geneva: World Health Organization.
Williams, W.M., P.W. Holden, and D.W. Parsons. 1988. Pesticides in Ground Water Data Base, 1988. Interim Report. NTIS No. PB-89-164230. Springfield, Va.: National Technical Information Service.
Wolff, M.S. 1983. Occupationally derived chemicals in breast milk. Am. J. Ind. Med. 4:259–282.
Yess, N.J., E.L. Gunderson, and R.R. Roy. 1993. Food and Drug Administration monitoring of pesticide residues in infant foods and adult foods eaten by infants/children. J. Assoc. Off. Anal. Chem. Int. 76:492–507.
Zweig, G. 1970. The vanishing zero. The evolution of pesticide analyses. In the Essays of Toxicology, Vol. 2. New York: Academic.


