
7
Estimating Exposures
THE TWO PRECEDING CHAPTERS have reviewed data on the diets of infants and children (Chapter 5) and on pesticide residues in food (Chapter 6). This chapter addresses methods for estimating ingestion of pesticides by infants and children using the data from the preceding two chapters. Although nondietary sources of pesticide exposures such as air, soil, and consumer products are also considered, emphasis is placed on the ingestion of pesticide residues present on foods consumed by infants and children.
Dietary exposure to pesticides depends both on food consumption patterns (Chapter 5) and on residue levels on food (Chapter 6). Multiplying the average consumption of a particular food by the average residue of a particular pesticide on that food yields the average level of ingestion of that pesticide from that one food commodity:
Consumption x Residue = Dietary Exposure.
In reality, however, estimation of dietary exposure to pesticides is more complex than this simplified equation. Since many pesticides are used on a number of food crops, determination of the total exposure to a pesticide must be based on consumption data for all such foods. Also, it may be of interest to consider the total ingestion of different pesticides such as organophosphates and carbamates that fall within related classes and may pose similar risks to health.
The data presented in Chapter 5 indicate that food consumption levels vary both among and within individuals. This variation can be represented in terms of a distribution of food consumption, reflecting both high
and low consumption levels, as well as the average level of consumption. Pesticide residue levels present in food will also vary, depending on several variables including application practices in different regions, time that has elapsed since application, degradation during transportation and storage of food, and the manner in which food is prepared by the consumer. Thus, both food consumption and pesticide residue data are characterized not by a single value but, rather, by a broad distribution reflecting high, low, and average values.
The variation in food consumption and residue data produces considerable variation in dietary exposure of pesticides by infants and children. This can be represented by a distribution of exposures across individuals within a particular age group. The distribution of dietary exposures is determined by the distribution of food consumption levels and the distribution of pesticide residues in food. If both the distribution of food consumption and the distribution of residue levels are known, statistical methods can be used to infer the distribution of dietary exposures. The process for combining different distributions into one distribution is termed convolution. The statistical convolution methods that can be used for this purpose are discussed later in this chapter.
Since ingestion of pesticides is dependent upon both food consumption and pesticide residue levels in food, it follows that the quality of dietary exposure data is determined by the quality of consumption and residue data. Although food consumption surveys such as the Nationwide Food Consumption Survey (NFCS) provide data on consumption patterns in the population at large, these surveys have generally not targeted infants and children. Hence, they included relatively small sample sizes within the age groups of primary interest for this report. One exception is the 1985–1986 Continuing Surveys of Food Intakes of Individuals (CSFII), which did focus on food consumption patterns of children.
Determination of the distribution of pesticide residues in foods consumed by infants and children is also difficult: only a fraction of all food consumed can be tested for the presence of pesticide residues. Many of the available residue data are based on surveillance studies that because of their focus on potential problem areas may overstate residue levels in the general food supply. The detection limit of residue monitoring methods can also impart uncertainty as to the residue levels actually present on food, especially when many residues are below the limit of detection and the detection limit is relatively high.
Recognizing these data limitations, the committee has included in this chapter several examples to illustrate possible approaches to estimating the distribution of dietary exposure to pesticides for infants and children. Each of these examples is designed to illustrate different aspects of exposure estimation, including the estimation of average daily exposures for use in chronic toxicity risk assessment and the estimation of peak exposures
for evaluating acute toxic effects. Examples are included to illustrate how total exposure to pesticides used on more than one food crop can be estimated, and how exposures from different pesticides falling within the same toxicological class can be combined based on their relative toxicity.
Because of the limitations in the available consumption and residue data, it must be stressed that the purpose of the examples is to identify methods for estimating exposure and not to produce representative estimates of actual exposure. The particular compounds chosen for study were selected data were available to illustrate the approaches to exposure estimation considered by the committee. All results should be taken in the context of the limitations of the data as described in this and the previous two chapters. Application of these methods in a regulatory context will be possible only if adequate data on the distribution of both food consumption and pesticide residues in food can be obtained.
The first example deals with benomyl, a systematic fungicide that has not been permitted for postharvest use in the United States since 1989. Because of the chronic toxic effects of this compound (benomyl has been shown to cause malignant liver tumors in mice), the average daily ingestion of benomyl was considered to be most relevant for estimating long-term exposure. Note that although the focus is on the average daily ingestion by individuals over an extended period, the daily ingestion will vary from person to person, depending on their food consumption habits and the residues of benomyl in the foods consumed by each person. Since residue data were available for apples, grapes, oranges, peaches, and tomatoes, this example was used to illustrate the estimation of total exposure to a single pesticide from multiple food commodities.
Data on benomyl from different residue monitoring programs were available to the committee, permitting a comparison of exposure estimates based on different residue data. For example, field trial data derived from pesticide analysis in the manufacturer's laboratory (using a special method not adapted to multiresidue screening) usually show higher detection rates than those found by government agencies in random sampling of food shipments. Field trial data are useful only as estimates of maximum residue concentrations from field test plot trials at treatment levels proposed for registration purposes. Because field tests are generally conducted at the maximum pesticide use allowed in its registration, the residue concentrations are often higher than those found in random sampling. The results of field trials are generally used to establish farm tolerances and analytical methodology for purposes of registration. Further evaluation of field trial data is required in order to evaluate pesticide degradation following application.
The impact of residue data below the limit of quantification (LOQ), a
concentration below which residues cannot be accurately measured, was also investigated in this example. For nondetectable residues, it is possible that the actual (unknown) residue could be as low as zero or as high as the LOQ itself. The limitation of data on actual residue concentrations below the LOQ imparts additional uncertainty about the level of exposure to infants and children.
Aldicarb is the subject of the second example. This acutely toxic pesticide exerts its effects by inhibiting cholinesterase enzymes in the nervous system. The example focuses on dietary exposure to aldicarb first from potatoes and bananas separately and then from potatoes and bananas combined. It serves to illustrate how estimates of exposure to a single pesticide found on more than one food can be derived. In contrast to benomyl, where average daily exposures are of interest, individual daily intakes are examined in this example because of the acute toxicity of aldicarb.
Part of the aldicarb residue data is derived from composite sampling, which may underestimate peak residues found in individual potatoes or bananas as a consequence of compositing prior to residue analysis. Composite samples are not very satisfactory in acute risk assessment for raw food commodities like potatoes and bananas. However, residue levels in processed foods can be estimated by using composite samples.
The third example addresses methods for estimating exposure to a class of pesticides inducing a common toxic effect. Specifically, the committee considered five organophosphate compounds used on different fruits and vegetables. All these compounds can inhibit plasma cholinesterase. A measure of total exposure to all five organophosphates is proposed based on their relative potencies.
Before these short examples are presented, there is a discussion of statistical methods for combining the distribution of food consumption with the distribution of residue levels in food to arrive at a distribution of dietary exposures based on the method of convolution. The chapter concludes with a brief summary of nondietary sources of exposure to pesticides.
THE USED OF FOOD CONSUMPTION AND RESIDUE DATA FOR EXPOSURE ASSESSMENT
Food Consumption Data
The most appropriate dietary exposure data for risk assessment depends on the nature of the adverse health effects of concern. In the absence of specific dose-response effects, the average level of exposure of an individual over a certain period provides a reasonable measure on which to
base estimates of chronic toxic effects such as cancer. For acute toxic effects, peak exposures over shorter periods are more appropriate for risk assessment.
Average Levels of Consumption
The development of food consumption data for evaluating chronic toxicity requires careful consideration. In general, food consumption surveys yield data on the consumption of that food over all days for which data are available. The average daily consumption for children within a given age class is then obtained by averaging across all the individuals in the age class.
Estimating the average daily consumption of a particular food within a given class warrants some discussion. Since some foods will not be consumed at all by some individuals, estimates of average daily consumption based on all individuals in the sample will underestimate average consumption for the subpopulation of individuals who consume the food in question. For this reason, separate estimates of average daily consumption for "all children" and for "eaters only" are considered when estimating exposure. Average consumption levels for "eaters only'' are typically 2 to 3 times higher than those for "all children."
Because food consumption data are available for only a few days each year, the proportion of children falling into the eaters-only group is underestimated. This problem is accentuated if only a 24-hour recall or 24-hour food record is used. If food consumption data were available for every day of the year, more children who consume the food of interest on an infrequent basis would be included in the eaters-only group. Thus, since the eaters-only group omits some individuals whose consumption levels are low, the average food consumption for "eaters only" calculated in this way actually overestimates the average consumption for this group. This bias does not occur when information on food consumption is obtained through food frequency questionnaires rather than 24-hour recalls or 24-hour food diaries, since food frequency tables in principle accurately identify those individuals who consume the food at any time during a given year.
Scientists working with food consumption data have long recognized that consumption by a "typical" individual will not be representative of consumption by people who eat large amounts of a particular food. This has stimulated interest in examining the distribution of average daily consumption levels across individuals in order to estimate consumption by individuals who consistently consume greater quantities of the food of interest than the average. This distribution of average daily consumption across individuals can be used to estimate upper quantiles of consumption,
such as the 90th, 95th, or 99th percentile. Reliable estimates of extreme percentiles can, however, be obtained only with relatively large sample sizes. Because the distribution of average daily intakes based on a sample of food consumption records for several days includes variability both between children and among days within children, this distribution will be subject to greater dispersion than would be the case if day-to-day variability were eliminated. (In the ideal case, this could be achieved by monitoring food consumption data over a full year or by using food frequency questionnaires.) The implication of such overdispersion is that upper percentiles of consumption will be overestimated.
Peak Levels of Consumption
Although the average level of individual exposure to pesticide residues in food is an important determinant of chronic toxicity, peak levels of exposure are more relevant for evaluating acute toxicity. Episodes of relatively high exposure occurring in a single day or even during a single meal may be more pertinent for acute risk assessment, depending on the toxic effect of interest.
The 1977–1978 NFCS provides information about food consumption during individual eating occasions for 3 different days. These data permit estimation of the total ingestion of a particular pesticide for each individual in the survey on each day. Using data for different individuals in the survey, one can estimate the distribution of person-days of consumption of specific foods. By combining this information with data on the distribution of pesticide residues in the food product or products of interest, it is then possible to estimate the number of person-days each year during which exposure to pesticides in the diet will exceed a critical level such as the reference dose (RfD), as defined in Chapter 8.
Although average levels of consumption and exposure will be reasonably well estimated with this approach, upper percentiles will be underestimated since food consumption data are available for only 3 of the 365 days in a year that are of interest. This is in contrast to the case for chronic risk assessment, where upper percentiles of exposure are likely to be overestimated.
Residue Monitoring
The point at which food samples are taken will influence the residue levels found. The highest residue levels generally occur immediately following application, and are reflected in field trial data. In samples taken for surveillance or compliance purposes, the residues will generally be higher than those in samples randomly drawn from the entire stock of a
particular food commodity available for sale in a particular region of the country. Market basket surveys are based on a composite sample of a limited number of commonly consumed foods after they have been cooked or prepared for consumption in the usual manner. Although market basket surveys provide residue data under conditions designed to emulate foods as consumed, they are limited because they provide only composite sampling results on a few foods included in a typical meal.
Most analytical methods for measuring pesticide residues in food are subject to an LOQ below which residue levels cannot be accurately determined. Although improved analytical methods for testing for pesticide residues in food have made it possible to detect lower and lower residue levels, even the most sensitive techniques are subject to an LOQ. When residue levels below the LOQ are reported, it is not possible to determine whether the food contains no residue of the pesticide of interest or whether there is a residue present but at a lower level than can be detected with the analytical methods used.
This uncertainty about the actual residue level with residues below the LOQ confers uncertainty on the distribution of pesticide residues in food products and, subsequently, on the distribution of dietary exposure to pesticide residues by individuals consuming those foods. For example, consider a hypothetical distribution of residue levels based on the analysis of a number of food samples that may have been treated with a particular pesticide, as shown in Figure 7-1. The residues above the LOQ will generally follow a log-normal distribution. However, an appreciable proportion of the samples will produce results below the LOQ.
What can be inferred about residue levels in samples below the LOQ? The only certain inference is that the actual residue level lies between a lower limit of zero and an upper limit equal to the LOQ. (Even this upper bound may not be entirely correct, since analytical results near the LOQ will be subject to some degree of measurement error.) Because not all crops grown in the United States are treated with pesticides approved for use on those crops, it is possible that results below the LOQ may be entirely pesticide free.
Consider, for example, the data on the use of different pesticides approved for use on apples shown in Figure 7-2. The percentages of the U.S. apple crop treated with specific pesticides varies widely, ranging from a low of 1% for malathion to a high of 90% for azinphos-methyl. Thus, most apples will not contain residues of malathion and would produce residue levels below the LOQ when tested. It is also possible tests for azinophos could yield results generally below the LOQ if residues of this widely used pesticide were present at low but nondetectable levels.
The data on pesticide use in Figure 7-2 also reveal marked regional differences in pesticide usage patterns in different regions of the country.
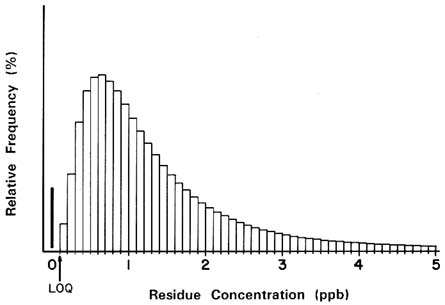
FIGURE 7-1 Hypothetical distribution of residue levels with a log-normal distribution for residues greater than zero.
Captan, for example, is widely used on apples grown in the central, northeast, and northwest regions of the United States but is virtually unused in the western regions of the country. Variation between pesticide usage patterns in different countries also warrants consideration with regard to imported food products.
In the past, results below the LOQ have been handled in different ways. A simple resolution of this uncertainty is to assume that all the results below the LOQ contain no residue and to assign them a residue level of zero. This is an optimistic approach, since the possibility of small but undetectable residues in some or all such samples cannot be excluded. A conservative approach is to assume that all residue levels are present at the LOQ. Although this may provide an upper bound on undetectable residues, it is unlikely that all the samples for which no residue was detected actually contain residues equal to the LOQ. An intermediate approach is to assume all nondetectable residues are present at one-half the LOQ. Clearly, the lower the LOQ, the less difference there will be between these different approaches, and the less uncertainty the LOQ will confer on estimates of potential human exposures.
Combining Residue and Exposure Data
Variation in food consumption patterns and in levels of pesticide residues in food leads to variation in dietary exposure to pesticides among infants and children. This variation in the ingestion of pesticide residues is characterized by a distribution of exposures, reflecting high, low, and average exposure concentrations. Statistically, the distribution of exposures can be obtained by convoluting (i.e., combining) the distribution of food consumption with the distribution of pesticide residues in food (Feldman and Fox, 1991). Thus, once the food consumption and residue distributions have been determined, the distribution of dietary exposures can be calculated (Figure 7-3).
The technical basis of convoluting two distributions can be described briefly as follows. Let C denote the consumption of a particular food by an individual, R the residue level in that food, and e the corresponding dietary intake or exposure level. The level of consumption will vary from person to person in accordance with the cumulative distribution FC(c) with corresponding density ƒC=F1. Note that FC(c) denotes the proportion
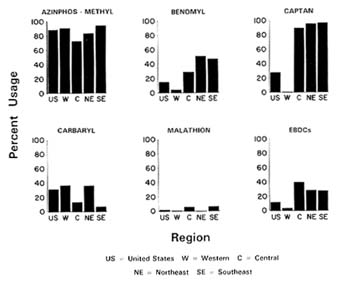
FIGURE 7-2 In the 1990 apple crop, percent of apple production treated with the following chemicals: azinphos-methyl, benomyl, captan, cabaryl, malathion, and EBDCs.
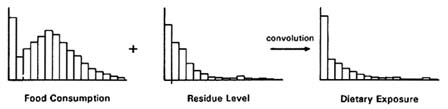
FIGURE 7-3 Convolution of food consumption distributions and residue distributions to produce dietary exposure distributions.
of the people in a given age group whose consumption C is less than a particular value c; the densities ƒC and ƒR reflect the relative frequency of different levels of consumption and residue, respectively, within the group. Letting FR denote the residue distribution with density ƒR=FR1, the distribution FE(e) of dietary intakes is defined by
assuming that consumption C and residues R statistically independent (Feldman and Fox, 1991, p. 349). This relationship provides the technical basis for combining the consumption distribution FC with the residue distribution FR to obtain the exposure distribution FE.
In practice, estimates of consumption and residue distributions are based on survey data and are represented as histograms based on the observe sample.(If different weights are attached to the survey observations, a weighted distribution should be used.) Computationally, these two distributions can then be convoluted simply by taking the result of each point from the consumption distribution and multiplying it by each point in the residue distribution; the distribution of dietary intakes is then defined by the distribution of these products.
This empirical approach to convolution will work well, provided that the number of observations used to obtain the consumption and residue distributions is not large. With large distributions, the computation burden can be reduced by working with a random sample of both the consumption and residue data. The Monte Carlo approach (i.e., random sampling) to convolution was used by the committee in those examples where the computational effort required to convolute the two distributions was found to be excessive. The form of Monte Carlo sampling used by the committee was simply a means of reducing the amount of computational time required for convolution by using the original consumption and exposure distributions; no artificial distributional assumptions were required
to implement this technique. The Monte Carlo distribution of dietary exposures will converge to that based on the entire exposure distribution as the number of Monte Carlo samples increases. As the number of samples converge, the distributions become identical.
The convolution method can be extended to more complex situations such as the estimation of total exposure to a pesticide that may be present on more than one food commodity. In this case, a single point on the exposure distribution is estimated by randomly combining points from the consumption distributions for all foods of interest with points from the corresponding residue distributions (one for each food), and then summing the total exposure across all foods. This process is repeated to generate a distribution of total exposures from all foods combined.
Total exposure to pesticides within the same class can be estimated in a similar fashion using the relative potency values for those pesticides to express the intake in toxicity equivalence factors. This is illustrated in the example of organophosphate pesticides later in this chapter.
LONG-TERM EXPOSURE TO BENOMYL
The Compound
Benomyl, or Benlate, is a systemic fungicide that was used in the United States from the time of its registration in 1972 until registration was voluntarily withdrawn for postharvest use by the manufacturer in 1989. Before then, it was the most widely used of the fungicides in the family of benzimidazole pesticides.
Benomyl is effective in preventing more than 190 fungal diseases, and it acts as a protective surface barrier while also penetrating the plant tissue to arrest infections. It was applied as a seed treatment, a transplant dip, and a foliage spray and was registered for use on more than 70 crops in 50 countries, including imported foods such as bananas and pineapples. In the United States, more than 100 EPA tolerances were established for benomyl in a variety of foods and feeds.
Benomyl has been shown to induce hepatocellular carcinomas, and combined hepatocellular neoplasms occurred in male and female mice treated with benomyl at all doses. In tests that included methyl-2-benzimidazole carbamate (MBC)—a metabolite of benomyl—investigators observed combined hepatocellular neoplasms in male mice and hepatocellular adenomas, carcinomas, and combined hepatocellular neoplasms in female mice (NRC, 1987). Because of its carcinogenic potential, exposure assessment for benomyl is based on the distribution of average ingestion levels for different individuals.
The Consumption Data
Data from USDA's 1985–1986 Continuing Survey of Food Intake of Individuals (CSFII) were found to be more suitable for use in this example than the data from the 1977–1978 NFCS: the CSFII is more current than the NFCS, and includes consumption data collected over 6 days at 2- month intervals over an entire year, as compared to the 3-consecutive-day sample in the 1977–1978 NFCS. The CSFII included 170 1-year-olds, 195 2-year-olds, 225 3-year-olds, 191 4-year-olds, and 209 5-year-olds.
Intake data were divided into person-day food intake, and consumption was then averaged for each individual in each age class across the days of the reporting period. For example, 170 average daily intake values were recorded for each food for each of the 1-year-old children surveyed. A probability distribution of exposures could then be constructed for each yearly age class.
The Residue Data
Five different sets of residue data on benomyl residues were reviewed by the committee for this example. They were
-
results of field trials conducted by the manufacturer,
-
results of a market basket survey conducted by the manufacturer,
-
1988–1989 compliance and surveillance data collected by the Food and Drug Administration (FDA),
-
data provided by the food industry, and
-
data from tests of raw food by a certification business operating in California.
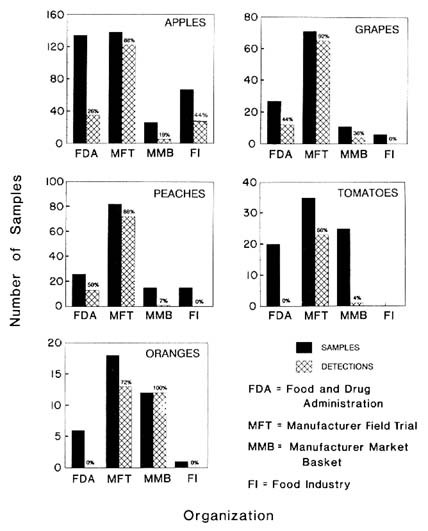
These data were collected using different sample designs, sample sizes, and analytical methods. Table 7-1 compares the number of benomyl samples and the number of detections for the FDA surveillance data, the manufacturer's field trials and market basket surveys, the food industry's data, and data supplied by the certification business. Data on apples, grapes, oranges, peaches, and tomatoes are shown in Figure 7-4 for all but the certification business.
Estimation of Exposure
Exposure was estimated using each of the five sets of residue data reviewed by the committee separately. An individual child's exposure to benomyl from a particular food was estimated by multiplying the mean
TABLE 7-1 Number of Benomyl Samples and Detections for Selected Foods Based on Data from the FDA, a Pesticide Manufacturer, the Food industry, and a Certification Business
|
|
FDA |
Manufacturer's Field Trials |
Manufacturer's Market Basket |
Food Industry |
Certification Business |
|||||
|
Food |
No. of Samples |
No. of Detections |
No. of Samples |
No. of Detections |
No. of Samples |
No. of Detections |
No. of Samples |
No. of Detections |
No. of Samples |
No. of Detections |
|
Apple |
134 |
35 |
138 |
122 |
26 |
5 |
68 |
30 |
127 |
65 |
|
Apple juice |
|
|
|
|
|
|
30 |
16 |
|
|
|
Apricot |
|
|
|
|
|
|
6 |
0 |
19 |
5 |
|
Banana |
72 |
8 |
|
|
|
|
4 |
0 |
|
|
|
Bean |
5 |
0 |
35 |
29 |
30 |
3 |
19 |
0 |
38 |
10 |
|
Blueberry |
|
|
|
|
|
|
3 |
0 |
14 |
3 |
|
Carrot |
|
|
|
|
|
|
|
|
12 |
1 |
|
Celery |
|
|
|
|
|
|
|
|
24 |
4 |
|
Cherry |
21 |
5 |
|
|
|
|
7 |
0 |
4 |
1 |
|
Cucumber |
|
|
|
|
21 |
1 |
|
|
4 |
1 |
|
Grape |
27 |
12 |
71 |
65 |
11 |
4 |
6 |
0 |
11 |
5 |
|
Watermelon |
5 |
0 |
|
|
|
|
3 |
0 |
|
|
|
Nectarine |
14 |
8 |
18 |
5 |
|
|
|
|
39 |
14 |
|
Orange |
6 |
0 |
18 |
13 |
12 |
12 |
1 |
0 |
6 |
1 |
|
Orange juice |
1 |
0 |
|
|
|
|
2 |
0 |
|
|
|
Peach |
26 |
13 |
82 |
72 |
37 |
1 |
15 |
0 |
81 |
44 |
|
Pear |
23 |
1 |
15 |
14 |
24 |
6 |
|
|
|
|
|
Pineapple |
25 |
18 |
|
|
|
|
|
|
7 |
4 |
|
Plum |
21 |
10 |
|
|
|
|
|
|
28 |
18 |
|
Raisin |
|
|
|
|
|
|
13 |
0 |
|
|
|
Raspberry |
14 |
0 |
|
|
|
|
2 |
0 |
17 |
6 |
|
Rice |
|
|
|
|
|
|
6 |
0 |
|
|
|
Squash |
4 |
0 |
|
|
|
|
4 |
1 |
|
|
|
Strawberry |
30 |
2 |
|
|
|
|
6 |
0 |
16 |
11 |
|
Tomato |
20 |
0 |
35 |
23 |
25 |
1 |
|
|
|
|
|
Wheat |
|
|
|
|
|
|
12 |
0 |
|
|
residue for that food by the average daily intake of that food. The exposures were then summed across up to 26 foods that 1-year-old children consume most to produce an average daily exposure estimate for each child. Note that different foods would be included with different residue data sets, depending on the availability of residue data for those foods. Finally, the distribution of average daily exposure from all foods combined across individuals was calculated.
The committee did not adjust these estimates for the percentage of the crop acreage treated. That adjustment is customarily applied by the EPA to residue data from field trials, thereby substantially reducing estimated exposures. EPA also multiplies the number of samples with no detected residues by the percentage of crop treated and assumes that residues in those samples are at the LOQ while the remainder of the undetected residues are at zero, i.e., anticipated residues.
In the procedure described in this chapter it is assumed that all crops are treated with benomyl. The committee notes that this is an unlikely scenario; however, the purpose of this analysis is to illustrate the probability distribution approach to estimating exposure.
The Manufacturer's Field Trials
In 1989 the manufacturer submitted to the EPA a substantial amount of residue data obtained from field trials in support of the continued registration of benomyl. These data are useful because they included information on the application rate (i.e., frequency of application [%] and amount used) and on the residue levels detected in each sample of raw agricultural commodity. Furthermore, sample sizes for single raw commodities were often large enough to permit statistical analysis. Unfortunately, many processed foods were not sampled for residues, thus forcing the EPA to rely on assumptions about the fate of residues during processing.
Data generated by the manufacturer for benomyl residues on fruit products following processing are shown in table 7-2. Detected levels shown in those data are likely to be far higher than those in actual market basket data, due to the uneven use of the compound throughout the United States. In a nationwide market basket survey, fewer samples treated with lower amounts of benomyl would actually be found than in the manufacturer's field trials, which focused on crops known to be treated with benomyl.
As shown in Table 7-1, a total of 412 samples of eight unprocessed foods (apples, beans, grapes, nectarines, oranges, peaches, pears, and tomatoes) were tasted. Of these, 343 (83%) contained residues above the detection limit. Since neither apple juice nor orange juice were sampled,
TABLE 7-2 Changes in Benomyl Concentrations During Washing and Processing
|
Food |
Food Form |
Reduction, % |
|
Apples |
Washed |
13 |
|
Juice |
69 |
|
|
Applesause |
82 |
|
|
Peaches |
Washed |
73 |
|
Canned |
99 |
|
|
Bananas |
Pulp |
No detectable residue |
|
SOURCE: Based on data from the pesticide manufacturer. |
||
EPA must rely on the results of processing studies, such as those shown in Table 7-2, to determine the fate of residues in juices most consumed by young children.
The committee conducted two separate analyses of these data based on two different assumptions: that all reported nondetections were actually zero (Figure 7-5) and that nondetections were really residues at the LOQs, which were provided for each sample (Figure 7-6). (The actual exposure is somewhere in between those shown in the two figures.) The exposure estimates were not greatly affected by either assumption, principally due to the relatively high number of samples containing detectable residues. Estimates of young children's benomyl exposure based on the manufacturer's field trial residue data are almost identical, regardless of whether a value of zero or the LOQ is used in exposure calculations when no residue is detected. Estimates based on the manufacturer's market basket data are also comparable, regardless of the value assigned to nondetectable residues.
That portion of Figures 7-5 and 7-6 displaying the manufacturer's field trial data was constructed by combining the individual consumption reports with the mean of field trial residues for each of 10 foods: apples, apple juice, oranges, orange juice, grapes, grape juice, peaches, pears, green beans, and tomatoes. The committee could therefore produce separate exposure estimates for each food for each child from 1 to 5 years of age. Each analysis was conducted under the assumptions that only those 10 foods were consumed in a child's diet and that the juices lost no benomyl during processing.
The Manufacturer's Market Basket Survey
The sample design of a market basket survey is important, since the results can be dramatically affected by regional patterns of pesticide use and food distribution. A good design can obviate the need to make complex
assumptions regarding processing, percentage of crop treated, and food distribution effects.
A limited number of foods was surveyed in the manufacturer's market basket survey. A total of 143 samples of 7 foods, and no juices, were analyzed for a benomyl. Thirty-two (22%) of the samples contained residues at levels above the LOQ. This percentage is similar to that found by the food industry but approximately 50% lower than that detected by the more focused sampling design used by the certification business.
FDA Surveillance Data
The committee used only FDA surveillance data in assessing chronic exposures, and it did not estimate exposures for any food for which there were fewer than 20 samples. Although benomyl was registered for use on many foods, sample size exceeded 20 for only 10 of the 26 foods listed in Table 7-1. Of the total of 448 samples tested, 112 (25%) had residues that exceeded the LOQ.
FDA monitoring is focused on fresh rather than processed foods. Therefore, many of the processed foods often consumed by young children are never or seldom sampled, and the utility of small samples is limited in estimating exposures. As shown in Table 7-1, a number of foods sampled by other groups were not sampled at all by FDA in 1988 and 1989. Other weaknesses of FDA surveillance data are noted in Chapter 6 on pesticide residues.
The Food Industry
A food industry association provided a large amount of data collected from its member organizations. These data identified the food, the pesticide used, the residue level, and the LOQ of the analytical method used. Since the food industry used a variety of sampling and analytical methods, the representativeness of the data for the nation's food supply is uncertain.
Despite this uncertainty, these data are useful in illustrating the method proposed here for exposure estimation. The majority of the positive findings in this data set relate to apples (with 30 residues above the detection limit observed in 68 samples) and apple juice (with 16 of 30 samples showing positive).
A Certification Business
The committee obtained residue data from a certification business operating in California, a commercial organization that guarantees to grocery store owners and consumers that any residues in produce will be below
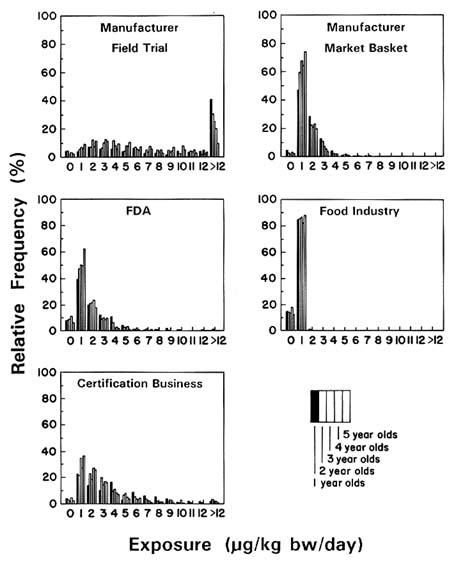
FIGURE 7-5 Daily exposure of 1-to-5-year old children to benomyl in different combinations of foods, as shown by residue data from a certification business, FDA, the food industry, and the manufacturer (field trials and market baskets). Based on the assumption that the nondetects were equal to zero.
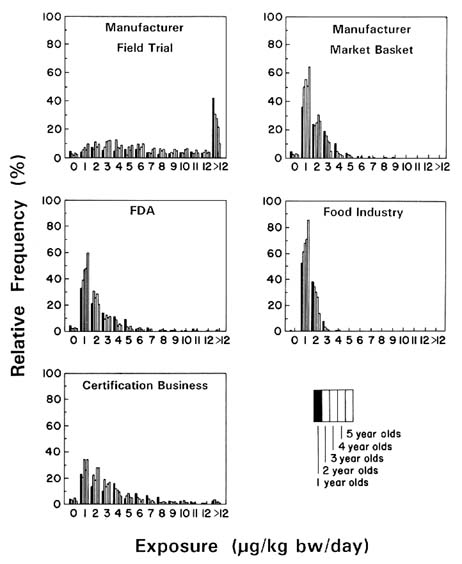
FIGURE 7-6 Daily exposure of 1- to 5-year-old children to benomyl in different combinations of foods, as shown by residue data from a certification business, FDA, the food industry, and the manufacturer (fields trials and market baskets). Based on the assumption that the nondetects were equal to the LOQ.
a detectable level. These data are subject to certain limitations such as nonrepresentative localized sampling, unidentified analytical methods, and analysis of selected produce. Nonetheless, they are used in this example to provide a range of data for comparison purposes. As shown in Table 7-1, this organization tested 447 samples of which 193 (43%) had benomyl residues above the detection limit. This compares to 448 FDA samples with 112 (25%) positive detections and to 203 food industry samples with 42 (20.6%) detections over the LOQ. The difference could be explained by the certification business's focus on produce with a history of residues of concern. Moreover, although the certification business, FDA, and the food industry tested a similar number of foods (16, 17, and 18, respectively), the selection of foods varied. For example, the food industry detected residues in 16 (53.3%) of 30 samples of apple juice, whereas the certification business tested no apple juice samples. Similarly, the certification business detected residues in 18 (64.3%) of 28 plum samples, but plums were not sampled by the food industry.
Summary
In this example, the committee examined multiple data sets reflecting concentrations of benomyl in several different foods. These data sets varied in different ways (Table 7-1). The manufacturer's field trial survey showed a much higher frequency of benomyl detections than found in the market basket survey, mainly because the study focused on crops known to be treated with benomyl. In the market place, fewer foods would actually have been treated with benomyl than in the field survey.
The effect of processing on benomyl concentrations in foods is shown in Table 7-2. These data indicate that substantial reductions in residues may occur because of processing. Figures 7-5 and 7-6 show the estimated exposure distributions for children 1 to 5 years of age to total benomyl residues for several common foods where residues below the LOQ were set at zero and at the LOQ, respectively.
The most important result of this analysis is that most children are exposed to relatively small concentrations of benomyl in their diets (less than 0.012 mg/kg bw/day), if they are exposed to any at all. Current exposures could be even less since registration of benomyl for postharvest use has been suspended. In any case, their exposures would be much below the current reference dose (RfD). In the committee's analysis, it is only the manufacturer's field trial data that suggest some children have larger exposures, and as noted above, these data would be inappropriate for this type of analysis. Both the manufacturer's market basket and the certification business's residue data show relatively small total residue exposures. Finally, Figures 7-5 and 7-6 show that assigning a value of
zero or the LOQ to nondetectable residues had little effect on the overall outcome of the committee's calculations for benomyl. A principal reason for this finding is that a relatively high number of benomyl samples contained detectable residues. Certain impacts on exposure estimates would be seen for pesticides where a relatively low number of samples contained detectable residues.
SHORT-TERM EXPOSURE TO ALDICARB
The Compound
The evaluation of short-term peak exposures is illustrated using data on aldicarb residues in potatoes and bananas. Aldicarb is an acutely toxic pesticide whose use on potatoes and bananas was voluntarily suspended by the manufacturer in 1990 and 1992, respectively. It is an N-methyl carbamate that exerts its toxic effects by inhibiting the enzyme cholinesterase in the central and peripheral nervous system and at the neuromuscular junctions. Single oral doses of 25 µg/kg bw in humans produces approximately 50% inhibition of blood cholinesterase (NRC, 1986). Inhibition above 30% is usually of concern in humans.
Aldicarb is a systemic toxicant that is used primarily as an insecticide and nematocide. It is absorbed by the roots, stems, leaves, and fruits of plants. Aldicarb sulfoxide is a toxic metabolite that is distributed throughout the plant and degrades relatively slowly. Aldicarb-treated crops commonly eaten by children include potatoes, bananas, and citrus fruits. As demonstrated in Chapter 5, infants and children consume proportionately more of these foods than do adults with the exception that infants do not eat potatoes.
Acute Effects of Dietary Aldicarb Exposure
In 1970 Union Carbide gave three groups of four healthy male adult volunteers doses of aldicarb at concentrations of 25, 50, or 100 µg/kg bw. Subjects given the highest dose became acutely ill; one of those who received the lowest dose developed severe mood symptoms (i.e., anxiety reaction). Whole blood cholinesterase depression was observed in all the subjects. After reviewing the results of this study, the Safe Drinking Water Committee of the National Research Council estimated a no-observed-adverse-effect level (NOAEL) of 10 µg/kg bw/day (NRC, 1986). Applying a 10-fold uncertainty factor, the EPA established an RfD, formerly an acceptable daily intake (ADI), for aldicarb at 1.0 µg/kg bw/day.
Studies in the dog demonstrate depression of plasma cholinesterase at doses as low as 1 ppm (20 µg/kg bw/day). At doses of 50 µg/kg bw/day,
there were statistically significant increases in diarrheal stools in both sexes, along with statistically significant increases in both plasma and RBC cholinesterase inhibition in males. Applying an uncertainty factor of 100 on the lowest dose level (20 µg/kg bw/day) to account for interspecies and intraspecies variation, EPA identified an RfD of 0.2 µg/kg bw/day. EPA's Scientific Advisory Panel recommended on November 6, 1992, that the RfD for aldicarb be reestablished at 1.0 µg/kg bw/day, consistent with the 1986 NRC recommendation (EPA), unpublished data, 1993).
In July 1985, severe acute illness was observed in more than 1,000 people in the western United States a few hours after they had eaten watermelons treated with aldicarb—a nonregistered (illegal) use. The symptoms included nausea, vomiting, diarrhea, muscle fasciculations, mood changes, and other symptoms of cholinergic poisoning. The most seriously ill person was a 62-year-old woman who had eaten approximately one-fourth of a watermelon later found to contain a 2.7-ppm concentration of aldicarb sulfoxide, which presented an estimated dose of 57 µg/kg bw. She required emergency room treatment and atropine to reverse the symptoms.
The Consumption Data
Data on consumption of bananas and potatoes by children between 12 and 24 months of age were obtained from the 1977–1978 NFCS. The mean, median, and 90th and 95th percentiles of the average daily consumption of bananas and potatoes are shown in Table 7-3. Of the 529 children surveyed, 157 did not eat either bananas or potatoes on any of the days during which the survey was conducted; of those that did, fewer children ate potatoes than bananas. Of the 1,831 person-days included in the survey, there were 1,077 days on which neither bananas nor potatoes were consumed. The distribution of daily consumption of bananas and potatoes by children between 12 and 24 months of age is shown in Table 7-4.
TABLE 7-3 Average Daily Consumption by Children Between 12 and 24 Months of Age
|
|
|
|
Consumption, g/kg bw/day |
|
|
|
|
Food |
Sample Size |
Number of Noneaters |
Mean |
Median |
P90 |
P95 |
|
Bananas |
529 |
208 |
0.90 |
0.16 |
3.01 |
4.17 |
|
Potatoes |
529 |
349 |
0.72 |
0 |
2.25 |
3.41 |
|
SOURCE: Based on data from the from the U.S. Department of Agriculture's Nationwide Food Consumption Survey, 1977–1978. |
||||||
TABLE 7-4 Daily Consumption by Children Between 12 and 24 Months of Age
|
|
|
|
Consumption, g/kg bw/day |
|
|
|
|
Food |
Sample Size |
Number of Noneaters |
Mean |
Median |
P90 |
P95 |
|
Bananas |
1,831 |
1,224 |
0.91 |
0 |
2.52 |
7.47 |
|
Potatoes |
1,831 |
1,602 |
0.69 |
0 |
2.38 |
5.20 |
|
SOURCE: Based on data from the from the U.S. Department of Agriculture's Nationwide Food Consumption Survey, 1977–1978. |
||||||
The Residue Data
Until the early 1980s, residue sampling focused on aldicarb rather than on aldicarb sulfoxide—its persistent and more toxic metabolite. Furthermore, only composite samples were used. That is, many individual samples of a single commodity were blended and the resulting mixture was analyzed. Because aldicarb is an acute toxicant, and the foods it contaminates are often eaten individually, EPA required a survey in which individual foods were examined separately. In this survey, concentrations higher than the EPA tolerance level were found in individual bananas and potatoes, although they had not been detected previously in blended samples.
Sampling revealed that the distribution of residues in individual potatoes from treated fields followed a log-normal distribution pattern, that is, most individual sample results were clustered at low concentrations. The highest single concentration, 8.7 ppm, was found in one potato. In the event that a 20-kg child consumed that one 200-g potato, cooked by itself in a microwave oven, the child could receive an exposure of 87 µg/kg bw—an acutely toxic level. This illustrates the potential problems associated with use of composite samples for evaluation of exposure to acute toxicants.
Banana trees have been treated with aldicarb since 1977. In 1991 composite and individual samples of bananas were analyzed in five strictly controlled field trials. Half the bananas from one field were found to contain aldicarb residues higher than the tolerance level of 0.3 ppm. If a 20-kg child were to eat the 170-g edible portion of a single banana at the highest level found, 3.14 ppm, the resulting dose would be 26 µg/kg bw—again a potentially toxic dose. Even at the 0.3-ppm tolerance level for aldicarb in bananas, that child would be exposed to approximately 3 µg/kg bw—a level well above the RfD. This does not take into account exposure to other cholinesterase inhibitors in the diet, including possible aldicarb residues in citrus fruit or potatoes.
Since pesticides are usually approved for use on more than one food, it is important to consider the total exposure to a particular pesticide from
TABLE 7-5 Residues of Aldicarb
|
|
Mean Residue, ppm |
|||||
|
Food |
Sample Size |
Number Below LOQ |
Mean |
Median |
P90 |
P95 |
|
Bananas |
2,697 |
2,442 |
0.008 |
0 |
0.02 |
0.05 |
|
Potatoes |
294 |
6 |
0.239 |
0.085 |
0.510 |
0.840 |
|
SOURCE: on data from the 1987 National Aldicarb Food Survey and survey data from the manufacturer. |
||||||
all dietary sources. The methods for assessing exposure to aldicarb in bananas can be extended to cover multiple foods. Although the committee used only two foods (bananas and potatoes) in its example, extension of the method to more than two foods is straightforward. In fact, the FDA data on aldicarb discussed in Chapter 6 failed to identify residue levels above the LOQ in the 350 samples tested. Consider the data on residues of aldicarb in bananas examined earlier, along with data on residues of aldicarb in potatoes given in Table 7-5. The former data are from the National Aldicarb Food Survey. The latter data are from a special survey conducted by the manufacturer of the compound in 1989. In the manufacturer's survey, representative samples were taken from 26 locations in the states of Washington, Oregon, California, Michigan, and Maine. Only three of the locations, Washington, Oregon, and Maine, had composite samples with residues above the LOQ. Residue data from these three states were also selected because they gave data for individual potatoes. Of the 294 reported residue values, 6 were below the LOQ. The mean aldicarb residue of 0.239 ppm in potatoes is much higher than the mean residue of 0.008 ppm in bananas. This difference is due largely to the use of field trial data for potatoes, which were obtained from crops known to have been recently treated with aldicarb.
Effects of Assumptions Regarding Residues Below the LOQ
The implications of results below the LOQ for exposure estimation can be illustrated using data on the levels of aldicarb in bananas obtained from the 1987 National Aldicarb Food Survey. The composite samples tested in this survey were obtained from 225 groups averaging 12 bananas each—a total of 2,700 bananas. These samples were initially tested for the presence of aldicarb with an analytical method that had an LOQ of 0.01 ppm. If any composite sample was found to have a residue greater than 0.01 ppm, each banana in that group was analyzed individually. In this survey, residues over 0.01 ppm were detected in 27 of the 225 composite samples. The investigators then conducted separate tests on the 299 bananas that were available for testing out of the 302 bananas in the 27
TABLE 7-6 Residues of Aldicarb in Bananas
|
Mean Residue, ppm |
|||||
|
Number Below LOQ/Sample Size |
Value Used for Residues Below LOQ |
Mean |
Median |
P90 |
P95 |
|
2,442/2,697 |
LOQ |
0.017 |
0.01 |
0.02 |
0.05 |
|
|
0 |
0.008 |
0 |
0.02 |
0.05 |
|
SOURCE: Based on data from the 1987 National Aldicarb Food Survey. |
|||||
samples. They found aldicarb concentrations above the LOQ in 255 of those bananas.
For risk assessment purposes, let us assume that the remaining 2,442 bananas in the sample had residue levels below the LOQ. This underestimates actual residue levels because compositing masks any unusually high residue levels on individual bananas in a given batch. Let us also assume that individual bananas testing negative do not contain residues above the LOQ. Despite these approximations, it is instructive to examine the impact of assumptions regarding residues lower than the LOQ on estimation of dietary exposures to aldicarb from bananas.
Table 7-6 presents the mean, median, and upper 90th and 95th percentiles of aldicarb on the 2,697 bananas in the survey sample. The mean residue level obtained by assigning a value of 0.01 ppm to all residues below the LOQ is 0.017 ppm—slightly more than twice the value of 0.008 ppm obtained by assigning a value of 0 to nondetectable residues. The median value of 0.01 ppm obtained by substituting the LOQ for nondetectable residues is close to the corresponding mean residue. Assigning a value of 0 to the bananas with no detectable residues leads to a median residue of 0. Since less than 10% of the detections were above the LOQ, both the 90th and 95th percentiles of the residue distribution are unaffected by the value chosen for observations below the LOQ.
Estimating Dietary Exposure
Of the 529 children between 12 and 24 months of age in the 1977–1978 NFCS, only 321 reported eating bananas on any of the 3 days during which food consumption data were recorded. The mean daily consumption of bananas among all the children surveyed was 0.90 g/kg bw/day (Table 7-7). The mean consumption by the 321 children who ate bananas on at least one occasion during the survey was 1.47 g/kg bw/day. Since 61% of the children consumed bananas at least once, the upper 90th and 95th percentiles for the subgroup of eaters are only slightly higher than the corresponding consumption percentiles for the entire sample. The 90th and 95th percentiles will be overestimated since the distribution of average daily consumption contains variability between children and among days.
TABLE 7-7 Daily Consumption of Bananas by Children Between 12 and 24 Months of Age
|
Subsample |
Sample Size |
Consumption, g/kg bw/day |
|||
|
Mean |
Median |
P90 |
P95 |
||
|
All |
529 |
0.90 |
0.16 |
3.01 |
4.17 |
|
Eaters only |
321 |
1.47 |
0.48 |
3.66 |
5.67 |
|
SOURCE: Based on data from the 1987 National Aldicarb Food Survey and USDA's Nationwide Food Consumption Survey, 1977–1978. |
|||||
The aldicarb residue distribution shown in Table 7-6 may be combined with the distribution of mean daily intake of bananas shown in Table 7-7 to estimate the distribution of mean daily intakes of aldicarb residues on bananas. Statistically, this is accomplished by convoluting the two distributions by pointwise multiplication of the residue and consumption distributions to obtain an estimate of the distribution of intakes.
The results of this calculation are summarized in Table 7-8. Separate estimates of intake are presented for the entire sample and for the subsample of children who ate bananas during the survey period. Separate estimates of intake are given for residue levels below the LOQ using the assumptions that the residues were either 0 or at the LOQ.
These estimates of mean intake in Table 7-8 are identical to those obtained simply by multiplying the mean consumption of bananas by the mean residue concentration (Table 7-9). As indicated in Table 7-9, however, multiplication of the upper 90th percentile of the residue and consumption distribution in this fashion does not yield the 90th percentile of intake based on the method of convolution (Table 7-8). The discrepancy between these two values is particularly large for the subgroup of banana eaters only with nondetectable residues assigned a value of 0. Thus, estimates
TABLE 7-8 Daily Intake of Aldicarb from Bananas for Children Between 12 and 24 Months of Age
|
Subsample |
Values Used for Residues Below LOQ |
Intake, µg/kg bw/day |
|||
|
Mean |
Median |
P90 |
P95 |
||
|
All |
LOQ |
0.015 |
0.002 |
0.034 |
0.058 |
|
|
0 |
0.007 |
0 |
0 |
0.008 |
|
Eaters only |
LOQ |
0.025 |
0.005 |
0.050 |
0.087 |
|
|
0 |
0.012 |
0 |
0.003 |
0.032 |
|
SOURCE: Based on data from the 1987 National Aldicarb Food Survey and USDA's Nationwide Food Consumption Survey, 1977–1978. |
|||||
TABLE 7-9 Methods for Estimating the Mean and 90th Percentiles of Aldicarb Intake
|
|
Chronic |
Acute |
|
|
|
|
Subsample |
Values Used for Residues Below LOQ |
Mean |
P90 |
Mean |
P90 |
|
All |
LOQ 0 |
0.015 0.007 |
0.060 0.060 |
0.015 0.007 |
0.050 0.050 |
|
Eaters only |
LOQ 0 |
0.025 0.012 |
0.073 0.073 |
0.047 0.022 |
0.208 0.208 |
|
SOURCE: Based on data from the 1987 National Aldicarb Food Survey and the U.S. Department of Agriculture's Nationwide Food Consumption Survey, 1977–1978. |
|||||
of upper percentiles of ingestion should be based on the more accurate method of convolution. At the upper percentiles, estimates are higher than the true percentiles since the average consumption distribution incorporates day-to-day variability.
This method is most appropriate for estimating the average daily ingestion of pesticide residues over an extended period. Although average daily ingestion is an appropriate measure of exposure for chronic risk assessment, a different approach is required for acute toxic effects caused by short-term exposure to relatively high levels of substances.
Assume that the total intake of a particular pesticide in a single day represents a good indicator of whether an acute toxic response will occur. In this event, we may examine the distribution of individual daily intakes in Table 7-10 rather than the distribution of average daily intakes shown in Table 7-7. In the present context,this corresponds to the distribution of individual daily intake of bananas for all days for which observations were recorded for all children in the survey. Convolution of this distribution with the aldicarb residue distribution provides an estimate of the distribution of the number of person-days in the sample associated with
TABLE 7-10 Daily Consumption of Bananas by Children Between 12 and 24 Months of Age
|
|
|
Consumption, g/kg bw/day |
|||
|
Subsample |
Sample Size |
Mean |
Median |
P90 |
P95 |
|
All |
1,831 |
0.91 |
0 |
2.52 |
7.47 |
|
Eaters only |
607 |
2.74 |
0.72 |
10.4 |
8.73 |
|
SOURCE: Based on data from the U.S. Department of Agriculture's Nationwide Food Consumption Survey, 1977–1978. |
|||||
TABLE 7-11 Individual Daily Intake of Aldicarb from Bananas for Children Between 12 and 24 Months of Age
|
Subsample |
Values Used for Residues Below LOQ |
Intake, µg/kg bw/day |
|||
|
Mean |
Median |
P90 |
P95 |
||
|
All |
LOQ 0 |
0.016 0.008 |
0 0 |
0.038 0 |
0.086 0 |
|
Eaters only |
LOQ 0 |
0.047 0.023 |
0.008 0 |
0.097 0.007 |
0.135 0.047 |
|
SOURCE: Based on data from the 1987 National Aldicarb Food Survey and the U.S. Department of Agriculture's Nationwide Food Consumption Survey, 1977–1978. |
|||||
a given daily intake of aldicarb (Table 7-11). This distribution thus provides a basis for estimating the percentage of person-days during which exposure would exceed a health-based exposure standard, such as a reference dose based on toxicity studies. The upper percentiles will be underestimated since the food consumption data are available for only 3 to 4 days of the 365 days in the year. Although several methods for dealing with results below the detection limit of the analytical method were discussed previously, all nondetectable residues were assumed to be zero in this analysis for simplicity.
The mean, median, and 90th and 95th percentiles of average daily intake and individual daily intake of aldicarb from bananas and potatoes alone and for bananas and potatoes combined are shown in Table 7-12 and 7-13 for children between 12 and 24 months of age. The distribution is dominated by the intake of potatoes. Figures 7-7 and 7-8 show the distribution of individual and average intakes of aldicarb from potatoes and bananas, separately and combined. Intake values greater than 0.8 g/kg bw/day represented a very small proportion and were therefore omitted from the figures.
The distribution of aldicarb intake from both bananas and potatoes
TABLE 7-12 Average Daily Intake of Aldicarb for Children Between 12 and 24 Months of Age
|
|
Intake, µg/kg bw/day |
|||
|
Food |
Mean |
Median |
P90 |
P95 |
|
Bananas |
0.007 |
0 |
0 |
0.008 |
|
Potatoes |
0.172 |
0 |
0.302 |
0.673 |
|
Bananas and potatoes |
0.179 |
0 |
0.327 |
0.705 |
|
SOURCE: Based on data from the U.S. Department of Agriculture's Nationwide Food Consumption Survey, 1977–1978, the 1987 National Aldicarb Food Survey, and survey data from the pesticide manufacturer. |
||||
TABLE 7-13 Individual Daily Intake of Aldicarb for Children Between 12 and 24 Months of Age
|
|
Intake, µg/kg bw/day |
|||
|
Food |
Mean |
Median |
P90 |
P95 |
|
Bananas |
0.008 |
0 |
0 |
0 |
|
Potatoes |
0.164 |
0 |
0.123 |
0.537 |
|
Bananas and potatoes |
0.172 |
0 |
0.164 |
0.593 |
|
SOURCE: Based on data from the U.S. Department of Agriculture's Nationwide Food Consumption Survey, 1977—1978, the 1987 National Aldicarb Food Survey, and survey data from the pesticide manufacturer. |
||||
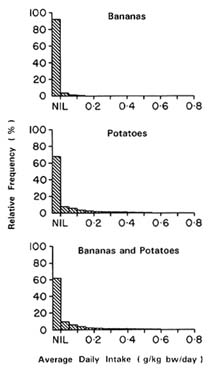
FIGURE 7-7 Distribution of the average daily intake of aldicarb from bananas and potatoes, separately and combined. SOURCE: Based on data derived from USDA, 1983, the National Aldicarb Food Survey, and survey data from the manufacturer.
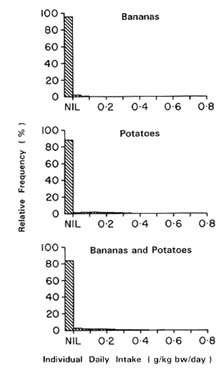
FIGURE 7-8 Distribution of individual daily intake of aldicarb from bananas and potatoes, separately and combined. SOURCE: Based on data derived from USDA, 1983, the National Aldicarb Food Survey, and survey data from the manufacturer.
resembles that of aldicarb intake from bananas or potatoes alone except for a slight shift toward nonzero values; the number of zeros has decreased from 66% of the values to 63%. This is to be expected since some children ate bananas but not potatoes or potatoes but not bananas.
Summary
Aldicarb was examined by the committee because it is an acutely toxic chemical that may potentially be found in several foods consumed by children and because there were also good sampling data for aldicarb residues in several commodities. This example could also be used to illustrate approaches to estimating residue concentrations in both individual foods and in multiple foods combined in a child's diet to provide total estimated residue.
Composite samples were used until the early 1980s for measuring residues in foods. Samples of a single commodity were blended, and the resulting mixture was analyzed. Because aldicarb is an acute toxicant, new approaches do not use blended samples. Rather, single commodities are analyzed. These new residue surveys have shown log-normal distribution patterns of aldicarb residues in commodities such as potatoes. As would be expected, most individual samples show residues clustered at lower concentrations or approaching zero.
The committee estimated exposure to aldicarb from both bananas and potatoes. The estimated distribution of aldicarb residues either from the single commodity potatoes or the combination of the two commodities shows exposure above the RfD of 1.0 µg/kg bw/day. In general, when these foods are eaten in the absence of other cholinesterase inhibitors, exposures would be much lower than those that would produce toxic effects. However, in the unlikely event that a single exposure occurred at the highest residue concentrations found in either bananas or potatoes, toxic effects could occur in a child.
Since the use of aldicarb on potatoes and bananas was voluntarily withdrawn by the manufacturer in 1990 and 1991, respectively, children are not presently at risk of cholinesterase depression from residues of aldicarb on these two foods (Debra Edwards, Chief, EPA Chemistry Branch, personal commun., 1993). Nonetheless, this case study illustrates the use of food consumption and residue distributions in estimating the number of person-days on which ingestion of an acutely toxic pesticide might exceed the RfD. As in the benomyl case, total ingestion from more than one food on which residues might be present was taken into account.
Multiple Exposure Assessment: Organophosphate Insecticides
Pesticide regulation in the United States has been focused on single chemicals rather than on combinations of compounds likely to appear as mixtures in the human diet. This practice can be attributed not only to the absence of data on the residues of multiple compounds that coexist on foods but also to the lack of methods for estimating simultaneous exposures to multiple chemicals, which cannot be accomplished merely by combining mean values (or other statistical summaries) of food intake and residue data. The regulatory process has therefore progressed on a chemical-by-chemical basis without consideration of possible additive and synergistic effects that could result from exposures to mixtures.
The committee developed a method for estimating exposure to multiple pesticides with a common toxic effect: in this case, inhibition of plasma cholinesterase (ChE). This method was used to determine how many children are likely to be exposed to unsafe levels of multiple pesticides with that common effect and to express the exposures in the most desirable form—person-day exposures—using actual individual daily consumption data and actual residue data.
More than 25 compounds that inhibit cholinesterase are permitted to exist as residues in foods. Although N-methyl carbamates inhibit cholinesterase, their mechanism of action is reversible and duration of action is shorter than for organophosphates. For purposes of simplicity, therefore, the committee selected five commonly used organophosphates (acephate, chlorpyrifos, dimethoate, disulfoton, and ethion) and used actual data on their presence on eight foods (apples, oranges, grapes, beans, tomatoes, lettuce, peaches, and peas) and three juices (apple, orange, and grape) to explore the development of methods for assessing exposure to multiple chemicals.
Criteria for choosing the five chemicals included the following:
-
They must each exert the same adverse effect, in this case, blood plasma ChE inhibition.
-
Credible estimates of the no-observed-effect level (NOEL) for ChE inhibition must exist for each chemical.
-
The chemicals must be permitted as residues on several of the eight foods analyzed.
-
FDA residue data must exist for the chemical-food groups selected.
The selection of foods for analysis was driven by the availability of data on residues and on the amount of each food consumed by 2-year-old children sampled in the USDA's 1977–1978 NFCS. An attempt was made to include foods that children consume most; however, it became
apparent that residues were most common on other foods, such as peaches, which were therefore included in the analysis. The frequency distributions for the foods analyzed by the committee are presented in Figure 7-9A-K.
Estimating pesticide exposure in this way was considerably constrained by the absence of residue data for certain foods and compounds, especially processed foods such as juices whose type of processing could greatly influence pesticide residue levels. There are few available residue data for processed foods; thus, little is known about the effects of processing on pesticide residues.
For this analysis, the committee assumed that exposures to ChE-inhibiting compounds should be summed across foods and compounds that induce a similar type of ChE inhibition. Although exposure to a single compound may not exceed the RfD, concurrent exposures to numerous compounds could exceed a safe level because of the increased ChE inhibition. It was also assumed that the toxic potencies of diverse compounds can be standardized by developing estimates of relative potency in the manner described below.
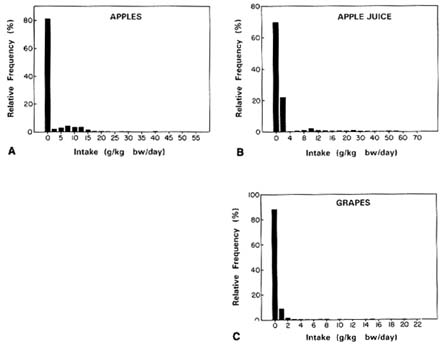
FIGURE 7-9A-K Consumption distributions for (A) apples, (B) apple juice, (C) grapes, (D) grape juice, (E) green beans, (F) lettuce, (G) oranges, (H) orange juice, (I) peaches, (J) peas, and (K) tomatoes. SOURCE: USDA, 1983.
Cholinesterase Inhibition
Among pesticides, organophosphate and carbamate insecticides are the ChE-inhibiting pesticides of primary concern. These chemicals bind with cholinesterases and block their action in the hydrolysis of the acetylcholine (ACh) neurotransmitter. ACh is the principal neurotransmitter at neuromuscular junctions in the parasympathetic nervous system and in many regions of the central nervous system. High concentrations of ACh are also found in areas of the brain linked to higher cognitive functions such as learning and memory.
Organophosphate compounds, such as acephate, chlorpyrifos, dimethoate, disulfoton, and ethion, bind and phosphorylate the active site of ChE, thereby inactivating the enzyme. Carbamates, including aldicarb, lannate, methomyl, propoxur, and carbaryl, also interact with the acetylcholinesterase (AChE) receptor by reversible carbamylation of the seryl hydroxyl moiety at the active site of the enzyme (Murphy, 1986).
Some organophosphate and carbamate insecticides are acutely toxic and are frequently implicated in poisonings of humans. Exposures to high levels of AChE-inhibiting compounds may lead to severe cholinergic toxicity, with symptoms of headache, nausea and vomiting, cramps, weakness, blurred vision, pinhole pupils, chest tightness, muscle spasms, and coma (Ecobichon, 1991). Delayed neuropathy has also been associated with exposure to some organophosphorus esters (i.e., phosphate, phosphorate, and phosphoramidate esters), some of which have been used as insecticides (Amdur et al., 1991). Symptoms of acute organophosphate toxicity are difficult to recognize in the clinical setting for two major reasons: the complaints are nonspecific, and most physicians have limited familiarity with the signs and symptoms of pesticide poisoning.
Most ChE inhibitors degrade relatively rapidly in the environment and do not appear to accumulate or concentrate in the food chain (in contrast to organochlorine pesticides). In addition, these pesticides do not accumulate in the body, since they are rapidly biotransformed and excreted. Nevertheless, ChE inhibition can occur, producing signs and symptoms of poisoning after exposure to small repeated doses. Long-term effects of acute and subchronic exposures to pesticides have been reported. Some investigators have reported chronic, subtle neurologic sequelae to acute organophosphate poisoning (Savage et al., 1988). Epidemiological literature reported by the Office of Technology Assessment provides some evidence of delayed, persistent, or latent effects in humans. The literature includes case reports and studies of agricultural workers with and without histories of acute poisoning (OTA, 1990).
Organophosphates and carbamates may be converted in the environment or in vivo to form metabolites with toxicity potentially greater than that of the parent compounds. Synergism among organophosphate compounds,
such as that demonstrated among malathion, O-ethyl O-p-nitrophenyl phenylphosphonothioate (EPN), and other organophosphates, may be an important variable to consider in assessing exposure to compound mixtures (NRC, 1977).
ChE inhibition is widely regarded as a good, general indicator of exposure to organophosphate pesticides except among people occupationally exposed over long periods who have developed persistently low active ChE levels. However, knowledge about this inhibitory effect is still incomplete. For example, the relationship between ChE inhibition and neurotoxicity has not been adequately demonstrated (EPA, 1988).
Neurotoxicity is defined by EPA as an adverse change in the structure or function of the nervous system following exposure to a chemical agent. The level at which ChE inhibition is associated with such changes is unclear (NRC, 1986). Furthermore, some investigators question the validity of measuring ChE inhibition in peripheral tissues, i.e., in plasma and blood, as a surrogate for measuring ChE inhibition of the central nervous system.
Further study is required to correlate ChE inhibition with identifiable changes in the central and peripheral nervous systems. Techniques for measuring neurotoxic effects include nerve conduction studies, sensory studies, evoked brain responses, electrocardiograms, and biochemical assays (NRC, 1992).
Relative Potency of Organophosphates
The EPA guidelines for the study of mixtures containing dioxins and dibenzofurans consider the relative potency of different components of the mixture (EPA, 1987). This method permits the estimation of toxicity equivalence factors (TEFs) by comparing the toxicity of the compounds of interest to a standard defined as the most thoroughly tested compound. In the present study, the committee selected as a standard chlorpyrifos—a commonly used organophosphate insecticide. A TEF may be derived by comparing the no-observed-effect level (NOEL), or lowest-effect level (LEL), for any other chemical shown to produce the same type of ChE-inhibiting effect, to the NOEL (or LEL) for chlorpyrifos. The ratio of the chlorpyrifos NOEL to the NOEL of a different chemical (chemical X) provides an estimate of relative potency for chemical X and was used to adjust the laboratory-detected residue levels of the five chemicals of concern (Tables 7-14 and 7-15). The new values based on relative potency may be added to estimate cumulative exposure to chemicals believed to induce similar adverse effects, in this case ChE inhibition.
The committee assumed for this example that ChE recovers to a normal level in a 24-hour period. This may not be an appropriate assumption, however, because intake data are summed over all eating occasions for
TABLE 7-14 Estimating Toxicity Equivalence Using the LOAEL for Chlorpyrifos as Reference Standard
|
Pesticide |
LOAELa |
LOAEL Ratio = TEF |
|
Acephate |
0.12 mg/kg bw Rats, ChE inhibition |
0.1/0.12 = 0.83 |
|
Chlorpyrifos |
0.10 mg/kg bw Humans, ChE inhibtion |
0.1/0.10 = 1.0 |
|
Dimethoate |
0.25 mg/kg bw Rats, ChE inhibition |
0.1/0.25 = 0.40 |
|
Disulfoton |
0.04 mg/kg bw Rats, ChE inhibition |
0.1/0.04 = 2.5 |
|
Ethion |
0.075 mg/kg bw Humans, ChE inhibition |
0.1/0.075 = 1.33 |
|
NOTE: LOAEL, lowest-observed-adverse-effect level; TEF, toxicity equivalence factors. a From Integrated Risk Information System (IRIS): EPA, July 1992. |
||
TABLE 7-15 Estimates of Toxicity Equivalence Factors for Five Organophosphate Insecticides Using the NOAEL for Chlorpyrifos as the Reference Standard
|
Pesticide |
NOAELa |
NOAEL Ratio = TEF |
|
Acephate |
NA |
NA |
|
Chlorpyrifos |
0.03 mg/kg bw Humans, ChE inhibition |
1 |
|
Dimethoate |
0.05 mg/kg bw Rats, ChE inhibition |
0.03/0.05 = 0.6 |
|
Disulfoton |
NA |
NA |
|
Ethion |
0.05 mg/kg bw Humans, ChE inhibition |
0.03/0.05 = 0.6 |
|
NOTE: NA, not applicable. NOAEL = no-observed-adverse-effect level. aFrom Integrated Risk Information System (IRIS): EPA, July 1992. |
||
each day. Primary exposure on day 1 may occur during dinner, whereas primary exposure for day 2 may come at breakfast. Although both meals fall within a 24-hour window, they are presumed to be different 24-hour windows for the purposes of the present example.
Food Consumption Data
Data from USDA's 1977–1978 NFCS were used in the analysis. As mentioned above, consumption rates of eight foods (apples, oranges, grapes, beans, tomatoes, lettuce, peaches, and peas) and three juices (apple, orange,
and grape) for 2-year-old children were selected for the analysis. There was a total of 1,831 person-days of data.
Residue Data
The committee used pooled FDA residue data from 1988 and 1989 compliance, surveillance, import, and domestic sampling. Residues for each chemical were converted to chlorpyrifos equivalents by multiplying each value by an equivalence ratio (chlorpyrifos LOAEL or NOEL/chemical X NOEL or LOAEL). For example, three chemicals allowed on a particular food item each have separate residue data sets consisting of individual sample results for each chemical detected on that food. Each of these data sets were summarized with regard to frequency and then for residue distribution.
To estimate cumulative exposure to the five organophosphate compounds, the committee adopted the assumption that the residue distributions for each compound are independent of one another. This approach may result in an overestimation of actual exposure, since there is likely to be some correlation among residue levels of the different compounds. In particular, substitution among chemicals would lead to scenarios in which all five compounds are never detected on the same sample.
The distribution of the cumulative exposure can be constructed by taking all possible combinations of chlorpyrifos equivalent values for the five chemicals and summing the values for each combination. This procedure will, however, yield large numbers of combinations and is thus impractical even on relatively large computers. A more practical alternative is to use strategic simulation in which the original shape of each component distribution is preserved. This is called a strategic simulation, since it is designed to reproduce the sample proportions for each subset of the original chemical distributions. The following procedure is used to create the distribution of cumulative exposure: a value is extracted randomly from each of the five residue distributions by using this strategic sampling technique; the resulting values are summed and the result recorded; and the procedure is repeated 5,000 times, creating 5,000 possible combinations across the five chemicals. The 5,000 summed residues form the distribution for cumulative exposure, which is expressed in chlorpyrifos equivalents.
This computerized simulation was conducted for each food, creating a single residue distribution that is the random summation of residue values strategically extracted from each of the distinct residue distributions. This final distribution of summed residue values is expressed in chlorpyrifos equivalents. Eight such distributions were created, one each for apples, oranges, grapes, beans, lettuce, tomatoes, peaches, and peas.
The committee used two assumptions for nondetected residues: (1) that they were zero and (2) that they were present at the LOQ. The LOQ data used by the committee in this exercise were provided by the FDA. Since the FDA does not record the LOQ for each sample tested, it estimated an average LOQ of 0.01 ppm for all chemicals and foods analyzed in this study and proposed that this value be used in the committee's analysis.
Exposure Analysis
The objective of this exposure analysis is to produce a distribution of possible person-day exposures based on the food consumption data for 2-year-old children, including 1,831 person-day intake values for eight foods and eight separate residue distributions representing cumulative exposure—one for each of the eight foods. Person-day exposures are estimated by applying the following method.
-
Intake of food 1 by person 1 on day 1 is multiplied by some randomly extracted value from the residue data set (specific to food 1). The result is stored as an exposure value.
-
The process is repeated for n foods, still for person 1 on day 1.
-
Steps 1 through 3 are repeated 5,000 times by using the strategic simulation to extract the residue data points from each summarized food-specific residue distribution of the residue data.
-
The 5,000 exposure values for person 1 on day 1 are stored and summarized as counts within exposure intervals.
-
Steps 1 through 5 are repeated for 1,831 person-days, producing 9,155,000 person-day exposure values, all expressed in chlorpyrifos equivalents.
-
The counts within exposure intervals are plotted as a frequency distribution.
-
The proportion of the sample falling above the RfD is estimated. The RfD for chlorpyrifos is 0.003 mg/kg bw/day.
A second exposure analysis was conducted to determine the sensitivity of exposure estimates to assumptions regarding the transfer of residues from raw to processed foods. Exposure was estimated for the same eight foods as above, and then for three juices (i.e., apple, orange, and grape).
The committee assumed that all residues in apples, grapes, and oranges were transferred unchanged to their juices, consistent with EPA practice (Peterson and Associates, Inc., 1992). This provides a maximum exposure estimate that is useful in the absence of statistically reliable data on the effects of processing.
Summary
The results of this analysis using five pesticides and eight selected unprocessed foods, excluding potent ChE inhibitors, and assuming that nondetectable residues are actually equal to zero are shown in Figure 7-10. (Results with nondetects set equal to the detection limit of 0.01 ppm are similar and are excluded for simplicity of presentation.) On the basis of these results, the RfD of 0.003 mg/kg bw/day (3 µg/kg bw/day) would be exceeded on approximately 1.3% of the person-days for children considered, representing approximately 120,000 of the 9.1 million person-days simulated (Figure 7-10).
Conclusions regarding the at-risk population are more difficult to reach. If one assumes that these simulated person-day exposure values are an accurate estimation of daily exposure for this population, then one must also assume that the consumption and residue data are also accurate representations. The committee does not believe that the data used do accurately represent the current status of those pesticide residues on foods because of the age of the consumption data, sample sizes, and the methods used by the FDA in interpreting residue values beneath an ''action" or legal tolerance level. However, these data sets are the best now available
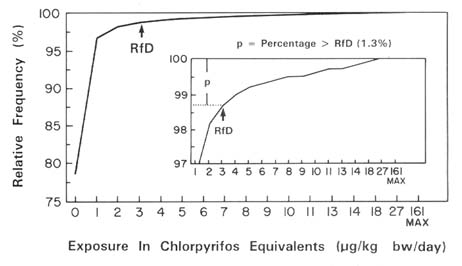
Figure 7-10 Exposure of 2-year-old children to organophosphate pesticides—1,831 2-year-old person-day food intake values. Foods: apples, oranges, grapes, beans, tomatoes, lettuce, peaches, and peas. Chemicals: acephate, chlorpyrifos, dimethoate, disulfoton, and ethion. Strategic simulation: 5,000 exposure values generated per person-day; cumulative distribution is summary of 9,115,000 simulated exposures.
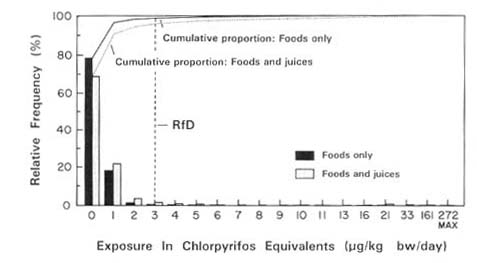
FIGURE 7-11 Exposure of 2-year-old children to organophosphate pesticides, including fruit juices. Strategic simulation: 5,000 exposure values generated per person-day; cumulative distribution is summary of 9,115,000 simulated exposures.
for a variety of chemicals and foods. (See Chapters 5 and 6 for an extensive examination of the limitations of the data.)
Although only 1.3% of the estimated person-day exposures were above the RfD, 3,584 person-days were more than ten times above the RfD, and the maximum exposure was ten times the RfD. These are clearly low probability events within a population of 3.5 million 2-year-old children; even a one-on-a-million event would occur 3.5 times per day. Even though these estimates are limited by the poor quality of the residue sampling data, they identify both a potential concern and an appropriate methodology for estimating exposure in large populations.
The results of the analysis are shown in Figure 7-11. The primary finding of this analysis is a shift in the distribution to higher residue levels. The percentage of the sample above the RfD rose from 1.3% to 4.1%, primarily because of the large intakes of apple juice and orange juice among 2-year-old children.
The committee concluded that this method is a workable and useful mechanism for assessing exposure, i.e., standardizing residue values by toxicity equivalents, combining these values based on either allowable or actual detected combinations of residues, and simulating exposures by combining residue values with actual reported intake values and summing exposures across foods within person-days. As with the other examples presented in this report, however, this discussion should be regarded as
an assessment of methodology rather than a specific attempt to characterize the proportion of children at risk. The method could also be used to study possible combinations of residues for any class of chemicals believed to have a common adverse effect, including cancer, where the end point of concern is not a site-specific tumor but, rather, the probability of a tumor occurring.
Nondietary Exposure to Pesticides
Although it was not generally within the committee's charge to examine exposures to pesticides by routes other than dietary, the committee wishes to point out that infants and children are subject to such exposures from a variety of sources. These sources should not be overlooked when attempting to estimate the total exposure of infants and children to pesticides and are therefore briefly summarized in this section.
In January 1990 EPA published the Nonoccupational Pesticide Exposure Study (NOPES). One of the study's primary objectives was to assess the relative contribution of each source to overall exposure to certain pesticides. Among their findings, the NOPES researches concluded that (1) "house dust may be a source of exposure to pesticides via dermal contact, ingestion, and inhalation of suspended particulates, especially for infants and toddlers"; (2) "acute dermal exposures that occur during application events may contribute substantially to total exposure"; and (3) that, for the pesticides they examined, exposure from drinking water appeared to be minimal (EPA, 1990). Thus, exposure from all sources—not just ingestion—must be considered when estimating total exposure and risk to children.
Exposure via Parents
The child's first exposure to pesticides begins in utero, where chemicals may cross over the mother's placenta. Several studies have suggested an association between parental exposure (occupational and otherwise) to pesticides and childhood cancers. Researchers from the Children's Cancer Study Group (a cooperative clinical trials group with approximately 100 members and affiliate institutions in the United States and Canada) conducted a case-control study of occupational and household exposures of parents of 204 children with acute nonlymphoblastic leukemia (ANLL) (Buckley et al., 1989). Their most consistent finding was an association of ANLL risk when both mother and father had been exposed to pesticides.
Human birth defects possibly associated with prenatal occupational exposure to the organophosphate oxydemeton-methyl were published in 1989 by Romero et al. (1989). Gordon and Shy (1981) used ecologic data
to explore simultaneous maternal exposure to multiple agricultural chemicals in Iowa and Michigan and found an increased risk for facial clefts among offspring.
Lowengart and associates (1987) conducted a case-control study of leukemia patients 10 years and younger and the occupational and home exposures of their parents. With 123 matched pairs, a statistically significant association was seen between leukemia and the use of home and garden pesticides by either parent. In a cross-sectional study of 2,463 parents employed in the Central Valley area of California, limb reduction defects were observed to occur more frequently among the offspring of agricultural workers (relative risk of 2.3) at rates that were in excess of nationally established norms (Schwartz et al., 1986).
As is seen with lead and asbestos, children are at risk from toxicants that their parents unwittingly bring home on their clothes and other apparel. Children of parents employed in agricultural settings may be exposed to these "take-home" pesticides when the work clothing of their parents is washed with other family clothes (Formoli, 1990).
Exposure Through Air
Outdoor Air
In April 1990 the State of California canceled the permits for all uses of the soil fumigant 1,3-dichloropropene (commonly referred to as Telone). This action was prompted by an air monitoring program in the Central Valley that measured levels at a school in the area as high as 160 µg/m3 (L. Baker and J. Behrmann, Air Resources Board, Sacramento, Calif., personal commun., 1990). Concentrations of 0.2 µg/m3 of Telone in air are associated with cancer risks of 1 in 100,000 over 70 years, according to the EPA and the California Department of Health Services (CDHS).
Telone is usually applied undiluted to the soil around vegetable and tobacco crops to control nematodes and insects. Exposure to the vapor causes irritation of the mucosa and respiratory tract. The chemical is absorbed through intact skin, and systemic toxicity may follow cutaneous exposure as well as inhalation or ingestion of the compound (Flessel et al., 1978). Telone has been classified as a probable carcinogen in humans by the EPA (EPA, 1986) and is on the State of California's "Proposition 65" list of chemicals known to cause cancer.
Because pesticides are usually finely dispersed as droplets or particles at the time of application, aerial drift may cause them to be carried away from the target area where they were applied (Matsumura and Madhukar, 1984). Air sampled in areas where pesticides are used may contain residues either as vapors or bound to particles. Recent studies have found pesticide
residues suspended in fog. Respiratory absorption of chemicals tends to be more rapid than absorption through other routes of exposure, because of the abundant blood supply in and the thinness of the alveolar membrane (Matsumura and Madhukar, 1984).
Exposure to pesticide residues from ambient air sources is generally higher in areas close to agricultural lands and in communities surrounding pesticides manufacturing factories. Where urban and suburban developments are interspersed within agricultural lands, movement of the more volatile chemicals present potentially significant human exposure. Episodes of illnesses in communities near agricultural areas have been reported simultaneously with applications of the fumigants methyl bromide and chloropicrin (Murray et al., 1974; CDHS, 1980; Goldman et al., 1987).
Cotton defoliants have also been associated with a higher incidence of acute health symptoms among residents living near cotton fields. Tributyl phosphorotrithioate, trade name DEF, is a defoliant of primary concern from a public health perspective (Scarborough et al., 1989). DEF is quite stable and has been detected at very low concentrations in the ambient air of residential and urban areas of cotton-growing counties, even at times of the year when cotton is not being sprayed. However, formulation impurities of butyl mercaptan or dibutyl disulfite may be the causative agents rather than the parent defoliant. In a small northern California community, an increase in health symptoms such as headaches, runny nose, and asthma attacks was reported by residents living adjacent to a potato field that had been treated with the organophosphate pesticide ethoprop. Ethoprop, like DEF, releases a strong-smelling mercaptan gas (Ames and Stratton, 1991). Organophosphates and other commonly used pesticides have been detected in ambient air in California's Central Valley, but generally in such low concentrations that they are unlikely to contribute significantly to the total exposure of humans.
Arthur et al. (1976) measured the levels of several organophosphate and organochlorine pesticides in the Mississippi delta and found that the residue levels were the highest in August and September. In rural areas, where residue levels were higher than in urban areas, the highest concentrations were found where spraying was reported (Arthur et al., 1976).
Indoor Air
The widespread use of pesticides such as flea bombs and insecticide sprays and foggers in the home exposes children to pesticides in their indoor environment. Most home-use products contain either organophosphates or carbamates as their active ingredients, both of which are cholinesterase-inhibiting compounds. These compounds affect the nervous system and at low doses may cause a variety of cholinergic symptoms such
as drooling, excessive urination, or diarrhea (Berteau et al., 1989). For six pesticides (chlordane, heptachlor, aldrin, chlorpyrifos, diazinon, and gamma-BHC) analyzed in EPA's NOPES study, the mean air exposures were always or often higher than the estimated dietary exposure for the same compounds (EPA, 1990).
Fenske et al. (1990) measured chlorpyrifos (Dursban) concentrations following its application for flea treatment in a carpeted apartment. They found that the chlorpyrifos vapors measured in the infant breathing zone (25 cm above the carpet) were substantially higher than those measured in the sitting adult's breathing zone. Time-weighted averages for the 24-hour postapplication period in the infant breathing zone were 41.2 and 66.8 µg/m3 for ventilated and nonventilated rooms, respectively; this is substantially higher than the interim guideline of 10 µg/m3 proposed by the National Research Council's Committee on Toxicology for chlorpyrifos in indoor air following termiticide treatments (NRC, 1982). In addition, air concentrations increased from the time of application up to 5 to 7 hours later. The authors suggested that the treated carpet served as a source of volatilized chlorpyrifos and that although open windows provided mixing and dilution of air 1 m above the carpet, concentrations near the floor were affected much less (Fenske et al., 1990).
The short- and long-term health effects to exposure to commonly used home-use pesticide products are largely unknown. In assessing risk for infants in chlorpyrifos-treated homes, based on several conservative assumptions, Berteau et al. (1989) calculated an absorbed dose of 2.68 mg/kg. Fenske et al. (1990) found that the total estimated absorbed chlorpyrifos dose for infants exceeded the EPA's no-observed-effect level (NOEL) of 0.03 mg/kg/day in each case. The NOEL for chlorpyrifos is based on measurable changes in plasma acetylcholinesterase.
The indoor use of pesticides in public buildings such as schools and day-care centers leads to an additional source of exposure for children. In one episode, employees of a school for mentally handicapped children became ill within hours of entering a building that had been treated for roaches 3 days earlier and had not been ventilated. No students were admitted into the building until 14 days after the incident, when air levels of the pesticides used (dichlorvos and propoxur) had decreased to an acceptably safe level (White et al., 1987). An air analysis indicated that the levels of dichlorvos in the air were decreasing over time, but at a much slower rate than was expected from the data provided by the manufacturer.
Chlordane was the leading compound for controlling termites in homes for several years. Although it has since been canceled by the EPA for use as a termiticide, research demonstrates that chlordane air levels decline
very slowly with time (Menconi et al., 1988). In a cross-sectional epidemiological investigation of 85 chlordane-treated households containing a total of 261 people, investigators found a dose-response relationship between chlordane levels in home indoor air and incidence of migraines, sinusitis, and bronchitis (Menconi et al., 1988). Cases of more serious health effects such as neuroblastoma, acute leukemia, and aplastic anemia have been associated with exposure to chlordane (Infante et al., 1978).
Pentachlorophenol (PCP) is commonly used as a wood preservative and has become the second most heavily used pesticide in the United States (Cline et al., 1989). It is used in wood homes and on playground equipment. Studies indicate that PCP is virtually ubiquitous in the environment, and measurable residues of PCP are found in most people (Hill et al., 1989). Hill et al. (1989) found PCP in 100% of urine samples taken from 197 Arkansas children. Researchers at the Centers for Disease Control (CDC) found that mean serum PCP levels were 10 times higher in residents of PCP-treated log homes than in the controls (40 ppb compared to 420 ppb) and that serum levels for children in the log homes were "significantly higher" than those for their parents (Cline et al., 1989).
Exposure via Contaminated Surfaces
Home-Use Products
Indoor insecticide sprays and foggers may persist on carpets, floors, and other surfaces in the home. Young children, particularly those wearing only diapers, may be exposed playing on previously sprayed surfaces. In 1980 an 11-day-old infant suffered respiratory arrest in a hospital waiting room. Pesticide poisoning was suspected because tests showed his red blood cell cholinesterase levels to be depressed to 50% of normal low baseline levels. Around the time of his birth, the child's home had been treated with chlorpyrifos; the chemical was subsequently found on dish towels, food preparation surfaces, and the infant's clothing (Dunphy et al., 1980).
Pet Products
Flea control products may persist on the pet's fur and be transferred to children during contact with the animal. Flea control products commonly used in veterinary clinics, pet stores, and other commercial establishments include carbaryl, chlorfenvinphos, chlorpyrifos, dimethyldichlorovinyl phosphate (DDVP), fenthion, malathion, phosmet, and propoxur (Ames et al., 1989).
Playground Equipment
Wooden playground equipment is another source of pesticide exposure because of the various kinds of wood preservatives used to prevent microbial and insect attacks. A 1987 California survey estimated that approximately 20% of all wooden structures in parks were treated with chemical preservatives. Some wood preservatives—PCP, chromium, boric acid, creosote, and arsenic—can induce adverse skin reactions such as contact dermatitis, hyperkeratosis, and, in the extreme case, skin cancer (CDHS, 1987).
Exposure via Medications and Personal Products
Another important route of exposure involves the direct application of insect repellents and pediculocides to children's skin. These include such compounds as N,N-diethyl-m-toluamide, lindane, and malathion. Lanolin, used by some breastfeeding mothers on their nipples, is also a concern because of the pesticides it can contain.
N,N-Diethyl-m-toluamide
N,N-Diethyl-m-toluamide, commonly called Deet, is the active ingredient in numerous commercially available insect repellents. Although insect repellents can provide great personal benefit, rare adverse reactions can occur. Since 1961, at least six cases of systemic toxic reactions from repeated cutaneous exposure to Deet have been reported. Six girls, ranging in age from 17 months to 8 years, developed behavioral changes, ataxia, encephalopathy, seizures, and/or coma after repeated cutaneous exposure to Deet ; three died (Oransky et al., 1989). Neurobehavioral analysis showed strong correlation between Deet exposure and affective symptoms, insomnia, muscle cramps, and urinary hesitation (McConnell et al., 1987).
In August 1989 the New York State Department of Health investigated five reports of generalized seizures temporally associated with topical use of Deet. Four of the patients were boys from 3 to 7 years old (Oransky et al., 1989).
Lindane and Malathion
For almost 30 years the pesticide lindane (a chlorinated hydrocarbon) has been used in a shampoo for the treatment of head lice (Taplin and Meinking, 1988). Concern has been raised about potential central nervous
system damage from exposure to lindane. In particular, cases of central nervous system toxicity have been reported from accidental ingestion as well as from single percutaneous exposures (Lee and Groth, 1977). One author reported two instances in which lindane lotion was given orally to children with scabies because of a lack of communication in one case and a language barrier in the other (Taplin and Meinking, 1988). Malathion has been recommended as a preferable treatment over lindane (Taplin et al., 1982; Fine, 1983).
Lanolin
Lanolin, a derivative of sheep's wool, is commonly used as an ointment to treat sore, cracked skin. Mothers who breastfeed frequently use it on their nipples, and it is sometimes applied directly to children's skin. The organophosphate pesticides diazinon and chlorpyrifos and several organochlorine pesticides such as dieldrin have been found at measurable levels in lanolin. The U.S. Food and Drug Administration identified 16 pesticides in lanolin it sampled in 1988. The principal source of these residues is the wool from sheep treated with a pesticide dip to control parasite infestations in the fleece (Cade, 1989). The fat-soluble organophosphate pesticide diazinon presented the greatest concern because of its frequent occurrence (21 of 25 samples) and the high levels identified (up to 29.2 ppm). (T. Levine, EPA, personal commun., 1988).
Occupational Exposures
In agricultural communities, children are often directly exposed to pesticides when they accompany their parents in the field or work there themselves (Pollack et al., 1990). In 1980, some 19 farm workers suffered organophosphate poisoning after working in a cauliflower field (Whorton and Obrinsky, 1983). Five of the workers were 18 years old or younger; three of those were between the ages of 9 and 15 years.
Exposure via Accidental Ingestion
Accidental poisonings are all too common among children. In one study of 37 children who had been hospitalized at Children's Medical Center in Dallas as a result of organophosphate or carbamate pesticide poisoning, ingestion of a liquid was the most common (73%) mechanisms of exposure. Zwiener and Ginsburg (1988) reported that most poisonings took place in the home and here the result of careless storage of the original container or placement in unmarked or uncovered containers.
Conclusions and Recommendations
Like other members of the general population, infants and children are exposed to pesticide residues in their diets. Estimation of dietary intakes requires information on both food consumption patterns and residue levels in food. The purpose of this chapter has been to demonstrate methods for estimating exposure to pesticides in the diet. The committee was guided by previous work on exposure estimation by the National Research Council (NRC, 1988, 1991a,b). Infants and children are also exposed to pesticides by nondietary routes, including air and contaminated surfaces such as rugs and playground equipment. Although a detailed analysis of nondietary routes of exposure to pesticides is outside the scope of this report, it is important for risk assessment purposes to consider the total exposure from all media. The following are the conclusions of the committee.
Conclusions
-
Pesticide residues are present in the diets of infants and children. Estimation dietary intakes of pesticides by infants and children requires information on both food consumption patterns and residue levels in food.
-
Accurate estimation of dietary intake of pesticides by infants and children is difficult due to the limited amount of data on food consumption patterns of infants and children (Chapter 5) and limitations in the available data on pesticide residues (Chapter 6).
-
Dietary exposures to pesticide residues can vary widely. Since most pesticide residues in foods are below the analytical limit of quantification, with comparatively few high residue levels, the distribution of dietary exposure to pesticides includes many low intakes. Some degree of positive skewness may be observed due to the occurrence of high consumption or high residue levels.
-
To estimate dietary exposure to pesticides for infants and children, the committee combined probability distributions of food consumption with probability distributions of residue levels in order to obtain a probability distribution of individual exposures. The use of probability distributions for exposure assessment provides a more complete characterization of human exposure to pesticides residues in food than the use of summary statistics such as means or upper percentiles of exposure.
More accurate estimates of upper quantiles of the exposure distribution
can be obtained by pointwise multiplication of the residue and consumption distributions than by multiplying the quantiles obtained from the residue and consumption distributions, separately. Moreover, the probability distribution approach based on 1-year age groupings of children provides useful information on differences in exposure patterns for children 1 to 5 years of age.
-
Average daily ingestion of pesticide residues is an appropriate measure of exposure for chronic risk assessment, whereas actual individual daily ingestion is more appropriate for acute risk assessment.
Since chronic toxicity is often related to long-term average exposure, the average daily dietary exposure to pesticide residues may be used as the basis for risk assessment with delayed irreversible chronic toxic effects. To take into account different food consumption patterns among individuals, the distribution of average daily dietary intake of pesticides should be examined within the population of interest. Since acute toxicity is more often mediated by peak exposures occurring within a short period (e.g., over the course of a day or even during a single eating occasion), individual daily intakes are of interest for risk assessment for acute toxic effects. Examination of the distribution of individual daily intakes for persons within the population of interest reflects both day-to-day variation in pesticide ingestion for specific individuals as well as variation among individuals. This distribution can be used to estimate the number of person-days in a given period during which intake will exceed a specified level, such as the acceptable daily intake (ADI), or reference dose.
-
At present, there is a relatively limited amount of information on food consumption patterns of infants and children. To obtain accurate estimates of the distribution of individual intakes, more elaborate and more intensive consumption monitoring protocols are required.
-
Because residue monitoring surveys conducted for compliance purposes are expected to lead to higher residue levels than those present in the general food supply, assessment of human exposure should normally be based on surveillance surveys. In using surveillance data, however, consideration needs to be given to regional differences in pesticide use and resultant residue levels.
The committee acknowledges that pesticide food surveillance data are generated by randomly sampling food items from the distribution system. The purpose of this sampling is to ensure agricultural compliance with acceptable pesticide use practices. This sampling is broad-based and often not focused only on pesticides actually used. Pesticide field trial data are generated under strictly controlled conditions of use. These data better reflect actual levels at the time of harvest when it is known that a specific
pesticide has been used. Each data source is used for purposes other than identifying actual dietary exposures, although both are useful in attempting to estimate these exposures.
-
Frequently, the levels of pesticide residue in foods are below the analytical limit of quantification (LOQ). Since the actual residue level in such cases may lie anywhere between zero and the LOQ, there is some uncertainty about actual exposures in such cases.
For example, replacing the residue measurements below the LOQ with zero yields lower exposure estimates than substituting the LOQ for the unknown residue level. Notable differences occur when the analytical method is insensitive, the LOQ is high, or a large proportion of residues lies below the LOQ.
-
The concentration of pesticide residues in foods may increase or decrease during food processing.
Changes in residue levels that occur during the processing of food are especially important in assessing the exposures of infants and young children, who consume large quantities of single processed foods, such as fruit juices, milk, and infant formula. In addition to the data accumulated by the food industry (Chapter 6), studies by pesticide manufacturers such as those furnished to the committee on the fate of residues during processing need to be conducted for most pesticides that produce detectable residues in food.
-
Specific pesticides can be applied to more than one crop and, hence, appear on a number of food commodities. Residues of several pesticides may also appear on a single food commodity.
-
Intake of multiple pesticides with a common acute toxic effect can be estimated by converting residues for each chemical to equivalent units of one of the compounds. The standardized residues can then be summed to estimate total residue levels in toxicity equivalence factors, and then combined with consumption data to construct a probability distribution of total exposure to all pesticides having a common mechanism of action.
Certain classes of pesticides such as cholinesterase inhibitors act by a common toxic mechanism. To properly evaluate the potential health effects of exposure to such pesticides, it is important to consider the total exposure to all pesticides in the class.
-
Children are exposed to pesticides by nondietary routes.
Occupational exposure of the parent could result in exposure of the child in utero, in the home environment, or in the occupational setting of the parents. Pesticide residues have been detected in outdoor and indoor air, on contaminated surfaces, and in medications and personal products.
-
When less than 100% of a given crop is treated with a particular pesticide, consideration might be given to adjusting exposure estimates according to the percentage of crop acreage treated. This adjustment can result in substantial reductions in estimates of exposure. This adjustment will be appropriate when the percentage of the crop treated is similar in different regions of the country, or when the crop is uniformly distributed throughout the country. Such adjustments should not be considered in the case of pesticides inducing acute toxic effects, since peak exposures are of importance in this case.
When these adjustments are used to adjust national data, they may result in averages that do not account for regional differences in pesticide use. It is therefore important that exposure estimates that have not been adjusted for acreage treated be presented and that such adjustments be critically examined.
Recommendations
The following recommendations were developed by the committee.
-
Probability distributions based on actual data rather than simple summary statistics such as means or percentiles should be used to characterize human exposure to pesticide residues on food.
The advantage of using probability distributions rather than summary statistics to characterize exposure is that variation in individual food consumption patterns and residue levels in food are taken into account. This will require the collection of more detailed data on food consumption and residue levels as discussed in Chapters 5 and 6, respectively, but will provide more statistically robust estimates than the agency currently develops.
-
The distribution of average daily exposure of individuals in the population of interest is recommended for use in chronic toxicity risk assessment; the distribution of individual daily exposures is recommended for evaluating acute toxic effects.
This recommendation is based on the committee's observation that chronic toxicity is typically related to long-term average exposure, whereas acute toxicity is more often mediated by peak exposures occurring within a short period, either over the course of a day or even during a single meal.
-
If appropriately designed and conducted, surveillance studies of pesticide residues in food provide unbiased data on residue levels in food products. Field trials are also useful sources of information on pesticide residues in food. Such studies should be continued in order to expand the data base for evaluating dietary exposures to pesticides.
Surveillance studies based on random samples designed to provide a representative picture of residue levels in food are required to obtain unbiased information on dietary exposure to pesticides.
-
The committee recommends that research to reduce the uncertainty in estimates of dietary exposure to pesticides be encouraged. Specifically, the development of improved analytical methods for residue analyses and statistical methods for imputing residue levels below the LOQ can lead to improved estimates of pesticide exposure.
All analytical methods for measuring pesticide residue levels in food are subject to an LOQ. Results below the LOQ may be as low as zero or as high as the LOQ itself, thereby imparting uncertainty regarding actual human exposure levels. This uncertainty will be reduced if more sensitive methods with lower LOQs are developed. Such technological improvements should be encouraged even in the absence of other pressures for more sensitive analytical methods.
Statistical methods for use with censored data (i.e., based on specific assumptions) can be used to impute residue levels below the LOQ, provided that the percentage of the residue data lying below the LOQ is not large. The use of such methods can reduce the uncertainty in resulting estimations of human exposure.
-
When using multiresidue scans to detect different compounds in one scan of one food sample, all results should be recorded together. This will make possible more accurate evaluation of exposure distributions for multiple chemicals.
-
The committee does not recommend the routine application of adjustments for the percentage of the crop treated in estimating dietary exposure to pesticides.
Adjustments for acreage treated are appropriate only under certain conditions. For example, such adjustments may be used when there is little regional variation in acreage treated, or when the crop is uniformly distributed at the national level.
-
To determine total dietary exposure to a particular pesticide, intakes from all foods on which residues might be present need to be combined.
Many pesticides are approved for use on more than one crop. In addition, a single crop may be used in the production of a variety of processed foods. To estimate the total dietary exposure to a particular pesticide, it is important to consider the contribution of all foods on which residues might occur.
-
To properly evaluate the potential risk from exposure to multiple pesticides with common mechanisms of action, it is necessary to develop
-
measures of total exposure to pesticides within the same class that reflect the overall toxicity of all pesticides combined.
Since the combined effect of pesticides acting by a common mechanism can be greater than the individual effect of any single pesticide, it is important to develop risk assessment methods that address the total risk from exposure to all pesticides within the same class. One possible approach is to establish toxicity equivalence factors based on no-observed-effect levels as was done for organophosphates in this chapter.
-
Because infants and children are subject to nondietary sources of exposure to pesticides, it is important to consider total exposure to pesticides from all sources combined.
REFERENCES
Amdur, M.O., J. Doull, and C.D. Klaassen, eds. 1991. Caserett and Doull's Toxicology, 4th Ed. New York: Pergamon. 1033 pp.
Ames, R.G., and J.W. Stratton. 1991. Acute health effects from community exposure to N-proply mercaptan from an ethoprop (Mocap R)-treated potato field in Siskiyou County, California. Arch. Environ. Health 46:213–217.
Ames, R.G., S.K. Brown, J. Rosenberg, R.J. Jackson, J.W. Stratton, and S.G. Quenon. 1989. Health symptoms and occupational exposure to flea control products among California pet handlers. Am. Ind. Hyg. Assoc. J. 50:466–472.
Arthur, R.D., J.D. Cain, and B.F. Barrentine. 1976. Atmospheric levels of pesticides in the Mississippi Delta. Bull. Environ. Contam. Toxicol. 15:129–134.
Berteau, P.E., J.B. Knaak, D.C. Mengle, and J.B. Schreider. 1989. Insecticide absorption from indoor surfaces: Hazard assessment and regulatory requirements. Pp. 315–326 in Biological Monitoring for Pesticide Exposure: Measurement, Estimation and Risk Reduction, ACS Symposium Series 382, R.G.M. Wang, C.A. Franklin, R.C. Honeycutt, and J.C. Reinert, eds. Washington, D.C.: American Chemical Society.
Buckley, J.D., L.L. Robison, R. Swotinsky, D.H. Garabrant, M. LeBeau, P. Manchester, M.E. Nesbit, L. Odom, J.M. Peters, W.G. Woods, and G.D. Hammond. 1989. Occupational exposures of parents of children with acute nonlymphocytic leukemia: A report from the children's cancer study group. Cancer Res. 49:4030–4037.
Cade, P.H. 1989. Pesticide in lanolin [letter]. JAMA 262:613.
CDHS (California Department of Health Services). 1980. Ventura County Environmental Health Department, Report to the California Department of Health Services. Sacramento, Calif.: California Department of Health Services.
CDHS (California Department of Health Services). 1987. Report to the Legislature: Evaluation of Hazards Posed by the Use of Wood Preservatives on Playground Equipment . Department of Health Services, Office of Environmental Health Hazard Assessment. Berkeley, Calif.: California Department of Health Services.
Cline, R.E., R.H. Hill, Jr. D.L. Phillips, and L.L. Needham. 1989. Pentachlorophenol measurements in body fluids of people in log homes and workplaces. Arch. Environ. Contam. Toxicol. 18:475–481.
Dunphy, J., M. Kesselbrenner, A. Stevens, B. Vlec, and R.J. Jackson. 1980. Pesticide poisoning in an infant—California. MMWR 29:254–255.
Ecobichon, D.J. 1991. Toxic effects of pesticides. Pp. 565–622 in Casarett and Doull's
Toxicology: The Basic Science of Poisons, 4th Ed., M.O. Amdur, J. Doull, and C.D. Klaassen, eds. New York: Pergamon.
EPA (U.S. Environmental Protection Agency). 1986. Guidance for the Reregistration of Pesticide Products Containing 1,3-Dichloropropene (Telone II) as the Active Ingredient. NTIS No. PB-87-1117-87. Springfield, Va.: National Technical Information Service.
EPA (U.S. Environmental Protection Agency). 1987. Risk Assessment Forum: Interim Procedures for Estimating Risks Associated with Exposures to Mixtures of Chlorinated Dibenzo-p-dioxins and Dibenzofurans. Washington, D.C.: U.S. Environmental Protection Agency.
EPA (U.S. Environmental Protection Agency), 1988. Cholinesterase Inhibition as an Indicator of Adverse Toxicological Effect. Washington, D.C.: U.S. Environmental Protection Agency.
EPA (U.S. Environmental Protection Agency). 1990. Review of Cholinesterase Inhibition and Its effects. Report of the EPA SAB/SAP Joint Study Group on Cholinesterase, Washington, D.C.: U.S. Environmental Protection Agency.
EPA (U.S. Environmental Protection Agency). 1992. Integrated Risk Information System (IRIS). Online. Office of Health and Environmental Assessment, Environmental Criteria and Assessment Office. Cincinnati, Ohio: U.S. Environmental Protection Agency.
Feldman, D., and M. Fox. 1991. Probability, The Mathematics of Uncertainty. New York: Marcel Dekker.
Fenske, R.A., K.G. Black, K.P. Elkner, C.-L. Lee, M.M. Methner, and R. Soto. 1990. Potential exposure and health risks of infants following indoor residential pesticide applications. Am. J. Public Health 80:689–693.
Fine, B.C. 1983. Pediculosis capitis [letter]. New Engl. J. Med. 309:1461.
Flessel, P., J.R. Goldsmith, E. Kahn, J.J. Wesolowski, K.T. Maddy, and S.A. Peoples. 1978. Acute and possible long-term effects of 1,3-dichloropropene—California. MMWR 27:50, 55.
Formoli, T. 1990. Pesticide Safety Information Series A-7, California Department of Food and Agriculture Worker Health and Safety Branch. HS-1228. Sacramento, Calif.
Goldman, L.R., D. Mengle, D.M. Epstein, D. Fredson, K. Kelly, R.J. Jackson. 1987. Acute symptoms in persons residing near a field treated with the soil fumigants methyl bromide and chloropicrin. West. J. Med. 147:95–98.
Gordon, J.E., and C.M. Shy. 1981. Agricultural chemical use and congenital cleft lip and/or palate. Arch. Environ. Health 36:213–221.
Hill, R.H., T. To, J.S. Holler, D.M. Fast, S.J. Smith, L.L. Needham, and S. Binder. 1989. Residues of chlorinated phenols and phenoxy acid herbicides in the urine of Arkansas children. Arch. Environ. Contam. Toxicol. 18:469–474.
Infante, P.F., S.S. Epstein, and W.A. Newton, Jr. 1978. Blood dyscrasias and childhood tumors and exposure to chlordane and heptachlor . Scand. J. Work Environ. Health 4:137–150.
Lee, B., and P. Groth. 1977. Scabies: Transcutaneous poisoning during treatment [letter]. Pediatrics 59:643.
Lowengart, R.A., J.M. Peters, C. Cicioni, J. Buckley, L. Bernstein, S. Preston-Martin, and E. Rappaport. 1987. Childhood leukemia and parents' occupational and home exposures. J. Natl. Cancer Inst. 79:39–46.
Matsumura, F., and B.V. Madhukar. 1984. Exposure to insecticides. Pp. 1–25 in Differential
Toxicities of Insecticides and Halogenated Aromatics, International Encyclopedia of Pharmacology and Therapeutics Series, F. Matsumura, ed. Oxford, England: Pergamon.
McConnell, R., A.T. Fidler, and D. Chrislip. 1987. Health Hazard Evaluation Report HETA-83-085-1757. Everglades National Park, Everglades, Florida. Govt. Reports Announcements & Index (GRA&I). Issue 17. 1987.
Menconi, S., J.M. Clark, P. Langenberg, and D. Hryhorczuk. 1988. A preliminary study of potential human health effects in private residences following chlordane applications for termite control . Arch. Environ. Health 43:349–352.
Murphy, S.D. 1986. Toxic effects of pesticides. Pp. 519–581 in Casarett and Doull's Toxicology, 3rd Ed. New York: Macmillan.
Murray, R.A., L.E. Mahoney, and R.R. Sachs. 1974. Illness associated with soil fumigation, California. MMWR 23:217–218.
NRC (National Research Council). 1977. Drinking Water and Health. Washington, D.C.: National Academy Press.
NRC (National Research Council). 1982. An Assessment of the Health Risks of Seven Pesticides Used for Termite Control. Washington, D.C.: National Academy Press.
NRC (National Research Council). 1986. Drinking Water and Health, Vol. 6. Washington, D.C.: National Academy Press.
NRC (National Research Council). 1987. Regulating Pesticides in Food: The Delaney Paradox. Washington, D.C.: National Academy Press.
NRC (National Research Council). 1988. Complex Mixtures: Methods for In Vivo Toxicity Testing. Washington, D.C.: National Academy Press.
NRC (National Research Council). 1991a. Human Exposure Assessment for Airborne Pollutants: Advances and Opportunities. Washington, D.C.: National Academy Press.
NRC (National Research Council). 1991b. Frontiers in Assessing Human Exposures to Environmental Toxicants. Washington, D.C.: National Academy Press.
NRC (National Research Council). 1992. Environmental Neurotoxicology. Washington, D.C.: National Academy Press.
Oransky, S., B. Roseman, D. Fish, T. Gentile, J. Melius, M.L. Cartter, and J.L. Hadler. 1989. Seizures temporally associated with use of DEET insect repellant—New York and Connecticut. MMWR 38:678–680.
OTA (Office of Technology Assessment). 1990. Neurotoxicity: Identifying and Controlling Poisons of the Nervous System. OTA-BA-436. Washington, D.C.: U.S. Government Printing Office.
Petersen and Associates, Inc. 1992. Background: Derivation of Water Consumption Estimates Used by the Tolerance Assessment System. Paper prepared for the U.S. Environmental Protection Agency, Washington, D.C.
Pollack, S.H., P.J. Landrigan, and D.L. Mallino, 1990. Child labor in 1990: Prevalence and health hazards. Annu. Rev. Public Health 11:359–375.
Romero, P., P.G. Barnett, J.E. Midtling. 1989. Congenital anomalies associated with maternal exposure to oxydemeton-methyl. Environ. Res. 50:256–261.
Savage, E.P., T.J. Keefe, L.M. Mounce, R.K. Heaton, J.A. Lewis, and P.J. Bucar. 1988. Chronic neurological sequelae of acute organophosphate pesticide poisoning. Arch. Environ. Health 43:38–45.
Scarborough, M.E., R.G. Ames, M.J. Lipsett, and R.J. Jackson. 1989. Acute health effects of community exposure to cotton defoliants. Arch. Environ. Health 44:355–360.
Schwartz, D.A., L.A. Newsum, and R.M. Heifetz. 1986. Parental occupation and birth outcome in an agricultural community. Scand. J. Work Environ. Health 12:51–54.
Taplin, D., and T. Meinking. 1988. Infestations. In Pediatric Dermatology, 2 Vols., L.A. Schachner and R.C. Hansen, eds. New York: Churchill Livingstone. 1674 pp.
Taplin, D., P.M. Castillero, and J. Spiegal. 1982. Malathion for treatment of Pediculus humanus var. capitis infestation. JAMA 247:3103–3105.
USDA (U.S. Department of Agriculture). 1983. Food intakes: Individuals in 48 states, year 1977–78. Nationwide Food Consumption Survey 1977-78, Rep. No. I-1. Hyattsville, Md.: U.S. Department of Agriculture. 617 pp.
USDA (U.S. Department of Agriculture). 1987. CSFII, Nationwide Food Consumption Survey, Continuing Survey of Food Intakes of Individuals, 1985. Human Nutrition Information Service, 5 vols. Hyattsville, Md.: U.S. Department of Agriculture.
White, L.E., J.R. Clarkson, and S.N. Chang. 1987. Health effects from indoor air pollution: Case studies. J. Community Health 12(2-3):147–155.
Whorton, M.D., and D.L. Obrinsky. 1983. Persistence of symptoms after mild to moderate acute organophosphate poisoning among 19 farm field workers. J. Toxicol. Environ. Health 11:347–354.
Zwiener, R.J., and C.M. Ginsburg. 1988. Organophosphate and carbamate poisoning in infants and children. Pediatrics 81:121–126; erratum, 81:683.


