
5
Trends in Childhood Mortality
Althea Hill
INTRODUCTION
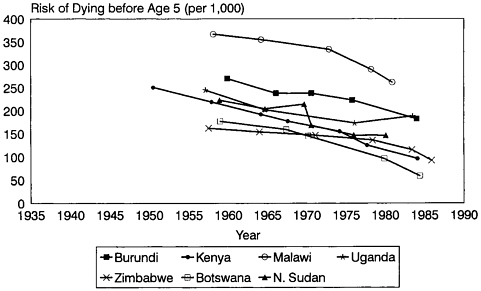
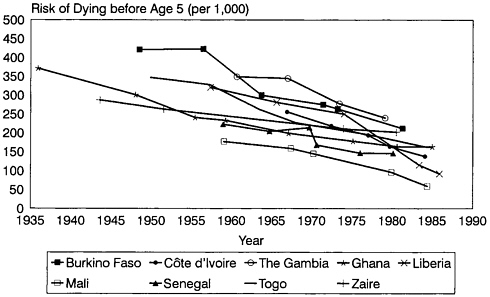
A broad, comparative outline of levels, patterns, and trends in childhood mortality across the African continent was presented in a paper written in 1987 and published recently (Hill, 1989, 1991, 1992). That paper covered sub-Saharan mainland Africa between roughly the late 1940s and the late 1970s and made use of all the data on child survival available at the time of writing. The overall findings are summarized in Figures 5–1 and 5–2, which display summary estimates over time for all countries possessing usable data.
Four major features, all clearly visible in the figures, emerged from the findings of that paper. These were
-
declines in childhood mortality since World War II in almost all countries for which data were available;
-
much variation among countries in the type of decline;
-
much variation among countries in the level of childhood mortality in all periods; and
-
a marked overall difference in mortality levels between countries in western and middle Africa and countries in eastern and southern Africa,
Althea Hill is at the India Country Department, Population and Human Resources Division, The World Bank.
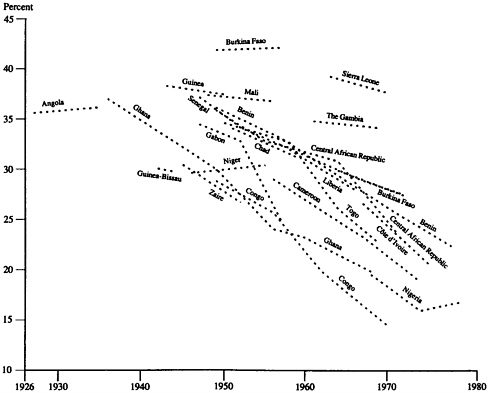
FIGURE 5–1 Risk of dying before age 5, western and middle Africa, 1926–1980. SOURCE: Hill (1991: Figure 3–2).
-
with a rough gradient running from higher mortality in the northwest to lower mortality in the southeast of the continent.
With regard to this last point, there were indications that this gradient, having been very distinct at the start of the period of study, was becoming progressively blurred as more and more western and middle African countries reduced their mortality levels to near or within the eastern and southern range. However, the picture was still too indefinite for firm conclusions at that time.
The paper also noted three exceptions to these general patterns:
-
Some countries had experienced periods of static or rising mortality, almost all against a background of civil war and disruption of normal socioeconomic development (e.g., Ethiopia, Mozambique, Rwanda, and Sudan).
-
The mortality of a few western and middle African countries (notably Ghana, Congo, and Cameroon) had fallen to well within the eastern and southern range.
-
One eastern African country, Malawi, had a level of mortality toward the upper end of the western and middle African range.
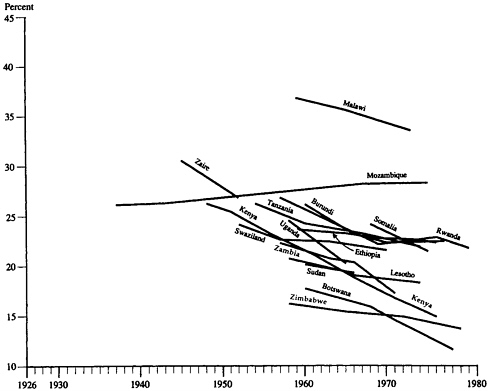
FIGURE 5–2 Risk of dying before age 5, eastern and southern Africa and Sudan, 1926–1980. SOURCE: Hill (1991: Figure 3–3).
DATA DEVELOPMENTS SINCE 1987
In 1987, when the aforementioned review of levels and trends in childhood mortality in Africa was prepared, almost no data on developments in the 1980s were yet available. As shown in Table 5–1, several censuses and surveys had indeed been carried out between 1980 and 1987, but very few of them had yet yielded available results. Over the last five years, however, a considerable quantity—though by no means all—of new data collected during the 1980s has been released. This chapter reviews levels and trends in many of the countries for which fresh data are available for analysis, and examines whether the conclusions of the previous review still hold both at country and at continental levels.
In total, new national-level data are available for 16 countries (about 40 percent of all mainland sub-Saharan countries); these are Botswana, Burkina Faso, Burundi, Côte d’Ivoire, The Gambia, Ghana, Kenya, Liberia, Malawi, Mali, Nigeria, Senegal, Sudan, Togo, Zaire, and Zimbabwe. Data are also available for a large part of Uganda. In addition, data from small-
TABLE 5–1 African Censuses and Surveys Since 1980
|
Country |
Type of Operationa |
Date |
Status of Mortality Data |
|
Western |
|
||
|
Benin |
WFS |
1981 |
Published |
|
Burkina Faso |
Censusb |
1985 |
Available |
|
Côte d’Ivoire |
WFSb |
1980–1981 |
Published |
|
|
LSMS |
1985–1986 |
Partly available |
|
Censusb |
1988 |
Available |
|
|
The Gambia |
Censusb |
1983 |
Published |
|
Ghana |
Census |
1984 |
Not collected |
|
|
LSMS |
1987–1988 |
Not yet available |
|
DHSb |
1988 |
Published |
|
|
Guinea |
Census |
1983 |
Abandoned |
|
Guinea-Bissau |
Census |
1979 |
Not yet available |
|
Liberia |
Census |
1984 |
Partly available |
|
|
DHSb |
1986 |
Published |
|
Mali |
Censusb |
1987 |
Available |
|
|
DHSb |
1987 |
Published |
|
Niger |
Census |
1988 |
Available |
|
Nigeria |
Demographic survey |
1980–1981 |
Unavailable |
|
|
WFSb |
1981–1982 |
Published |
|
DHS (Ondo State) |
1987 |
Published |
|
|
DHS (national)b |
1990 |
Available |
|
|
Senegal |
DHSb |
1986 |
Published |
|
|
Census |
1988 |
Partly available |
|
Sierra Leone |
Census |
1985 |
Not yet available |
|
Togo |
Census |
1981 |
Not collected |
|
|
DHSb |
1988 |
Published |
|
Middle |
|
||
|
Angola |
Census (Luanda only) |
1983–1984 |
Available |
|
|
Southeast region surveyb |
1988 |
Available |
|
Cameroon |
Census |
1987 |
Partly available |
|
|
DHS |
1991 |
Available |
|
Congo |
Census |
1984 |
Partly available |
|
Zaire |
CPS (small area) |
1984 |
Published |
|
|
Censusb |
1984 |
Partly available |
|
Eastern |
|
||
|
Burundi |
DHSb |
1987 |
Published |
|
|
Census |
1990 |
Not yet available |
|
Ethiopia |
Demographic survey |
1980–1981 |
Published |
|
|
Census |
1984 |
Not yet available |
|
|
National demographic survey |
1990 |
Partly available |
|
Kenya |
National demographic surveyb |
1983 |
Partly available |
|
|
CPS |
1984 |
Published |
|
DHSb |
1989 |
Published |
|
|
Census |
1989 |
Not yet available |
|
|
Malawi |
National demographic surveyb |
1982 |
Published |
|
Country |
Type of Operationa |
Date |
Status of Mortality Data |
|
|
1984 |
Published |
|
|
Census |
1987 |
Partly available |
|
|
Mozambique |
Censusb |
1980 |
Available |
|
|
1987 |
Partly available |
|
|
Rwanda |
WFS typec |
1983 |
Published |
|
Somalia |
Demographic survey |
1980 |
Published |
|
|
Census |
1986–1987 |
Possibly lost |
|
Tanzania |
Census |
1988 |
Partly available |
|
Uganda |
Census |
1980 |
Mostly lost |
|
|
DHS (south only)b |
1988–1989 |
Published |
|
Zambia |
Census |
1980 |
Not published |
|
|
DHS |
1992 |
Partly available |
|
Zimbabwe |
Censusb |
1982 |
Partly published |
|
|
CPSb |
1984 |
Published |
|
Demographic surveyb |
1987 |
Partly published |
|
|
DHSb |
1988 |
Published |
|
|
Southern |
|
||
|
Botswana |
Censusb |
1981 |
Published |
|
|
CPSb |
1984 |
Published |
|
Demographic survey |
1987 |
Not yet available |
|
|
DHSb |
1988 |
Published |
|
|
Lesotho |
Census |
1986 |
Not yet available |
|
Swaziland |
Census |
1986 |
Not yet available |
|
|
DHS typed |
1986 |
Not yet available |
|
Northern |
|
||
|
Sudan |
Censusb |
1983 |
Available |
|
|
DHS (northern only)b |
1989–1990 |
Published |
|
aWFS: World Fertility Survey; LSMS: Living Standards Measurement Survey; DHS: Demographic and Health Survey; CPS: Contraceptive Prevalence Survey. bData set used in this chapter. cSurvey modeled after WFS, but not part of the WFS series. dSurvey modeled after DHS, but not part of the DHS series. eData from Maputo, the capital city, are used here. |
|||
scale surveys in Mozambique and Angola are examined, because of the particular interest and data scarcity in those two countries.
The methodology employed is the same as for the previous review (see appendix A to this chapter). The mainstay of the analysis is information on child survival, collected from mothers in censuses and surveys and analyzed by using the Trussell variant of the Brass child survival method (Trussell, 1975); estimates based on Coale-Demeny North and South families of life tables (Coale and Demeny, 1983) are compared, and those that appear to fit
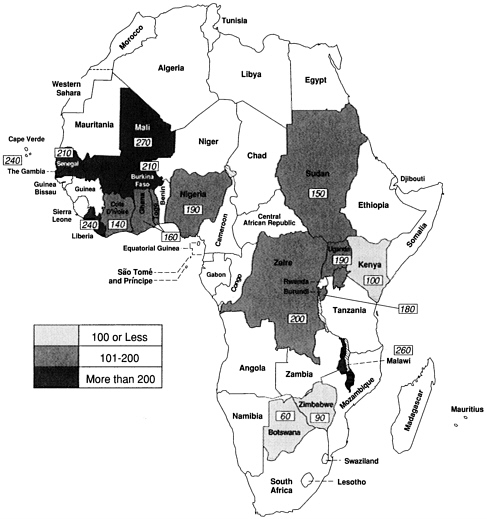
Summary estimates of dying before age 5 (per 1,000), selected African countries between 1979 and 1985.
the data best are selected.1 Direct data on child deaths from maternity histories are used for evaluation but not for the final estimates. More methodological details are given in Hill (1989, 1991, 1992).
|
1 |
Coale and Demeny developed four model life table families (East, West, North, and South) to reflect the different age and sex patterns of mortality derived from historical data from eastern-central, northwestern, Scandinavian, and southern countries of Europe, respectively. The North and South models provide the best fit for the African age pattern of mortality in childhood (see the appendix to this chapter for details). Estimates based on these two models are given in the appendix B tables for each country discussed. In some cases, the estimates from both models are also presented in the figures; however, because of space limitation, only one of the models is usually presented in a figure. |
Every stage of the analysis and estimation for each country is standardized as much as possible in order to put individual country results into a framework of continental levels, patterns, and trends. Inevitably, estimation from large quantities of imperfect data is a subjective process in which individual judgment must play a large part. (See map for summary of continental levels of child mortality.)
NEW COUNTRY DATA AND RESULTS
Botswana and Zimbabwe
These two countries are examined together because they are neighbors, their levels of overall development are very similar, their mortality levels and trends were also very similar up to 1980 (see Figure 5–2), and their data collection schedules in the 1980s were almost identical. They each had a census at the beginning of the decade, a Contraceptive Prevalence Survey (CPS) in 1984, an intercensal demographic survey (ICDS) in 1987 (unfortunately not yet available for Botswana), and a Demographic and Health Survey (DHS) in 1988.
The results of the analysis of all available mortality data for both countries are presented in Tables 5–B.1 and 5–B.2 of appendix B, and are shown graphically in Figures 5–3, 5–4, and 5–5. In both, there is a marked contrast between the smoothness and regularity of the census results and the irregular, seesaw, and often rather wild results from various surveys; no doubt the much larger numbers available for analysis from the census are largely responsible. However, the consistency and plausibility of the results from the 1980s survey data differ sharply between the two countries.
For Botswana, provided the South model is used, all the data except the direct DHS reports are highly consistent. They show a continued decline in childhood mortality from 1955 to 1985, with the decline possibly accelerating during the late 1970s and early 1980s. Because Botswana enjoyed rapid economic growth and fast-developing infrastructure and social services throughout the 1970s and 1980s, such a trend is not at all surprising. The very low level of mortality achieved by the mid-1980s—a probability of dying by age 5 of not much more than .050, which implies an infant mortality rate between 30 and 40 deaths per 1,000 live births—should also be acceptable because the DHS shows that child health and nutrition are excellent. Botswana appears now to have perhaps the lowest mortality in sub-Saharan Africa.
By contrast, the 1980s survey data for Zimbabwe are confused and inconsistent, with the exception of the larger-scale 1987 demographic survey of the traditional type, which fits well with the two sets of census data. The 1984 CPS results not only are highly irregular in trend—first steeply up
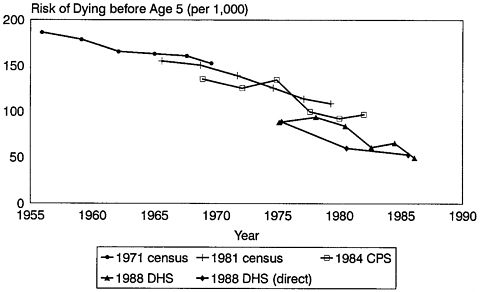
FIGURE 5–3 Risk of dying before age 5, Botswana, 1955–1990, South model. SOURCES: 1971 census (Botswana, 1972); 1981 census (Botswana, 1983); 1984 Contraceptive Prevalence Survey (CPS) (Botswana, 1985); 1988 Demographic and Health Survey (DHS) (Lesetedi et al., 1989).
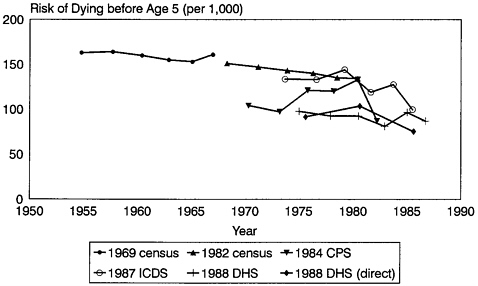
FIGURE 5–4 Risk of dying before age 5, Zimbabwe, 1950–1990, North model. SOURCES: 1969 census (Rhodesia, n.d.); 1982 census (Zimbabwe, 1985a); 1984 Contraceptive Prevalence Survey (CPS) (Zimbabwe, 1985b); 1987 Intercensal Demographic Survey (ICDS) (Zimbabwe, 1991); 1988 Demographic and Health Survey (DHS) (Zimbabwe, 1989).
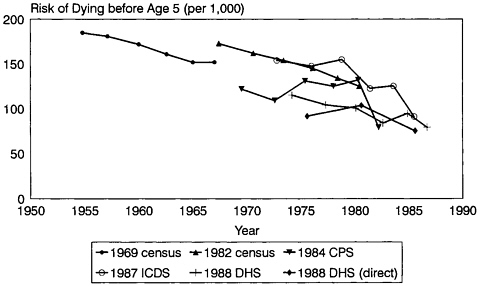
FIGURE 5–5 Risk of dying before age 5, Zimbabwe, 1950–1990, South model. SOURCES: 1969 census (Rhodesia, n.d.); 1982 census (Zimbabwe, 1985a); 1984 Contraceptive Prevalence Survey (CPS) (Zimbabwe, 1985b); 1987 Intercensal Demographic Survey (ICDS) (Zimbabwe, 1991); 1988 Demographic and Health Survey (DHS) (Zimbabwe, 1989).
and then even more steeply down, all in the space of less than 15 years—but appear quite at odds with all the other data. The 1988 DHS mortality levels are much too low compared with the other data sources, except perhaps in the most recent few years. The best choice seems to be a combination of the 1987 demographic survey results with those of the two censuses, which would also yield mortality levels similar to those from the DHS around the mid-1980s. North appears the better-fitting model for the two censuses, but South gives better consistency thereafter; there seems no clear-cut reason to prefer one over the other.
The resulting trend is again of a continued mortality decline from the early 1970s to the mid-1980s, gentle at first, then with perhaps an acceleration of decline in the 1980s; there is also a hint in the data of some temporary stagnation or rise in mortality during the late 1970s, the period of the war for independence. The relatively low overall level of childhood mortality achieved by the mid-1980s—a probability of dying by age 5 of about .080 to .090—is again consistent with Zimbabwe’s good general level of income and development and the excellent child health and nutrition noted in the DHS. Such a level would place Zimbabwe behind Botswana, but still among the very lowest-mortality countries in Africa.
Middle and Eastern Africa
Mozambique and Angola, the two major former Portuguese colonies, have enjoyed neither stability nor solid economic growth for many years. In both, a long and painful war for independence was followed by a short period of relative peace before internal conflicts resumed. No new national-level data for the 1980s are yet available for Mozambique, and none were collected in Angola. Survey data from two small areas in the southern parts of these countries are, however, available and are presented in this chapter. These are Maputo, the capital city of Mozambique (data from a 1987 national World Fertility Survey (WFS) type of survey), and rural parts of the southwest region of Angola bordering on Namibia (data from a local socioeconomic-demographic survey in 1988). The results from these new data sets, combined with the latest available national data, are shown in Tables 5–B.3 and 5–B.4, and summarized graphically in Figures 5–6 and 5–7.
The trend in childhood mortality in Maputo between the early 1970s and the mid-1980s is broadly consistent with the picture already evident in the national census results. There was possibly a mortality decline through the earlier 1970s (when the Portuguese were still developing Maputo as a modern city headquarters containing a major concentration of the Portuguese settler population), followed by stagnation from the mid-1970s through
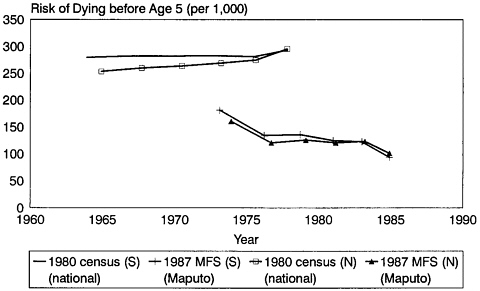
FIGURE 5–6 Risk of dying before age 5, Mozambique and Maputo, 1960–1990, North and South models. SOURCES: 1980 census (Mozambique, n.d.); 1987 Maputo Fertility Survey (MFS) (WFS-type survey) (Mozambique, 1987).
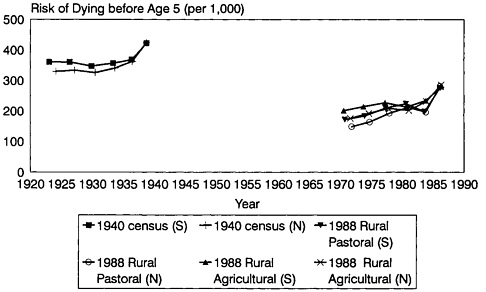
FIGURE 5–7 Risk of dying before age 5, Angola and southwestern Angola, North and South models. SOURCES: 1940 census (Heisel, 1968); 1988 rural survey (Angola, 1990).
the mid-1980s, during which the Portuguese withdrawal was followed by the onset of a crippling civil war. The overall level of childhood mortality in Maputo during the late 1970s and 1980s was, however, relatively low, with a probability of dying by age 5 of .120 to .140—much lower than the corresponding level of .270 to .280 for Mozambique as a whole.
The picture in southwestern Angola is even worse. Rural pastoral and agricultural populations appear to have experienced stagnating or rising childhood mortality from 1970 to the mid-1980s, even though this area was relatively prosperous and least affected by the postindependence civil war. According to the analysis of the 1940 census reported in Brass et al. (1968), the region, then called Huila, enjoyed by far the lowest childhood mortality in Angola at that time. The childhood mortality estimates emerging from the 1988 rural survey, with probabilities of dying by age 5 of .200 to .250, represent an improvement over the levels found in the 1940 census data, but are still very high given the area’s location in the lowest-mortality part of Africa.
Full results from the Malawi census of 1987 are not yet available. However, given Malawi’s extraordinarily severe childhood mortality in earlier periods—probabilities of dying by age 5 of .330 to .370, which are high for any part of sub-Saharan Africa (see Figures 5–1 and 5–2) —it is of interest to examine the additional data on trends from the mid-1960s to the beginning of the 1980s that emerge from the two surveys carried out in
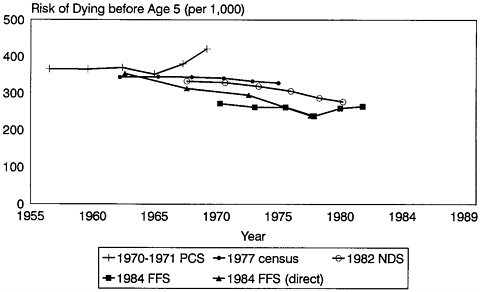
FIGURE 5–8 Risk of dying before age 5, Malawi, 1955–1990, South model. SOURCES: 1970–1971 Population Change Survey (PCS) (Malawi, 1973); 1977 census (Malawi, 1980); 1982 National Demographic Survey (NDS) and 1984 Family Formation Survey (FFS) (Malawi, 1987c).
1982 and 1984. These are shown in Table 5–B.5 and summarized in Figure 5–8.
The picture is mixed. Results from the 1982 survey, an intercensal national demographic survey, fit well with earlier data, provided the South model is used. However, the direct and indirect data from the 1984 WFS-type survey match poorly both with each other and with other data sources, except at the beginning and end, respectively, of their periods of reference. It seems best to accept the 1982 results and to discard most of those from 1984.
Use of the South model produces a trend of very gentle mortality decline through the early 1970s (as earlier data also indicated), followed by something of an acceleration during the rest of the decade. The probability of dying by age 5 falls to about .260 to .280 by the beginning of the 1980s, leaving Malawi still among the very highest-mortality countries in all Africa at that time.
Zaire is another country for which data are available only from the early 1980s. However, because the previous data set (a national demographic survey (NDS)) dated back to the mid-1950s, with long periods of instability and stagnation in economic growth in between, the trends shown by the data from the first census in 1984 (10 percent sample) are of great
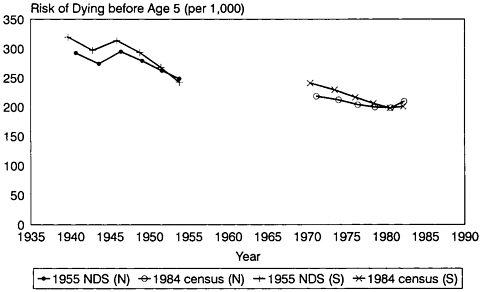
FIGURE 5–9 Risk of dying before age 5, Zaire, 1935–1990, North and South models. SOURCES: 1955 National Demographic Survey (NDS) (Romaniuk, 1968); 1984 census (Schneidman, 1990).
interest. The 1984 results, in combination with the 1955 survey results, are given in Table 5–B.6 and summarized graphically in Figure 5–9.
The two data sets appear to be reasonably consistent, particularly if the North model is used. They display a trend of continuous decline in childhood mortality from 1940 to 1980. The decline was perhaps steeper up to the mid-1950s or so, and (partly by inference) shallower thereafter. This pattern is consistent with the concentrated effort at socioeconomic development made by the Belgians during the 1950s, and the subsequent more sporadic pattern of economic growth and development of social services that was possible during the succeeding two decades of intermittent turmoil and political difficulties. The probability of dying before age 5 of around .210 to .220 in the early 1980s maintains Zaire in its previous position within the middle range for western and middle Africa, and close to the top of the range for eastern and southern Africa.
Burundi, an eastern neighbor of Zaire, is also a former Belgian colony. From earlier data it appeared that childhood mortality had declined in the 1950s and early 1960s, but then more or less stagnated through the mid-1970s. Trends in the early 1980s, as well as the 1970s, can be examined from the results of the 1987 DHS. These are shown, together with earlier data, in Table 5–B.7, and are summarized graphically in Figure 5–10.
The new results appear very consistent with previous data, particularly if the South model is used. They indicate a renewed and fairly marked
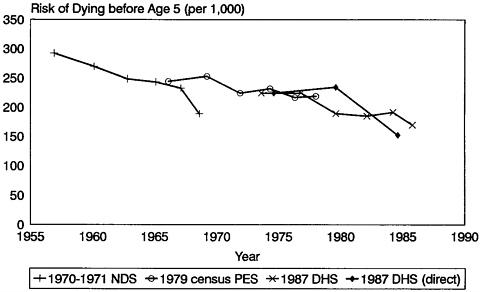
FIGURE 5–10 Risk of dying before age 5, Burundi, 1955–1990, South model. SOURCES: 1970–1971 National Demographic Survey (NDS) (Burundi, 1974); 1979 census postenumeration survey (PES) (Burundi, 1979); 1987 Demographic and Health Survey (DHS) (Segamba et al., 1988).
decline in childhood mortality during the early and mid-1980s. In the mid-1980s, the probability of dying before age 5 was .170 to .180, keeping Burundi in the middle of the eastern-southern Africa range.
Uganda, a prosperous and fast-developing country in the 1950s and 1960s, has since suffered civil wars, economic collapse, and the AIDS epidemic. No large-scale data set has been available to examine demographic changes since 1969 (the date of the last published census) because of the theft and destruction of most of the 1980 census data (information from the Census Commissioner). The 1988–1989 DHS now provides some information for the southern part of the country; unfortunately, most of the then unsettled north could not be surveyed. The DHS results are shown with earlier data in Table 5–B.8 and summarized graphically in Figure 5–11. When examining them it should be borne in mind that in the 1960s the parts of Uganda covered by the DHS had similar levels of childhood mortality to those omitted.
These results, though internally somewhat confused, nevertheless display a complete transformation in childhood mortality trends in Uganda over the past two decades. The extremely rapid decline of the 1950s and 1960s gave way during the course of the 1970s to stagnation or an actual rise in mortality. There is an indication of renewed mortality decline in the
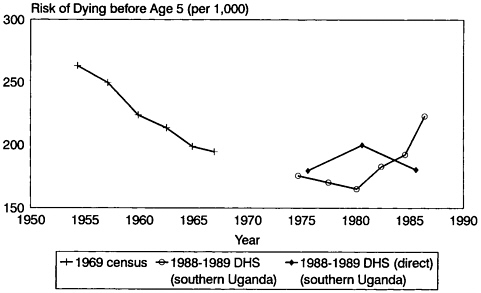
FIGURE 5–11 Risk of dying before age 5, Uganda, 1950–1990, North model. SOURCES: 1969 census (Uganda, 1969); 1988–1989 Demographic and Health Survey (DHS) (Kaijuka et al., 1989).
early 1980s, but this trend cannot be taken as firm and, in any case, would almost certainly not be true in the unsurveyed north. The risk of dying before age 5 in the mid-1980s was .180 to .190 in southern Uganda; thus if a national level at most .01 or .02 higher is assumed, the results do not differ greatly from the levels of the late 1960s. The net result of the disruptions of the last 20 years has thus been to wipe out the country’s previous two decades’ improvement in childhood mortality. The new mortality level pushes Uganda from its previous position in the middle of the eastern and southern African mortality range close to the top.
Unlike Uganda, Kenya has been relatively peaceful and prosperous since independence in 1962 and has collected a mass of demographic data since its independence, including four censuses, two national demographic surveys, a WFS, a CPS, and a DHS. Data on childhood mortality are available from all except the CPS and the most recent census, and two (the 1983 NDS and the 1989 DHS) provide information for the 1980s. The results from all are given in Table 5–B.9 and summarized graphically in Figure 5–12.
These results display a very clear overall picture of a continuous and rapid decline in child mortality during the past 45 years. The probability of dying by age 5 was more than halved between 1945 and 1985, from more than .250 to about .100. The North model yields better consistency between data sets than the South—with census data, in particular, dovetailing almost perfectly—but the general picture is similar in both.
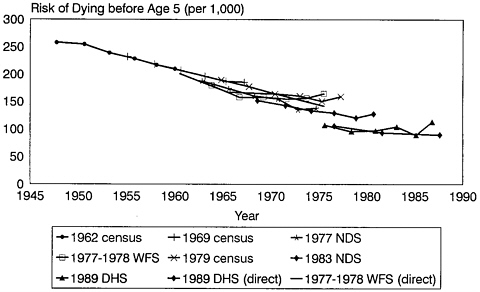
FIGURE 5–12 Risk of dying before age 5, Kenya, 1945–1990, North model. SOURCES: 1962 census (Kenya, 1962); 1969 census (Kenya, 1969); 1977 National Demographic Survey (NDS) (Kenya, 1980); 1977–1978 World Fertility Survey (WFS-indirect) (Kenya, 1980); World Fertility Survey (WFS-direct) (Rutstein, 1983); 1979 census (unpublished data); 1983 National Demographic Survey (NDS) (unpublished data); 1989 Demographic and Health Survey (DHS) (Kenya, 1989).
Trends in the 1980s are not as clear as earlier, because only survey data are available thus far, and the DHS data in particular do not fit smoothly with earlier data sets. There is a suggestion from the internal trend within the DHS data that the mortality decline may have bottomed out in the late 1970s and early 1980s, but the most recent data points from the DHS do in fact yield a much lower mortality level than previous data sets, which suggests a continued decline. These uncertainties may be resolved by the 1989 census results when they become available, but must remain unresolved for the present. In considering the total picture from all data sets, however, it appears at present that childhood mortality continued to fall in Kenya in the 1980s and that Kenya is among the lowest-mortality countries in Africa, but behind Botswana and Zimbabwe.
Sudan
Sudan, like other countries in sub-Saharan Africa, has suffered extensive periods of large-scale civil war. The two censuses of 1973 and 1983, both held fortuitously in the sole period of peace from 1973 to the mid-1980s, covered the entire country, and separate analyses are also available
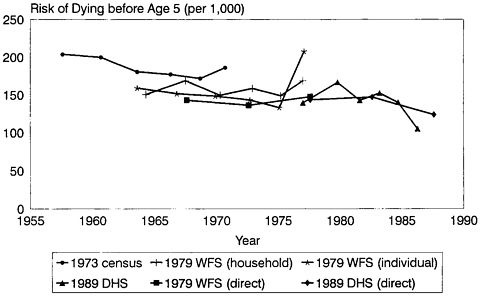
FIGURE 5–13 Risk of dying before age 5, northern Sudan, 1955–1990, South model. SOURCES: 1973 census (Sudan, n.d.); 1979 World Fertility Survey (WFS) (Sudan, 1982); 1989 Demographic and Health Survey (DHS) (Sudan, 1991).
for the north from 1973; the WFS and DHS surveys were held only in the north. These results are shown in Table 5–B.10 and presented graphically in Figures 5–13 and 5–14.
The quality of these data clearly leaves much to be desired, and the results are sometimes inconsistent; data from the 1973 census, which proved to be a substantial undercount in the recently pacified and resettled south, are particularly difficult to reconcile with later data. However, the picture for northern Sudan, at least, shown in Figure 5–13, is clearly one of stagnation in childhood mortality from the late 1960s through the mid-1980s. There was possibly some decline before the mid-1960s and in the late 1980s. The overall level of mortality of about .150 up to the mid-1980s would raise northern Sudan to the middle range for eastern and southern Africa at that date.
The picture for all Sudan, including southern Sudan, shown in Figure 5– 14, is less clear. By using the South model, it would be barely possible to reconcile the two censuses by hypothesizing a decline from the mid-1950s to the mid-1960s, a plateau up to the early 1970s, a sharp decline till the mid-1970s, and then a further plateau up to the early 1980s, but this appears very far-fetched. The large undercount in 1973 may have affected the comparability of the two censuses.
The overall probability of dying by age 5 of about .150 around 1980—
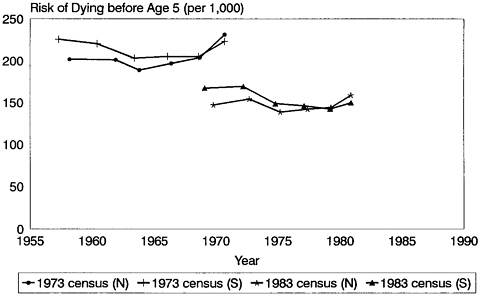
FIGURE 5–14 Risk of dying before age 5, Sudan (national), 1955–1990, North and South models. SOURCES: 1973 census (Sudan, n.d.); 1983 census (Sudan, 1989).
surprisingly indicating similar levels of mortality in north and south Sudan, unlike earlier data—would bring all Sudan down from its previous position in the upper-middle mortality range for eastern and southern Africa to the lower range at that time. Given the picture presented by data for northern Sudan, this favorable shift for all Sudan could be attributed only to a rapid decline in childhood mortality in the south, presumably immediately after the peace accord in 1973. However, in view of the difficulties in reconciling data (discussed above), it would be prudent to suspend judgment on both levels and trends in childhood mortality in southern and all Sudan until such time as further data become available for the south.
Western Africa
Senegal, Mali, Burkina Faso, and The Gambia
The western Sahel countries—Senegal, Mali, Burkina Faso, and The Gambia—are treated as a group because of their many similarities. Climate, ecology, and economic structure vary little across the group. These countries have all been relatively peaceful and politically stable, and all but Senegal, which benefited to some extent from its very early colonial development, are desperately poor. All had extremely severe levels of childhood mortality from the 1940s through most of the 1960s, with national prob-
abilities of dying in the range of .300 to .450—levels among the highest ever observed not only within Africa, but anywhere in the post-World War II world.
The francophone countries (Mali, Senegal, Burkina Faso) each had a national demographic survey at the time of independence around 1960, but then failed to collect any usable national demographic data for the next 15 to 25 years. All had censuses in the mid-1980s, and Mali and Senegal also had a DHS at about the same time. The Gambia has collected national demographic data only through two censuses in 1973 and 1983. Results are given in Tables 5–B.11 through 5–B.14 and are presented graphically in Figures 5–15 to 5–18.
The overall results, despite some obvious deficiencies, are very encouraging. All of these poor and high-mortality countries show a very substantial decline in childhood mortality during the last 20 years, though the picture is clearer in some countries than others.
The data for Senegal, which are the richest and most plentiful, present a reasonably consistent picture, particularly if the South model is used. They indicate a substantial early fall in childhood mortality from 1940 to 1960, followed by a plateau until the early 1970s, and then a renewed sharp decline to the mid-1980s.
The sparser data for Mali show no early decline, but rather indicate a continuing plateau at a very high mortality level until around the early 1970s. There is a problem of consistency between the 1987 DHS and the 1987 census, whose trend lines intersect at one point only around 1980; but because the census also fits much worse with the 1960 data than the DHS does, the latter is to be preferred. The DHS shows a steep fall from the mid-1970s to the mid-1980s, similar to the trend in Senegal. Again, the South model appears to provide better consistency.
Early trends in Burkina Faso are difficult to discern, because the data from the 1960–1961 survey cannot be made consistent with the results of the two censuses in 1975 and 1985 (see Hill, 1989, 1991, 1992 for a discussion of this problem). However, it seems plausible that Burkina Faso also remained at a high-mortality plateau during the 1940s and 1950s. The data from the two censuses, which agree extraordinarily well if the South model is used, show a gradual decline during the 1960s that accelerated during the 1970s. They then indicate another plateau in childhood mortality in the early 1980s, but this plateau cannot be regarded as firm because similar plateaus or rises in the Senegal and Mali DHS indirect data (as well as the Mali census) are contradicted by the direct data, which show a continued decline. The forthcoming data from the Senegal census will provide another useful piece of evidence here (see Working Group on Senegal, forthcoming).
The more limited data for The Gambia appear also somewhat difficult
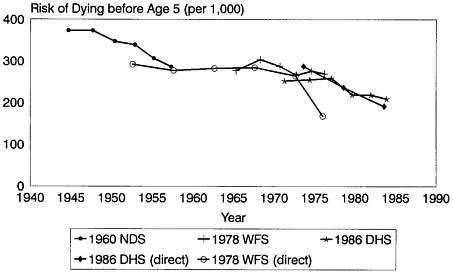
FIGURE 5–15 Risk of dying before age 5, Senegal, 1955–1990, South model. SOURCES: 1960 National Demographic Survey (NDS) (Verrière, n.d.); 1978 World Fertility Survey (WFS-direct) (Rutstein, 1983); World Fertility Survey (WFS-indirect) (Ewbank, 1985); 1986 Demographic and Health Survey (DHS) (Ndiaye et al., 1988).
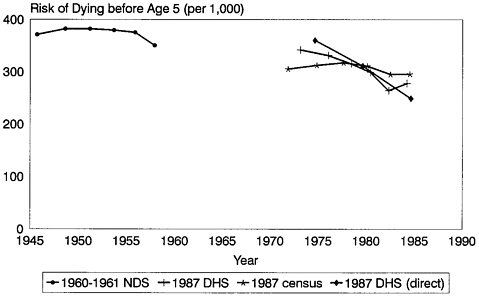
FIGURE 5–16 Risk of dying before age 5, Mali, 1945–1990, South model. SOURCES: 1960–1961 National Demographic Survey (NDS) (Mali, n.d.); 1987 Demographic and Health Survey (DHS) (Traoré et al., 1989); 1987 census (unpublished data).
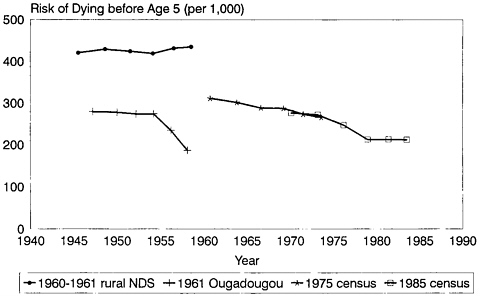
FIGURE 5–17 Risk of dying before age 5, Burkina Faso, 1945–1990, South model. SOURCES: 1960–1961 rural national demographic survey (NDS) and 1975 census (Burkina Faso, 1981); 1961 Ougadougou (Burkina Faso, n.d.); 1985 census (unpublished data).
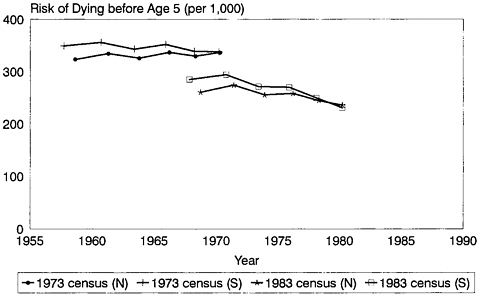
FIGURE 5–18 Risk of dying before age 5, The Gambia, 1955–1990, North and South models. SOURCES: 1973 census (The Gambia, 1976); 1983 census (The Gambia, 1987).
to reconcile, though the South model gives slightly better results. However, again the most plausible interpretation is of little change in the very high childhood mortality in The Gambia between the late 1950s and early 1970s, followed by a marked drop by the early 1980s. It is encouraging that these trends duplicate what has been observed in the country’s long-running small-scale Keneba study, through which demographic and health trends have been monitored in a small rural population since 1947 (McGregor, 1991).
Such childhood mortality improvements in these countries in the 1970s and (less clearly) in the early 1980s are certainly good news. However, the resulting probabilities of dying by age 5 of around .200 to .250 in the early to mid-1980s keep the region in the middle to upper part of the childhood mortality range in all of Africa.
Togo, Ghana, and Côte d’Ivoire
Togo, Ghana, and Côte d’Ivoire form a natural and contiguous grouping. All three are closely related in culture and ethnic composition, and have suffered economic reversals of varying degrees in recent decades. Ghana and Côte d’Ivoire share a common ecology, and migration streams between Ghana and Togo have been substantial for many decades. A comparison of the mortality histories of these three countries ought therefore to be instructive.
Ghana and Togo shared a common census schedule and methodology in 1960, 1970, and 1980, although Ghana also, and very unusually for that date, collected child survival information in its 1948 census. In addition, both had a DHS in 1988, while Ghana also held a WFS in 1980. Côte d’Ivoire, by contrast, collected no national demographic data until the 1979– 1980 multiround survey, followed closely by a 1980–1981 WFS and then by the second census in 1988. Some demographic data were also collected in the 1985–1986 Living Standards Measurement Survey (LSMS), but only part of these have been tabulated. Results for the three countries are given in Tables 5–B.15 through 5–B.17 and displayed graphically in Figures 5–19 to 5–21.
The results for Togo and Côte d’Ivoire are very similar. The data for both give a consistent picture—astonishingly so for Côte d’Ivoire—provided the South model is used. Each country shows a continuous and fairly rapid decline in childhood mortality between 1960 and 1985, with the probability of dying by age 5 being roughly halved from about .300 to .150 or lower during those 25 years. Earlier data for Togo indicate some decline between 1945 and 1960 also, but much gentler. There is also some indication of a plateau in the early 1980s for Togo from the DHS direct data, but this cannot be regarded as firm because (in the reverse case to those of the
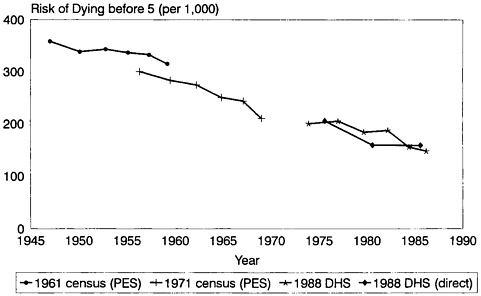
FIGURE 5–19 Risk of dying before age 5, Togo, 1945–1990, South model. SOURCES: 1961 census postenumeration survey (PES) (United Nations, 1978); 1971 census postenumeration survey (PES) (Adognon, 1980); 1988 Demographic and Health Survey (DHS) (Agounké et al., 1989).
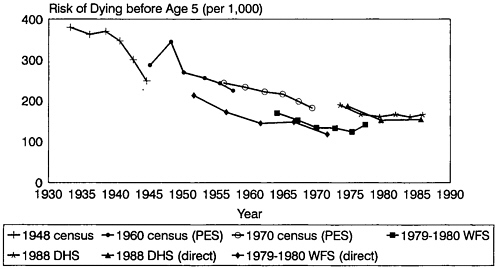
FIGURE 5–20 Risk of dying before age 5, Ghana, 1930–1990, South model. SOURCES: 1948 census (Ghana, n.d.); 1960 census postenumeration survey (PES) (Gaisie, 1969); 1970 census postenumeration survey (PES) (Ramachandran, 1979); 1979–1980 World Fertility Survey (WFS) (Owusu, 1984); 1988 Demographic and Health Survey (DHS) (Ghana, 1989).
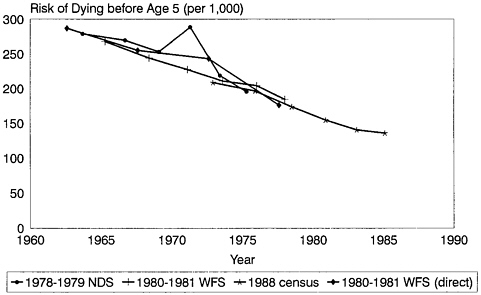
FIGURE 5–21 Risk of dying before age 5, Côte d’Ivoire, 1960–1990, South model. SOURCES: 1978–1979 National Demographic Survey (NDS) (Côte d’Ivoire, n.d.); 1980–1981 World Fertility Survey (WFS) (Côte d’Ivoire, 1984); 1988 census (unpublished data).
Senegal and Mali DHS noted above), the indirect data show an opposite trend of continued decline.
The results for Ghana are much less consistent overall, although the South model still provides the smoothest fit. Not surprisingly, the data from 1948 appear very rough, but the 1960 data are also irregular in part and the WFS results are confirmed as being quite inconsistent with all the other data sets. However, by leaving them aside and selecting the smoother parts of the 1948 data, a picture emerges that resembles trends in Togo and Côte d’Ivoire in some respects. There is again a continuous decline roughly halving the probability of dying from around .300 to slightly more than .150, but over a longer and earlier period from roughly the late 1940s to 1980. There is, as for Togo, evidence of a still earlier decline during the 1930s and 1940s, probably also gentler than the succeeding trend. However, the picture looks bleaker for trends since 1980 than in the other two countries, with both direct and indirect results indicating at least a stall in mortality decline—possibly even a rise—dating from the end of the 1970s.
The mid-1980s estimates of the probability of dying in the three countries of about .140 to .160 place them near the bottom of the western and middle African mortality range, and in fact close to the middle of the eastern and southern African range.
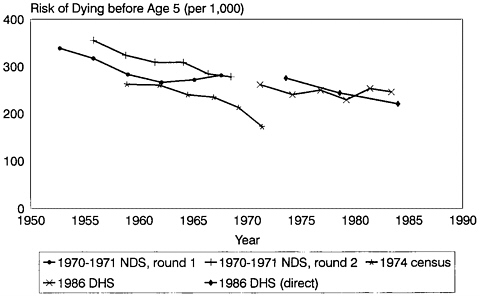
FIGURE 5–22 Risk of dying before age 5, Liberia, 1950–1990, South model. SOURCES: 1970–1971 National Demographic Survey (NDS) (Massalee, 1974; United Nations, 1978); 1974 census (Liberia, 1977); 1986 Demographic and Health Survey (DHS) (Cheih-Johnson et al., 1988).
Liberia
Unlike the countries discussed above, Liberia is experiencing serious internal instability. Its available demographic data are limited, consisting to date of a 1970–1971 multiround national demographic survey, a 1974 census, and a DHS in 1986. Results from these data are given in Table 5–B.18 and displayed graphically in Figure 5–22.
These results show fair overall consistency between the 1970–1971 and the 1986 data sets, with the South model as usual performing slightly better; they indicate an overall gentle decline in childhood mortality since 1950 from a probability of dying of about .360 to .250 by the late 1970s and probably not much change thereafter. The 1974 census data are quite inconsistent with either of the other two data sets, almost certainly due to the use of erroneous imputation techniques during data processing; they may thus be left aside as uninformative.
However, a more detailed assessment of levels and trends in childhood mortality in Liberia, particularly over recent years, is hampered by internal inconsistencies in both the 1970–1971 and the 1986 data sets. The gap between child survival data from the 1970 and 1971 rounds of the multiround survey is probably less serious. It has been attributed to a devastating cholera epidemic among children between the rounds, though it is conceiv-
able that improvements in the quality of data collection between rounds could also have played a part. The inconsistency between the direct and indirect DHS results is more troubling, because they indicate quite different trends in childhood mortality between the early 1970s and mid-1980s: a steady marked decline and a steady marked stall or slight rise, respectively.
Without additional supporting data, for example, from the so far unavailable 1984 census, no firm conclusion regarding recent trends can be drawn. The overall mid-1980s probability of dying before age 5 of about or slightly less than .250, however, would push Liberia up from its previous position in the middle of the western and middle Africa range to a place near the top.
Nigeria
Nigerian data on childhood mortality—as for every other demographic phenomenon—have been scanty and unsatisfactory until recently. The censuses of 1952–1953, 1962, 1963, and 1973, and the national demographic surveys of 1965 and 1980–1981, either collected no data on child survival or never tabulated or analyzed them. The 1971–1972 demographic survey produced child survival data that were too poor to be usable. Those collected in the 1981–1982 Nigeria fertility survey (one of the WFS series) yielded puzzling trends and levels of childhood mortality that were extremely low by comparison with all other neighboring countries and other small-scale surveys in Nigeria itself (Hill, 1989, 1991, 1992).
The 1990 Nigeria DHS data are therefore of particular interest, both because they are the first to emerge for the 1980s and because they provide a further opportunity to evaluate hitherto very doubtful levels and trends. The results are given in Table 5–B.19 and shown in Figure 5–23. They also are unsatisfactory. Like those of the 1981–1982 WFS, the indirect data show a faintly “bucket-shaped” trend of childhood mortality that first falls and then rises again to reach or surpass its earlier level; the presumption must be that this repeated pattern is at least partly due to data errors.
The DHS results, both direct and indirect, are also quite inconsistent in level with those of the WFS, showing much higher childhood mortality where the two data sets overlap in time. North and South models give much the same picture in this respect, although North provides a better fit between direct and indirect results for both the WFS and the DHS. Because the DHS sample frame, based on the preliminary cartography for the carefully prepared 1991 census, was almost certainly much more accurate than the out-of-date frame of dubious quality used for the WFS (which came ultimately from preparations for the nullified 1973 census) and because many difficulties were encountered in the WFS fieldwork, the DHS results are to be preferred.
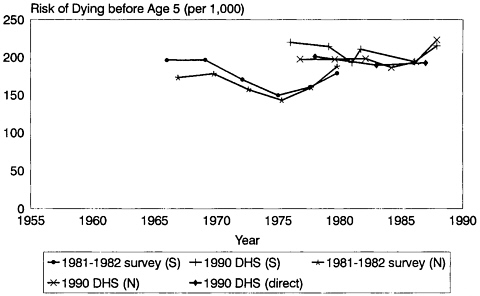
FIGURE 5–23 Risk of dying before age 5, Nigeria, 1950–1990, North and South models. SOURCES: 1981–1982 World Fertility Survey (WFS) (unpublished data); 1990 Demographic and Health Survey (DHS) (Nigeria, 1992).
By using the DHS, therefore, and taking due note of the possible existence of data errors mentioned above, a cautious conclusion would be that childhood mortality in Nigeria changed rather little between the mid-1970s and 1990. The probability of dying by age 5, according to both the North model for indirect results and the direct reports of child deaths, varied only between .190 and .200. The sharp upturn in the late 1980s shown in the indirect data must be considered dubious, given the similar pattern in the WFS data, combined with the absence of any such trend in the direct data for either the WFS or the DHS.
A level of .190 to .200 for the 1980s would place Nigeria in the middle range for western Africa, worse than the best performers on the coast such as Côte d’Ivoire, Togo, and Ghana, but better than the Sahel countries and Liberia. Given only a single acceptable data set with a limited time frame, it is difficult to place these results in the socioeconomic context. Nigeria experienced a massive oil boom during the 1970s and early 1980s, followed by a sharp economic downturn and persisting economic difficulties for the rest of the decade, yet apparently childhood mortality changed rather little during boom or bust. Earlier trends are uncertain.
OVERVIEW OF TRENDS IN COUNTRIES WITH NEW DATA
To facilitate a general overview of trends in childhood mortality for these 17 countries with new national data (including Uganda), the results for each country have been summarized in the same fashion as in Hill (1989, 1991, 1992). They are shown in Table 5–2 and displayed graphically in Figures 5–24 and 5–25.
Viewed as a group, these results show a general continued decline in childhood mortality during the 1970s and 1980s for the majority of African countries with recent data. This decline occurred both in countries that prospered during those years and in countries with poor or negative economic growth.2 Of the exceptions—countries where childhood mortality clearly has stagnated or risen over the past 20 years—all but two (Ghana and Nigeria) have been afflicted by persistent and serious civil conflicts.
CONCLUSIONS ON CHILDHOOD MORTALITY TRENDS
How then do the broad conclusions from the earlier review (Hill, 1989, 1991, 1992) of childhood mortality trends in Africa—set out briefly at the beginning of this chapter—stand up to these new data on the 1970s and 1980s for about 40 percent of mainland sub-Saharan African countries? Of the four major features found earlier—namely, almost universal mortality declines, great variation in decline, great variation in mortality levels, and a marked differential in eastern-southern and western-middle African mortality levels—only the first seems unchanged.
There appear recently to be few cases of very slow decline; either mortality did not fall at all (in a few cases) during the 1970s and 1980s, or it fell substantially. Mortality levels also appear to have come closer together, particularly at the higher end of the mortality range. Relatedly, the western and middle-eastern and southern gradient does appear to be blurring. There remains a clear distinction between the highest-mortality group of countries, which are still almost all in western and middle Africa, and the lowest-mortality group, which are still all or almost all in eastern and southern Africa. However, there is now also a noticeable bunching and overlapping between the two broad regions in the middle reaches of the mortality spectrum.
This bunching and blurring of the former gradient arises in turn from the effects of trends in countries that fall into the three classes of exceptions
TABLE 5–2 Summary Trends in Childhood Mortality in Sub-Saharan African Countries with 1980s Data Sets
|
Country |
Coale-Demeny Model Used |
Date of Reference |
Estimated Probability of Dying Before Age 5 |
|
Western |
|
||
|
Burkina Faso |
South |
1948.5 |
.421 |
|
|
1956.4 |
.423 |
|
|
1963.7 |
.300 |
||
|
1971.4 |
.275 |
||
|
1973.2 |
.264 |
||
|
1981.3 |
.212 |
||
|
Côte d’Ivoire |
South |
1966.9 |
.256 |
|
|
1972.4 |
.219 |
|
|
1977.0 |
.194 |
||
|
1979.7 |
.164 |
||
|
1984.1 |
.138 |
||
|
The Gambia |
South |
1960.6 |
.349 |
|
|
1967.0 |
.345 |
|
|
1973.4 |
.278 |
||
|
1979.1 |
.240 |
||
|
Ghana |
South |
1935.9 |
.371 |
|
|
1948.0 |
.301 |
|
|
1955.4 |
.241 |
||
|
1959.2 |
.233 |
||
|
1967.1 |
.199 |
||
|
1975.1 |
.178 |
||
|
1980.6 |
.164 |
||
|
1985.0 |
.163 |
||
|
Liberia |
South |
1957.3 |
.321 |
|
|
1965.6 |
.281 |
|
|
1974.0 |
.250 |
||
|
1981.3 |
.242 |
||
|
Mali |
South |
1949.9 |
.382 |
|
|
1954.8 |
.377 |
|
|
1974.6 |
.336 |
||
|
1979.4 |
.307 |
||
|
1983.2 |
.271 |
||
|
Senegal |
South |
1946.2 |
.373 |
|
|
1951.6 |
.343 |
|
|
1956.2 |
.296 |
||
|
1968.1 |
.289 |
||
|
1974.5 |
.270 |
||
|
1978.4 |
.239 |
||
|
1982.9 |
.213 |
||
|
Togo |
South |
1949.9 |
.347 |
|
|
1957.2 |
.328 |
|
|
1963.5 |
.262 |
||
|
1968.0 |
.227 |
||
|
1976.9 |
.196 |
||
|
1984.2 |
.163 |
||
|
Country |
Coale-Demeny Model Used |
Date of Reference |
Estimated Probability of Dying Before Age 5 |
|
Middle |
|
||
|
Zaire |
North |
1943.6 |
.287 |
|
|
1951.5 |
.263 |
|
|
1973.9 |
.211 |
||
|
1980.5 |
.202 |
||
|
Eastern |
|
||
|
Burundi |
South |
1959.9 |
.270 |
|
|
1966.1 |
.238 |
|
|
1970.6 |
.238 |
||
|
1975.8 |
.223 |
||
|
1984.0 |
.182 |
||
|
Kenya |
North |
1950.5 |
.251 |
|
|
1957.9 |
.219 |
|
|
1964.2 |
.192 |
||
|
1967.6 |
.177 |
||
|
1974.2 |
.155 |
||
|
1977.7 |
.125 |
||
|
1984.1 |
.096 |
||
|
Malawi |
South |
1958.1 |
.367 |
|
|
1964.2 |
.355 |
|
|
1972.8 |
.334 |
||
|
1978.2 |
.290 |
||
|
1980.9 |
.262 |
||
|
Uganda |
North |
1957.1 |
.245 |
|
|
1964.7 |
.202 |
|
|
(1976.1) |
(.173) |
||
|
(1983.5) |
(.188) |
||
|
Zimbabwe |
North |
1957.5 |
.162 |
|
|
1964.0 |
.154 |
|
|
1971.1 |
.147 |
||
|
1978.4 |
.136 |
||
|
1983.4 |
.115 |
||
|
1985.9 |
.092 |
||
|
Southern Africa |
|
||
|
Botswana |
South |
1959.0 |
.177 |
|
|
1967.4 |
.159 |
|
|
1970.2 |
.145 |
||
|
1979.9 |
.096 |
||
|
1984.4 |
.059 |
||
|
Northern |
|
||
|
Sudan |
South |
1958.9 |
.223 |
|
|
1964.7 |
.204 |
|
|
1969.7 |
.214 |
||
|
1970.6 |
.168 |
||
|
1976.0 |
.147 |
||
|
1980.1 |
.146 |
||
to the major four features noted in the earlier paper. These exceptions were countries experiencing periods of static or rising mortality (usually related to civil strife); countries that had crossed over from mortality levels prevalent in western and middle Africa to levels more commonplace in eastern and southern Africa; and finally, the solitary case of Malawi, an eastern country with a western mortality level.
In the first category, sadly still increasing in numbers, many such countries have been, and continue to be, located in eastern Africa, and hence as a group have retarded mortality declines in that part of the continent. In the second category, the number of crossovers has grown with the addition of (at a minimum) Togo and Côte d’Ivoire, and the maintenance of eastern and southern levels in Ghana despite its overall bottoming out of mortality decline. In the third category, Malawi’s mortality has started to decline from its previous position on a plateau among the very highest even in western Africa and is now barely distinguishable from a general group of countries with high but quickly falling mortality.
It is unclear what will happen to childhood mortality in sub-Saharan Africa in the coming decades. Will the general trend toward lower mortality continue, or will a plateau be reached? As long as data collection is undertaken at national levels, these questions can be answered. If political and economic turmoil, however, make data collection difficult or impossible, these questions may not be answered until well into the next century.
APPENDIX A: SUMMARIZATION PROCESS FOR TABLE 5–2: COUNTRY NOTES
General Note on Methodology
The basic technique employed in this analysis was the Trussell variant of the Brass child survival method, as described in the U.N. Manual X (United Nations, 1983). By this method, series of the mean proportions of children ever born who have since died, as reported by women aged 15–19, 20–24, 25–29, 30–34, 35–39, 40–44, and 45–49 years, are converted into a series of probabilities of survival of children to age 1, 2, 3, 5, 10, 15, and 20 years, respectively. The older the mothers are, the longer ago their children on average were born and died, so the successive dates to which these probabilities apply can also be estimated. The method was applied, by using the AFEMOPC computer program, to all available sets of child survival data. The resulting retrospectively dated series of survival probabilities, expressed as matching levels in North and South Coale-Demeny model life tables, were graphed and evaluated for consistency and regularity, both within each data set and between data sets collected at different times. Data
from mothers aged 15–19 years were not used because they are generally considered highly unreliable.
Theoretically, results from all four Coale-Demeny models (East, West, North, and South, corresponding to different age and sex patterns of mortality derived from historical data from eastern-central, northwestern, Scandinavian, and southern countries of Europe, respectively) could have been examined. However, in practice, North and South models are usually found to best fit African age patterns of mortality in childhood, because both incorporate relatively high levels of mortality between 1 and 5 years of age, a feature undoubtedly existing in most if not all African populations. They also offer extremes in terms of the trends derived from their use: West is usually close to North in this respect, and East to South. Thus, the use of North and South provides a maximum test of the robustness of estimated trends and fit of two data sets to choice of model. Confining analysis to two models also increases the degree of standardization. Thus, although there are a few countries, mainly in the extreme south of the continent, where West might perform as well or better than North and South, the analysis was restricted to results from North and South.
Good-quality data from small-scale surveys in Senegal and The Gambia have demonstrated the existence of an age pattern of mortality very different from any Coale-Demeny model. Levels of mortality in the second and third years of life are much higher than in any European pattern or indeed anywhere else in the developing world with reliable data. The risk of dying between the first and fifth birthdays may actually equal or exceed the risk of dying in infancy. The use of a model life table embodying this pattern gave a much more coherent set of trends for earlier data for Senegal (Hill, 1989, 1991, 1992) and might well improve estimates in other countries in the region. However, it is uncertain how far beyond Senegal and The Gambia this age pattern may extend, and selective use of the model would prejudice standardization of the methodology and comparability of the results. Hence, this model was not used for final estimates for Senegal in the previous paper and is not used here. To examine and compare mortality levels and trends across African countries, it is necessary to summarize the country data shown and discussed in detail in the text for each country. The normal procedure adopted for each child survival data set, if the data were sufficiently smooth and consistent, was to take an average of the three earliest data points (covering information from women aged 35 to 49 years) and the three latest data points (covering information from women aged 20 to 34 years). However, frequent deviations from the norm were necessary, and are noted and discussed below. Direct data from maternity histories were taken into account but not used directly.
Country Analyses
Botswana and Zimbabwe
For Botswana, the sources considered were the 1971 census (thought to provide data of good quality), the 1981 census (good), the 1984 CPS (fair), and the 1988 DHS direct and indirect data (fair). The direct DHS data were not used. It was difficult to select groups of points for averaging with so many overlapping trend lines. The final selection was groups of the earliest three and the latest three points from the 1971 census; the earliest three points from the 1981 census; the latest three points from the 1984 CPS; and the latest three points from the 1988 DHS indirect data (which come out very close to the latest direct data point).
For Zimbabwe, the sources considered were the 1969 census (good), the 1982 census (good), the 1984 CPS (poor), the 1987 ICDS (fair), and the 1988 DHS direct and indirect data (fair). The CPS and the direct DHS data were not used. Again there was a problem with overlapping trend lines, and also with the inconsistency of all but the most recent DHS data with earlier data sets. The final selection was groups of the earliest three and the second and third latest points from the 1969 census; the earliest three and the latest three points from the 1982 census; the latest three points from the 1987 ICDS; and the latest two points from the 1988 DHS indirect data (which come out somewhat higher than the latest direct data point).
Middle and Eastern Africa
For Burundi, the sources considered were the 1970–1971 NDS (good), the 1979 census PES (good), and the 1987 DHS direct and indirect data (fair). The DHS direct data were not used. Although using the South model gave better overall consistency between the earlier data and the DHS, it gave a rougher fit between 1970–1971 and 1979. Therefore some selection of points was required to yield a reasonably smooth trend. The following averaging of groups was done: the earliest three points from the 1970–1971 survey; the second and third latest points from 1970–1971; the two points for women aged 35 to 39 and 40 to 44 from the 1977 census; the three latest points from 1977 plus the two earliest points from the 1987 DHS; and the three latest points from 1987.
For Kenya, the sources considered were the 1962, 1969, and 1979 censuses (all good); the 1977 and 1983 NDS (fair); the 1977–1978 WFS direct and indirect data (fair); and the 1989 DHS direct and indirect data (fair). North performed better overall, particularly with regard to the censuses. The direct WFS and DHS data were not used, though they agreed reasonably well with those portions of other data sets that they overlapped. Given
the number and closeness of the data sets, there was an enormous general problem of overlap; therefore, values were selected across data sets to give the smoothest trend and, in particular, to avoid the repeated upward inflection for women aged 20 to 24. It was also assumed that in general, the survey data from the older women were less reliable than those from the younger; hence these were not used. As a result of all these factors, no data were used from the 1977 NDS or the 1977–1978 WFS. The final choice of groups of points for averaging was the three earliest and the three latest points from the 1962 census; and the two points for women aged 25 to 29 and 30 to 34 from the 1969 census, the 1979 census, the 1983 NDS, and the 1989 DHS.
For Malawi, the sources considered were the 1970–1971 population change survey (PCS; poor), the 1977 census (good), the 1982 national demographic survey (good), and the direct and indirect data from the 1984 family formation survey (FFS; poor). The direct data from the 1984 FFS were not used. Again there was a problem of overlapping trend lines and inconsistency of all but the most recent FFS data. The final selection was groups of the earliest three points from the 1970–1971 PCS; the two PCS points for women aged 25 to 29 and 30 to 34 plus the two earliest 1977 census points; the three latest 1977 points; the three latest 1982 NDS points; and the two latest 1984 FFS points (which come out substantially higher than the latest direct FFS point).
For Uganda, the sources considered were the 1969 census (good) and the (southern Uganda only) 1988–1989 DHS direct and indirect data (poor). The direct DHS data were not used. North gave a better fit between the census and the DHS. Because the trends in the DHS indirect data were rather wild (and at variance with the direct data), groups of points for averaging were selected to dampen them a bit. The final choice of groups was the three earliest and the three latest points from the 1969 census; the two earliest from the 1987 DHS; and the two points for women aged 25 to 29 and 30 to 34 from the DHS.
For Zaire, the sources considered and used were the 1955 national demographic survey (fair) and the 1984 census (10 percent sample; good). There was no overlapping or inconsistency. Averaging was done for groups of the two 1955 national demographic survey points for women aged 35 to 39 and 40 to 44; and the three earliest and three latest 1984 census points.
Sudan
For Sudan, the sources considered and used were the 1973 census (good) and the 1983 census (good). The 1979 WFS and the 1989–1990 DHS were not considered because they covered northern Sudan only. It was not possible to reconcile the trends from the two censuses, though South performed
better than North. Therefore, the data are summarized as two separate trend lines. For each census, averaging is done in three groups of two points each—namely, the two earliest, the two middle, and the two latest. This procedure translates the trends in the data better.
Western Africa
For Burkina Faso, the sources considered and used were the 1960–1961 rural national demographic survey (fair), the 1961 Ouagadougou demographic survey (fair), the 1976 postcensal survey (good), and the 1985 census (good). There was a problem of extreme inconsistency between the 1960–1961 surveys (weighted to produce national values—see Hill, 1989, 1991, 1992, for details) and the two censuses, which agreed extremely well. The South model performed better than the North, but still could not bridge the gap. Two separate trend lines were therefore used, the first for the 1960–1961 data and the second for the 1976 and 1985 data. Each data set was summarized by averaging the three earliest and three latest data points, and the rural and Ouagadougou results were combined to yield national values.
For Côte d’Ivoire, the sources considered were the 1978–1979 NDS (fair), the 1980–1981 WFS direct and indirect data (good), and the 1988 census (good). The 1978–1979 data were not used because they overlapped substantially with the WFS indirect data but were much rougher; neither were the direct WFS data used. The South model gave much better consistency between data sets. Groups of points chosen for averaging were three groups of two points each from the WFS, and because the WFS and census data overlapped so closely, only two groups of two points were taken, with the two earliest points from the overlapping period omitted.
For The Gambia, the sources considered and used were the 1973 census (fair) and the 1983 census (fair). The South model was better at reconciling the two sources, but there was still a worrying gap in levels at the point of overlap. The alternative of summarizing the data as two separate trend lines, as for Sudan and Burkina Faso, was considered but rejected, because the gap was neither so great as for Burkina Faso nor so at variance with internal trends as for Sudan. The selection of groups of points for averaging was aimed at smoothing over this gap as much as possible. The final choice was the three earliest points from the 1973 census; the two points for women aged 25 to 29 and 30 to 34 from 1973; the three points for women aged 30 to 34, 35 to 39, and 40 to 44 from the 1983 census; and the two latest points from 1983.
For Ghana, the sources considered were the 1948 census (poor), the 1960 census PES (poor), the 1970 census PES (good), the 1979–1980 WFS direct and indirect data (poor), and the 1988 DHS direct and indirect data (fair). The WFS data were quite inconsistent with other data sources and
hence were not used; nor were the direct DHS data, though they differ little from the indirect results if the South model is used. South also gave marginally better consistency overall and was chosen; the principal difference entailed by using North instead would be a distinct rise in mortality during the 1980s, rather than the plateau given by South. The final choice of groups of points for averaging was as follows: for 1948, only the three earliest points, with the three latest omitted; for 1960 and 1970 each, two groups of the three earliest and three latest points; and for 1988, three groups of two points each, namely, the two earliest, the two middle, and the two latest.
For Liberia, the sources considered were the 1970 and 1971 rounds of the 1970–1971 population growth survey (fair), the 1974 census (poor), and the 1986 DHS direct and indirect data (fair). The 1974 census data were quite inconsistent with the other data sets and were not used. Nor were the DHS direct data, which—though generally reasonably close to the indirect—show a contrary trend for the early 1980s of continued decline rather than a stall or slight rise. The South model gave better consistency overall. An average of each of the corresponding points for 1970 and 1971 was taken (see Hill, 1989, 1991, 1992, for discussion), with the result then divided into two groups of the three earliest and three latest points for averaging to summarize. The DHS data were summarized in the same way, disguising the clear 1980s stall in the full indirect data, but the alternative of three groups of two points each yields a clear rise not visible in the South model results—or in the direct data, which show a continued decline.
For Mali, the sources considered were the 1960–1961 NDS (fair), the 1987 census (fair), and the 1987 DHS direct and indirect results (fair). South gave the best overall consistency. The DHS direct data were not used but agreed reasonably well with the indirect results. The 1987 census was not used because it agreed with neither the 1960–1961 survey nor the DHS (except around 1980). To smooth the overall trend, the earliest and latest data points from the 1960–1961 survey were not used, and averages were taken of the two points for women aged 25 to 29 and 30 to 34, and the two points for women aged 35 to 39 and 40 to 44. Data from the WFS were grouped in three groups of two points each, namely, the two earliest, the two middle, and the two latest.
For Nigeria, the sources considered were the 1981–1982 Nigeria fertility survey direct and indirect data (poor) and the 1990 Nigeria DHS direct and indirect data (fair). The WFS was not used. The DHS direct data were not used but agree well with the indirect results if a North model is used. Because the trend shown in the indirect results (a slight decline followed by a rise) could not be represented adequately by two averages of three data points each, the data were grouped into three pairs of two points each, and three averages were taken. This procedure reproduces quite well the three-
point trend from the direct data, though, as discussed in the text, the most recent point may be too high because of data errors.
For Senegal, the sources considered were the 1960 NDS (good), the 1978 WFS direct and indirect data (fair), and the 1986 DHS direct and indirect data (fair). The direct data were not used but agree well overall with all the other data sets. South gave the best fit overall. To smooth the rather rough and overlapping 1978 and 1986 trend lines, some careful selection of groups of points for averaging was necessary. The final choice was three groups of two points each from the 1960 survey, namely, the two earliest, the two middle, and the two latest; the two earliest and three latest points from the 1978 WFS; and the two middle and two latest points from the 1986 DHS.
For Togo, the sources considered were the 1961 census PES (fair), the 1971 census PES (fair), and the 1988 DHS direct and indirect data (poor). The DHS direct data were not used but are mostly consistent with indirect results. The South model produced much better consistency overall, but there was still something of a gap between 1961 and 1971 trends. To smooth this, two groups for averaging of two points each for women aged, respectively, 20 to 24 plus 25 to 29, and 30 to 34 plus 35 to 39, were chosen from the 1971 data. For each of the 1961 and 1988 data sets, two groups of the three earliest and three latest points were used.
APPENDIX B
TABLE 5–B.1 Child Survival Analysis Results, Botswana
|
|
Coale-Demeny North Model |
Coale-Demeny South Model |
||
|
Data Set |
Reference Date |
Probability of Dying Before Age 5 |
Reference Date |
Probability of Dying Before Age 5 |
|
1971 census |
1956.77 |
.1637 |
1955.85 |
.1862 |
|
|
1959.73 |
.1613 |
1959.05 |
.1786 |
|
1962.59 |
.1530 |
1962.13 |
.1654 |
|
|
1965.28 |
.1568 |
1965.01 |
.1628 |
|
|
1967.66 |
.1617 |
1967.55 |
.1606 |
|
|
1969.60 |
.1623 |
1969.60 |
.1525 |
|
|
1981 census |
1966.51 |
.1341 |
1965.58 |
.1550 |
|
|
1969.42 |
.1346 |
1968.73 |
.1505 |
|
1972.22 |
.1276 |
1971.74 |
.1391 |
|
|
1974.87 |
.1205 |
1974.58 |
.1257 |
|
|
1977.26 |
.1149 |
1977.13 |
.1138 |
|
|
1979.26 |
.1176 |
1979.25 |
.1085 |
|
|
1984 CPS |
1969.81 |
.1159 |
1968.93 |
.1353 |
|
|
1972.69 |
.1115 |
1972.06 |
.1254 |
|
1975.38 |
.1237 |
1974.94 |
.1345 |
|
|
1977.88 |
.0959 |
1977.61 |
.0996 |
|
|
1980.12 |
.0935 |
1980.01 |
.0921 |
|
|
1982.01 |
.1050 |
1982.00 |
.0965 |
|
|
1988 DHS |
1975.78 |
.0737 |
1975.06 |
.0881 |
|
|
1978.55 |
.0836 |
1978.08 |
.0937 |
|
1980.80 |
.0775 |
1980.49 |
.0839 |
|
|
1982.78 |
.0589 |
1982.58 |
.0607 |
|
|
1984.58 |
.0665 |
1984.48 |
.0654 |
|
|
1986.15 |
.0537 |
1986.13 |
.0495 |
|
|
|
Reference Date |
Equivalent Value of q5 |
||
|
1988 DHS |
1973–1977 |
|
.0886 |
|
|
Direct data |
1978–1982 |
.0598 |
||
|
|
1983–1988a |
.0527 |
||
|
aIncludes deaths in 1988 up to one month before interview. SOURCES: 1971 census (Botswana, 1972); 1981 census (Botswana, 1983); 1984 Contraceptive Prevalence Survey (CPS) (Botswana, 1985); 1988 Demographic and Health Survey (DHS) (Lesetedi et al., 1989). |
||||
TABLE 5–B.2 Child Survival Analysis Results, Zimbabwe
|
|
Coale-Demeny North Model |
Coale-Demeny South Model |
||
|
Data Set |
Reference Date |
Probability of Dying Before Age 5 |
Reference Date |
Probability of Dying Before Age 5 |
|
1969 census |
1954.8 |
.163 |
1954.0 |
.185 |
|
|
1957.7 |
.164 |
1957.1 |
.181 |
|
1960.4 |
.160 |
1960.0 |
.172 |
|
|
1962.9 |
.155 |
1962.6 |
.161 |
|
|
1965.1 |
.153 |
1965.0 |
.152 |
|
|
1967.0 |
.161 |
1967.0 |
.152 |
|
|
1982 census |
1968.3 |
.151 |
1967.4 |
.173 |
|
|
1971.2 |
.147 |
1970.6 |
.162 |
|
1973.9 |
.143 |
1973.4 |
.154 |
|
|
1976.3 |
.140 |
1976.1 |
.145 |
|
|
1978.5 |
.135 |
1978.4 |
.134 |
|
|
1980.4 |
.134 |
1980.4 |
.125 |
|
|
1984 CPS |
1970.3 |
.104 |
1969.5 |
.122 |
|
|
1973.2 |
.097 |
1972.6 |
.109 |
|
1975.8 |
.121 |
1975.4 |
.131 |
|
|
1978.2 |
.120 |
1978.0 |
.125 |
|
|
1980.4 |
.133 |
1980.3 |
.132 |
|
|
1982.2 |
.087 |
1982.2 |
.079 |
|
|
1987 ICDS |
1973.65 |
.1335 |
1972.82 |
.1535 |
|
|
1976.56 |
.1329 |
1975.98 |
.1476 |
|
1979.20 |
.1440 |
1978.81 |
.1550 |
|
|
1981.60 |
.1188 |
1981.37 |
.1226 |
|
|
1983.72 |
.1274 |
1983.63 |
.1253 |
|
|
1985.47 |
.0996 |
1985.46 |
.0910 |
|
|
1988 DHS |
1974.99 |
.0976 |
1974.17 |
.1151 |
|
|
1977.89 |
.0925 |
1977.31 |
.1041 |
|
1980.49 |
.0925 |
1980.10 |
.1005 |
|
|
1982.86 |
.0810 |
1982.63 |
.0837 |
|
|
1984.96 |
.0965 |
1984.86 |
.0946 |
|
|
1986.71 |
.0867 |
1986.70 |
.0790 |
|
|
|
Reference Date |
Equivalent Value of q5 |
||
|
1988 DHS |
1973–1977 |
|
.0916 |
|
|
Direct data |
1978–1982 |
.1036 |
||
|
|
1983–1988a |
.0751 |
||
|
aIncludes deaths in 1988 up to one month before interview. SOURCES: 1969 census (Rhodesia, n.d.); 1982 census (Zimbabwe, 1985a); 1984 Contraceptive Prevalence Survey (CPS) (Zimbabwe, 1985b); 1987 Intercensal Demographic Survey (ICDS) (Zimbabwe, 1991); 1988 Demographic and Health Survey (DHS) (Zimbabwe, 1989). |
||||
TABLE 5–B.3 Child Survival Analysis Results, Mozambique
|
|
Coale-Demeny North Model |
Coale-Demeny South Model |
||
|
Data Set |
Reference Date |
Probability of Dying Before Age 5 |
Reference Date |
Probability of Dying Before Age 5 |
|
1980 census |
1964.86 |
.2532 |
1963.89 |
.2794 |
|
|
1967.69 |
.2596 |
1966.97 |
.2819 |
|
1970.48 |
.2636 |
1969.96 |
.2818 |
|
|
1973.17 |
.2689 |
1972.83 |
.2826 |
|
|
1975.64 |
.2746 |
1975.48 |
.2810 |
|
|
1977.78 |
.2954 |
1977.75 |
.2929 |
|
|
1987 fertility survey (Maputo) |
1984.87 |
.1013 |
1984.85 |
.0937 |
|
1983.16 |
.1235 |
1983.04 |
.1226 |
|
|
1981.20 |
.1206 |
1980.97 |
.1248 |
|
|
|
1979.06 |
.1257 |
1978.70 |
.1357 |
|
1976.70 |
.1206 |
1976.17 |
.1342 |
|
|
1973.93 |
.1605 |
1973.14 |
.1814 |
|
|
SOURCES: 1980 census (Mozambique, n.d.); 1987 Maputo Fertility Survey (MFS) (WFS-type survey) (Mozambique, 1987). |
||||
TABLE 5–B.4 Child Survival Analysis Results, Angola
|
|
Coale-Demeny North Model |
Coale-Demeny South Model |
||
|
Data Set |
Reference Date |
Probability of Dying Before Age 5 |
Reference Date |
Probability of Dying Before Age 5 |
|
1940 census |
1924.06 |
.3299 |
1922.99 |
.3605 |
|
|
1927.13 |
.3334 |
1926.29 |
.3606 |
|
1930.43 |
.3256 |
1929.83 |
.3472 |
|
|
1933.63 |
.3403 |
1933.29 |
.3565 |
|
|
1936.44 |
.3625 |
1936.32 |
.3681 |
|
|
1938.70 |
.4240 |
1938.71 |
.4227 |
|
|
1988 demographic-socioeconomic survey, Southwest region—rural, pastoral |
1971.78 |
.1484 |
1970.70 |
.1716 |
|
1974.74 |
.1637 |
1973.90 |
.1834 |
|
|
1977.90 |
.1924 |
1977.29 |
.2097 |
|
|
1981.00 |
.2121 |
1980.62 |
.2238 |
|
|
1983.78 |
.1962 |
1983.63 |
.1981 |
|
|
1986.12 |
.2817 |
1986.11 |
.2757 |
|
|
1988 demographic-socioeconomic survey, Southwest region—rural, settled population |
1971.57 |
.1757 |
1970.46 |
.2009 |
|
1974.57 |
.1921 |
1973.70 |
.2142 |
|
|
1977.84 |
.2083 |
1977.21 |
.2268 |
|
|
1981.05 |
.2018 |
1980.67 |
.2130 |
|
|
1983.92 |
.2314 |
1983.77 |
.2339 |
|
|
1986.29 |
.2861 |
1986.29 |
.2795 |
|
|
SOURCES: 1940 census (Heisel, 1968); 1988 rural survey (RDS) (Angola, 1990). |
||||
TABLE 5–B.5 Child Survival Analysis Results, Malawi
|
|
Coale-Demeny North Model |
Coale-Demeny South Model |
||
|
Data Set |
Reference Date |
Probability of Dying Before Age 5 |
Reference Date |
Probability of Dying Before Age 5 |
|
1970–1971 population change survey— children ever born and children surviving |
1957.3 |
.340 |
1956.5 |
.366 |
|
1960.2 |
.344 |
1959.6 |
.365 |
|
|
1962.8 |
.354 |
1962.4 |
.370 |
|
|
1965.3 |
.339 |
1965.0 |
.352 |
|
|
1967.4 |
.374 |
1967.3 |
.380 |
|
|
1969.2 |
.419 |
1969.2 |
.421 |
|
|
1977 census |
1963.1 |
.318 |
1962.2 |
.344 |
|
|
1965.9 |
.324 |
1965.3 |
.345 |
|
1968.4 |
.327 |
1968.0 |
.344 |
|
|
1970.9 |
.327 |
1970.6 |
.341 |
|
|
1973.1 |
.326 |
1972.9 |
.333 |
|
|
1975.0 |
.328 |
1975.0 |
.328 |
|
|
1982 NDS |
1968.5 |
.307 |
1967.6 |
.333 |
|
|
1971.3 |
.308 |
1970.7 |
.329 |
|
1973.9 |
.303 |
1973.4 |
.319 |
|
|
1976.3 |
.294 |
1976.0 |
.306 |
|
|
1978.4 |
.283 |
1978.3 |
.287 |
|
|
1980.3 |
.282 |
1980.3 |
.277 |
|
|
1984 family formation survey |
1970.2 |
.262 |
1970.3 |
.272 |
|
1973.0 |
.253 |
1973.1 |
.262 |
|
|
1975.6 |
.254 |
1975.6 |
.262 |
|
|
|
1977.9 |
.242 |
1977.9 |
.238 |
|
1980.0 |
.252 |
1980.0 |
.259 |
|
|
1981.8 |
.274 |
1981.8 |
.264 |
|
|
|
Reference Date |
Equivalent Value of q5 |
||
|
1984 family formation survey |
1960–1964 |
|
.354 |
|
|
1965–1969 |
.313 |
|||
|
1970–1974 |
.295 |
|||
|
Direct data |
1975–1979 |
.239 |
||
|
SOURCES: 1970–1971 Population Change Survey (PCS) (Malawi, 1973); 1977 census (Malawi, 1980); 1982 National Demographic Survey (NDS) and 1984 Family Formation Survey (FFS) (Malawi, 1987c). |
||||
TABLE 5–B.6 Child Survival Analysis Results, Zaire
|
|
Coale-Demeny North Model |
Coale-Demeny South Model |
||
|
Data Set |
Reference Date |
Probability of Dying Before Age 5 |
Reference Date |
Probability of Dying Before Age 5 |
|
1955 NDS |
1940.72 |
.2923 |
1939.74 |
.3196 |
|
|
1943.57 |
.2741 |
1942.84 |
.2970 |
|
1946.40 |
.2949 |
1945.87 |
.3139 |
|
|
1949.13 |
.2790 |
1948.79 |
.2931 |
|
|
1951.62 |
.2622 |
1951.46 |
.2676 |
|
|
1953.77 |
.2485 |
1953.75 |
.2422 |
|
|
1984 census |
1971.18 |
.2181 |
1970.40 |
.2407 |
|
|
1974.00 |
.2120 |
1973.48 |
.2293 |
|
1976.44 |
.2037 |
1976.08 |
.2162 |
|
|
1978.62 |
.1996 |
1978.40 |
.2060 |
|
|
1980.58 |
.1984 |
1980.48 |
.1980 |
|
|
1982.26 |
.2093 |
1982.24 |
.2006 |
|
|
SOURCES: 1955 National Demographic Survey (NDS) (Romaniuk, 1968); 1984 census (Schneidman, 1990). |
||||
TABLE 5–B.7 Child Survival Analysis Results, Burundi
|
|
Coale-Demeny North Model |
Coale-Demeny South Model |
||
|
Data Set |
Reference Date |
Probability of Dying Before Age 5 |
Reference Date |
Probability of Dying Before Age 5 |
|
1970–1971 |
1957.62 |
.2697 |
1956.90 |
.2922 |
|
NDS |
1960.57 |
.2524 |
1967.10 |
.2697 |
|
|
1963.06 |
.2367 |
1962.77 |
.2483 |
|
1965.23 |
.2379 |
1965.08 |
.2430 |
|
|
1967.10 |
.2354 |
1967.05 |
.2324 |
|
|
1968.57 |
.1993 |
1968.58 |
.1886 |
|
|
1979 census |
1966.82 |
.2218 |
1966.06 |
.2442 |
|
PESa |
1969.74 |
.2353 |
1969.24 |
.2529 |
|
|
1972.25 |
.2119 |
1971.93 |
.2239 |
|
1974.47 |
.2259 |
1974.29 |
.2316 |
|
|
1976.41 |
.2188 |
1976.34 |
.2165 |
|
|
1977.97 |
.2286 |
1977.97 |
.2188 |
|
|
1987 DHS |
1974.37 |
.2019 |
1973.61 |
.2241 |
|
|
1977.35 |
.2073 |
1976.84 |
.2243 |
|
1979.95 |
.1779 |
1979.63 |
.1889 |
|
|
1982.24 |
.1804 |
1982.08 |
.1845 |
|
|
1984.21 |
.1945 |
1984.16 |
.1911 |
|
|
1985.76 |
.1800 |
1985.76 |
.1692 |
|
|
|
Reference Date |
Equivalent Value of q5 |
||
|
1987 DHS |
1972–1976 |
|
.2241 |
|
|
Direct data |
1977–1981 |
.2341 |
||
|
|
1982–1986b |
.1518 |
||
|
aPostenumeration survey. bThe survey year, 1987, is included. SOURCES: 1970–1971 National Demographic Survey (NDS) (Burundi, 1974); 1979 census postenumeration survey (PES) (Burundi, 1979); 1987 Demographic and Health Survey (DHS) (Segamba et al., 1988). |
||||
TABLE 5–B.8 Child Survival Analysis Results, Uganda
|
|
Coale-Demeny North Model |
Coale-Demeny South Model |
||
|
Data Set |
Reference Date |
Probability of Dying Before Age 5 |
Reference Date |
Probability of Dying Before Age 5 |
|
1969 census |
1954.28 |
.2630 |
1953.34 |
.2889 |
|
|
1957.12 |
.2495 |
1956.42 |
.2708 |
|
1959.86 |
.2237 |
1959.36 |
.2400 |
|
|
1962.47 |
.2135 |
1962.15 |
.2236 |
|
|
1964.85 |
.1987 |
1964.70 |
.2008 |
|
|
1966.91 |
.1945 |
1966.89 |
.1863 |
|
|
1988–1989 DHSa |
1974.71 |
.1755 |
1973.87 |
.1977 |
|
|
1977.54 |
.1702 |
1976.95 |
.1868 |
|
1980.09 |
.1651 |
1979.68 |
.1773 |
|
|
1982.43 |
.1828 |
1982.17 |
.1897 |
|
|
1984.55 |
.1922 |
1984.43 |
.1926 |
|
|
1986.37 |
.2228 |
1986.35 |
.2148 |
|
|
|
Reference Date |
Equivalent Value of q5 |
||
|
1988–1989 DHSa |
1973–1977 |
|
.1796 |
|
|
Direct data |
1978–1982 |
.1999 |
||
|
|
1983–1988b |
.1804 |
||
|
aDHS data refer only to southern Uganda. bIncludes calendar year 1988 up to the month preceding the date of interview. SOURCES: 1969 census (Uganda, 1969); 1988–1989 Demographic and Health Survey (DHS) (Kaijuka et al., 1989). |
||||
TABLE 5–B.9 Child Survival Analysis Results, Kenya
|
|
Coale-Demeny North Model |
Coale-Demeny South Model |
||
|
Data Set |
Reference Date |
Probability of Dying Before Age 5 |
Reference Date |
Probability of Dying Before Age 5 |
|
1962 census |
1947.71 |
.2579 |
1946.80 |
.2831 |
|
|
1950.55 |
.2546 |
1949.90 |
.2753 |
|
1953.24 |
.2392 |
1952.77 |
.2551 |
|
|
1955.76 |
.2285 |
1955.47 |
.2383 |
|
|
1958.05 |
.2171 |
1957.92 |
.2187 |
|
|
1960.02 |
.2100 |
1960.00 |
.2016 |
|
|
1969 census |
1955.07 |
.2320 |
1954.19 |
.2563 |
|
|
1957.94 |
.2179 |
1957.31 |
.2371 |
|
1960.59 |
.2068 |
1960.15 |
.2211 |
|
|
1963.07 |
.1962 |
1962.80 |
.2039 |
|
|
1965.30 |
.1869 |
1965.18 |
.1872 |
|
|
1967.19 |
.1853 |
1967.17 |
.1764 |
|
|
1977 national demographic survey |
1962.77 |
.1874 |
1961.92 |
.2101 |
|
1965.63 |
.1735 |
1965.03 |
.1905 |
|
|
1968.25 |
.1598 |
1967.83 |
.1718 |
|
|
|
1970.65 |
.1550 |
1970.40 |
.1607 |
|
1972.82 |
.1353 |
1972.70 |
.1342 |
|
|
1974.65 |
.1377 |
1974.63 |
.1285 |
|
|
1977–1978 WFS |
1963.82 |
.1795 |
1962.98 |
.2017 |
|
|
1966.66 |
.1577 |
1966.08 |
.1737 |
|
1969.22 |
.1579 |
1968.82 |
.1696 |
|
|
1971.56 |
.1547 |
1971.31 |
.1602 |
|
|
1973.66 |
.1562 |
1973.55 |
.1556 |
|
|
1975.45 |
.1643 |
1975.44 |
.1556 |
|
|
1979 census |
1964.77 |
.1893 |
1963.87 |
.2129 |
|
|
1967.67 |
.1773 |
1967.01 |
.1953 |
|
1970.43 |
.1641 |
1969.96 |
.1770 |
|
|
1973.01 |
.1601 |
1972.73 |
.1666 |
|
|
1975.33 |
.1506 |
1975.21 |
.1502 |
|
|
1977.29 |
.1589 |
1977.27 |
.1498 |
|
|
1983 national demographic survey |
1968.58 |
.1519 |
1967.71 |
.1733 |
|
1971.47 |
.1427 |
1970.85 |
.1583 |
|
|
1974.15 |
.1330 |
1973.72 |
.1440 |
|
|
|
1976.63 |
.1290 |
1976.37 |
.1339 |
|
1978.85 |
.1201 |
1978.74 |
.1186 |
|
|
1980.71 |
.1275 |
1980.70 |
.1183 |
|
|
|
Coale-Demeny North Model |
Coale-Demeny South Model |
||
|
Data Set |
Reference Date |
Probability of Dying Before Age 5 |
Reference Date |
Probability of Dying Before Age 5 |
|
1989 DHS |
1975.58 |
.1071 |
1974.79 |
.1252 |
|
|
1978.42 |
.0953 |
1977.88 |
.1069 |
|
1980.89 |
.0969 |
1980.53 |
.1051 |
|
|
1983.11 |
.1039 |
1982.89 |
.1072 |
|
|
1985.11 |
.0888 |
1985.01 |
.0871 |
|
|
1986.79 |
.1131 |
1986.78 |
.1043 |
|
|
|
Reference Date |
Equivalent Value of q5 |
||
|
1989 DHS |
1974–1978 |
|
.1055 |
|
|
Direct data |
1979–1983 |
.0931 |
||
|
|
1984–1989a |
.0892 |
||
|
1977–1978 |
1958–1963 |
.201 |
||
|
WFS |
1963–1968 |
.167 |
||
|
Direct data |
1968–1973 |
.164 |
||
|
|
1973–1978 |
.142 |
||
|
aIncludes calendar year 1989 up to the month preceding the date of interview. SOURCES: 1962 census (Kenya, 1962); 1969 census (Kenya, 1969); 1977 National Demographic Survey (NDS) (Kenya, 1980); 1977–1978 World Fertility Survey (WFS-indirect) (Kenya, 1980); World Fertility Survey (WFS-direct) (Rutstein, 1983); 1979 census (unpublished data); 1983 National Demographic Survey (NDS) (unpublished data); 1989 Demographic and Health Survey (DHS) (Kenya, 1989). |
||||
TABLE 5–B.10 Child Survival Analysis Results, Sudan
|
|
Coale-Demeny North Model |
Coale-Demeny South Model |
||
|
Data Set |
Reference Date |
Probability of Dying Before Age 5 |
Reference Date |
Probability of Dying Before Age 5 |
|
1973 census, national |
1958.22 |
.2016 |
1957.31 |
.2256 |
|
1961.09 |
.2009 |
1960.42 |
.2203 |
|
|
|
1963.82 |
.1886 |
1963.35 |
.2030 |
|
1966.40 |
.1966 |
1966.10 |
.2051 |
|
|
1968.73 |
.2036 |
1968.60 |
.2048 |
|
|
1970.72 |
.2310 |
1970.70 |
.2230 |
|
|
1973 census, northern Sudan |
1958.52 |
.1807 |
1957.63 |
.2036 |
|
1961.38 |
.1815 |
1960.73 |
.1997 |
|
|
1964.04 |
.1675 |
1963.59 |
.1804 |
|
|
|
1966.54 |
.1701 |
1966.26 |
.1771 |
|
1968.80 |
.1713 |
1968.67 |
.1717 |
|
|
1970.73 |
.1946 |
1970.71 |
.1859 |
|
|
1979 WFSa household survey |
1965.15 |
.1303 |
1964.32 |
.1502 |
|
1968.07 |
.1529 |
1967.48 |
.1687 |
|
|
1970.72 |
.1386 |
1970.32 |
.1493 |
|
|
|
1973.13 |
.1534 |
1972.90 |
.1584 |
|
1975.26 |
.1502 |
1975.17 |
.1486 |
|
|
1977.01 |
.1782 |
1977.01 |
.1685 |
|
|
1979 WFSa individual survey |
1964.53 |
.1380 |
1963.64 |
.1588 |
|
1967.49 |
.1360 |
1966.84 |
.1516 |
|
|
1970.30 |
.1369 |
1969.86 |
.1482 |
|
|
|
1972.92 |
.1381 |
1972.66 |
.1430 |
|
1975.22 |
.1348 |
1975.12 |
.1328 |
|
|
1977.10 |
.2178 |
1977.10 |
.2075 |
|
|
1983 census |
1969.84 |
.1469 |
1969.07 |
.1671 |
|
|
1972.70 |
.1540 |
1972.18 |
.1690 |
|
1975.16 |
.1383 |
1974.81 |
.1484 |
|
|
1977.35 |
.1417 |
1977.14 |
.1458 |
|
|
1979.29 |
.1438 |
1979.21 |
.1420 |
|
|
1980.92 |
.1585 |
1980.91 |
.1494 |
|
|
1989–1990 DHSa |
1977.66 |
.1212 |
1977.02 |
.1391 |
|
|
1980.16 |
.1527 |
1979.80 |
.1662 |
|
1981.91 |
.1332 |
1981.64 |
.1424 |
|
|
1983.39 |
.1467 |
1983.18 |
.1519 |
|
|
1984.87 |
.1384 |
1984.71 |
.1398 |
|
|
1986.36 |
.1102 |
1986.30 |
.1046 |
|
|
|
Coale-Demeny North Model |
Coale-Demeny South Model |
||
|
Data Set |
Reference Date |
Probability of Dying Before Age 5 |
Reference Date |
Probability of Dying Before Age 5 |
|
|
Reference Date |
Equivalent Value of q5 |
||
|
1989–1990 DHSa |
1975–1979 |
|
.1431 |
|
|
Direct data |
1980–1984 |
.1468 |
||
|
|
1985–1990b |
.1234 |
||
|
1978–1979 WFSa |
1965–1969 |
.1428 |
||
|
Direct data |
1970–1974 |
.1359 |
||
|
|
1975–1979 |
.1473 |
||
|
aWFS and DHS data for Sudan refer only to northern Sudan. bIncludes calendar year 1990 up to the month preceding the date of interview. SOURCES: 1973 census (Sudan, n.d.); 1979 World Fertility Survey (WFS) (Sudan, 1982); 1989 Demographic and Health Survey (DHS) (Sudan, 1991). |
||||
TABLE 5–B.11 Child Survival Analysis Results, Senegal
|
|
Coale-Demeny North Model |
Coale-Demeny South Model |
||
|
Data Set |
Reference Date |
Probability of Dying Before Age 5 |
Reference Date |
Probability of Dying Before Age 5 |
|
1960 survey |
1945.58 |
.3472 |
1944.71 |
.3733 |
|
|
1948.33 |
.3513 |
1947.71 |
.3728 |
|
1950.83 |
.3300 |
1950.38 |
.3471 |
|
|
1953.17 |
.3243 |
1952.88 |
.3389 |
|
|
1955.35 |
.2984 |
1955.19 |
.3061 |
|
|
1957.29 |
.2881 |
1957.25 |
.2865 |
|
|
1978 WFS |
1965.98 |
.2548 |
1965.28 |
.2769 |
|
|
1968.75 |
.2865 |
1968.31 |
.3034 |
|
1970.97 |
.2751 |
1970.68 |
.2872 |
|
|
1972.91 |
.2583 |
1972.72 |
.2656 |
|
|
1974.66 |
.2736 |
1974.56 |
.2754 |
|
|
1976.18 |
.2735 |
1976.16 |
.2689 |
|
|
1986 DHS |
1972.15 |
.2282 |
1971.31 |
.2519 |
|
|
1974.99 |
.2356 |
1974.39 |
.2547 |
|
1977.56 |
.2438 |
1977.14 |
.2585 |
|
|
1979.92 |
.2107 |
1979.67 |
.2187 |
|
|
1982.06 |
.2172 |
1981.95 |
.2180 |
|
|
1983.90 |
.2170 |
1983.88 |
.2085 |
|
|
|
Reference Date |
Equivalent Value of q5 |
||
|
1986 DHS |
1971–1975 |
|
.2870 |
|
|
Direct data |
1976–1980 |
.2363 |
||
|
|
1981–1985a |
.1908 |
||
|
1978 WFS |
1950–1954 |
.292 |
||
|
Direct data |
1955–1959 |
.277 |
||
|
|
1960–1964 |
.282 |
||
|
1965–1969 |
.284 |
|||
|
1970–1974 |
.264 |
|||
|
1975–1977 |
.167 |
|||
|
aThe survey year, 1986, is included. SOURCES: 1960 National Demographic Survey (NDS) (Verrière, n.d.); 1978 World Fertility Survey (WFS-direct) (Rutstein, 1983); World Fertility Survey (WFS-indirect) (Ewbank, 1985); 1986 Demographic and Health Survey (DHS) (Ndiaye et al., 1988). |
||||
TABLE 5–B.12 Child Survival Analysis Results, Mali
|
|
Coale-Demeny North Model |
Coale-Demeny South Model |
||
|
Data Set |
Reference Date |
Probability of Dying Before Age 5 |
Reference Date |
Probability of Dying Before Age 5 |
|
1960–1961 NDS |
1946.49 |
.3454 |
1945.65 |
.3709 |
|
|
1949.23 |
.3611 |
1948.64 |
.3819 |
|
1951.67 |
.3651 |
1951.24 |
.3820 |
|
|
1953.93 |
.3635 |
1953.65 |
.3792 |
|
|
1956.04 |
.3643 |
1955.89 |
.3750 |
|
|
1957.91 |
.3481 |
1957.88 |
.3505 |
|
|
1987 DHS |
1973.88 |
.3184 |
1973.12 |
.3417 |
|
|
1976.54 |
.3131 |
1976.04 |
.3311 |
|
1978.70 |
.3014 |
1978.35 |
.3151 |
|
|
1980.65 |
.2880 |
1980.40 |
.2991 |
|
|
1982.49 |
.2588 |
1982.34 |
.2639 |
|
|
1984.19 |
.2786 |
1984.15 |
.2778 |
|
|
1987 census |
1972.63 |
.2800 |
1971.76 |
.3050 |
|
|
1975.44 |
.2917 |
1974.81 |
.3122 |
|
1978.00 |
.3008 |
1977.56 |
.3171 |
|
|
1980.41 |
.2981 |
1980.12 |
.3108 |
|
|
1982.61 |
.2892 |
1982.47 |
.2949 |
|
|
1984.52 |
.2980 |
1984.50 |
.2957 |
|
|
|
Reference Date |
Equivalent Value of q5 |
||
|
1987 DHS |
1972–1976 |
|
.360 |
|
|
Direct data |
1977–1981 |
.311 |
||
|
|
1982–1986a |
.249 |
||
|
aThe survey year, 1987, is included. SOURCES: 1960–1961 National Demographic Survey (NDS) (Mali, n.d.); 1987 Demographic and Health Survey (DHS) (Traoré et al., 1989); 1987 census (unpublished data). |
||||
TABLE 5–B.13 Child Survival Analysis Results, Burkina Faso
|
|
Coale-Demeny North Model |
Coale-Demeny South Model |
||
|
Data Set |
Reference Date |
Probability of Dying Before Age 5 |
Reference Date |
Probability of Dying Before Age 5 |
|
1960–1961 rural national demographic survey |
1946.36 |
.3933 |
1945.47 |
.4204 |
|
1949.22 |
.4063 |
1948.59 |
.4288 |
|
|
1951.90 |
.4060 |
1951.45 |
.4238 |
|
|
1954.39 |
.4025 |
1954.12 |
.4185 |
|
|
|
1956.64 |
.4210 |
1956.52 |
.4311 |
|
1958.55 |
.4307 |
1958.53 |
.4346 |
|
|
1961 |
1947.99 |
.2561 |
1947.22 |
.2790 |
|
Ougadougou survey |
1950.55 |
.2591 |
1950.04 |
.2771 |
|
1952.61 |
.2588 |
1952.23 |
.2732 |
|
|
|
1954.49 |
.2618 |
1954.21 |
.2736 |
|
1956.33 |
.2279 |
1956.15 |
.2342 |
|
|
1958.12 |
.1900 |
1958.06 |
.1864 |
|
|
1975 census |
1961.61 |
.2856 |
1960.74 |
.3108 |
|
PESa |
1964.44 |
.2804 |
1963.81 |
.3010 |
|
|
1967.04 |
.2718 |
1966.59 |
.2878 |
|
1969.46 |
.2754 |
1969.18 |
.2868 |
|
|
1971.67 |
.2687 |
1971.54 |
.2728 |
|
|
1973.58 |
.2700 |
1973.56 |
.2650 |
|
|
1985 census |
1971.00 |
.2503 |
1970.09 |
.2755 |
|
|
1973.89 |
.2504 |
1973.22 |
.2712 |
|
1976.64 |
.2309 |
1976.17 |
.2466 |
|
|
1979.23 |
.2034 |
1978.95 |
.2119 |
|
|
1981.57 |
.2114 |
1981.44 |
.2123 |
|
|
1983.54 |
.2204 |
1983.52 |
.2116 |
|
|
aPostenumeration survey. SOURCES: 1960–1961 rural survey and 1975 census (Burkina Faso, 1981); 1961 Ougadougou (Burkina Faso, n.d.); 1985 census (unpublished data). |
||||
TABLE 5–B.14 Child Survival Analysis Results, The Gambia
|
|
Coale-Demeny North Model |
Coale-Demeny South Model |
||
|
Data Set |
Reference Date |
Probability of Dying Before Age 5 |
Reference Date |
Probability of Dying Before Age 5 |
|
1973 census |
1958.55 |
.3232 |
1957.68 |
.3489 |
|
|
1961.31 |
.3344 |
1960.69 |
.3556 |
|
1963.81 |
.3256 |
1963.36 |
.3425 |
|
|
1966.15 |
.3367 |
1965.85 |
.3518 |
|
|
1968.32 |
.3296 |
1968.17 |
.3387 |
|
|
1970.26 |
.3363 |
1970.23 |
.3377 |
|
|
1983 census |
1968.70 |
.2605 |
1967.84 |
.2849 |
|
|
1971.43 |
.2740 |
1970.82 |
.2941 |
|
1973.87 |
.2555 |
1973.43 |
.2712 |
|
|
1976.15 |
.2581 |
1975.86 |
.2697 |
|
|
1978.29 |
.2445 |
1978.13 |
.2495 |
|
|
1980.20 |
.2356 |
1980.17 |
.2305 |
|
|
SOURCES: 1973 census (The Gambia, 1976); 1983 census (The Gambia, 1987). |
||||
TABLE 5–B.15 Child Survival Analysis Results, Ghana
|
|
Coale-Demeny North Model |
Coale-Demeny South Model |
||
|
Data Set |
Reference Date |
Probability of Dying Before Age 5 |
Reference Date |
Probability of Dying Before Age 5 |
|
1948 census |
1934.00 |
.3555 |
1933.21 |
.3800 |
|
|
1936.64 |
.3432 |
1936.10 |
.3624 |
|
1938.84 |
.3543 |
1938.45 |
.3700 |
|
|
1940.86 |
.3321 |
1940.58 |
.3467 |
|
|
1942.80 |
.2915 |
1942.63 |
.3004 |
|
|
1944.61 |
.2483 |
1944.56 |
.2460 |
|
|
1960 census |
1945.99 |
.2632 |
1945.14 |
.2876 |
|
PESa |
1948.75 |
.3242 |
1948.16 |
.3446 |
|
|
1951.22 |
.2541 |
1950.80 |
.2693 |
|
1953.52 |
.2453 |
1953.24 |
.2555 |
|
|
1955.63 |
.2391 |
1955.49 |
.2426 |
|
|
1957.50 |
.2310 |
1957.47 |
.2247 |
|
|
1970 census |
1957.02 |
.2196 |
1956.14 |
.2436 |
|
PESa |
1959.91 |
.2141 |
1959.28 |
.2333 |
|
|
1962.61 |
.2076 |
1962.17 |
.2219 |
|
1965.13 |
.2082 |
1964.86 |
.2162 |
|
|
1967.38 |
.1981 |
1967.26 |
.1982 |
|
|
1969.27 |
.1918 |
1969.26 |
.1826 |
|
|
1979–1980 WFS |
1964.98 |
.1488 |
1964.09 |
.1702 |
|
|
1967.87 |
.1369 |
1967.22 |
.1524 |
|
1970.58 |
.1232 |
1970.13 |
.1341 |
|
|
1973.11 |
.1280 |
1972.84 |
.1331 |
|
|
1975.38 |
.1254 |
1975.27 |
.1242 |
|
|
1977.30 |
.1507 |
1977.29 |
.1417 |
|
|
1988 DHS |
1974.34 |
.1679 |
1973.52 |
.1895 |
|
|
1977.20 |
.1513 |
1976.63 |
.1668 |
|
1979.75 |
.1499 |
1979.36 |
.1611 |
|
|
1982.07 |
.1613 |
1981.83 |
.1668 |
|
|
1984.15 |
.1613 |
1984.04 |
.1605 |
|
|
1985.90 |
.1751 |
1985.89 |
.1662 |
|
|
|
Reference Date |
Equivalent Value of q5 |
||
|
1988 DHS |
1973–1977 |
|
.1872 |
|
|
Direct data |
1978–1982 |
.1524 |
||
|
|
1983–1987b |
.1547 |
||
TABLE 5–B.16 Child Survival Analysis Results, Togo
|
|
Coale-Demeny North Model |
Coale-Demeny South Model |
||
|
Data Set |
Reference Date |
Probability of Dying Before Age 5 |
Reference Date |
Probability of Dying Before Age 5 |
|
1961 census |
1947.82 |
.3334 |
1947.01 |
.3582 |
|
PESa |
1950.64 |
.3188 |
1950.08 |
.3383 |
|
|
1953.12 |
.3282 |
1952.73 |
.3431 |
|
1955.37 |
.3249 |
1955.13 |
.3365 |
|
|
1957.42 |
.3271 |
1957.30 |
.3325 |
|
|
1959.18 |
.3171 |
1959.16 |
.3150 |
|
|
1971 census |
1957.18 |
.2759 |
1956.34 |
.3003 |
|
PESa |
1960.04 |
.2636 |
1959.45 |
.2832 |
|
|
1962.64 |
.2596 |
1962.23 |
.2743 |
|
1965.02 |
.2414 |
1964.77 |
.2501 |
|
|
1967.16 |
.2423 |
1967.05 |
.2433 |
|
|
1968.96 |
.2190 |
1968.95 |
.2101 |
|
|
1988 DHS |
1974.72 |
.1781 |
1973.90 |
.2001 |
|
|
1977.57 |
.1875 |
1977.00 |
.2047 |
|
1980.09 |
.1717 |
1979.70 |
.1837 |
|
|
1982.39 |
.1808 |
1982.15 |
.1870 |
|
|
1984.46 |
.1558 |
1984.36 |
.1551 |
|
|
1986.22 |
.1560 |
1986.21 |
.1473 |
|
|
|
Reference Date |
Equivalent Value of q5 |
||
|
1988 DHS |
1973–1977 |
|
.2056 |
|
|
Direct data |
1978–1982 |
.1590 |
||
|
|
1983–1988 |
.1582 |
||
|
aPostenumeration survey. SOURCES: 1961 census postenumeration survey (PES) (United Nations, 1978); 1971 census postenumeration survey (PES) (Adognon, 1980); 1988 Demographic and Health Survey (DHS) (Agounké et al., 1989). |
||||
TABLE 5–B.17 Child Survival Analysis Results, Côte d’Ivoire
|
|
Coale-Demeny North Model |
Coale-Demeny South Model |
||
|
Data Set |
Reference Date |
Probability of Dying Before Age 5 |
Reference Date |
Probability of Dying Before Age 5 |
|
1978–1979 multiround NDS |
1964.50 |
.2557 |
1963.70 |
.2790 |
|
1967.19 |
.2513 |
1966.65 |
.2696 |
|
|
1969.47 |
.2390 |
1969.09 |
.2531 |
|
|
|
1971.55 |
.2773 |
1971.29 |
.2885 |
|
1973.51 |
.2158 |
1973.36 |
.2187 |
|
|
1975.28 |
.2016 |
1975.25 |
.1954 |
|
|
1980–1981 WFS |
1966.21 |
.2433 |
1965.33 |
.2677 |
|
|
1968.99 |
.2248 |
1968.37 |
.2441 |
|
1971.53 |
.2127 |
1971.08 |
.2275 |
|
|
1973.91 |
.2018 |
1973.62 |
.2107 |
|
|
1976.10 |
.2018 |
1975.96 |
.2040 |
|
|
1978.03 |
.1919 |
1978.00 |
.1843 |
|
|
1988 census |
1973.75 |
.1859 |
1972.91 |
.2085 |
|
|
1976.48 |
.1792 |
1975.89 |
.1963 |
|
1978.91 |
.1612 |
1978.48 |
.1735 |
|
|
1981.16 |
.1481 |
1980.87 |
.1545 |
|
|
1983.26 |
.1394 |
1983.11 |
.1402 |
|
|
1985.14 |
.1428 |
1985.11 |
.1355 |
|
|
|
Reference Date |
Equivalent Value of q5 |
||
|
1980–1981 WFS |
1960–1964 |
|
.287 |
|
|
Direct data |
1965–1969 |
.255 |
||
|
|
1970–1974 |
.243 |
||
|
1975–1979 |
.176 |
|||
|
SOURCES: 1978–1979 National Demographic Survey (NDS) (Côte d’Ivoire, n.d.); 1980–1981 World Fertility Survey (WFS) (Côte d’Ivoire, 1984); 1988 census (unpublished data). |
||||
TABLE 5–B.18 Child Survival Analysis Results, Liberia
|
|
Coale-Demeny North Model |
Coale-Demeny South Model |
||
|
Data Set |
Reference Date |
Probability of Dying Before Age 5 |
Reference Date |
Probability of Dying Before Age 5 |
|
1970 |
1953.72 |
.3089 |
1952.66 |
.3384 |
|
NDS, round one |
1956.57 |
.2915 |
1955.75 |
.3169 |
|
1959.56 |
.2622 |
1958.95 |
.2829 |
|
|
|
1962.52 |
.2509 |
1962.12 |
.2660 |
|
1965.23 |
.2638 |
1965.05 |
.2715 |
|
|
1967.60 |
.2840 |
1967.57 |
.2809 |
|
|
1971 |
1956.70 |
.3289 |
1955.81 |
.3550 |
|
NDS, round two |
1959.46 |
.3029 |
1958.83 |
.3238 |
|
1961.99 |
.2919 |
1961.54 |
.3085 |
|
|
|
1964.37 |
.2953 |
1964.07 |
.3086 |
|
1966.58 |
.2775 |
1966.42 |
.2839 |
|
|
1968.53 |
.2802 |
1968.50 |
.2776 |
|
|
1974 census |
1959.79 |
.2376 |
1958.91 |
.2620 |
|
|
1962.48 |
.2400 |
1961.85 |
.2600 |
|
1964.92 |
.2240 |
1964.45 |
.2397 |
|
|
1967.23 |
.2234 |
1966.91 |
.2345 |
|
|
1969.41 |
.2081 |
1969.23 |
.2127 |
|
|
1971.41 |
.1777 |
1971.37 |
.1719 |
|
|
1986 DHS |
1972.01 |
.2372 |
1971.17 |
.2610 |
|
|
1974.76 |
.2211 |
1974.17 |
.2397 |
|
1977.20 |
.2344 |
1976.78 |
.2491 |
|
|
1979.45 |
.2194 |
1979.18 |
.2285 |
|
|
1981.54 |
.2486 |
1981.40 |
.2526 |
|
|
1983.40 |
.2501 |
1983.36 |
.2451 |
|
|
|
Reference Date |
Equivalent Value of q5 |
||
|
1986 DHS |
1971–1975 |
|
.275 |
|
|
Direct data |
1976–1980 |
.243 |
||
|
|
1981–1986 |
.220 |
||
|
SOURCES: 1970–1971 National Demographic Survey (NDS) (Massalee, 1974; United Nations, 1978); 1974 census (Liberia, 1977); 1986 Demographic and Health Survey (DHS) (Cheih-Johnson et al., 1988). |
||||
TABLE 5–B.19 Child Survival Analysis Results, Nigeria
|
|
Coale-Demeny North Model |
Coale-Demeny South Model |
||
|
Data Set |
Reference Date |
Probability of Dying Before Age 5 |
Reference Date |
Probability of Dying Before Age 5 |
|
1981–1982 |
|
|||
|
WFS |
1966.92 |
.1729 |
1965.97 |
.1961 |
|
|
1969.81 |
.1778 |
1969.10 |
.1964 |
|
1972.63 |
.1570 |
1972.12 |
.1703 |
|
|
1975.31 |
.1427 |
1975.00 |
.1492 |
|
|
1977.74 |
.1596 |
1977.60 |
.1601 |
|
|
1979.80 |
.1876 |
1979.78 |
.1787 |
|
|
1990 DHS |
1976.83 |
.1974 |
1976.04 |
.2197 |
|
|
1979.64 |
.1972 |
1979.10 |
.2143 |
|
1982.05 |
.1979 |
1981.68 |
.2105 |
|
|
1984.23 |
.1862 |
1981.00 |
.1926 |
|
|
1986.21 |
.1937 |
1986.10 |
.1939 |
|
|
1987.92 |
.2228 |
1987.89 |
.2149 |
|
|
|
Reference Date |
Equivalent Value of q5 |
||
|
1990 DHS |
1975.5–1980.5 |
|
.2009 |
|
|
Direct data |
1980.5–1985.5 |
.1891 |
||
|
|
1985.5–1990.5 |
.1924 |
||
|
SOURCES: 1981–1982 World Fertility Survey (WFS) (unpublished data); 1990 Demographic and Health Survey (DHS) (Nigeria, 1992). |
||||
REFERENCES
Adognon, K. 1980 L’evolution de la fécondité dans les années soixante (1961–1971) au Togo. In Actes du Colloque de Démographic d’Abidjan (22–26 janvier 1979), Tome 1, Fécondité. Abidjan: Institut de Formation et de Recherche Démographiques.
Agounké, A., M.Assogba, and K.Anipah 1989 Enquête Démographique et de Santé au Togo, 1988. Lomé: Unité de Recherche Démographique, Direction de la Statistique, Direction Générale de la Santé; Columbia, Md.: Institute for Resource Development/Macro Systems, Inc.
Angola 1990 Famílias e aldeias do sul de Angola: análise dum inquérito socio-económico e demográfico nas Zonas rurais da regiao Sal-Sudoeste. Institute Nacional de Estatistica Unidade de Analise demografica. República Popular de Angola.
Botswana 1972 Report on the Population Census, 1971. Gabarone: Central Statistical Office.
1983 1981 Population and Housing Census: Administrative/Technical Report and National Statistics Tables. Gabarone: Central Statistical Office.
1985 Botswana Family Health Survey 1984. Gabarone: Ministry of Health; Columbia, Md.: Westinghouse Public Applied Systems.
Brass, W., A.J.Coale, P.Demeny, D.F.Heisel, F.Lorimer, A.Romaniuk, and E.van de Walle 1968 The Demography of Tropical Africa. Princeton, N.J.: Princeton University Press.
Burkina Faso No date Recensement Démographique, Ouagadougou, 1961–62. Resultats Définitifs. Paris: INSEE.
1981 Morbidité et Mortalité en Haute-Volta: 1960–76. Dossier Technique, no. 4. Ouagadougou: Institut National de la Statistique et de la Demographic.
Burundi 1974 Enquête Démographique, 1970–71. Bujumbura: Département de Statistiques/République Française.
Chieh-Johnson, D., A.R.Cross, A.A.Way, and J.M.Sullivan 1988 Liberia Demographic and Health Survey, 1986. Monrovia: Bureau of Statistics, Ministry of Planning and Economic Affairs; Columbia, Md.: Institute for Resource Development/Westinghouse.
Coale, P., and D.F.Demeny 1983 Regional Model Life Tables and Stable Populations, 2nd ed. San Diego: Academic Press.
Côte d’Ivoire No date Enquête Démographique à Passages Répétés 1978–1979: Resultats Définitifs. Abidjan: Ministère du plan et de l’industrie, Direction de la Statistique.
1984 Enquête Ivoirienne sur la Fécondité 1980–81: Rapport Principal, Tome II, Tableaux Statistiques. Abidjan: Ministère de l’economie et des finances, Direction de la Statistique.
Ewbank, D.C. 1985 Senegal population sector report. Unpublished paper commissioned by the World Bank. Population Studies Center, University of Pennsylvania, Philadelphia .
Gaisie, S.K. 1969 Dynamics of Population Growth in Ghana. Accra-Tema: Ghana Publishing Corporation.
The Gambia 1976 Population Census, 1973, Vol. III, General Report. Banjul: Central Statistics Division, Ministry of Economic Planning and Industrial Development.
1987 Population and Housing Census, 1983. Banjul: Central Statistics Division, Ministry of Economic Planning and Industrial Development.
Ghana No date The Gold Coast, 1950: Census of Population, 1948: Report and Tables.
1989 Ghana Demographic and Health Survey, 1988. Accra: Ghana Statistical Service; Columbia, Md.: Institute for Resource Development/Macro Systems, Inc.
Heisel, D.F. 1968 The demography of the Portuguese territories: Angola, Mozambique, and Portuguese Guinea. Pp. 440–465 in W.Brass, A.J.Coale, P.Demeny, D.F.Heisel, F. Lorimer, A.Romaniuk, and E.van de Walle, The Demography of Tropical Africa. Princeton, N.J.: Princeton University Press.
Hill, A.L.L. 1989 La mortalité des enfants: Niveau actuel et evolution depuis 1945. In G.Pison, E. van de Walle, and M.Sala-Diakanda, eds., Mortalité et Societé en Afrique au Sud du Sahara. Cahier No. 24. Presses Universitaires de France.
1991 Infant and child mortality: Levels, trends, and data deficiencies. Pp. 37–70 in R. Feachem and D.T.Jamison, eds., Disease and Mortality in Sub-Saharan Africa. Oxford: Oxford University Press for The World Bank.
1992 Trends in childhood mortality in sub-Saharan mainland Africa. In E. van de Walle, G.Pison, and M.Sala-Diakanda, eds., Mortality and Society in Sub-Saharan Africa. Oxford: Clarendon Press.
Kaijuka, E.M., E.Z.A.Kaija, A.R.Cross, and E.Loaiza 1989 Uganda Demographic and Health Surveys, 1988/1989. Entebbe: Ministry of Health; Ministry of Planning and Economic Development: Department of Geography, Makerere University; Institute of Statistics and Applied Economics, Makerere University; Columbia, Md.: Institute for Resource Development/Macro Systems, Inc.
Kenya 1962 1963 Population Census. Nairobi: Central Bureau of Statistics, Ministry of Finance and Planning.
1969 1969 Population Census, Vol. IV, Analytical Report. Nairobi: Central Bureau of Statistics, Ministry of Finance and Planning.
1980 Kenya Fertility Survey, 1977–1978, First Report, Vol. I. Nairobi: Central Bureau of Statistics, Ministry of Economic Planning and Development.
1989 Kenya Demographic and Health Survey, 1989. Nairobi: National Council for Population and Development, Ministry of Home Affairs and National Heritage; Columbia, Md.: Institute for Resource Development/Macro Systems, Inc.
Lesetedi, L.T., G.D.Mompati, P.Khulumani, G.N.Lesetedi, and N.Rutenberg 1989 Botswana Family Health Survey II, 1988. Gaborone: Central Statistics Office, Ministry of Finance and Development Planning; Family Health Division, Ministry of Health ; Columbia, Md.: Institute for Resource Development/Macro Systems, Inc.
Liberia 1977 1974 Population and Housing Census of Liberia: Population Characteristics of Major Areas. Monrovia: Ministry of Planning and Economic Affairs.
Malawi 1973 Malawi Population Change Survey, 1970–72. Zomba: National Statistical Office.
1980 Malawi Population Census, 1977: Final Report, Vol. 1. Zomba: National Statistical Office.
1985 Malawi Family Formation Survey, 1984. Vol. III: Mortality and Maternal and Child Health. Lilongwe: Ministry of Health.
1987a Malawi Demographic Survey, 1982. Zomba: National Statistical Office.
1987b Malawi Family Formation Survey, 1984. Zomba: National Statistical Office.
1987c Family Formation Survey, Vol. III: Mortality and Maternal and Child Health. Lilongwe: Ministry of Health.
Mali No date Mali Enquête Démographique du Mali, 1960–61. Bamako: Service de la Statistique.
Massalee, A.Z. 1974 The population of Liberia. In the Committee for International Cooperation in National Research in Demography (CICRED) Series. Monrovia: Ministry of Planning and Economic Affairs, Population Division.
McGregor, I.A. 1991 Morbidity and mortality at Keneba, The Gambia, 1950–75. Pp. 306–324 in R. Feachem and D.T.Jamison, eds., Disease and Mortality in Sub-Saharan Africa. Oxford: Oxford University Press for The World Bank.
Mozambique, Ministry of Statistics No date Mortalidad. Annex to: 1980 Census Report. Maputo: Departamento de Demographia, Direccao Nacional de Estatica.
1987 Maputo Fertility Survey, 1987. Maputo: Departamento de Demographia, Direccao Nacional de Estatica.
Ndiaye, S., I.Sarr, and M.Ayad 1988 Enquête Démographique et de Santé au Sénégal, 1986. Dakar: Ministère de l’Economic et des Finances, Direction de la Statistique, Division des Enquêtes et de la Démographie; Columbia, Md.: Institute for Resource Development/Westinghouse.
Nigeria 1992 Nigeria Demographic and Health Survey, 1990. Lagos: Federal Office of Statistics; Columbia, Md.: Institute for Resource Development/Macro International, Inc.
Owusu, J.Y. 1984 Evaluation of the Ghana Fertility Survey, 1978–80. In World Fertility Survey Scientific Reports. Number 69. Voorburg, Netherlands: International Statistical Institute.
Ramachandran, K.V. 1979 Fertility and mortality levels, patterns and trends in some anglophone African Countries. Paper presented at the Economic Commission for Africa Expert Group Meeting on Fertility and Mortality Levels, Patterns and Trends in Africa and their Policy Implications. Monrovia, Liberia.
Rhodesia No date Report of the Census of Population, 1969. Salisbury: Central Statistical Office.
Romaniuk, A. 1968 The demography of the Democratic Republic of the Congo. Pp. 241–340 in W. Brass, A.J.Coale, P.Demeny, D.F.Heisel, F.Lorimer, A.Romaniuk, and E.van de Walle, The Demography of Tropical Africa. Princeton, N.J.: Princeton University Press.
Rutstein, S.O. 1983 Infant and child mortality: Levels, trends and demographic differentials. In World Fertility Survey Comparative Studies. Number 24. Voorburg, Netherlands: International Statistical Institute.
1984 Infant and child mortality: Levels, trends and demographic differentials. In World Fertility Survey Comparative Studies. Number 43. Voorburg, Netherlands: International Statistical Institute.
Schneidman, M. 1990 Mortality and Fertility Trends in Zaire. Internal Discussion Paper, Africa Regional Series. Washington, D.C.: The World Bank.
Segamba, L., V.Ndikumasabo, C.Makinson, and M.Ayad 1988 Enquête Démographique et de Santé au Burundi 1987. Gitega: Ministère de l’Intérieur, Département de la Population; Columbia, Md.: Institute for Resource Development/Westinghouse.
Senegal 1981 Enquête Sénégalaise sur la Fécondité, 1978: Rapport National d’Analyse, Tome 1, Analyse des Résultats Définitifs, and Tome 2, Résultats Définitifs. Dakar: Ministère de l’Economie et des Finances, Direction de la Statistique .
Sudan No date The Sudan Population Census, 1973. Khartoum: Population Census Office, Ministry of Finance and Economic Planning.
1982 The Sudan Fertility Survey, 1979: Principal Report, Vol. 1. Khartoum: Department of Statistics.
1989 Population and Housing Census of the Sudan, 1983. Khartoum: Population Census Office, Ministry of Finance and Economic Planning.
1991 Sudan Demographic and Health Survey, 1989/1990. Khartoum: Department of Statistics, Ministry of Economic and National Planning; Columbia, Md.: Institute for Resource Development/Macro International, Inc.
Traoré, B., M.Konaté, and C.Stanton 1989 Enquête Démographique et de Santé au Mali, 1987. Bamako: Centre d’Etudes et de Recherches sur la Population pour le Développement, Institut du Sahel; Columbia, Md.: Institute for Resource Development/Westinghouse.
Trussell, J.T. 1975 A re-estimation of the multiplying factors for the Brass technique for determining childhood survivorship rates. Population Studies 29(1):97–108.
Uganda 1969 Report on the 1969 Population Census. Entebbe: Statistics Division, Ministry of Finance, Planning and Economic Development.
United Nations 1978 UN Demographic Yearbook 1978: Historical Supplement. New York: United Nations.
1983 Manual X. Indirect Techniques for Demographic Estimation. (ST/ESA/SER.A/ 81). New York: United Nations Department of International Economics and Social Affairs.
Verrière, L. No date Unpublished tabulations, Ph.D. thesis, University of Paris.
Working Group on Demographic Effects of Economic and Social Reversals 1993 Demographic Effects of Economic Reversals in Sub-Saharan Africa. Panel on the Population Dynamics of Sub-Saharan Africa, Committee on Population, National Research Council. Washington, D.C.: National Academy Press.
Working Group on the Effect of Child Survival and General Health Programs on Mortality 1993 The Effects of Health Programs on Child Mortality in Sub-Saharan Africa, D.C. Ewbank and J.N.Gribble, eds. Panel on the Population Dynamics of Sub-Saharan Africa, Committee on Population, National Research Council. Washington, D.C.: National Academy Press.
Working Group on Senegal 1993 Population Dynamics of Senegal. Panel on the Population Dynamics of Sub-Saharan Africa, Committee on Population, National Research Council. Washington, D.C.: National Academy Press (forthcoming).
Zimbabwe 1985a Advance Report of the Ten Percent Sample Report, 1982 Census. Harare: Central Statistical Office.
1985b Zimbabwe Reproductive Health Survey, 1984. Harare: National Family Planning Council; Columbia, Md.: Westinghouse Public Applied Systems.
1989 Zimbabwe Demographic and Health Survey, 1988. Harare: Central Statistical Office, Ministry of Finance, Economic Planning, Development; Columbia, Md.: Institute for Resource Development/Macro Systems, Inc.
1991 Intercensal Demographic Survey, Round 1, 1987. Preliminary report. Harare: Central Statistical Office.


