
Shifts in the Structure of Population and Deaths in Less Developed Regions
Larry Heligman, Nancy Chen, and Ozer Babakol
INTRODUCTION
During the process of the demographic transition, the age structure of a population changes toward one that is older. The age structure of deaths also changes toward one in which greater proportions of deaths take place at the oldest ages; this shift in the structure of deaths is a consequence of the greater share of population that has reached the older ages, and interrelatedly, the low probabilities of dying in all but the oldest age groups.
In general, countries exhibit relatively similar demographic structures at the beginnings and the ends of their demographic transitions, although the movement from here to there is neither smooth nor uniform. Many of the same factors underlie the mortality and fertility changes that comprise the demographic transition; nevertheless the two components move at different paces both within and among countries. In particular the transition process has differed in Africa, Asia, and Latin America. As the United Nations (1991:12) described:
During the period 1950–1955, the earliest data for which the United Nations provides demographic estimates on a regular basis, population growth rates ranged from 2.7 percent per year in Latin America to 2.2 percent in Africa and 1.9 percent in Asia. The high Latin American population growth rate is primarily explained by the region’s earlier start of mortality reduction. Life expectancy at birth in the major area was 10 years greater than
L.Heligman and N.Chen are with Population Division, United Nations, New York; O. Babakol is with Statistics Division, United Nations, New York. The views expressed in this paper are those of the authors and do not necessarily reflect the views of the United Nations.
in Africa and Asia and the crude death rate about 10 deaths per 1,000 lower. Africa and Asia exhibited similar life expectancies at birth and similar crude death rates but African women, on average, exhibited about 0.7 more births per woman than their Asian counterparts; the African population growth rate was hence higher.
A temporary convergence in growth rates occurred during the period 1965–1970. Africa, Asia and Latin America had similar growth rates, varying only from 2.4 to 2.6 percent per year. The population growth rate had risen sharply from the earlier period in Africa and Asia owing to falling mortality rates and little or moderate fertility change. The Latin American population growth rate held steady, as crude birth and death rates fell by similar amounts. Currently, population growth rates have diverged again. The African population growth rate has risen to 3 percent per year owing to falling mortality and little fertility change; whereas, Asian and Latin American population growth rates fell to 1.9 percent and 2.1 percent respectively.
This paper focuses on describing the changes in certain population characteristics projected to take place during the next quarter-century in Africa, developing regions of Asia and Oceania, and Latin America. To put these projected changes into a context, changes during the past 25 years are also described. In particular, we describe past and projected changes in (1) the number of people, growth, and age structures of population residing in the total, urban, and rural sectors of these major areas; and (2) life-table mortality patterns, numbers dying, and the age structure of deaths for these regions, including the potential implications of the AIDS pandemic in Africa. Because Africa exhibits very high mortality and there is greater uncertainty with respect to future trends, a special section is included on African mortality.
The analysis in this paper is carried out at the level of major area: that is, Africa, developing regions of Asia and Oceania (i.e., excluding Japan, Australia, and New Zealand), and Latin America. From here on, “Asia” is used to refer to the developing regions of Asia and Oceania. The tables present data for India and China separately because of their particularly large population sizes. Eight age groups are considered.
The major sources of data considered for this paper are the 1990 revisions of the official United Nations total, urban, and rural population projections for countries of the world (United Nations, 1991a-c). We have also made new and consistent estimates and projections of the age distribution of urban and rural populations, of age patterns of mortality, and of the potential number of deaths due to the AIDS epidemic in some African countries.
POPULATION GROWTH AND AGE STRUCTURES
In 1990, approximately 4.1 billion persons resided in the less developed regions (LDRs) of the world (Table 1). Of these, 73 percent reside in Asia,
TABLE 1 Total Population and Percentage of Population in Less Developed Regions, 1965, 1990, and 2015
|
|
1965 |
1990 |
2015 |
||||||
|
Region |
Both |
Male |
Female |
Both |
Male |
Female |
Both |
Male |
Female |
|
Population (thousands) |
|||||||||
|
Total |
2333400 |
1186835 |
1146565 |
4085638 |
2078534 |
2007104 |
6332461 |
3205134 |
3127327 |
|
Africa |
317056 |
157039 |
160017 |
642111 |
319381 |
322731 |
1301371 |
649645 |
651726 |
|
Latin America |
250843 |
125665 |
125178 |
448076 |
223523 |
224553 |
673172 |
334458 |
338714 |
|
Developing regions of Asia and Oceania |
1765501 |
904131 |
861370 |
2995451 |
1535630 |
1459820 |
4357918 |
2221031 |
2136887 |
|
China |
729191 |
375124 |
354067 |
1139060 |
586189 |
552871 |
1435683 |
732233 |
703450 |
|
India |
495196 |
255886 |
239270 |
853094 |
440888 |
412206 |
1304001 |
668729 |
635272 |
|
Distribution (%) |
|||||||||
|
Total |
100.0 |
100.0 |
100.0 |
100.0 |
100.0 |
100.0 |
100.0 |
100.0 |
100.0 |
|
Africa |
13.6 |
13.2 |
14.0 |
15.7 |
15.4 |
16.1 |
20.6 |
20.3 |
20.8 |
|
Latin America |
10.8 |
10.6 |
10.9 |
11.0 |
10.8 |
11.2 |
10.6 |
10.4 |
10.8 |
|
Developing Regions of Asia and Oceania |
75.7 |
76.2 |
75.1 |
73.3 |
73.9 |
72.7 |
68.8 |
69.3 |
68.3 |
|
China |
41.3 |
41.5 |
41.1 |
38.0 |
38.2 |
37.9 |
32.9 |
33.0 |
32.9 |
|
India |
28.0 |
28.3 |
27.8 |
28.5 |
28.7 |
28.2 |
29.9 |
30.1 |
29.7 |
16 percent in Africa, and 11 percent in Latin America. During the next 25 years, the population of the LDRs is projected to increase more than half, to 6.3 billion. The fastest growth is projected for Africa, which will increase more than twice, from 642 million persons to 1.3 billion, and will contain 20 percent of the total LDR population in 2015. Asia and Latin America are projected to increase 45 and 50 percent, respectively, from 3.0 billion to 4.4 billion in the case of Asia, and from 448 million to 673 million for Latin America.
As fertility and mortality have declined, the age structures of the populations of the LDRs have aged. For example, in 1965, 42 percent of the LDR population was under age 15, whereas 36 percent is now—an increase from 977 million in 1965 to 1.45 billion. Simultaneously, the population aged 15–64 has risen from 54 to 60 percent, and that aged 65 and over from 3.7 to 4.5 percent (Tables 2 and 3).
With projected fertility and mortality declines, these trends will continue during the next 25 years. By 2015, the population under age 15 will have declined to 29 percent, and the share in the age group 15–64 and age 65 and over will have risen to 65 and 6 percent, respectively. Nonetheless, even among those ages, which will exhibit declines in their relative shares, large absolute and percentage increases in numbers of people will occur between 1990 and 2015. The numbers of persons aged 0–4 and 5–14 are projected to rise by 15 and 33 percent, respectively (Table 4). The population in the reproductive ages (15–49) will rise by 60 percent, and those aged 50 and over will more than double in size. In fact, the population aged 80 and over in the LDRs is projected to rise by 170 percent, from 21.4 million to 58.1 million.
Child Population Aged 0–14
In 1990 there were about 544 million children under the age of 5 and 909 million aged 5–14. Representing respectively 13 and 22 percent of the LDR population, these preschool and early school-age children make up well over one-third of the LDR population. The 1990–2015 average annual growth rates for these age groups are projected to be only 1.38 and 0.54 percent annually, respectively. Nonetheless, significant absolute increments will occur because of the large population bases. Nearly 80 million children (15 percent increase) aged 0–4 and nearly 300 million children (33 percent increase) aged 5–14 will be added to the populations during the next 25 years.
Reproductive Age Population Aged 15–49
The less developed regions were home to 2.1 billion persons in 1990 in the reproductive ages of 15–49, representing slightly more than one-half of
TABLE 2 Total, Urban, and Rural Population and Percentage Urban in Less Developed Regions, 1965, 1990, and 2015
|
|
Total Population (thousands) |
Urban Population (thousands) |
Rural Population (thousands) |
Percentage Urban |
||||||||
|
Age |
1965 |
1990 |
2015 |
1965 |
1990 |
2015 |
1965 |
1990 |
2015 |
1965 |
1990 |
2015 |
|
Less Developed Regions |
||||||||||||
|
0–4 |
384656 |
543767 |
622983 |
82716 |
183713 |
318002 |
301941 |
360054 |
304981 |
21.5 |
33.8 |
51.0 |
|
5–14 |
592277 |
909253 |
206081 |
123438 |
302865 |
606637 |
468840 |
606389 |
599443 |
20.8 |
33.3 |
50.3 |
|
15–49 |
1067037 |
2081612 |
3328506 |
275082 |
834421 |
1926834 |
791956 |
1247191 |
1401672 |
26.0 |
40.1 |
57.9 |
|
15–24 |
407221 |
832733 |
1159758 |
105828 |
333756 |
671542 |
301393 |
498977 |
488216 |
25.8 |
40.1 |
57.9 |
|
50–64 |
202385 |
368987 |
787823 |
45988 |
131147 |
429546 |
156397 |
237840 |
358276 |
22.7 |
35.5 |
54.5 |
|
65+ |
87044 |
182018 |
387068 |
19054 |
62554 |
203437 |
67990 |
119464 |
183632 |
21.9 |
34.4 |
52.6 |
|
65–79 |
78963 |
160572 |
328989 |
|
||||||||
|
80+ |
8081 |
21446 |
58079 |
|||||||||
|
Total |
2333400 |
4085638 |
6332461 |
546278 |
1514701 |
3484458 |
1787122 |
2570938 |
2848002 |
23.4 |
37.1 |
55.0 |
|
Africa |
||||||||||||
|
0–4 |
57787 |
115751 |
189646 |
10505 |
35062 |
88626 |
47282 |
80690 |
101020 |
18.2 |
30.3 |
46.7 |
|
5–14 |
83439 |
173478 |
335541 |
15983 |
54384 |
158759 |
67455 |
119094 |
176782 |
19.2 |
31.3 |
47.3 |
|
15–49 |
143020 |
289335 |
633647 |
32444 |
108673 |
345836 |
110575 |
180660 |
287809 |
22.8 |
38.0 |
55.1 |
|
15–24 |
58183 |
122136 |
262387 |
13257 |
46389 |
144500 |
44925 |
75746 |
117887 |
22.7 |
37.6 |
54.6 |
|
50–64 |
23240 |
44200 |
98891 |
4609 |
13858 |
47448 |
18631 |
30342 |
51444 |
19.8 |
31.4 |
48.0 |
|
65+ |
9571 |
19346 |
43646 |
1789 |
5462 |
18708 |
7782 |
13884 |
24939 |
18.7 |
28.2 |
42.9 |
|
65–79 |
8713 |
17387 |
38512 |
|
||||||||
|
80+ |
858 |
1959 |
5134 |
|||||||||
|
Total |
317056 |
642111 |
1301371 |
65331 |
217440 |
659378 |
251725 |
424671 |
641993 |
20.6 |
33.9 |
50.7 |
|
|
Total Population (thousands) |
Urban Population (thousands) |
Rural Population (thousands) |
Percentage Urban |
||||||||
|
Age |
1965 |
1990 |
2015 |
1965 |
1990 |
2015 |
1965 |
1990 |
2015 |
1965 |
1990 |
2015 |
|
Latin America |
||||||||||||
|
0–4 |
42461 |
57413 |
64482 |
20480 |
38243 |
49816 |
21981 |
19170 |
14667 |
48.2 |
66.6 |
77.3 |
|
5–14 |
65596 |
103261 |
123914 |
32292 |
69917 |
96841 |
33305 |
33344 |
27073 |
49.2 |
67.7 |
78.2 |
|
15–49 |
112806 |
227589 |
353154 |
64219 |
168588 |
293052 |
48585 |
59000 |
60102 |
56.0 |
73.4 |
82.6 |
|
15–24 |
45086 |
89468 |
117125 |
25235 |
65639 |
96794 |
19851 |
23828 |
20330 |
56.9 |
74.1 |
83.0 |
|
50–64 |
20620 |
38380 |
86226 |
11633 |
28113 |
71235 |
8988 |
10268 |
14990 |
56.4 |
73.2 |
82.6 |
|
65+ |
9362 |
21434 |
45396 |
5191 |
15631 |
37383 |
4169 |
5802 |
8013 |
55.5 |
72.9 |
82.3 |
|
65–79 |
8313 |
18163 |
37559 |
|
||||||||
|
80+ |
1049 |
3271 |
7837 |
|||||||||
|
Total |
250843 |
448076 |
673172 |
133816 |
320493 |
548327 |
117028 |
127583 |
124845 |
53.3 |
71.5 |
81.5 |
|
Developing Regions of Asia and Oceania |
||||||||||||
|
0–4 |
284408 |
370603 |
368855 |
51731 |
110408 |
179560 |
232678 |
260194 |
189294 |
18.2 |
29.8 |
48.7 |
|
5–14 |
443242 |
632514 |
746626 |
75163 |
178564 |
351037 |
368080 |
453951 |
395588 |
17.0 |
28.2 |
47.0 |
|
15–49 |
811211 |
1564688 |
2341705 |
178419 |
557160 |
1287946 |
632796 |
1007531 |
1053761 |
22.0 |
35.6 |
55.0 |
|
15–24 |
303952 |
621129 |
780246 |
67336 |
221728 |
430248 |
236617 |
399403 |
349999 |
22.2 |
35.7 |
55.1 |
|
50–64 |
158525 |
286407 |
602706 |
29746 |
89176 |
310863 |
128778 |
197230 |
291842 |
18.8 |
31.1 |
51.6 |
|
65+ |
68111 |
141238 |
298026 |
12074 |
41461 |
147346 |
56039 |
99778 |
150680 |
17.7 |
29.4 |
49.4 |
|
65–79 |
61937 |
125022 |
252918 |
|
||||||||
|
80+ |
6174 |
16216 |
45108 |
|||||||||
|
Total |
1765501 |
2995451 |
4357918 |
347131 |
976768 |
2276753 |
1418369 |
2018684 |
2081164 |
19.7 |
32.6 |
52.2 |
|
China |
||||||||||||
|
0–4 |
112275 |
112328 |
89803 |
16711 |
30642 |
46712 |
95564 |
81686 |
43090 |
14.9 |
27.3 |
52.0 |
|
5–14 |
180719 |
189144 |
182401 |
26149 |
50359 |
93403 |
154569 |
138784 |
88997 |
14.5 |
26.6 |
51.2 |
|
15–49 |
333339 |
647436 |
773358 |
70803 |
237785 |
487116 |
262537 |
409651 |
286241 |
21.2 |
36.7 |
63.0 |
|
15–24 |
121005 |
252808 |
231621 |
24708 |
90891 |
142959 |
96298 |
161918 |
88661 |
20.4 |
36.0 |
61.7 |
|
50–64 |
70800 |
123868 |
258307 |
13566 |
41688 |
153491 |
57233 |
82180 |
104816 |
19.2 |
33.7 |
59.4 |
|
65+ |
32058 |
66284 |
131814 |
5480 |
20329 |
74008 |
26577 |
45955 |
57806 |
17.1 |
30.7 |
56.1 |
|
65–79 |
28944 |
58255 |
110305 |
|
||||||||
|
80+ |
3114 |
8029 |
21509 |
|||||||||
|
Total |
729191 |
1139060 |
1435683 |
132711 |
380803 |
854731 |
596480 |
758257 |
580952 |
18.2 |
33.4 |
59.5 |
|
India |
||||||||||||
|
0–4 |
78964 |
114364 |
117060 |
13504 |
28253 |
47335 |
65460 |
86110 |
69724 |
17.1 |
24.7 |
40.4 |
|
5–14 |
121137 |
196961 |
245969 |
20986 |
49247 |
100581 |
100150 |
147714 |
145388 |
17.3 |
25.0 |
40.9 |
|
15–49 |
233924 |
422266 |
698267 |
48625 |
124629 |
322369 |
185300 |
297638 |
375896 |
20.8 |
29.5 |
46.2 |
|
15–24 |
87825 |
165174 |
244012 |
19095 |
50674 |
116685 |
68730 |
114501 |
127327 |
21.7 |
30.7 |
47.8 |
|
50–64 |
43613 |
81099 |
159533 |
7262 |
19490 |
63145 |
36350 |
61609 |
96389 |
16.7 |
24.0 |
39.6 |
|
65+ |
17518 |
36403 |
83173 |
2707 |
8649 |
31250 |
14811 |
29753 |
51922 |
15.5 |
22.5 |
37.6 |
|
65–79 |
16267 |
34743 |
71861 |
|
||||||||
|
80+ |
1251 |
3660 |
11312 |
|||||||||
TABLE 3 Distribution of Total, Urban, and Rural Population in Less Developed Regions, 1965, 1990, and 2015
|
|
Total Population (%) |
Urban Population (%) |
Rural Population (%) |
||||||||||
|
Age |
1965 |
1990 |
2015 |
1965 |
1990 |
2015 |
1965 |
1990 |
2015 |
||||
|
Less Developed Regions |
|||||||||||||
|
0–4 |
16.48 |
13.31 |
9.84 |
15.14 |
12.13 |
9.13 |
16.90 |
14.00 |
10.71 |
||||
|
5–14 |
25.38 |
22.25 |
19.05 |
22.60 |
20.00 |
17.41 |
26.23 |
23.59 |
21.05 |
||||
|
15–49 |
45.73 |
50.95 |
52.56 |
50.36 |
55.09 |
55.30 |
44.31 |
48.51 |
49.22 |
||||
|
15–24 |
17.45 |
20.38 |
18.31 |
19.37 |
22.03 |
19.27 |
16.86 |
19.41 |
17.14 |
||||
|
50–64 |
8.67 |
9.03 |
12.44 |
8.42 |
8.66 |
12.33 |
8.75 |
9.25 |
12.58 |
||||
|
65+ |
3.73 |
4.46 |
6.11 |
3.49 |
4.13 |
5.84 |
3.80 |
4.65 |
6.45 |
||||
|
65–79 |
3.38 |
3.93 |
5.20 |
|
|||||||||
|
80+ |
0.35 |
0.52 |
0.92 |
||||||||||
|
Total |
100.00 |
100.00 |
100.00 |
100.00 |
100.00 |
100.00 |
100.00 |
100.00 |
100.00 |
||||
|
Africa |
|||||||||||||
|
0–4 |
18.23 |
18.03 |
14.57 |
16.08 |
16.12 |
13.44 |
18.78 |
19.00 |
15.74 |
||||
|
5–14 |
26.32 |
27.02 |
25.78 |
24.47 |
25.01 |
24.08 |
26.80 |
28.04 |
27.54 |
||||
|
15–49 |
45.11 |
45.06 |
48.69 |
49.66 |
49.98 |
52.45 |
43.93 |
42.54 |
44.83 |
||||
|
15–24 |
18.35 |
19.02 |
20.16 |
20.29 |
21.33 |
21.91 |
17.85 |
17.84 |
18.36 |
||||
|
50–64 |
7.33 |
6.88 |
7.60 |
7.05 |
6.37 |
7.20 |
7.40 |
7.14 |
8.01 |
||||
|
65+ |
3.02 |
3.01 |
3.35 |
2.74 |
2.51 |
2.84 |
3.09 |
3.27 |
3.88 |
||||
|
65–79 |
2.75 |
2.71 |
2.96 |
|
|||||||||
|
80+ |
0.27 |
0.31 |
0.39 |
||||||||||
|
Total |
100.00 |
100.00 |
100.00 |
100.00 |
100.00 |
100.00 |
100.00 |
100.00 |
100.00 |
||||
|
Latin America |
|||||||||||||
|
0–4 |
16.93 |
12.81 |
9.58 |
15.30 |
11.93 |
9.09 |
18.78 |
15.03 |
11.75 |
||||
|
5–14 |
26.15 |
23.05 |
18.41 |
24.13 |
21.82 |
17.66 |
28.46 |
26.13 |
21.69 |
||||
|
15–49 |
44.97 |
50.79 |
52.46 |
47.99 |
52.60 |
53.44 |
41.52 |
46.24 |
48.14 |
||||
|
15–24 |
17.97 |
19.97 |
17.40 |
18.86 |
20.48 |
17.65 |
16.96 |
18.68 |
16.28 |
||||
|
50–64 |
8.22 |
8.57 |
12.81 |
8.69 |
8.77 |
12.99 |
7.68 |
8.05 |
12.01 |
||||
|
65+ |
3.73 |
4.78 |
6.74 |
3.88 |
4.88 |
6.82 |
3.56 |
4.55 |
6.42 |
||||
|
65–79 |
3.31 |
4.05 |
5.58 |
|
|||||||||
|
80+ |
0.42 |
0.73 |
1.16 |
||||||||||
|
Total |
100.00 |
100.00 |
100.00 |
100.00 |
100.00 |
100.00 |
100.00 |
100.00 |
100.00 |
||||
|
Developing Regions of Asia and Oceania |
|||||||||||||
|
0–4 |
16.11 |
12.37 |
8.46 |
14.90 |
11.30 |
7.89 |
16.40 |
12.89 |
9.10 |
||||
|
5–14 |
25.11 |
21.12 |
17.13 |
21.65 |
18.28 |
15.42 |
25.95 |
22.49 |
19.01 |
||||
|
15–49 |
45.95 |
52.24 |
53.73 |
51.40 |
57.04 |
56.57 |
44.61 |
49.91 |
50.63 |
||||
|
15–24 |
17.22 |
20.74 |
17.90 |
19.40 |
22.70 |
18.90 |
16.68 |
19.79 |
16.82 |
||||
|
50–64 |
8.98 |
9.56 |
13.83 |
8.57 |
9.13 |
13.65 |
9.08 |
9.77 |
14.02 |
||||
|
65+ |
3.86 |
4.72 |
6.84 |
3.48 |
4.24 |
6.47 |
3.95 |
4.94 |
7.24 |
||||
|
65–79 |
3.51 |
4.17 |
5.80 |
|
|||||||||
|
80+ |
0.35 |
0.54 |
1.04 |
||||||||||
|
Total |
100.00 |
100.00 |
100.00 |
100.00 |
100.00 |
100.00 |
100.00 |
100.00 |
100.00 |
||||
|
China |
|||||||||||||
|
0–4 |
15.4 |
9.9 |
6.3 |
12.6 |
8.0 |
5.5 |
16.0 |
10.8 |
7.4 |
||||
|
5–14 |
24.8 |
16.6 |
12.7 |
19.7 |
13.2 |
10.9 |
25.9 |
18.3 |
15.3 |
||||
|
15–49 |
45.7 |
56.8 |
53.9 |
53.4 |
62.4 |
57.0 |
44.0 |
54.0 |
49.3 |
||||
|
15–24 |
16.6 |
22.2 |
16.1 |
18.6 |
23.9 |
16.7 |
16.1 |
21.4 |
15.3 |
||||
|
50–64 |
9.7 |
10.9 |
18.0 |
10.2 |
10.9 |
18.0 |
9.6 |
10.8 |
18.0 |
||||
|
65+ |
4.4 |
5.8 |
9.2 |
4.1 |
5.3 |
8.7 |
4.5 |
6.1 |
10.0 |
||||
|
65–79 |
4.0 |
5.1 |
7.7 |
|
|||||||||
|
80+ |
0.4 |
0.7 |
1.5 |
||||||||||
|
Total |
100.00 |
100.00 |
100.00 |
100.00 |
100.00 |
100.00 |
100.00 |
100.00 |
100.00 |
||||
|
|
Total Population (%) |
Urban Population (%) |
Rural Population (%) |
||||||||||
|
Age |
1965 |
1990 |
2015 |
1965 |
1990 |
2015 |
1965 |
1990 |
2015 |
||||
|
India |
|||||||||||||
|
0–4 |
16.0 |
13.4 |
9.0 |
14.5 |
12.3 |
8.4 |
16.3 |
13.8 |
9.4 |
||||
|
5–14 |
24.5 |
23.1 |
18.9 |
22.5 |
21.4 |
17.8 |
24.9 |
23.7 |
19.7 |
||||
|
15–49 |
47.2 |
49.5 |
53.6 |
52.2 |
54.1 |
57.1 |
46.1 |
47.8 |
50.8 |
||||
|
15–24 |
17.7 |
19.4 |
18.7 |
20.5 |
22.0 |
20.7 |
17.1 |
18.4 |
17.2 |
||||
|
50–64 |
8.8 |
9.5 |
12.2 |
7.8 |
8.5 |
11.2 |
9.0 |
9.9 |
13.0 |
||||
|
65+ |
3.5 |
4.5 |
6.4 |
2.9 |
3.8 |
5.5 |
3.7 |
4.8 |
7.0 |
||||
|
65–79 |
3.3 |
4.1 |
5.5 |
|
|||||||||
|
80+ |
0.2 |
0.4 |
0.9 |
||||||||||
|
Total |
100.00 |
100.00 |
100.00 |
100.00 |
100.00 |
100.00 |
100.00 |
100.00 |
100.00 |
||||
the total population (Table 5). Of these, 1.02 billion persons are women. About one of every four persons in the developing world is a woman of reproductive age.
The number of people in this age group doubled from 1.07 billion in 1965 to 2.09 billion in 1990 and is projected to increase another 60 percent during the next quarter century, adding 1.2 billion persons. By 2015, 53 percent of all persons in less developed regions will be between the ages of 15 and 49.
Currently about 40 percent of persons aged 15–49 are adolescents in the 15–24 age group. The number of adolescents will grow by about 40 percent by 2015; they are making up a declining share of the reproductive age populations of the developing world.
Postreproductive Age Population: Those 50 and Older
The most rapid population growth is projected to occur among the older population. The population aged 50 and over is projected to increase at an average annual rate of 3 percent per year, so that this population will double by 2015, from 551 million to 1.2 billion. As a result, this age group will rise from 13 to 19 percent of the total population (Table 3).
About 182 million people were age 65 and over in 1990, and the population of this group is also expected to double during the next 25 years. Particularly rapid growth, however, is projected among the old old (i.e., those aged 80 and over), whose number may increase at 4 percent per year, rising from 21 million to 58 million. Among persons aged 65 and over, those over age 80 rose from 9 percent in 1965 to 12 percent in 1990 and are projected to rise further to 15 percent in 2015.
Up to about age 65, one can safely make the generalization that “half the population are men and half are women.” However, due to greater longevity, women make up greater shares in older age groups. At ages 50–64, women comprised 50 percent of the population in 1990, but the female share rose to 53 percent for ages 65–79 and nearly 60 percent for ages 80 and over.
Urban-Rural Makeup
Thirty-seven percent of the LDR population lived in urban areas in 1990 (Table 2). Age differences in the percent urban population range from about one-third under age 15 and over age 50, to about 40 percent between ages 15 and 49. The result is a noticeably younger population in rural areas, where 38 percent is under age 15 compared to 32 percent in urban areas. The trade-off comes at ages 15–49:55 percent of the urban population is between these ages, compared to 49 percent of the rural population.
TABLE 4 Change (percent) and Average Annual Rate of Change of Population, by Age, in Less Developed Regions, 1965–1990 and 1990–2015
|
|
Total Population |
Urban Population |
Rural Population |
||||||||||||||
|
|
Change (%) |
Rate of Change |
Change (%) |
Rate of Change |
Change (%) |
Rate of Change |
|||||||||||
|
Age |
1965–1990 |
1990–2015 |
1965–1990 |
1990–2015 |
1965–1990 |
1990–2015 |
1965–1990 |
1990–2015 |
1965–1990 |
1990–2015 |
1965–1990 |
1990–2015 |
|||||
|
Less Developed Regions |
|||||||||||||||||
|
0–4 |
41.4 |
14.6 |
1.38 |
0.54 |
122.1 |
73.1 |
3.19 |
2.19 |
19.2 |
−15.3 |
0.70 |
−0.66 |
|||||
|
5–14 |
53.5 |
32.6 |
1.71 |
1.13 |
145.4 |
100.3 |
3.59 |
2.78 |
29.3 |
−1.1 |
1.03 |
−0.05 |
|||||
|
15–49 |
95.1 |
59.9 |
2.67 |
1.88 |
203.3 |
130.9 |
4.44 |
3.35 |
57.5 |
12.4 |
1.82 |
0.47 |
|||||
|
15–24 |
104.5 |
39.3 |
2.86 |
1.33 |
215.4 |
101.2 |
4.59 |
2.80 |
65.6 |
−2.2 |
2.02 |
−0.09 |
|||||
|
50–64 |
82.3 |
113.5 |
2.40 |
3.03 |
185.2 |
227.5 |
4.19 |
4.75 |
52.1 |
50.6 |
1.68 |
1.64 |
|||||
|
65+ |
109.1 |
112.7 |
2.95 |
3.02 |
228.3 |
225.2 |
4.76 |
4.72 |
75.7 |
53.7 |
2.25 |
1.72 |
|||||
|
65–79 |
103.4 |
104.9 |
2.84 |
2.87 |
|
||||||||||||
|
80+ |
165.4 |
170.8 |
3.90 |
3.99 |
|||||||||||||
|
Total |
75.1 |
55.0 |
2.24 |
1.75 |
177.3 |
130.0 |
4.08 |
3.33 |
43.9 |
10.8 |
1.45 |
0.41 |
|||||
|
Africa |
|||||||||||||||||
|
0–4 |
100.3 |
63.8 |
2.78 |
1.97 |
233.8 |
152.8 |
4.82 |
3.71 |
70.7 |
25.2 |
2.14 |
0.9 |
|||||
|
05–14 |
107.9 |
93.4 |
2.93 |
2.64 |
240.3 |
191.9 |
4.90 |
4.29 |
76.6 |
48.4 |
2.27 |
1.58 |
|||||
|
15–49 |
102.3 |
119.0 |
2.82 |
3.14 |
235.0 |
218.2 |
4.84 |
4.63 |
63.4 |
59.3 |
1.96 |
1.86 |
|||||
|
15–24 |
109.9 |
114.8 |
2.97 |
3.06 |
249.9 |
211.5 |
5.01 |
4.54 |
68.6 |
55.6 |
2.09 |
1.77 |
|||||
|
50–64 |
90.2 |
123.7 |
2.57 |
3.22 |
200.7 |
242.4 |
4.40 |
4.92 |
62.9 |
69.5 |
1.95 |
2.11 |
|||||
|
65+ |
102.1 |
125.6 |
2.81 |
3.25 |
205.3 |
242.5 |
4.46 |
4.92 |
78.4 |
79.6 |
2.32 |
2.34 |
|||||
|
65–79 |
99.6 |
121.5 |
2.76 |
3.18 |
|
||||||||||||
|
80+ |
128.3 |
162.1 |
3.30 |
3.85 |
|||||||||||||
|
Total |
102.5 |
102.7 |
2.82 |
2.83 |
232.8 |
203.2 |
4.81 |
4.44 |
68.7 |
51.2 |
2.09 |
1.65 |
|||||
|
Latin America |
|||||||||||||||||
|
0–4 |
35.2 |
12.3 |
1.21 |
0.46 |
86.7 |
30.3 |
2.5 |
1.06 |
−0.1 |
−23.5 |
−0.55 |
−1.07 |
|||||
|
5–14 |
57.4 |
20.0 |
1.81 |
0.73 |
116.5 |
38.5 |
3.09 |
1.30 |
0.1 |
−18.8 |
0.00 |
−0.83 |
|||||
|
15–49 |
101.8 |
55.2 |
2.81 |
1.76 |
162.5 |
73.8 |
3.86 |
2.21 |
21.4 |
1.9 |
0.78 |
0.07 |
|||||
|
15–24 |
98.4 |
30.9 |
2.74 |
1.08 |
160.1 |
47.5 |
3.82 |
1.55 |
20.0 |
−14.7 |
0.73 |
−0.64 |
|||||
|
50–64 |
86.1 |
124.7 |
2.49 |
3.24 |
141.7 |
153.4 |
3.53 |
3.72 |
14.2 |
46.0 |
0.53 |
1.51 |
|||||
|
65+ |
128.9 |
111.8 |
3.31 |
3.00 |
201.1 |
139.2 |
4.41 |
3.49 |
39.2 |
38.1 |
1.32 |
1.29 |
|||||
|
65–79 |
118.5 |
106.8 |
3.13 |
2.91 |
|
||||||||||||
|
80+ |
211.8 |
139.6 |
4.55 |
3.50 |
|||||||||||||
|
Total |
78.6 |
50.2 |
2.32 |
1.63 |
139.5 |
71.1 |
3.49 |
2.15 |
9.0 |
−2.1 |
0.35 |
−0.09 |
|||||
|
Developing Regions of Asia and Oceania |
|||||||||||||||||
|
0–4 |
30.3 |
−0.5 |
1.06 |
−0.02 |
113.4 |
62.6 |
3.03 |
1.95 |
11.8 |
−27.2 |
0.45 |
−1.27 |
|||||
|
5–14 |
42.7 |
18.0 |
1.42 |
0.66 |
137.6 |
96.6 |
3.46 |
2.70 |
23.3 |
−12.9 |
0.84 |
−0.55 |
|||||
|
15–49 |
92.9 |
49.7 |
2.63 |
1.61 |
212.3 |
131.2 |
4.55 |
3.35 |
59.2 |
4.6 |
1.86 |
0.18 |
|||||
|
15–24 |
104.4 |
25.6 |
2.86 |
0.91 |
229.3 |
94.0 |
4.77 |
2.65 |
68.8 |
−12.4 |
2.09 |
−0.53 |
|||||
|
50–64 |
80.7 |
110.4 |
2.37 |
2.98 |
199.8 |
248.6 |
4.39 |
4.99 |
53.2 |
48.0 |
1.71 |
1.57 |
|||||
|
65+ |
107.4 |
111.0 |
2.92 |
2.99 |
243.4 |
255.4 |
4.93 |
5.07 |
78.1 |
51.0 |
2.31 |
1.65 |
|||||
|
65–79 |
101.9 |
102.3 |
2.81 |
2.82 |
|
||||||||||||
|
80+ |
162.6 |
178.2 |
3.86 |
4.09 |
|||||||||||||
|
Total |
69.7 |
45.5 |
2.11 |
1.5 |
181.4 |
133.1 |
4.14 |
3.39 |
42.3 |
3.1 |
1.41 |
0.12 |
|||||
|
China |
|||||||||||||||||
|
0–4 |
0.0 |
−20.1 |
0.00 |
−0.90 |
83.4 |
52.4 |
2.43 |
1.69 |
−14.5 |
−47.2 |
−0.63 |
−2.56 |
|||||
|
5–14 |
4.7 |
−3.6 |
0.18 |
−0.15 |
92.6 |
85.5 |
2.62 |
2.47 |
−10.2 |
−35.9 |
−0.43 |
−1.78 |
|||||
|
15–49 |
94.2 |
19.4 |
2.66 |
0.71 |
235.8 |
104.9 |
4.85 |
2.87 |
56.0 |
−30.1 |
1.78 |
−1.43 |
|||||
|
15–24 |
108.9 |
−8.4 |
2.95 |
−0.35 |
267.9 |
57.3 |
5.21 |
1.81 |
68.1 |
−45.2 |
2.08 |
−2.41 |
|||||
|
50–64 |
75.0 |
108.5 |
2.24 |
2.94 |
207.3 |
268.2 |
4.49 |
5.21 |
43.6 |
27.5 |
1.45 |
0.97 |
|||||
|
65+ |
106.8 |
98.9 |
2.91 |
2.75 |
271.0 |
264.1 |
5.24 |
5.17 |
72.9 |
25.8 |
2.19 |
0.92 |
|||||
|
65–79 |
101.3 |
89.3 |
2.80 |
2.55 |
|
||||||||||||
|
80+ |
157.8 |
167.9 |
3.79 |
3.94 |
|||||||||||||
|
Total |
56.2 |
26.0 |
1.78 |
0.93 |
186.9 |
124.5 |
4.22 |
3.23 |
27.1 |
−23.4 |
0.96 |
−1.07 |
|||||
|
|
Total Population |
Urban Population |
Rural Population |
||||||||||||||
|
|
Change (%) |
Rate of Change |
Change (%) |
Rate of Change |
Change (%) |
Rate of Change |
|||||||||||
|
Age |
1965–1990 |
1990–2015 |
1965–1990 |
1990–2015 |
1965–1990 |
1990–2015 |
1965–1990 |
1990–2015 |
1965–1990 |
1990–2015 |
1965–1990 |
1990–2015 |
|||||
|
India |
|||||||||||||||||
|
0–4 |
44.8 |
2.4 |
1.48 |
0.09 |
109.2 |
67.5 |
2.95 |
2.06 |
31.5 |
−19.0 |
1.10 |
−0.84 |
|||||
|
5–14 |
62.6 |
24.9 |
1.94 |
0.89 |
134.7 |
104.2 |
3.41 |
2.86 |
47.5 |
−1.6 |
1.55 |
−0.06 |
|||||
|
15–49 |
80.5 |
65.4 |
2.36 |
2.01 |
156.3 |
158.7 |
3.76 |
3.80 |
60.6 |
26.3 |
1.90 |
0.93 |
|||||
|
15–24 |
88.1 |
47.7 |
2.53 |
1.56 |
165.4 |
130.3 |
3.90 |
3.34 |
66.6 |
11.2 |
2.04 |
0.42 |
|||||
|
50–64 |
86.0 |
96.7 |
2.48 |
2.71 |
168.4 |
224.0 |
3.95 |
4.70 |
69.5 |
56.5 |
2.11 |
1.79 |
|||||
|
65+ |
107.8 |
128.5 |
2.93 |
3.31 |
219.5 |
261.3 |
4.65 |
5.14 |
100.9 |
74.5 |
2.79 |
2.23 |
|||||
|
65–79 |
113.6 |
106.8 |
3.04 |
2.91 |
|
||||||||||||
|
80+ |
192.6 |
209.1 |
4.29 |
4.51 |
|||||||||||||
|
Total |
72.3 |
52.9 |
2.18 |
1.70 |
147.4 |
145.2 |
3.62 |
3.59 |
54.9 |
18.7 |
1.75 |
0.69 |
|||||
The share of population of ages 50–64 and 65 and over is about the same in the two areas: about 9 percent aged 50–64 and 6 percent aged 65+.
Both urban and rural areas contain more males than females; males exceed females by 6 percent in urban areas and 2 percent in rural areas. Urban areas exhibit higher sex ratios than do rural areas at every age group except 5–14 and 65 and over. Particularly, urban areas exhibit a large “male excess” at ages 15–49, where males exceed females by 9 percent. The female population significantly exceeds the number of males only at the older ages: for ages 65 and over, by 21 percent in urban areas and 11 percent in rural areas (Table 6).
The percentage of urban residents is projected to rise to 55 by 2015, with differentials among age groups ranging between only from 50 to 58 percent. The urban population is projected to grow by a factor of 2.3 between 1990 and 2015 (whereas the rural population will increase by only 11 percent). Urban growth is projected to be particularly rapid among those aged 50 and over (more than 4.7 percent per year) so that the share of urban population at these older ages will rise to 18 percent (from the current 13 percent). Nonetheless, the urban population will also be doubling at younger ages, from 485 million to 925 million at ages 0–14 and from 834 million to 1.9 billion at ages 15–49.
The rural population is also projected to age during the next 25 years, with a decline in the preschool population from 360 million to 305 million, and a stabilization in the size of the population aged 5–24 at about 1.1 billion persons. However, the number of persons aged 50 and over will probably increase by 50 percent to 542 million. As a result, the percentage of the rural population aged 0–14 is projected to decline from 38 to 32 percent. The percentage aged 50 and over will rise from 14 percent to 19 percent, similar to that in urban areas.
Africa is expected to add 659 million people during the next 25 years. Of these, 442 million (67 percent) will be in urban areas, and 217 million (33 percent) will be rural dwellers. Rural growth rates are projected to average only 1.65 percent per year during the next quarter of a century; urban growth is projected to average 4.44 percent (Table 4).
Africa’s age distribution in urban areas is characterized by smaller population shares under age 15 than their rural counterparts. Among urban populations, 50 percent is between ages 15 and 49, 41 percent under age 15, and 9 percent age 50 and over; among rural populations, the corresponding shares are 43 percent age 15–49, 47 percent under age 15, and 10 percent age 50 and over. Both areas will exhibit rises during the next 25 years in population share aged 15–49 (from 50 to 52 percent in urban areas, and 43 to 45 percent in rural areas). Of similar size, but in the opposite direction, declines of relative share are expected among the preschool and child population: from 41 to 38 percent in urban areas, and 47 to 43 percent in rural areas.
TABLE 5 Total Population by Sex and Age in Less Developed Regions, 1965, 1990, and 2015
|
|
1965 |
1990 |
2015 |
||||||
|
Age |
Males |
Females |
Sex Ratio |
Males |
Females |
Sex Ratio |
Males |
Females |
Sex Ratio |
|
Less Developed Regions |
|||||||||
|
0–4 |
196253 |
188403 |
1.04 |
277886 |
265881 |
1.05 |
317586 |
305397 |
1.04 |
|
5–14 |
302683 |
289594 |
1.05 |
465445 |
443808 |
1.05 |
614883 |
591198 |
1.04 |
|
15–49 |
546706 |
520331 |
1.05 |
1064569 |
1017043 |
1.05 |
1697318 |
1631188 |
1.04 |
|
15–24 |
208513 |
198708 |
1.05 |
426861 |
405872 |
1.05 |
591621 |
568137 |
1.04 |
|
50–64 |
100687 |
101698 |
0.99 |
185718 |
183269 |
1.01 |
395399 |
392424 |
1.01 |
|
65+ |
40505 |
46539 |
0.87 |
84916 |
97102 |
0.87 |
179949 |
207119 |
0.87 |
|
65–79 |
37141 |
41822 |
0.89 |
76159 |
84413 |
0.90 |
155806 |
173183 |
0.90 |
|
80+ |
3364 |
4717 |
0.71 |
8757 |
12689 |
0.69 |
24143 |
33936 |
0.71 |
|
Total |
1186835 |
1146565 |
1.04 |
2078534 |
2007104 |
1.04 |
3205134 |
3127327 |
1.02 |
|
Africa |
|||||||||
|
0–4 |
29067 |
28720 |
1.01 |
58341 |
57410 |
1.02 |
95808 |
93838 |
1.02 |
|
5–14 |
41873 |
41566 |
1.01 |
87369 |
86109 |
1.01 |
169123 |
166418 |
1.02 |
|
15–49 |
70762 |
72258 |
0.98 |
143995 |
145340 |
0.99 |
317056 |
316591 |
1.00 |
|
15–24 |
28948 |
29235 |
0.99 |
61304 |
60832 |
1.01 |
131858 |
130529 |
1.01 |
|
50–64 |
11108 |
12132 |
0.92 |
21034 |
23165 |
0.91 |
48043 |
50848 |
0.94 |
|
65+ |
4230 |
5341 |
0.79 |
8640 |
10706 |
0.81 |
19614 |
24032 |
0.82 |
|
65–79 |
3885 |
4828 |
0.80 |
7854 |
9533 |
0.82 |
17520 |
20992 |
0.83 |
|
80+ |
345 |
513 |
0.67 |
786 |
1173 |
0.67 |
2094 |
3040 |
0.69 |
|
Total |
157039 |
160017 |
0.98 |
319381 |
322731 |
0.99 |
649645 |
651726 |
1.00 |
|
Latin America |
|||||||||
|
0–4 |
21531 |
20930 |
1.03 |
29158 |
28255 |
1.03 |
32824 |
31658 |
1.04 |
|
5–14 |
33150 |
32446 |
1.02 |
52266 |
50995 |
1.02 |
62933 |
60981 |
1.03 |
|
15–49 |
56479 |
56327 |
1.00 |
113712 |
113877 |
1.00 |
177020 |
176134 |
1.01 |
|
15–24 |
22705 |
22381 |
1.01 |
45082 |
44386 |
1.02 |
59265 |
57860 |
1.02 |
|
50–64 |
10124 |
10496 |
0.96 |
18619 |
19761 |
0.94 |
41607 |
44619 |
0.93 |
|
65+ |
4381 |
4981 |
0.88 |
9768 |
11666 |
0.84 |
20075 |
25321 |
0.79 |
|
65–79 |
3926 |
4387 |
0.89 |
8379 |
9784 |
0.86 |
16956 |
20603 |
0.82 |
|
80+ |
455 |
594 |
0.77 |
1389 |
1882 |
0.74 |
3119 |
4718 |
0.66 |
|
Total |
125665 |
125178 |
1.00 |
223523 |
224553 |
1.00 |
334458 |
338714 |
0.99 |
|
Developing Regions of Asia and Oceania |
|||||||||
|
0–4 |
145655 |
138753 |
1.05 |
190387 |
180216 |
1.06 |
188954 |
179901 |
1.05 |
|
5–14 |
227660 |
215582 |
1.06 |
325810 |
306704 |
1.06 |
382827 |
363799 |
1.05 |
|
15–49 |
419465 |
391746 |
1.07 |
806862 |
757826 |
1.06 |
1203242 |
1138463 |
1.06 |
|
15–24 |
156860 |
147092 |
1.07 |
320475 |
300654 |
1.07 |
400498 |
379748 |
1.05 |
|
50–64 |
79455 |
79070 |
1.00 |
146065 |
140343 |
1.04 |
305749 |
296957 |
1.03 |
|
65+ |
31894 |
36217 |
0.88 |
66508 |
74730 |
0.89 |
140260 |
157766 |
0.89 |
|
65–79 |
29330 |
32607 |
0.90 |
59926 |
65096 |
0.92 |
121330 |
131588 |
0.92 |
|
80+ |
2564 |
3610 |
0.71 |
6582 |
9634 |
0.68 |
18930 |
26178 |
0.72 |
|
Total |
904131 |
861370 |
1.05 |
1535630 |
1459820 |
1.05 |
2221031 |
2136887 |
1.04 |
|
China |
|||||||||
|
0–4 |
57709 |
54566 |
1.06 |
57946 |
54382 |
1.07 |
46162 |
43641 |
1.06 |
|
5–14 |
92791 |
87928 |
1.06 |
97651 |
91493 |
1.07 |
93781 |
88620 |
1.06 |
|
15–49 |
175922 |
157417 |
1.12 |
335427 |
312009 |
1.08 |
397921 |
375437 |
1.06 |
|
15–24 |
63881 |
57124 |
1.12 |
130227 |
122581 |
1.06 |
119162 |
112459 |
1.06 |
|
50–64 |
34340 |
36460 |
0.94 |
64827 |
59041 |
1.10 |
131878 |
126429 |
1.04 |
|
65+ |
14361 |
17697 |
0.81 |
30338 |
35946 |
0.84 |
62490 |
69324 |
0.90 |
|
65–79 |
13137 |
15807 |
0.83 |
27465 |
30790 |
0.89 |
53794 |
56511 |
0.95 |
|
80+ |
1224 |
1890 |
0.65 |
2873 |
5156 |
0.56 |
8696 |
12813 |
0.68 |
|
Total |
375124 |
354067 |
1.06 |
586189 |
552871 |
1.06 |
732233 |
703450 |
1.04 |
|
|
1965 |
1990 |
2015 |
||||||
|
Age |
Males |
Females |
Sex Ratio |
Males |
Females |
Sex Ratio |
Males |
Females |
Sex Ratio |
|
India |
|||||||||
|
0–4 |
40744 |
38220 |
1.07 |
58837 |
55527 |
1.06 |
59916 |
57144 |
1.05 |
|
5–14 |
63142 |
57995 |
1.09 |
101988 |
94973 |
1.07 |
126199 |
119700 |
1.05 |
|
15–49 |
120378 |
113546 |
1.06 |
219947 |
202319 |
1.09 |
360868 |
337399 |
1.07 |
|
15–24 |
44902 |
42923 |
1.05 |
86178 |
78996 |
1.09 |
125559 |
118453 |
1.06 |
|
50–64 |
22782 |
20831 |
1.09 |
41007 |
40092 |
1.02 |
82133 |
77400 |
1.06 |
|
65+ |
8840 |
8678 |
1.02 |
19110 |
19293 |
0.99 |
39613 |
43560 |
0.91 |
|
65–79 |
8304 |
7963 |
1.04 |
17323 |
17420 |
0.99 |
34548 |
37313 |
0.93 |
|
80+ |
536 |
715 |
0.75 |
1787 |
1873 |
0.95 |
5065 |
6247 |
0.81 |
|
Total |
255886 |
239270 |
1.07 |
440888 |
412206 |
1.07 |
668729 |
635272 |
1.05 |
TABLE 6 Age-Specific Sex Ratios of Urban and Rural Populations of Less Developed Regions, 1965, 1990, and 2015
|
|
1965 |
1990 |
2015 |
|||
|
Age |
Urban |
Rural |
Urban |
Rural |
Urban |
Rural |
|
Less Developed Regions |
||||||
|
0–4 |
1.05 |
1.04 |
1.05 |
1.04 |
1.05 |
1.03 |
|
5–14 |
1.03 |
1.05 |
1.03 |
1.06 |
1.03 |
1.05 |
|
15–49 |
1.09 |
1.04 |
1.09 |
1.02 |
1.09 |
0.98 |
|
15–24 |
1.07 |
1.04 |
1.08 |
1.04 |
1.07 |
1.00 |
|
50–64 |
1.01 |
0.98 |
1.04 |
1.00 |
1.04 |
0.97 |
|
65+ |
0.81 |
0.89 |
0.82 |
0.90 |
0.84 |
0.90 |
|
Total |
1.05 |
1.03 |
1.06 |
1.02 |
1.05 |
1.00 |
|
Africa |
||||||
|
0–4 |
1.03 |
1.01 |
1.03 |
1.01 |
1.03 |
1.02 |
|
5–14 |
0.98 |
1.01 |
0.98 |
1.03 |
0.98 |
1.05 |
|
15–49 |
1.10 |
0.95 |
1.11 |
0.92 |
1.10 |
0.90 |
|
15–24 |
1.06 |
0.97 |
1.08 |
0.96 |
1.07 |
0.95 |
|
50–64 |
1.01 |
0.89 |
0.98 |
0.88 |
1.01 |
0.89 |
|
65+ |
0.79 |
0.79 |
0.78 |
0.82 |
0.78 |
0.84 |
|
Total |
1.04 |
0.97 |
1.05 |
0.96 |
1.04 |
0.95 |
|
Latin America |
||||||
|
0–4 |
1.05 |
1.01 |
1.04 |
1.01 |
1.04 |
1.02 |
|
5–14 |
1.00 |
1.04 |
1.01 |
1.06 |
1.02 |
1.07 |
|
15–49 |
0.94 |
1.09 |
0.96 |
1.11 |
0.98 |
1.13 |
|
15–24 |
0.95 |
1.10 |
0.98 |
1.13 |
1.00 |
1.16 |
|
50–64 |
0.87 |
1.09 |
0.89 |
1.12 |
0.90 |
1.13 |
|
65+ |
0.75 |
1.06 |
0.75 |
1.11 |
0.74 |
1.08 |
|
Total |
0.96 |
1.06 |
0.96 |
1.08 |
0.96 |
1.10 |
|
Developing Regions of Asia and Oceania |
||||||
|
0–4 |
1.06 |
1.05 |
1.06 |
1.05 |
1.06 |
1.05 |
|
5–14 |
1.06 |
1.06 |
1.06 |
1.06 |
1.05 |
1.05 |
|
15–49 |
1.14 |
1.05 |
1.13 |
1.03 |
1.11 |
1.00 |
|
15–24 |
1.11 |
1.05 |
1.10 |
1.05 |
1.09 |
1.01 |
|
50–64 |
1.07 |
0.99 |
1.11 |
1.01 |
1.08 |
0.98 |
|
65+ |
0.83 |
0.89 |
0.86 |
0.90 |
0.87 |
0.91 |
|
Total |
1.09 |
1.04 |
1.09 |
1.03 |
1.07 |
1.00 |
|
China |
||||||
|
0–4 |
1.06 |
1.06 |
1.06 |
1.07 |
1.06 |
1.06 |
|
5–14 |
1.06 |
1.05 |
1.07 |
1.06 |
1.06 |
1.05 |
|
15–49 |
1.17 |
1.10 |
1.09 |
1.05 |
1.08 |
1.02 |
|
15–24 |
1.16 |
1.11 |
1.08 |
1.05 |
1.08 |
1.03 |
|
50–64 |
1.05 |
0.92 |
1.10 |
1.05 |
1.10 |
0.97 |
|
65+ |
0.82 |
0.81 |
0.77 |
0.84 |
0.91 |
0.90 |
|
Total |
1.11 |
1.05 |
1.07 |
1.04 |
1.07 |
1.00 |
|
|
1965 |
1990 |
2015 |
|||
|
Age |
Urban |
Rural |
Urban |
Rural |
Urban |
Rural |
|
India |
||||||
|
0–4 |
1.07 |
1.06 |
1.06 |
1.06 |
1.05 |
1.05 |
|
5–14 |
1.08 |
1.09 |
1.07 |
1.08 |
1.05 |
1.06 |
|
15–49 |
1.19 |
1.03 |
1.21 |
1.04 |
1.16 |
1.00 |
|
15–24 |
1.13 |
1.02 |
1.17 |
1.06 |
1.12 |
1.01 |
|
50–64 |
1.19 |
1.08 |
1.10 |
1.00 |
1.13 |
1.02 |
|
65+ |
0.97 |
1.03 |
0.95 |
1.00 |
0.88 |
0.93 |
|
Total |
1.14 |
1.05 |
1.14 |
1.05 |
1.11 |
1.01 |
During the past 25 years, the Latin American urban population increased at an average annual rate of 3.5 percent and the rural population less than 0.4 percent. During the next 25 years, the urban population is projected to increase at 2.2 percent, and the rural population is projected to decline slightly in size.
The population residing in urban areas in Latin American is therefore projected to rise from 71.5 percent in 1990 to 81.5 percent in 2015 (Table 2). The percentage urban is notably higher for ages 15 and over than for younger ages both in 1990 (73 and 68 percent, respectively) and, as projected, in 2015 (83 and 78 percent, respectively). The urban population is hence older than the rural population. In 1990, 34 percent of the urban population was under age 15, compared to 41 percent of the rural population. Correspondingly, 53 percent of the urban population and 46 percent of the rural population are between ages 15 and 49.
Asia is much less urban than Latin America; only 33 percent of Asians resided in urban areas in 1990. However, the urban population is projected to grow by 3.4 percent per year during the next 25 years (compared to 0.1 percent for rural areas) and the urban population will increase to 52 percent of the total.
The share of population aged 15–49 is more pronounced in Asia and Oceania than in Latin America, for both urban and rural areas. In urban areas, 57 percent is currently age 15–49 (compared to 53 percent in Latin America); in rural areas, 50 percent is age 15–49 (compared to 46 percent in Latin America).
DISTRIBUTION OF DEATHS BY SEX AND AGE
Africa, Latin America, and Asia vary not only according to mortality level but also according to the age and sex patterns of mortality. Different
mortality patterns, along with variant sex and age patterns of population at risk, lead to very different distributions of deaths across regions.
The effect of mortality level can be indicated with just a few figures. Although 16 percent of the LDR population in 1990 was African, the continent contributed 23 percent of deaths during 1985–1990 (Table 7). Developing Asia and Oceania comprise 73 percent of the LDR population, but 69 percent of deaths. Latin America makes up the remaining 11 percent of population and 8 percent of deaths.
Different age and sex patterns lead to other interesting variations. For example, during 1985–1990, 48 percent of deaths in Africa occurred to preschool children (Table 8). For developing Asia and Oceania the corresponding percentage is 32, and for Latin America, 26 percent deaths occur under age 5. At the other end of the age spectrum, the share of deaths to those 65 and over varies from 15 percent in Africa, to 33 percent in developing Asia, to 36 percent in Latin America. The male to female sex ratio of total deaths is 1.10 for Africa and 1.09 for Asia and Oceania, but 1.26 for Latin America. Sex ratios are less than unity among the elderly in Africa and Latin America, but slightly more than unity in developing Asia. (Detailed tables on deaths by sex are not included here, in the interest of space, but the most salient gender differences are discussed in the text.)
In general, the age distribution of deaths is youngest in Africa and oldest in Latin America. As a result, although 23 percent of total deaths in the LDRs are among Africans, 31 percent of preschool deaths and 38 percent of early-school-age deaths are. Correspondingly, only 12 percent of LDR deaths at ages 65 and over are African. Latin America contributes 8 percent toward LDR deaths, 6 percent of deaths at ages 0–4, 5 percent of 5-to 14-year-old deaths, and 10 percent of deaths among those 65 and over. Asia and Oceania comprise 69 percent of total deaths in LDRs, 62 percent of preschool deaths, 57 percent of 5- to 14-year-old deaths, and 78 percent of deaths at age 65 and older.
Age Patterns of Mortality
Figure 1 and Table 9 present age- and sex-specific mortality rates (nmx) for each of the three major areas for the period 1985–1990. These age-specific mortality rates are calculated from aggregations of country-specific population and deaths. They are aggregations of heterogeneous experiences and do not necessarily represent a typical country experience.
The country-specific life tables on which the data in Figure 1 and Table 9 are from diverse sources. Some (particularly for Africa) are based on model life tables because of the absence of reliable data. Others are based on the application of indirect techniques to census or survey tabulations such as child survival and parental orphanhood. As many as possible are
TABLE 7 Total Deaths and Percentage of Deaths in Less Developed Regions, 1960–1965, 1985–1990, and 2010–2015
|
|
1960–1965 |
1985–1990 |
2010–2015 |
||||||
|
Region |
Both |
Male |
Female |
Both |
Male |
Female |
Both |
Male |
Female |
|
Deaths (thousands) |
|||||||||
|
Total |
201578 |
103746 |
97832 |
189991 |
99604 |
90387 |
219494 |
118361 |
101133 |
|
Africa |
34160 |
17758 |
16402 |
43970 |
23005 |
20965 |
52194 |
27648 |
24546 |
|
Latin America |
14245 |
7673 |
6572 |
15752 |
8782 |
6971 |
21187 |
11758 |
9429 |
|
Developing Regions of Asia and Oceania |
153173 |
78315 |
74858 |
130269 |
67818 |
62452 |
146113 |
78954 |
67159 |
|
China |
59281 |
30779 |
28502 |
36707 |
19397 |
17310 |
50421 |
27710 |
22711 |
|
India |
45530 |
22710 |
22821 |
45804 |
23481 |
22323 |
44255 |
23846 |
20409 |
|
Distribution (%) |
|||||||||
|
Total |
100.0 |
100.0 |
100.0 |
100.0 |
100.0 |
100.0 |
100.0 |
100.0 |
100.0 |
|
Africa |
17.0 |
17.1 |
16.8 |
23.1 |
23.1 |
23.2 |
23.8 |
23.4 |
24.3 |
|
Latin America |
7.1 |
7.4 |
6.7 |
8.3 |
8.8 |
7.7 |
9.6 |
9.9 |
9.3 |
|
Developing Regions of Asia and Oceania |
76.0 |
75.5 |
76.5 |
68.6 |
68.1 |
69.1 |
66.6 |
66.7 |
66.4 |
|
China |
38.7 |
39.3 |
38.1 |
28.2 |
28.6 |
27.7 |
34.5 |
35.1 |
33.8 |
|
India |
29.7 |
30.0 |
30.5 |
35.2 |
34.6 |
35.7 |
30.3 |
30.2 |
30.4 |
TABLE 8 Distribution of Deaths by Age in Less Developed Regions, 1960–1965, 1985–1990, and 2010–2015
|
|
1960–1965 |
1985–1990 |
2010–2015 |
|||
|
Age |
Number |
Percentage |
Number |
Percentage |
Number |
Percentage |
|
Less Developed Regions |
||||||
|
0–4 |
91611 |
45.45 |
65782 |
34.62 |
40872 |
18.62 |
|
5–14 |
19658 |
9.75 |
14040 |
7.39 |
9366 |
4.27 |
|
15–24 |
9251 |
4.59 |
8139 |
4.28 |
6669 |
3.04 |
|
15–49 |
35341 |
17.53 |
30487 |
16.05 |
30975 |
14.11 |
|
50–64 |
21180 |
10.51 |
24946 |
13.13 |
35390 |
16.12 |
|
65–74 |
17870 |
8.86 |
24847 |
13.08 |
38274 |
17.44 |
|
65+ |
33788 |
16.76 |
54737 |
28.81 |
102892 |
46.88 |
|
75+ |
15918 |
7.90 |
29890 |
15.73 |
64618 |
29.44 |
|
Total |
201578 |
100.00 |
189991 |
100.00 |
219494 |
100.00 |
|
Africa |
||||||
|
0–4 |
17291 |
50.62 |
20599 |
46.85 |
18076 |
34.63 |
|
5–14 |
4316 |
12.63 |
5306 |
12.07 |
5255 |
10.07 |
|
15–24 |
1770 |
5.18 |
2383 |
5.42 |
3204 |
6.14 |
|
15–49 |
5934 |
17.37 |
7682 |
17.47 |
10513 |
20.14 |
|
50–64 |
2723 |
7.97 |
3787 |
8.61 |
5867 |
11.24 |
|
65–74 |
2086 |
6.11 |
3218 |
7.32 |
5407 |
10.36 |
|
65+ |
3897 |
11.41 |
6595 |
15.00 |
12483 |
23.92 |
|
75+ |
1811 |
5.30 |
3377 |
7.68 |
7076 |
13.56 |
|
Total |
34160 |
100.00 |
43970 |
100.00 |
52194 |
100.00 |
|
Latin America |
||||||
|
0–4 |
6367 |
44.70 |
4151 |
26.35 |
2515 |
11.87 |
|
5–14 |
1097 |
7.70 |
752 |
4.77 |
490 |
2.31 |
|
15–24 |
573 |
4.02 |
687 |
4.36 |
537 |
2.53 |
|
15–49 |
2409 |
16.91 |
2980 |
18.91 |
3403 |
16.06 |
|
50–64 |
1634 |
11.47 |
2266 |
14.38 |
3859 |
18.22 |
|
65–74 |
1314 |
9.22 |
2180 |
13.84 |
3728 |
17.60 |
|
65+ |
2738 |
19.22 |
5605 |
35.58 |
10920 |
51.54 |
|
75+ |
1425 |
10.00 |
3425 |
21.74 |
7192 |
33.95 |
|
Total |
14245 |
100.00 |
15752 |
100.00 |
21187 |
100.00 |
|
Developing Regions of Asia and Oceania |
||||||
|
0–4 |
67953 |
44.36 |
41032 |
31.50 |
20282 |
13.88 |
|
5–14 |
14246 |
9.30 |
7982 |
6.13 |
3621 |
2.48 |
|
15–24 |
6928 |
4.51 |
5070 |
3.89 |
2928 |
2.00 |
|
15–49 |
26998 |
17.63 |
19825 |
15.22 |
17059 |
11.68 |
|
50–64 |
16824 |
10.98 |
18893 |
14.50 |
25663 |
17.56 |
|
65–74 |
14770 |
9.45 |
19449 |
14.93 |
29139 |
19.94 |
|
65+ |
27152 |
17.73 |
42537 |
32.65 |
79488 |
54.40 |
|
75+ |
12683 |
8.28 |
23088 |
17.72 |
50349 |
34.46 |
|
Total |
153173 |
100.00 |
130269 |
100.00 |
146113 |
100.00 |
|
|
1960–1965 |
1985–1990 |
2010–2015 |
|||
|
Age |
Number |
Percentage |
Number |
Percentage |
Number |
Percentage |
|
China |
||||||
|
0–4 |
22593 |
38.1 |
4750 |
12.9 |
1439 |
2.9 |
|
5–14 |
4909 |
8.3 |
1011 |
2.8 |
337 |
0.7 |
|
15–24 |
2600 |
4.4 |
1159 |
3.2 |
482 |
1.0 |
|
15–49 |
11057 |
18.7 |
5009 |
13.6 |
3995 |
7.9 |
|
50–64 |
7526 |
12.7 |
7136 |
19.4 |
9788 |
19.4 |
|
65–74 |
6915 |
11.7 |
8322 |
22.7 |
12023 |
23.9 |
|
65+ |
13197 |
22.3 |
18801 |
51.2 |
34862 |
69.1 |
|
75+ |
6282 |
10.6 |
10479 |
28.6 |
22839 |
45.3 |
|
Total |
59281 |
100.00 |
36707 |
100.0 |
50421 |
100.0 |
|
India |
||||||
|
0–4 |
22316 |
49.0 |
17607 |
38.4 |
8644 |
19.5 |
|
5–14 |
4584 |
10.1 |
3241 |
7.1 |
1222 |
2.8 |
|
15–24 |
2154 |
4.7 |
1912 |
4.2 |
982 |
2.2 |
|
15–49 |
7655 |
16.8 |
7174 |
15.7 |
5399 |
12.2 |
|
50–64 |
4267 |
9.4 |
5601 |
12.2 |
6742 |
15.2 |
|
65–74 |
3709 |
8.2 |
5772 |
12.6 |
8156 |
18.4 |
|
65+ |
6707 |
14.7 |
12182 |
26.6 |
22247 |
50.3 |
|
75+ |
2998 |
6.6 |
6411 |
14.0 |
14091 |
31.8 |
|
Total |
45530 |
100.0 |
45804 |
100.0 |
44255 |
100.0 |
based on recorded deaths and population by age and sex (from censuses, surveys, or civil registration), adjusted when necessary for incompleteness.
Life expectancy at birth for the less developed regions averaged 61.4 years for this period (60.1 years for males and 62.8 for females). Africa exhibits the lowest life expectancy, 52 years, compared to 66.7 years for Latin America and 62.3 years for Asia. Latin America’s life expectancy exceeds that of Asia by 4.4 years, but male-female differences are large. Among males, Latin American life expectancy exceeds that of Asia by 2.6 years, but among females the difference is 6.3 years. For both males and females, African death rates are the highest among the three areas at all ages.
Female death rates for Latin America are lower than those for Asia at all ages, but differences are small after age 40 and are negligible between ages 40 and 60. Latin American and Asian death rates exhibit a crossover among males at age 55–60. Latin American male death rates are lower prior to age 15 and again after age 55, but are much higher between ages 15 and 55.
Dechter and Preston (1992) have illustrated that the low Latin Ameri-
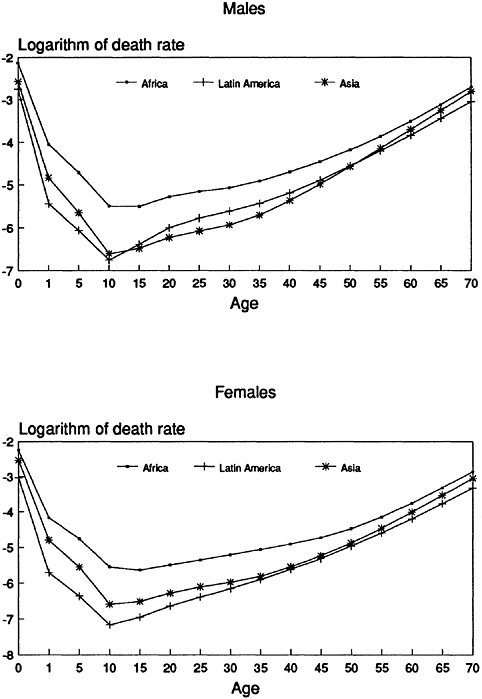
TABLE 9 Age-Specific Mortality Rates (nmx) in Less Developed Regions, 1985–1990
|
Age |
Less Developed Regions |
Africa |
Latin America |
Asia |
|
Males |
|
|||
|
0–1 |
.08392 |
.11822 |
.06370 |
.07606 |
|
1–4 |
.00941 |
.01730 |
.00435 |
.00794 |
|
5–9 |
.00440 |
.00894 |
.00226 |
.00352 |
|
10–14 |
.00178 |
.00410 |
.00116 |
.00135 |
|
15–19 |
.00192 |
.00408 |
.00168 |
.00153 |
|
20–24 |
.00246 |
.00512 |
.00249 |
.00198 |
|
25–29 |
.00286 |
.00578 |
.00311 |
.00230 |
|
30–34 |
.00324 |
.00629 |
.00365 |
.00266 |
|
35–39 |
.00395 |
.00735 |
.00437 |
.00333 |
|
40–44 |
.00533 |
.00908 |
.00558 |
.00467 |
|
45–49 |
.00752 |
.01157 |
.00751 |
.00686 |
|
50–54 |
.01087 |
.01523 |
.01043 |
.01028 |
|
55–59 |
.01625 |
.02088 |
.01486 |
.01578 |
|
60–64 |
.02480 |
.02976 |
.02152 |
.02455 |
|
65–69 |
.03824 |
.04413 |
.03175 |
.03831 |
|
70–74 |
.05954 |
.06734 |
.04737 |
.06024 |
|
Life expectancy at birth |
60.1 |
50.3 |
64.0 |
61.4 |
|
Females |
|
|||
|
0–1 |
.08195 |
.10548 |
.04856 |
.07931 |
|
1–4 |
.00919 |
.01544 |
.00331 |
.00827 |
|
5–9 |
.00455 |
.00860 |
.00172 |
.00388 |
|
10–14 |
.00174 |
.00390 |
.00077 |
.00137 |
|
15–19 |
.00173 |
.00355 |
.00095 |
.00147 |
|
20–24 |
.00213 |
.00412 |
.00130 |
.00187 |
|
25–29 |
.00252 |
.00477 |
.00167 |
.00222 |
|
30–34 |
.00289 |
.00547 |
.00212 |
.00253 |
|
35–39 |
.00343 |
.00637 |
.00274 |
.00300 |
|
40–44 |
.00436 |
.00744 |
.00364 |
.00390 |
|
45–49 |
.00578 |
.00887 |
.00499 |
.00534 |
|
50–54 |
.00805 |
.01137 |
.00702 |
.00763 |
|
55–59 |
.01191 |
.01582 |
.01012 |
.01152 |
|
60–64 |
.01846 |
.02345 |
.01503 |
.01816 |
|
65–69 |
.02941 |
.03641 |
.02304 |
.02927 |
|
70–74 |
.04726 |
.05749 |
.03594 |
.04746 |
|
Life expectancy at birth |
62.8 |
53.6 |
69.5 |
63.2 |
can death rates at older ages may be partially a function of a common Latin American pattern of age misreporting. In Costa Rica, it is found that correction for age misreporting leads to an age pattern of mortality consistent with the West region of the Coale and Demeny (1983) model life-table system. To see the effects of such age misreporting on the population projections presented here, we prepared a special projection for Latin America, assuming that age-specific death rates followed the West region pattern from ages 45 onward, rather than those exhibited in Table 9. The new life tables exhibit for 1985–1990 a life expectancy at birth 1.8 years below the United Nations estimate.
However, the 2015 age distribution in this new projection (which uses the adjusted life table and assumes that life expectancy improves at the same pace as the United Nations projection, but at the lower level of life expectancy) is altered to only a small degree. With the adjusted life table, the percentages of population in age groups 0–14, 15–49, 50–64, and 65+ are 28.3, 52.9, 12.7, and 6.1, compared with 28.0, 52.5, 12.8, and 6.7 from the United Nations projections (see Table 3 above).
African Distribution of Deaths
Of the 190 million deaths in the less developed regions during 1985–1990, 44 million occurred in Africa; hence, this major area requires a more detailed description of the future evolution of mortality. Slightly more than 52 percent of the deaths are to males, a percentage that has remained nearly unchanged during the past 25 years. However, males make up the majority of deaths only up to age 65: deaths are 53 percent male at ages 0–4, 51 percent male at ages 5–14, and 54 percent male for ages 15–64. From age 65, females make up a majority of deaths: 50.2 percent of all deaths at ages 65–74, and 56 percent of deaths at age 75 and over.
During 1985–1990, 47 percent of African deaths occurred at ages under 5 and another 12 percent between ages 5 and 14. As previously indicated, with 59 percent of deaths under age 15, Africa exhibits a very young death distribution, when compared with 42 percent of deaths occurring under age 15 for the LDRs as a whole. Due to the age pattern of mortality decline during the past 25 years, as well as the fertility decline that has occurred, the number of deaths in Africa has increased more at the older ages. Comparing deaths during the period 1960–1965 with those during 1985–1990, one finds a direct relationship between age and percent increase in number of deaths, as shown in Table 10.
The pattern is very similar if one considers males and females separately, although the percentage increase for male deaths was greater than that for females at all ages. As a result the percentage of deaths occurring under age 14 has fallen during the past 25 years, from 63 to 59 percent; the
TABLE 10 Increase in Africa’s Deaths from 1960–1965 to 1985–1990
|
Age Group |
Deaths 1985–1990 (thousands) |
Percentage Increase 1960–1965 to 1985–1990 |
|
0–4 |
20599 |
19.1 |
|
5–14 |
5306 |
23.0 |
|
15–49 |
7682 |
29.5 |
|
50–64 |
3787 |
39.1 |
|
65–74 |
3218 |
54.2 |
|
75+ |
3377 |
86.5 |
percentage at ages 15–49 has remained at 17 percent; at ages 50–64, the share of deaths has risen from 8 to 9 percent; and at age 65 and over, the share has increased from 11 to 15 percent (Table 8).
Changes in Deaths Over the Next 25 Years Without the AIDS Pandemic
The 1990 revision of population estimates and projections by the United Nations projects a continuation of the above trends for the next 25 years, although at a faster pace due to an assumed more rapid decline in fertility. However, the 1990 revision was undertaken before the extent of the AIDS pandemic was known and before even rough estimates could be made of its potential demographic effects. This section therefore describes how the number and distribution of deaths in Africa would evolve if the AIDS pandemic had not occurred, or if it plays itself out with minimal impact on future mortality. The next section presents some preliminary indications of what the effect of AIDS may be on deaths during the next 25 years.
In the absence of AIDS, 52.2 million deaths in Africa are expected during the 2010–2015 period, 19 percent more than occurred during 1985–1990. All of the increase in numbers of deaths will take place among the adult population. In fact, it is projected that the number of deaths under age 5 will be 12 percent below the 1985–1990 level, and the number at ages 5–14 will be 1 percent below. Increases in the number of deaths at age 15 and over are expected to be much greater than they were during the last 25 years. In comparison to 1985–1990, deaths during 2010–2015 will be 37 percent greater at ages 15–49, 55 percent greater at ages 50–64, 68 percent greater at ages 65–74, and 110 percent greater at age 75 and over.
The total number of deaths that would occur in Africa during 2010–2015 is projected to be 24 percent of the deaths that occur in the LDRs in total—only slightly higher than the 23 percent calculated for 1985–1990. However, below age 25 the proportion of LDR deaths that are located in
Africa will continue to rise rapidly. Under age 5, 44 percent of all LDR deaths in 2010–2015 will be African (compared to 19 percent in 1960–1965 and 31 percent in 1985–1990); at ages 5–14, 56 percent of deaths will be African (compared to 22 percent in 1960–1965 and 38 percent in 1985–1990); at ages 15–24, 48 percent of deaths are projected to be African (compared to 19 percent in 1960–1965 and 29 percent in 1985–1990).
Potential Effect of the AIDS Pandemic on the Number and Distribution of African Deaths
However, AIDS exists, and at least in Africa, it will lead to large numbers of additional deaths during the next 25 years. For the 15 countries with the estimated highest current level of human immunodeficiency virus (HIV) prevalence (Malawi, Rwanda, Uganda, Zambia, Zimbabwe, Burundi, Central African Republic, Congo, Tanzania, Zaire, Benin, Burkina Faso, Côte d’Ivoire, Kenya, and Mozambique), potential deaths during the next 25 years due to the AIDS pandemic have been calculated based on the World Health Organization’s (WHO) latest estimates of HIV prevalence and the WHO epidemiological model for projecting future infections and resultant AIDS cases and deaths. The application of the model here is conservative in that it assumes no new adult infections after 2005.
Preliminary estimates from this model indicate that these 15 countries will provide in aggregate about 18 million AIDS-related deaths during the next 25 years. (Additional deaths due to AIDS will add up to 13 million persons since many would die from other causes anyway). AIDS deaths will occur predominantly to young children and those in the prime working ages. About one-fourth of projected AIDS deaths will occur to children under age 5, and slightly more than one-half will occur to those aged 15–49. About 23 percent of deaths will be to those aged 50 and over, and less than 1 percent to those between ages 5 and 14.
Figure 2 presents the projected aggregate age-specific mortality rates for the 1990–2015 period, with and without AIDS, for these 15 African countries. Table 11 shows the percentage increase in expected mortality rates due to AIDS. The mortality rates in the absence of AIDS are calculated from the United Nations 1990 Revision.
The death rate under age 5 will be 13 percent higher than originally expected, but the largest rises in age-specific death rates can be expected to occur in the middle age groups. The death rate will rise by at least 20 percent between ages 20 and 65, by about 50 percent or more between ages 25 and 60, and by 100 percent between ages 35 and 45.
As a result, the age distribution of deaths in these countries during the next 25 years will be greatly altered. The percentage of expected deaths between ages 15 and 49 is projected to be 25 rather than 19 percent, and the
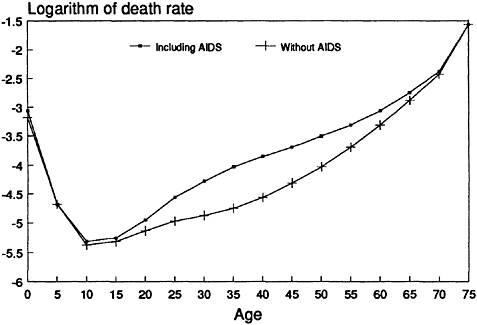
FIGURE 2 Projected aggregate age-specific mortality rates for 15 African countries with and without AIDS, 1990–2015.
TABLE 11 Increase in Mortality Rates Due to AIDS, 1990–2015; 15 Highest-Prevalence African Countriesa
TABLE 12 Distribution of Deaths for 15 African Countries With and Without AIDS, 1990–2015a
share between ages 50 and 64 will be 11 rather than 9 percent. AIDS mortality will lead to lower shares of deaths at other ages: 40 percent of deaths will be among those 0–4, rather than 43 percent (in spite of an anticipated 13 percent increase in deaths at these ages); 10 percent at ages 5–14 instead of 12 percent; and 15 percent at ages 65 and over instead of 17 percent (Table 12).
It can be expected that these 15 countries will account for the vast majority of all AIDS deaths in Africa, but even if one assumed that no AIDS-related deaths occurred outside these 15 countries, the 1990–2015 total death rate for Africa would be 7 percent higher than otherwise projected. In fact, total expected deaths for Africa will increase by more than 20 percent at ages 30–54, and by at least 10 percent at ages 25–59.
SUMMARY
Currently 4.1 billion persons live in the less developed regions of the world: 642 million in Africa, 448 million in Latin America, and 3.0 billion in the developing regions of Asia and Oceania. During the next 25 years, an average annual population growth rate of 2.8 percent is projected for Africa, compared to 1.6 percent for Latin America and 1.5 percent for Asia. Thus, by 2015, of the 6.3 billion population projected for the less developed regions, 1.3 billion will be African, 673 million Latin American, and 4.4 billion Asian. At mid-1990, 37 percent of the population of the less developed regions lived in urban areas (1.5 billion persons). By 2015, 55 percent of the population of the developing countries is projected to be urban.
The age distribution of population varies significantly across these three major areas. The population share aged 0–4 ranges from 12 and 13 percent
in Latin America and Asia, to 18 percent in Africa. The percentage of the population aged 65 and over varies from 3.0 percent in Africa, to 4.7 percent in Asia, to 4.8 percent in Latin America. The population age distribution will be much older by 2015, as the percentage aged 65 and over rises to 3.4 in Africa, 6.7 in Latin America, and 6.8 in Asia.
Africa, Latin America, and Asia vary according to mortality level, and to age and sex patterns of death. Although 16 percent of the LDR population in 1990 is African, the continent contributed 23 percent of the deaths during 1985–1990. Developing Asia and Oceania comprised 73 percent of the LDR population, but 69 percent of deaths, whereas Latin America made up the remaining 11 percent of the population and 8 percent of deaths.
In general, the age distribution of deaths is youngest in Africa. During 1985–1990, 48 percent of deaths in Africa occurred to preschool children, compared to 26 percent in Latin America and 32 percent in Asia. Deaths to those aged 65 and over contribute 15 percent to African deaths, 33 percent to Asian deaths, and 36 percent to Latin American deaths.
Although mortality levels are projected to exhibit substantial declines during the next quarter century, the absolute number of deaths in the less developed regions will be greater in 2010–2015 than during the five years prior to 1990. The age distribution of deaths will, however, be much older, with nearly one-half of all deaths expected to take place at age 65 and over, and less than 20 percent under age 5. For some countries, particularly in Africa, the potential effects of the AIDS pandemic may alter the future course and age patterns of mortality. Preliminary estimates indicate that the 15 African countries with the highest current level of HIV prevalence may experience 18 million additional deaths during the next 25 years due to the AIDS pandemic. These AIDS-related deaths are expected to occur predominantly to young children and to those in the prime working ages. About one-fourth of the projected AIDS deaths during the next 25 years in these countries will occur to children under age 5, and slightly more than one-half will occur to those aged 15–49.
REFERENCES
Coale, A.J., and P.Demeny 1983 Regional Model Life Tables and Stable Populations, 2nd ed. New York: Academic Press.
Dechter, A.R., and S.H.Preston 1992 Age misreporting and its effects on adult mortality estimates in Latin America. Population Bulletin of the United Nations. No. 31/32. New York: United Nations.
United Nations 1991a World Population Prospects 1990. Population Studies No. 120. New York: United Nations.
1991b The Sex and Age Distributions of Population, The 1990 Revision. Population Studies No. 122. New York: United Nations.
1991c World Urbanization Prospects 1990, Estimates and Projections of Urban and Rural Populations and Urban Agglomerations. Population Studies No. 120. New York: United Nations.


