
The Industrial Green Game. 1997. Pp. 212–224.
Washington, DC: National Academy Press.
Consumer Perceptions of Environmentalism in the Triad
FRANÇOISE SIMON AND MARY WOODELL
Within the past decade, environmentalism has shifted from a peripheral concern to a mainstream core component of business activities in North America, Europe, and Japan (the Triad). This movement was partly stimulated by consumer pressure that varied widely across the Triad, from the high-activism countries of northern Europe to a relative unorganized Japan.
The evolution of consumer concerns, while showing some similarities in certain well-defined segments across the Triad, also seems to have peaked and plateaued at different times in these three regions. This phenomenon has affected to some extent the corresponding national or regional government policies.
The lack of uniformity in consumer concerns precludes the formulation and implementation of a truly global strategy for multinational companies. However, it is still indispensable to measure and monitor the level and content of consumer environmental concerns in the major Triad markets to answer the following questions:
-
How do environmental concerns vary by country and region?
-
How do consumers rank their own country, and how do they prioritize key issues?
-
What are the levels of consumer activism and political organization in key markets?
-
How do consumer attitudes translate into actual behavior?
-
what is the gap between political correctness and actual change?
-
How have levels and types of commitment varied over time by region?
-
What is the consumer's "green IQ"?
-
How does willingness to pay differ among regions?
-
How are green consumers segmented the Triad?
-
What is the relative impact of advertising that uses environmental themes?
Multicountry studies by the Gallup and Roper research organizations have recently tracked some of these variations (Gallup, 1992; Roper Organization, 1992). As background for these analyses, it may be useful to review briefly the status of government policy in the major Triad markets.
VARIATIONS IN GOVERNMENT POLICIES AND BUSINESS INITIATIVES
U.S. Fragmentation
The U.S Environmental Protection Agency (EPA) over the past decade has added to its traditional "end-of-pipe" pollution controls a focus on pollution prevention. New approaches have included building a network of prevention programs and developing partnerships with the private sector. For example, the voluntary 33/50 Program initiative to reduce emissions of 17 chemicals (including benzene, cyanide, lead and mercury) by 33 percent by 1992 by 50 percent at the end of 1995 was adopted by over 1,100 U.S companies (Carra, 1993).
However, U.S. policy still remains fragmentary. In the absence of truly uniform federal legislation, some states have started to fill the void with their own measures. Several states have adopted or are considering laws similar to the 1990 California guidelines that mandate the phasing in of alternative fuels and dictate that 10 percent of all cars be emission free by 2003. It is likely that in this case, manufacturers will have to align themselves with the toughest state rules in the absence of a federal standard.
Europe: North-South Variance
Even though Europe as early as 1972 adopted the "polluter pays" principle and has since issued over 150 environmental directives, there are still considerable variations in policy among the major markets, from the aggressive standards of Germany and Scandinavia to what has been called ecobacktracking in the United Kingdom and a general in Southern Europe.
Even in the most advanced markets, the recent recession has had a negative effect on environmental progress. Environmental research has lost about one-third of its funding from German federal government, and ecology now ranks third in opinion polls as a national concern—behind unemployment and increasing crime—after having topped surveys consistently since the late 1980s. Support for Die Grilnen, the Green Party, fell below the 5-percent mark in western Germany's December 1990 elections, and therefore won no seats. Two Greens were elected in eastern Germany as part of a coalition.
While environmental progress is declining, however, business is moving ahead with path breaking transportation technology. Mercedez-Benz, BMW. and Volkswagen are at the forefront of ecological design in car production; BMW
alone spends one-third of its $845 million annual research budget on cleaner processes, and Volkswagen leads with its 3V policy (Vermeiden, Verringen, und Verworten, or prevention, reduction, and recycling). Volkswagen has set its sights on a 100-percent recycling rate despite the complexity of car materials. On the basis of its experience at a pilot dismantling plant, Volkswagen announced that it would take back its Golf model free of charge, a factor that helped Golf win the 1992 European Car of the Year award (Schmidheiny, 1992).
In addition, Germany hopes to bring the world's first magnetic levitation (maglev) train into operation by 2005. The German government has invested over $1 billion in the project. In late 1994, parliament approved a 180-kilometer track between Hamburg and Berlin (Wright, 1994a).
The total budget for the German environmental sector (private and public) is estimated at around $5 billion. This is more than double what France spends in this area (Wright, 1994b).
France itself sends mixed signals. Although a Eurobarometer 1992 survey showed that 80 percent of the population considered environmental protection "an immediate and urgent problem for Europeans" (compared with only 59 percent who did so in 1988), the two green parties (Les Verts and Generation Ecologie) only won 7 percent of the vote in the last legislative elections. Government policy is equally ambiguous. The new Barnier Law (named after the environment minister) identifying education and renewable energy as key priorities has been criticized as "a cosmetic touch-up of existing laws," and the ministry announced in August 1994 the reactivation of the controversial $4 billion Superphenix nuclear breeder reactor. France still gets 75 percent of its electricity from nuclear reactors. However, the 1994 environmental budget was increased by 9 percent over the previous year, and French business is stepping up its involvement in environmental activities. Even in the traditionally resistant automobile sector, companies such as Peugeot and Citroen are moving ahead with plans for ecovehicles (Wright, 1994a).
Public attitudes in the United Kingdom show patterns similar to those in France: General political correctness contradicted by an unwillingness to back it through votes or "green premiums." The government's imposition of a value added tax on domestic fuels, seen as a tentative gesture toward an energy tax,drew sharp opposition, and there is no indication that the United Kingdom will adopt the German and U.S. policies of mandatory recycling. With a few exceptions such as the Body Shop group, British business is strongly opposed to more regulations and is adopting a self-policing stance. Green audits are now becoming the norm for major companies, and the Confederation of British Industry is calling for more open corporate reporting on environmental activities. Leading companies in this area range from Shell and British Petroleum to the National Westminster Bank (Wright, 1994a).
Spain is typical of Southern Europe in that public concern remains low and legal protection remains weak in the absence of an environment ministry. Spanish
business has also been slow to accept its responsibilities and, in particular, to acknowledge that it will have to invest over $12 billion between 1994 and 1999 to meet minimum European Union environmental standards.
Japan: Government-Business Inconsistencies
By the early 1970s, Japan probably had the world's most stringent regulatory regime for industrial pollution. Over the past 21 years, industrial pollution has been greatly reduced, but it has been largely replaced by city-based pollution from car emissions and waste processing. Per capita carbon dioxide emission for Japan is less than half that for the United States and, at 2.6 tons per year ranks on a par with Sweden, thanks in part to a total private-sector investment of $81 billion in pollution prevention and another $50 billion in environmental public and private funding from 1960 through 1992. The New Earth 21 program of the Ministry of International Trade and Industry (MITI) includes the world's first commercial environment technology institute, where research ranges from the development of substitutes for chlorofluorocarbons to a project for biological carbon dioxide fixation and use. Many of the MITI-funded projects hope to commercialize their products within 10 to 15 years.
Although assuming technological leadership in areas as waste-management equipment, Japanese industry is resisting regulation. A carbon tax was strongly opposed by companies concerned about a loss of international competitiveness, and the media have criticized Honda, Nissan, and Toyota for lagging behind the Germans in reverse-assembly, recyclability, and cleaner-process research. Japanese automakers have resisted the environment agency's guidelines for reducing nitrogen dioxide and particle emission over the next few years, and they have also opposed a joint call by MITI and the transport ministry for an 8.5 percent boost in car mileage efficiency.
The public in Japan is not the driving force of change that it is in Northern Europe. Although environmental concerns exist, they tend to be found in specific population segments and, most importantly, they do not often translate into individual action and translate even less into political activism.
CONSUMER ATTITUDES TOWARD THE ENVIRONMENT IN THE TRIAD
In keeping with disparities in public policies and industry initiatives, consumer trends in the Triad vary widely among and within regions. Information levels, priorities, purchase and postpurchase behavior, as well as willingness to pay do not show convergence, and all these factors have been affected by the economic difficulties of the early 1990s.
TABLE 1 Personal Environmental Commitment in Triad Countries (percent engaging in "green" behaviors in the past year)
|
Countries |
Avoided Environmentally Harmful Products |
Active in Environment Group |
Voted and/or worked for Proenvironment Candidate |
|
United States |
57 |
11 |
19 |
|
Canada |
77 |
12 |
15 |
|
Japan |
40 |
4 |
14 |
|
Germany (West) |
81 |
10 |
18 |
|
United Kingdom |
75 |
10 |
0 |
|
Netherlands |
68 |
7 |
21 |
|
Denmark |
65 |
10 |
18 |
|
Source: Gallup, 1992. |
|||
Levels and Types of Environmental Concerns
In the comprehensive, multicountry Health of the Planet survey conducted in 1992 in 22 countries, Germans (only western Germans were polled) showed, predictably, the most concern about the environment. Sixty-seven percent rated their national environmental problems as "very serious" compared with 51 percent of Americans who did so and only 42 percent of Japanese (Gallup, 1992). Perceptions of dangers at home were remarkably uniform, with air and water pollution and waste disposal topping the list. Sharper distinctions emerged in regard to global threats. Germans were much more concerned than others about global warming, ozone loss, and the rain forest, which may be due to greater activism as well as to local factors such as deforestation through acid rain (Table 1).
Expected Role of Business
Across the Triad, business is perceived to be the chief cause of environmental problems. It was named the biggest polluter in Japan, western Germany, and the United Kingdom, and was perceived to be the second largest polluter in the United States, after individual waste. When presented with a list of remedial actions, consumers also placed the onus on business: "Regulating business" or "banning product sales" came first or second everywhere in the Triad.
This unanimity strongly suggests that companies' efforts to self-regulate and publicize their achievements may be a case of too little, too late. Negative perceptions of business and the public's wish for punitive actions such as bans appear well entrenched.
Consumer Involvement
Activism, as measured by Gallup through membership in an environmental group, remains limited in the United States and Europe (7 to 11 percent of citizens belong to such a group) and almost nonexistent in Japan (4 percent belong). In keeping with consumer skepticism, purchase behavior is more clearly defined in terms of avoidance than positive choice. As many as 81 percent of Germans, 57 percent of Americans, and 40 percent of Japanese have actively avoided products perceived as harmful. Positive choices tend to occur at lower levels. A 1990 Roper survey on the U.S. environment, for instance, found that only 14 percent of Americans regularly bought products with recycled content or in refillable packaging (Roper Organization, 1990). This is linked to the current lack of ecolabeling standards, but it may also suggest that the ''greenness" of a product is not in itself a purchase trigger but rather is one component of perceived overall quality.
Postpurchase behavior appears at first to show clearer patterns, but it is actually more difficult to interpret. According to Roper, in 1990, 71 percent of Americans practiced recycling. However, recycling ranges from being mandatory in some areas (particularly metropolitan suburbs and the Northeast) to nonexistent in others. Recycling rates may therefore reflect compliance with the law rather than individual commitment. Other behaviors with a potentially greater impact were resisted if they conflicted with personal freedom. Only 8 percent of Americans polled by Roper car use, for example (Roper Organization, 1990).
Evolution of Consumer Concerns
Roper Starch Worldwide reported an attitude change in the United states during the period 1989–1993 (Roper Organization, 1993). Public concern about the environment apparently peaked in 1991 and has plateaued at a higher level than any previous decade. Environmental concerns may have abated for two reasons: the relatively higher salience of recession, crime, and health care in the 1990s, and the fact that environmental action has now gone mainstream, partly shifting ecology from a hot issue to a core business activity.
Purchase behavior as well as perceptions of advertising suggest increasing confusion about what constitutes a truly green brand or company. Despite their considerable expenditures on advertising with environmental themes, companies have mostly not succeeded in gaining consumers' trust. In U.S. purchase decisions, a product's environmental record ranks well below attributes such as price, quality, and past experience with the brand. Environmental image, however, is the only factor in brand choice besides price that has shown significant growth in the past 4 years (Stisser, 1994).
Environmental concerns also vary considerably across product categories and are directly related to the ease of finding substitutes. Lawn, garden, and household cleaning products topped the list of products where environmental attributes
TABLE 2 Where Green Counts: Importance of Environment in Brand Selection, Selected Products, Ranked by Category Index, 1993
|
Rank |
Product Category |
Indexa |
|
1 |
Lawn and garden products |
210 |
|
2 |
Household cleaning products |
174 |
|
3 |
Paper products |
138 |
|
4 |
Gasoline |
110 |
|
5 |
Personal-care products |
80 |
|
6 |
Cars |
78 |
|
7 |
Fast-food restaurants |
50 |
|
a Average index=100. SOURCE: Roper Organization, 1993. |
||
affect brand choice. Categories that can be argued to have a much greater cumulative impact on the environment, such as cars and fast-food restaurants, were ranked last because of the American public's unwillingness to sacrifice independence and time savings (Table 2). Environmental considerations are most important in products where the effect on the environment is easy to see.
The ultimate measure of environment commitment is consumers' willingness to pay green taxes or a green premium on an ecologically safe product. Several studies show a consistent pattern over time. In 1988, when people surveyed were asked whether they would accept "a less good standard of living but with much less health risk," 84 percent agreed in the United States, 69 percent in Germany, and 64 percent in Japan (Louis Harris and Associates, 1988). Four years later, when asked about their willingness to pay, respondents showed a similar pattern, with 65 percent of Americans, 59 percent of Germans, but only 31 percent of Japanese in favor (Gallup, 1992).
Consumer Awareness: Variations in the Triad
For multinational companies, between-region variations in green IQ may be more challenging than within-country variations. Americans' perceptions that they are inadequately educated about the environment is confirmed by several measures. As a follow-up to the 1990 study, in late 1991 Roper released a survey testing a nationwide cross section of nearly 2,000 adults on their "green point average." Faced with 10 questions on topics ranging global warming to biodegradable plastic, Americans received an average of only 33 of a possible 100 points. "A low score by any standard," concluded Roper. Education and income did not help; college graduates as well as upscale Americans earned average scores of only 40 points.
Knowledge of environmental topics was best concerning wilderness issues, and the largest knowledge gap was in the products area, which suggests that the Sierra Club and other groups may have been more successful than corporations in their communication strategies.
Particularly striking is the case of chloroflurocarbons. Even though they were banned in 1978 by the EPA and the Food and Drug Administration for nearly all consumer products, only 14 percent of Americans knew about the ban 14 years later. Misperceptions also apply to the main sources of waste. Although paper is by far the largest waste component across the Triad—comprising 46 percent of the waste stream in Japan, 35 percent in the United States and 29 percent in the United Kingdom—many Americans underestimated its importance and focused on plastics instead. Plastics amount to less than 9 percent of waste in G-7 countries yet were ranked almost equal in importance to paper by Americans. These inadequacies in basic green knowledge have had a dramatic impact on products such as fast food and disposable diapers; companies such as McDonald's and Procter & Gamble faced intense consumer pressures that might have been avoided with better public information.
By contrast, several factors have helped to increase consumer awareness in Northern Europe. One milestone was the publication of The Green Consumer, which shot to the top of the British bestseller list in 1989 (Euromonitor Staff, 1989) The British edition, unlike the American edition, offered specific ratings for companies and products. A similar success was achieved by the guide's German equivalent, Okologie in Haushalt. Retail chains also played a powerful information role in Europe. Tengelmann began a campaign to win early green customers in 1984 in Germany, and in Switzerland, Migros developed a computer program to assess the life cycle impact of its packaging (Cairncross, 1992).
Impact of Green Advertising
In the United States, even though corporate and product-specific green advertising has expanded steadily, it has had relatively little effect so far. Strikingly, in a 1991 survey rating specific brands and companies, 66 percent of the 1,500 respondents could not name a single "environmentally conscious" company (Advertising Age, 1993). Of the firms named, Procter & Gamble was first, but with only 6 percent of the votes.
Two years later, the Roper green gauge survey (Roper Organization, 1993) showed a continuing pattern of skepticism. Consumers were still three times more likely to say that business is dragging its feet rather that doing a good job to protect the environment. In this context of consumer skepticism, the most effective approaches are fact based and objective or use external validation. Only 30 percent of Americans surveyed believed comparative environmental brand claims, but 54 percent trusted ads listing specific company actions in the environmental
TABLE 3 Percent of Adults Who Believe Ads with Selected Messages, 1993
|
|
Percent |
|
Environmental Message |
Who Believe |
|
Tells positive things the company is doing on social issues, the environment etc. |
54 |
|
Says the product has been approved by an environmental group |
49 |
|
Says a portion of profits will go to a good cause (disease prevention, environmental groups, etc.) |
43 |
|
Says the product is better than competing products for the environment |
30 |
|
SOURCE: Roper Organization, 1993. |
|
area. Almost half of those surveyed favored an ad citing an endorsement by an environmental group (Table 3).
Segmentation Patterns in the United States
Wide variations in green attitudes and behaviors suggest the existence of distinct segments in the Triad. Some surveys, such as the Harris 1988 multicountry poll, found relatively few demographic variations, particularly among age groups. Other studies have attempted to profile distinct segments. Roper in 1990 and Simmons in 1991 categories five main clusters in the United states by commitment level. Both categorizations show a positive linkage between green commitment and higher-than-average income and education, as would be expected (Roper Organization, 1990; Simmons Market Research Bureau, 1992).
Roper's clusters are based not only on perceptions, but also on actual pro-environmental behaviors, such as recycling. The size of two most committed groups, True-Blue Greens and Greenback Greens (now collapsed into one segment), show a slight decline from 22 percent of U.S. adults in 1990 to 20 percent by 1993 (Figure 1). A second layer, termed Sprouts because of the emergence of environmental concerns in this group, showed significant growth, from 26 percent of Americans in 1990 to 35 percent in 1993. This led to a net overall increase in the number of green consumers. In 1990, fewer than half of Americans fell into the three environmentally active groups. In 1993, 55 percent did. Other surveys confirm the spread of environmental awareness to a mass audience. Two-thirds of Americans have noticed environmental claims on packaging in 1994, and half have purchased green products since 1990 (Stisser, 1993).
A slight backlash, however, has begun. The least active group identified by Roper grew from 28 percent of the population in 1990 to 32 percent in 1993 to 37 percent in the latest survey, conducted in July 1994. This increase occurred largely at the expense of the most committed group, which lost five percentage points from 1993 to 1994 (Table 4).
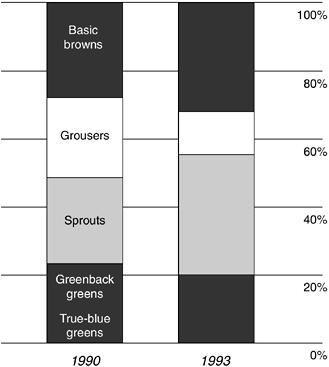
FIGURE 1 Earth's best friends. Since 1990, the three environmentally active groups have grown from 48 percent to 55 percent of all adults. Percent distribution of adults by environmental groups, 1990 and 1993. SOURCE: Roper Organization, 1990 and 1993.
TABLE 4 Environmental Consumer Segmentation: Selected Countries
|
|
United States (%) |
Index vs. United States |
||||||
|
|
1990 |
1993 |
1994 |
Canadaa |
Mexicoa |
Japanb |
Singaporeb |
Swedenc |
|
True-blue/greenback greens |
22 |
20 |
15 |
168d |
92 |
95 |
153d |
305d |
|
Sprouts |
2 |
35 |
33 |
87 |
35e |
86 |
78 |
115 |
|
Grousers |
12 |
13 |
13 |
167d |
589d |
191d |
182d |
90 |
|
Basic browns |
28 |
32 |
37 |
46e |
37e |
91 |
70e |
5e |
|
a Indexed against U.S levels as measured in 1990 survey, where 100 is the base index. b Indexed against U.S. levels as measured in 1993 survey, where 100 is the base index. c Indexed against U.S. levels as measured in 1994 survey. where 100 is the base index. d Above U.S. levels. e Below U.S. levels SOURCE: Roper Organization, 1990, 1993, 1995. |
||||||||
Segmentation Trends in Europe and Japan
Sweden has the most environmentally driven population, with a massive proportion of the top two groups and an insignificant number of noncommitted consumers. (See Table 4.) Japan's top two groups are only slightly below U.S. levels, but the country has significantly more dissatisfied and apathetic consumers. Asia does not constitute a uniform bloc; Singapore, with a similar proportion of dissatisfied and apathetic consumers, has a much larger percentage of the most committed groups.
In Japan, several surveys in recent years investigated environmental awareness, but they tended to focus on consumers' views of government policies and household activities. The Green Marketing Institute (1994) developed the first Green Consumer Index (GCI) survey, which focused on consumers, views of green products, advertising, and corporate image. The survey covered a random sample drawn from a pool of nationally representative consumers and obtained responses from 1,047 residents of metropolitan Tokyo-Yokohama. The GCI survey asked respondents to rate their involvement in each of 20 activities, ranging from using recycled paper to reducing and sorting trash, accepting reduced packaging, avoiding disposables, and belonging to an environmental group.
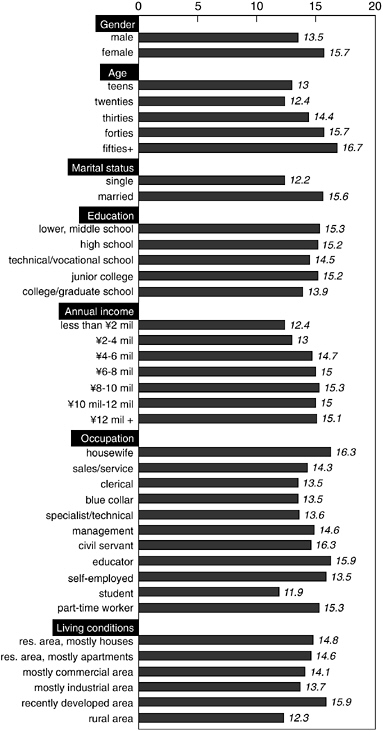
Classification as high-green (21.9 percent), medium-green (57.8 percent), and low-green (21.9 percent) was based on points scored on the survey as well as other factors. These percentages are relative and are not comparable with those reported by Roper, which were based on different questions and classifications. Some of the demographics of the high-green segment match Western counterparts, such as the dominance of females (21.2 percent of females were high green vs. only 16 percent of males) (Figure 2).
In Japan as in the United States and Europe, greenness also increases with age and income; however, the highest Japanese green score belongs to respondents aged 50 and above, whereas the greenest American consumers are in their 40s. This may be in part because Japan's older generations, having grown up in a postwar context of scarcity, are closer to a reuse-recycle lifestyle. Another significant difference concerns education, which is positively correlated with greenness in the United States and Europe. The GCI respondents showed lower greenness as education increased.
Here again, results are influenced by the predominance of older Japanese in the greenest segment and the fact that fewer members of this group received higher education. Until recently, higher education was a strong male preserve, and males show lower levels of greenness than do females (Green Marketing Institute, 1994).
CONCLUSION
Despite variations across the Triad, consumer trends show a significant convergence among the United States, Northern Europe, and Japan. In all three markets, environmentalism has been internalized by business and has become a core component of corporate strategy. In all three, consumers also continue their ecological involvement, albeit with some downward fluctuations in recent years. A core group of greenest consumers is generally growing, although not necessarily organizing through political activism. As environmentalism becomes mainstream, environmental behaviors may shift toward everyday household activities rather than highly visible political action.
Environmental factors continue to affect brand-purchase decisions and company perceptions, but some ill-conceived, premature green claims made in recent years have led to a persistent skepticism concerning green advertising. Companies will need to base any communications about the environment on objective, quantified information about tangible programs and brand attributes (such as emission reduction targets and percent recycled content). Despite policy uncertainties and fluctuations in attitudes, companies with vision, structure, and market understanding will continue to use environmental performance as a key factor of competitive advantage, as many have already demonstrated across the Triad.
REFERENCES
Advertising Age. 1993. Survey on Environmental Marketing, June 28, pp. S1–S6.
Cairncross, F. 1992. Costing the Earth: The Challenge for Governments, the Opportunities for Business. Boston: Harvard Business School Press.
Carra, J. 1993. EPA's Pollution Prevention Program Under the New Administration. Paper presented to the UNEP Conference on Business and the Environment, June 30, 1993 , New York.
Euromonitor Staff. 1989. The Green Consumer. London: Euromonitor Publications.
Gallup. 1992. Health of the Planet survey. Princeton, N.J.: George H. Gallup International Institute.
Green Marketing Institute (GMI). 1994. Green Consumer Index Survey of Japan. GMI Report. No. 11, February.
Louis Harris and Associates. 1988. Public and Leadership Attitudes to the Environment in Four Continents. Survey conducted for United Nations Environmental Program, New York.
Roper Organization. 1990. The Environment: Public Attitudes and Individual Behavior. Survey commissioned by S. C. Johnson & Son, July 1990. New York: Roper Organization.
Roper Organization. 1991. America's Environmental GPA. Survey commissioned by S. C. Johnson and Son, November 1991. New York: Roper Organization.
Roper Organization. 1993. Green Gauge Survey. New York: Roper Organization.
Roper Organization. 1995. Green Gauge Survey. New York: Roper Organization.
Schmidheiny, S. 1992. The Business Council for Sustainable Development, Changing Course: A Global Business Perspective on Development and the Environment . Pp. 102–103, 305–308. Cambridge, Mass.: MIT Press.
Simmons Market Research Bureau. 1992. Earth Calling: Is America Listening? New York: Simmons Market Research Bureau.
Stisser, P. 1994. A deeper shade of green. American Demographics. 16(3):24–29.
Wright, M. 1994a. The State of Europe's environment, 1994. Tomorrow 1:21–29.
Wright, M. 1994b. The way ahead for Germany, Britain and France. Tomorrow 4:82–90.


