
6
Summary and Conclusions
In the 1950s, as the production line was becoming the standard for hardware manufacturing, Deming showed that statistical process control techniques, invented originally by Shewhart, were essential to controlling and improving the production process. Deming's crusade has had a lasting impact in Japan and has changed its worldwide competitive position. It has also had a global impact on the use of statistical methods, the training of statisticians, and so forth.
In the 1990s the emphasis is on software, as complex hardware-based functionality is being replaced by more flexible, software-based functionality. Small programs created by a few programmers are being superseded by massive software systems containing millions of lines of code created by many programmers with different backgrounds, training, and skills. This is the world of so-called software factories. These factories at present do not fit the traditional model of (hardware) factories and more closely resemble the development effort that goes into designing new products. However, with the spread of software reuse, the increasing availability of tools for automatically capturing requirements, generating code and test cases, and providing user documentation, and the growing reliance on standardized tuning and installation processes and standardized procedures for analysis, the model is moving closer to that of a traditional factory. The economy of scale that is achievable by considering software development as a manufacturing process, a factory, rather than a handcrafting process, is essential for preserving U.S. competitive leadership. The challenge is to build these huge systems in a cost-effective manner. The panel expects this challenge to concern the field of software engineering for the rest of the decade. Hence, any set of methodologies that can help in meeting this challenge will be invaluable. More importantly, the use of such methodologies will likely determine the competitive positions of organizations and nations involved in software production.
With the amount of variability involved in the software production process and its many subprocesses, as well as the diversity of developers, users, and uses, it is unlikely that a deterministic control system will help improve the software production process. As in statistical physics, only a technology based on statistical modeling, something akin to statistical control, will work. The panel believes that the juncture at hand is not very different from the one reached by Deming in the 1950s when he began to popularize the concept of statistical process control. What is needed now is a detailed understanding by statisticians of the software engineering process, as well as an appreciation by software engineers of what statisticians can and cannot do. If collaborative interactions and the building of this mutual understanding can be cultivated, then there likely will occur a major impact of the same order of magnitude as Deming's introduction of statistical process control techniques in hardware manufacturing.
Of course, this is not to say that all software problems are going to be solved by statistical means, just as not all automobile manufacturing problems can be solved by statistical means. On the contrary, the software industry has been technology driven, and the bulk of future gains in productivity will come from new, creative ideas. For example, much of the gain in productivity
between 1950 and 1970 occurred because of the replacement of assembler coding by high-level languages.
Nevertheless, as the panel attempts to point out in this report, increased collaboration between software engineers and statisticians holds much promise for resolving problems in software development. Some of the catalysts that are essential for this interaction to be productive, as well as some of the related research opportunities for software engineers and statisticians, are discussed below.
INSTITUTIONAL MODEL FOR RESEARCH
The panel strongly believes that the right model for statistical research in software development is collaborative in nature. It is essential to avoid solving the "wrong" problems. It is equally important that the problems identified in this report not be "solved" by statisticians in isolation. Statisticians need to attain a degree of credibility in software engineering, and such credibility will not be achieved by developing N new reliability models with high-power asymptotics. The ideal collaboration partners statisticians and software engineers in work aimed at improving a real software process or product.
This conclusion assumes not only that statisticians and software engineers have a mutual desire to work together to solve software engineering problems, but also that funding and reward mechanisms are in place to stimulate the technical collaboration. Up to now, such incentives have not been the norm in academic institutions, given that, for example, coauthored papers have been generally discounted by promotion evaluation committees. Moreover, at funding agencies, proposals for collaborative work have tended to "fall through the cracks" because of a lack of interdisciplinary expertise to evaluate their merits. The panel expects such barriers to be reduced in the coming years, but in the interim, industry can play a leadership role in nurturing collaborations between software engineers and statisticians and can reduce its own set of barriers (for instance, those related to proprietary and intellectual property interests).
MODEL FOR DATA COLLECTION AND ANALYSIS
As discussed above in this report, for statistical approaches to be useful, it is essential that high-quality data be available. Quality includes measuring the right things at the right time—specifically, adopted software metrics must be relevant for each of the important stages of the development life cycle, and the protocol of metrics for collecting data must be well defined and well executed. Without careful preparation that takes account of all of these data issues, it is unlikely that statistical methods will have any impact on a given software project under study. For this reason, it is crucial to have the software industry take a lead position in research on statistical software engineering.
Figure 8, a model for the interaction between researchers and the software development process, displays a high-level spiral view of the software development process offered by Dalal
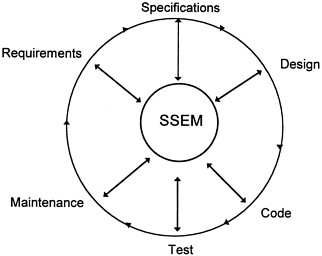
Figure 8. Spiral software development process model. SSEM, statistical software engineering module.
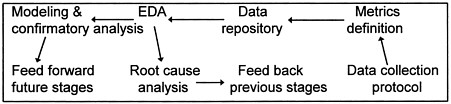
Figure 9. Statistical software engineering module at stage n.
et al. (1994). Figure 9 gives a more detailed view of the statistical software engineering module (SSEM) at the center of Figure 8.
The SSEM has several components. One of its major functions is to act as the central repository for all relevant project data (statistical or nonstatistical). Thus this module serves as a resource for the entire project, interfacing with every stage, typically at its review or conclusion. For example, the SSEM would be used at the requirement review stage, when data on inspection, faults, times, effort, and coverage are available. For testing, information would be gathered at the end of each stage of testing (unit, integration, system, alpha, beta, . . .) about the number of open faults, closed faults, types of problems, severity, changes, and effort. Such data would come from test case management systems, change management systems, and configuration management systems.
Additional elements of the SSEM include collection protocols, metrics, exploratory data analysis (EDA), modeling, confirmatory analysis, and conclusions. A critical part of the SSEM would be related to root-cause analysis. Analysis could be as simple as Ishikawa's fish bone diagram (Ishikawa, 1976), or more complex, such as orthogonal defect classification (described in Chapter 5). This capability accords with the belief that a careful analysis of root cause is essential to improving the software development process. Central placement of the SSEM ensures that the results of various analyses will be communicated at all relevant stages. For example, at the code review stage, the SSEM can suggest ways of improving the requirement process as well as point out potentially error-prone parts of the software for testing.
ISSUES IN EDUCATION
Enormous opportunities and many potential benefits are possible if the software engineering community learns about relevant statistical methods and if statisticians contribute to and cooperate in the education of future software engineers. The areas outlined below are those that are relevant today. As the community matures in its statistical sophistication, the areas themselves should evolve to reflect the maturation process.
-
Designed experiments. Software engineering is inherently experimental, yet relatively few designed experiments have been conducted. Software engineering education programs must stress the desirability, wherever feasible, of validating new techniques through the use of statistically valid, designed experiments. Part of the reason for the lack of experimentation in software engineering may involve the large variability in human programming capabilities. As pointed out in Chapter 5, the most talented programmer may be 20 times more productive than the least talented. This disparity makes it difficult to conduct experiments because the between-subject variability tends to overwhelm the treatment effects. Experimental designs that address broad variability in subjects should be emphasized in the software engineering curriculum. A similar emphasis should be given to random- and fixed-effects models with hierarchical structure and to distinguishing within- and between-experiment variability.
There is also a role for the statistics profession in the development of guidelines for experiments in software engineering akin to those mandated by the Food and Drug Administration for clinical trials. These guidelines will require reformulation in the software engineering context with the possible involvement of various industry and academic forums, including the Institute of Electrical and Electronics Engineers, the American Statistical Association, and the Software Engineering Institute.
-
Exploratory data analysis. It is important to appreciate the strengths and the limitations of available data by challenging the data with a battery of numerical, tabular, and graphical methods. Exploratory data analysis methods (e.g., Tukey, 1977; Mosteller and Tukey, 1977) are essentially "model free," so that investigators can be surprised by
-
unexpected behavior rather than have their thinking constrained by what is expected. One of the attitudes toward statistical analysis that is important to convey is that of
data = fit + residual.
The iterative nature of improving the model fit by removing structure from the residuals must be stressed in discussions of statistical modeling.
-
Modeling. The models used by statisticians differ dramatically from those used by nonstatisticians. The differences stem from advances in the statistical community in the past decade that effectively relax assumptions of linearity for nearly all classical techniques. This relaxation is obtained by assuming only local linearity and using smoothing techniques (e.g., splines) to regularize the solutions (Hastie and Tibshirani, 1990). The result is quite flexible but interpretable models that are relatively unknown outside the statistics community. Arguably these more recent methods lack the well-studied inferential properties of classical techniques, but that drawback is expected to be remedied in coming years. Educational information exchanges should be conducted to stimulate more frequent and wider use of such comparatively recent techniques.
-
Risk analysis. Software systems are often used in conjunction with other software and hardware systems. For example, in telecommunications, an originating call is connected by switching software; however, the actual connection is made by physical cables, transmission cells, and other components. The mega systems thus created run our nation's telephone systems, stock markets, and nuclear power plants. Failures can be very expensive, if not catastrophic. Thus, it is essential to have software and hardware systems built in such a way that they can tolerate faults and provide minimal functionality, while precluding a catastrophic failure. This type of system robustness is related to so-called fault-tolerant design of software (Leveson, 1986).
Risk analysis has played a key role in identifying fault-prone components of hardware systems and has helped in managing the risks associated with very complex hardware-software systems. A paradigm suggested by Dalal et al. (1989) for risk management for the space shuttle program and corresponding statistical methods are important in this context. For software systems, risk analysis typically begins with identifying programming styles, characteristics of the modules responsible for most software faults, and so on. Statistical analysis of root-cause data leads to a risk profile for a system and can be useful in risk reduction. Risk management also involves consideration of the probability of occurrence of various failure scenarios. Such probabilities are obtained either by using the Delphi method (e.g., Dalkey, 1972; Pill, 1971) or by analyzing historical data. One of the key requirements in failure-scenario analysis is to dynamically update information about the scenarios as new data on system behavior become available, such as a changing user profile.
-
Attitude toward assumptions. As software engineers are aware, a major difference between statistics and mathematics is that for the latter, it matters only that assumptions be correctly stated, whereas for the former, it is essential that the prevailing assumptions be supported by the data. This distinction is important, but unfortunately it is often taken too literally by many who use statistical techniques. Tukey has long argued that what is important is not so much that assumptions are violated but rather that their effect on conclusions is well understood. Thus for a linear model, where the standard assumptions include normality, homoscedasticity, and independence, their importance to statements of inference is exactly in the opposite order. Statistics textbooks, courses, and consulting activities should convey the statistician's level of understanding of and perspective on the importance of assumptions for statistical inference methods.
-
Visualization. The importance of plotting data in all aspects of statistical work cannot be overemphasized. Graphics is important in exploratory stages to ascertain how complex a model the data can support; in the analysis stage for display of residuals to examine what a currently entertained model has failed to account for; and in the presentation stage where graphics can provide succinct and convincing summaries of the statistical analysis and associated uncertainty. Visualization can also help software engineers cope with, and understand, the huge quantities of data collected in the software development process.
-
Tools. Software engineers tend to think of statisticians as people who know how to run a regression software package. Although statisticians prefer to think of themselves more as problem solvers, it is still important that they point out good statistical computing tools-for instance, S, SAS, GLIM, RS1, and so on-to software engineers. A CATS report (NRC, 1991) attempts to provide an overview of statistical computing languages, systems, and packages, but for such material to be useful to software engineers, a more focused overview will be required.


