Biological Criteria for Water Resource Management
Chris O. Yoder and Edward T. Rankin
This paper has two goals: to describe a framework for developing biological criteria for water-quality assessment and to suggest what roles biological indicators should have in water resource management and policy. A principal objective of the Clean Water Act is to restore and maintain the physical, chemical, and biological integrity of the nation's surface waters (Clean Water Act Section 101[a][2]). Although this goal is fundamentally ecological, regulatory agencies have attempted to reach it by measuring chemical and physical, but not biological, variables (Karr et al., 1986). The rationale for this choice is well known; the chemical water-quality criteria developed through laboratory toxicity tests on selected aquatic organisms serve as surrogates for the ecologically based goals of the Clean Water Act.
The presumption that improvements in chemical water quality will restore biological integrity has come into question during the past 20 years. The traditional chemical water-quality approach may give an impression of empirical validity and legal defensibility, but it does not directly measure the ecological health and well-being of surface water resources. Nor does it comprehensively address the definition of pollution in Section 502 of the Clean Water Act: ". . . man-made or man-induced alteration of the chemical, physical, biological or radiological integrity of water . . ." (Karr, 1991). State and federal programs have become focused on the objective of controlling point-source discharges of chemicals. However, a growing number of professionals and various stakeholders have become convinced that an attack on point sources of toxins alone will not fully achieve the Clean Water Act's goal related to surface waters. In addition to an overemphasis on point sources and toxins, many state and federal programs also suffer from
- an overreliance on prescriptive approaches to management and regulation;
- a tendency to rely on anecdotal information; and
- an emphasis on administrative activities that frequently results in a skewed allocation of resources among different programs.
Finally, attainment of national goals is also hindered by a lack of consistency in the environmental statistics reported by different states. One result is that in some cases, well-intentioned but basically flawed management strategies have increased environmental degradation as shown, for example, by the Ohio Environmental Protection Agency (1992). Fortunately, the U.S. Environmental Protection Agency (EPA) and others are becoming increasingly aware of these shortcomings and have initiated efforts such as the environmental indicators initiative and the Intergovernmental Task Force on Monitoring Water Quality (1992, 1993, 1995).
Major Factors That Determine Water Resource Integrity
Beyond chemical contaminants, multiple factors are responsible for the continuing decline of surface water resources in Ohio (Ohio Environmental Protection Agency, 1995) and the United States (Benke, 1990; Judy et al., 1984). These include the modification and destruction of riparian habitat, sedimentation of bottom substrates, and alteration of natural flow regimes. Because biological integrity is affected by many factors, controlling chemicals alone does not assure its protection or restoration (Figure 1). We need a broader focus on the entire water resource if we are to successfully reverse the decline in the overall quality of the nation's waters. Therefore, ecological concepts and biological criteria must be further incorporated into the management of surface water resources.
Disparities in the Use of Indicators
Although a growing number of states and organizations rely primarily on biological indicators to assess the condition of their water resources, others choose to emphasize chemical and physical indicators. The following examples demonstrate the inherent risks of relying solely on these indicators.
Out of 645 stream and river segments analyzed in Ohio, biological indicators revealed impairment in 49.8 percent of the segments where chemical indicators detected none (Ohio Environmental Protection Agency, 1990; Rankin and Yoder, 1990a). The converse was true for only 2.8 percent of stream segments. The remarkable discrepancy between biological and chemical assessments is due to fundamental differences in what they measure. Biological communities respond to a wide variety of chemical, physical, and biological factors. Thus, biological indicators are able to detect a wider range of environmental disturbances than can measures of chemical water-quality alone.
Another example is the proportion of waters that various states reported were
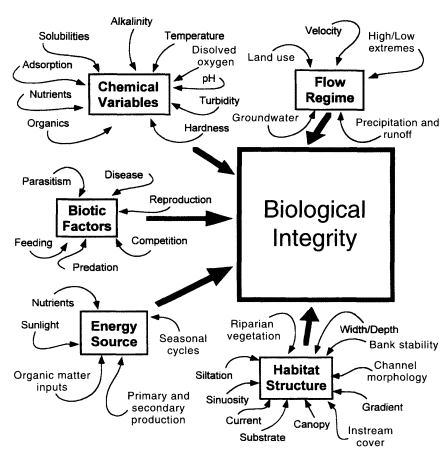
Figure 1
Five principal factors that influence and determine the integrity of surface water resources. SOURCE: Modified from Karr et al. (1986).
impaired due to habitat degradation (Figure 2). Twenty-five of 58 states and territories that report such statistics claimed that zero miles of rivers and streams had been negatively affected by the modification of habitat. Of the states that did report such impairment, only 15 reported an effect on more than 100 miles. These statistics are difficult to believe given the pervasive nature of well-documented practices that modify habitat, such as flood control, impoundments, agriculture and forestry, resource extraction, and urban development (Benke, 1990; Judy et al., 1984). The wide variation in state statistics is probably due to the use of different indicators and programmatic biases toward the control of toxic chemicals and point-source discharges (Ohio Environmental Protection Agency, 1990; Rankin and Yoder, 1990a).
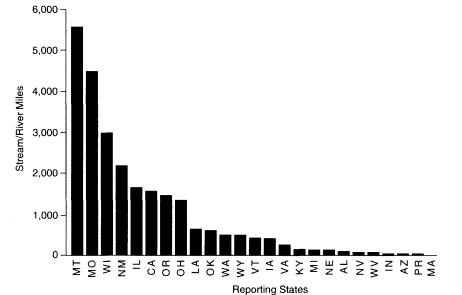
Figure 2
Miles of habitat-impaired rivers and streams reported by the states to the U.S. Environmental Protection Agency. SOURCE: United States Environmental Protection Agency (1994). NOTE: Twenty-five states reported no miles of aquatic-life use impairment associated with habitat degradation.
Ohio's use of quantitative biological criteria had some additional ramifications that affect the statistics related to the Clean Water Act 305[b]. For example, the proportion of stream miles that failed to attain standards increased from 9 percent in 1986 (based on a mix of chemical water-quality and qualitative biological assessments) to 44 percent in 1988, primarily because quantitative biological criteria were included in the assessment process beginning in 1988 (Ohio Environmental Protection Agency, 1988). The nearly fivefold increase in nonattainment illustrates the significant differences that can exist between states that use different assessment methods, especially whether or not biological assessments are included.
These examples demonstrate that relying on chemical water-quality information alone is apt to result in underestimates of environmental degradation. Underestimates are especially likely when assessing watershed-level effects. This is because the interaction of aquatic and riparian habitats, land use, and nutrient dynamics is particularly difficult to measure and characterize without using robust biological assessment tools and indicators. Ironically, much of the concern expressed about using biological criteria has been over the risk of failing to detect water-quality impairment. This concern seems misplaced in light of the preceding examples.
The Complementary Roles of Different Indicators
The EPA Environmental Monitoring and Assessment Program (United States Environmental Protection Agency, 1991) distinguishes environmental indicators on the basis of whether they best measure stresses, exposures, or responses. Stressor indicators identify activities that have an impact on the environment. These include land-use changes and discharges of pollutants. Exposure indicators identify components of the environment that have been subjected to a substance or activity that could potentially change the environment directly or indirectly. Response indicators detect the status of a particular resource component, usually biological, in relation to external stresses and exposure to those stresses. Particular indicators function most appropriately in one of the three indicator categories, although they may double as a secondary evaluator of another indicator class. For example, chemical measures generally function best as exposure indicators but may indirectly provide insights to response. Biological measures are inherently response oriented and may or may not provide more than qualitative insights to exposure and stressors.
These comparisons of chemical and biological indicators illustrate a national problem: the inappropriate use of stressor and exposure indicators as substitutes for response indicators. States that do not have well-developed bioassessment programs still must report on the status of their waters to EPA on a biennial basis. Thus, they are forced to use whatever information is available. Usually, the readily available information is in the form of stressor or exposure indicators. In attempting to resolve the obvious inconsistencies in measuring the condition of aquatic resources, a fundamental step is to recognize and establish appropriate roles for the different chemical, physical, and biological indicators. An accurate portrayal of the condition of the nation's surface waters depends on the use of suites of these indicators, each in their appropriate role as stressor, exposure, or response indicators.
Development of Biological Criteria
Underlying Theory and Concepts
Without a sound theoretical basis, it would be difficult if not impossible to develop biological criteria and meaningful measures of ecological condition. Obvious ecological degradation such as fish kills stimulated the landmark environmental legislation of the past 2 decades, but that biological focus was lost in the quest for easily measurable water-quality indicators (Karr, 1991). The biological integrity provision of the Clean Water Act, which was initially difficult to specify in practice (Ballentine and Guarria, 1975), was eventually defined by Karr and Dudley ( 1981 ) as ". . . the ability of an aquatic ecosystem to support and maintain a balanced, integrated, adaptive community of organisms having a spe-
cies composition, diversity, and functional organization comparable to that of the natural habitats of a region." It was this definition that provided the theoretical underpinnings for developing a framework within which quantitative biological criteria could be derived. The essential concepts of how to measure and define biological performance, natural habitats, and regional variability were each dealt with through a number of key research projects in the early 1980s and together provided the framework and tools needed to derive biological criteria.
Given the above definition, the eventual attainment of the Clean Water Act goal of biological integrity requires much more than merely achieving a high level of species diversity, numbers, and/or biomass. In fact, in some situations, increases in any one of these parameters can be a sign of degradation. Managers must also strive for more than the health and well-being of certain target species. The conservation of individual species, although necessary, is not sufficient for ensuring biological integrity. Conservation policy should promote management practices that maintain integrity, prevent endangerment, and enhance the recovery of species and ecosystems (Angermier and Williams, 1993). Water-resource management must include in its goal the objective of achieving self-sustaining, functionally healthy aquatic ecosystems. Achieving this state will foster other ecological goals as well because functionally healthy communities include the elements of biodiversity and rare species inherent to the more narrowly focused management efforts. We believe that biocriteria can play an important role in meeting these challenges.
Understanding Biological Integrity: A Prerequisite to Biological Criteria
The term biological integrity originated in Section 101[a][2] of the Federal Water Pollution Control Act amendments of 1972 and has remained a part of the subsequent reauthorizations. Early attempts to define biological integrity in ways that could be used to measure attainment of the legislative goals were inconclusive. One of the better known of these efforts failed to produce a consensus definition or framework for determining biological integrity (Ballentine and Guarria, 1975). Biological integrity was considered relative to conditions that existed prior to European settlement; the protection and propagation of balanced, indigenous populations; and ecosystems that are unperturbed by human activities. These criteria (especially the first and last) could be construed as referring to a pristine condition that exists in only a few, if any, ecosystems in the United States. Subsequently, an EPA-sponsored work group concluded that it is difficult and perhaps impractical to precisely define and assess biological integrity, when it is viewed as a pristine condition (Gakstatter et al., 1981). Rather, the pristine vision of biological integrity became a conceptual goal of pollution abatement efforts, although it may never be fully realized in many parts of the United States given current, past, and future uses of surface waters.
More recently, efforts to construct a workable, practical definition of bio-
logical integrity have provided the supporting theory needed to develop standardized measurement techniques and criteria to determine whether efforts are complying with that goal. Biological integrity is now defined as ". . . the ability of an aquatic ecosystem to support and maintain a balanced, integrated, adaptive community of organisms having a species composition, diversity, and functional organization comparable to that of the natural habitats of a region" (Karr and Dudley, 1981). This is a workable definition that directly alludes to the measurable characteristics of biological community structure and function found in the least-impacted habitats of a region. This definition and its underlying ecological theory provide the basis for developing quantitative biological criteria based on conditions at regional reference sites. The EPA adopted a facsimile of this definition in their biological criteria national program guidance (United States Environmental Protection Agency, 1990).
The emerging issue of biodiversity should not be equated with biological integrity, even though the two concepts share many attributes (Karr, 1991). They differ in that biodiversity is primarily focused on ecosystem elements (i.e., genetic diversity, populations, bioreserves, etc.), whereas biological integrity includes these elements but also encompasses ecosystem processes (i.e., nutrient cycles, trophic interactions, speciation, etc.). The often-cited ecosystem approach to environmental management (e.g., Great Lakes Water Quality Initiative) can be even more restricted to dealing with elements that are not direct ecological parameters (i.e., chemical water-quality surrogates). Both the biodiversity and the ecosystem approaches would benefit by including the concept of biological integrity to improve the chances that each effort would succeed and assure that environmental problems are addressed from an ecological perspective.
New Multimetric Biological-Community Evaluation Mechanisms
A variety of quantitative indices for assessing biological data have been developed in the past 20 years. These indices represent significant advances because they use biological information for resource characterizations and for determining the attainment of environmental goals. Examples include the Index of Biotic Integrity, as originally developed by Karr (1981) and modified by many others (Leonard and Orth, 1986; Miller et al., 1988; Ohio Environmental Protection Agency, 1987b; Steedman, 1988); the Index of Well-Being (Gammon, 1976; Gammon et al., 1981); the Invertebrate Community Index (DeShon, 1995; Ohio Environmental Protection Agency, 1987b); the EPA Rapid Bioassessment Protocols for macroinvertebrate assemblages (Plafkin et al., 1989); and the Benthic Index of Biotic Integrity (Kerans and Karr, 1992).
Although quantitative biological indices have been criticized for potentially oversimplifying complex ecological processes (Suter, 1993), raw data must be distilled to be interpretable. Multimetric evaluation mechanisms extract ecologically relevant information from complex biological data while preserving the
opportunity to analyze such data on a multivariate basis. Several features of these multimetric indices minimize the problem of data variability. Variability is first controlled by specifying standardized methods and procedures (e.g., Ohio Environmental Protection Agency, 1989b) and providing iterative training exercises and supervision to implement them. Second, variability is in effect "compressed" through the application of multimetric evaluation mechanisms (e.g., Index of Biotic Integrity, Invertebrate Community Index), which reduce raw measurements into discrete, calibrated scoring categories. Last, variability is partitioned according to background factors that determine ecological potential (e.g., ecoregions), a process that results in a graduated set of criteria based on regional potential. The results are evaluation mechanisms, such as the Index of Biotic Integrity and the Invertebrate Community Index, that have acceptably low replicate variability (Davis and Lubin, 1989; Fore et al., 1993; Rankin and Yoder, 1990b; Stevens and Szczytko, 1990).
Multimetric indices have been criticized as representing a loss of rich information because the data are reduced to a single index value. However, this presumes that the supporting data are never viewed or examined beyond the calculation of the index itself. These criticisms are without foundation: The need to examine subcomponents of the indices and even the raw data is implicit throughout the biocriteria process. Theoretically sound quantitative measures, as opposed to raw data, are clearly necessary throughout the process of environmental management. Although interpretation of raw data by qualified biologists will always be necessary, it is not realistic to expect that their qualitative judgment alone will be an acceptable substitute for a more empirical process. Fortunately, biological judgment can be incorporated into structured frameworks. These include the frameworks developed by the state of Maine using multivariate techniques (Davies et al., 1993), the state of Florida using a multimetric approach (Barbour et al., 1996), the EPA Rapid Bioassessment Protocols (Plafkin et al., 1989), and the regional reference-site approach (Hughes et al., 1986; Ohio Environmental Protection Agency, 1987b, 1989a; Yoder and Rankin, 1995a). Simply stated, multimetric indices can satisfy the demand for a straightforward numerical evaluation that expresses a relative value of aquatic community health and well-being and allows program managers (who are frequently nonscientists) to "visualize" relative levels of biological integrity. These measures also provide a means to establish quantitative biological criteria.
Karr's Index of Biotic Integrity Modified by the Ohio Environmental Protection Agency
The Index of Biotic Integrity originally proposed by Karr (1981) and later refined by Karr et al. (1986) and others incorporates 12 metrics (Table 1). These fall within four broad groupings: species richness and composition, trophic composition, environmental tolerance, and fish abundance and condition. Although no single metric consistently functions across an entire environmental gradient
TABLE 1 Index of Biotic Integrity Metrics Used by the Ohio EPA to Evaluate Headwater Sites, Wading Sites, and Boat Sites
|
Metric |
Wading Sitesb |
Boat Sitesc |
|
|
1. Number of native speciesd |
X |
X |
X |
|
2. Number of darter species |
|
X |
|
|
Number of darter and sculpin species |
X |
|
|
|
Percent round-bodied suckerse |
|
|
X |
|
3. Number of sunfish speciesf |
|
X |
X |
|
Number of headwater speciesg |
X |
|
|
|
4. Number of sucker species |
|
X |
X |
|
Number of minnow species |
X |
|
|
|
5. Number of intolerant species |
|
X |
X |
|
Number of sensitive speciesh |
X |
|
|
|
6. Percent green sunfish |
|
|
|
|
Percent tolerant species |
X |
X |
X |
|
7. Percent omnivores |
X |
X |
X |
|
8. Percent insectivorous cyprinids |
|
|
|
|
Percent insectivores |
X |
X |
X |
|
9. Percent top carnivores |
|
X |
X |
|
Percent pioneering speciesi |
X |
|
|
|
10. Number of individuals |
|
|
|
|
Number of individuals (less tolerants)j |
X |
X |
X |
|
11. Percent hybrids |
|
|
|
|
Percent simple lithophils |
|
X |
X. |
|
Number of simple lithophils |
X |
|
|
|
12. Percent diseased individuals |
|
|
|
|
Percent DELT anomaliesk |
X |
X |
X |
|
a Sites with drainage areas <20 sq. mi. b Sampled with wading electrofishing methods. c Sampled with boat electrofishing methods. d Excludes all exotic and introduced species. e Includes all species of the genera Moxostoma, Hypentelium, Minytrema, and Ericymba, and excludes Catostomus commersoni. f Includes only Lepomis species. g Species designated as permanent residents of headwaters streams. h Includes species designated as intolerant and moderately intolerant (Ohio Environmental Protection Agency, 1987b). i Species designated as frequent and predominant inhabitants of temporal habitats in head- water streams. j Excludes all species designated as tolerant, hybrids, and non-native species. k Includes only animals with deformities (D), eroded (E) fins or barbels, lesions (L), or tumors (T). NOTE: This table lists the original Index of Biotic Integrity metrics of Karr (1981). In cases where the Ohio EPA uses modifications of the original metric, the modifications appear below the original metrics. |
|||
and for all types of impacts, their aggregation in the Index of Biotic Integrity provides sufficient overlap and redundancy to yield a consistent and sensitive measure of biological integrity (Angermier and Karr, 1986). The index is a quantitative, ordinal, if not linear, measure that responds in an intuitively correct manner to known environmental gradients (Steedman, 1988). When incorporated with mapping, monitoring, and modeling information, the Index of Biotic Integrity is valuable for determining management and restoration requirements for warm-water streams (Bennet et al., 1993; Steedman, 1988). As an aggregation of community information, the Index of Biotic Integrity and its facsimiles provide a way to organize complex data and reduce it to a form that permits interpretation and comparisons with communities whose condition is known. Although the Index of Biotic Integrity incorporates elements of professional judgment, it also provides the basis for quantitative criteria for determining what constitutes exceptional, good, fair, poor, and very poor conditions.
The process of tailoring the Index of Biotic Integrity to regional conditions represents an important example of the use of biological judgment in biological criteria (Miller et al., 1988). Streams and rivers occur in many sizes throughout Ohio. They contain different fish assemblages and must be sampled by different methods. Thus, the Ohio EPA needed to modify Karr's original index to apply it to these different stream sizes and adjust it to account for biases induced by different sampling gear. The three different modified Indices of Biotic Integrity that were developed for Ohio rivers and streams (Table 1; Ohio Environmental Protection Agency, 1987b) are: 1) a headwaters index for application to headwater streams (locations with a drainage area <20 mi2); 2) a wading-site index for application to stream locations with watersheds >20 mi2 sampled with wading methods; and 3) a boat-site index for locations sampled from boats. All modifications follow the guidance on metric modification provided by Karr et al. (1986).
Although the Index of Biotic Integrity has worked well in Ohio and in many parts of the United States (Miller et al., 1988), Canada (Steedman, 1988), and Europe (Oberdorff and Hughes, 1992), problems have been encountered in semiarid western U.S. drainages (Bramblett and Fausch, 1991) and cold-water streams in northern states (Lyons, 1992). In both cases, the characteristics of the fauna differ from the presumptions made in the original index. Lyons (1992) was initially confounded by the degradation of cold-water streams in Wisconsin because it resulted in an increased diversity of fish species, a change that is counted as an improvement in water quality by the original Index of Biotic Integrity. He overcame these problems and constructed an index tailored to cold-water streams (Lyons and Wang, 1996). Bramblett and Fausch (1991) encountered difficulties due to a lack of pollution-intolerant species in the harsh and highly variable hydrological conditions of the Arkansas River basin in Colorado. These examples emphasize the need to consider the inherent characteristics of the regional fauna when developing multimetric biological assessment tools.
Because surface water resources naturally vary across the nation, nationally
uniform biological criteria are neither feasible nor desirable. However, it is desirable to have a national framework based on the concepts of the regional reference site approach (Hughes et al., 1986), which will promote national consistency between state bioassessments. The key is to describe the framework within a common national goal, such as the maintenance and restoration of biological integrity.
Initial Considerations
A number of fundamental decisions need to be made prior to adopting a set of biological monitoring methods. This is a critical juncture in the process because bad decisions will reduce the effectiveness of the efforts well into the future. These vital initial choices include which sampling methods to use, when to sample, which organisms to monitor, which parameters to measure, and which level of taxonomic precision to use. If any axiom applies, it is: When in doubt, take more measurements than seem necessary at the time because uncollected information cannot be retrieved later. Parameters that require little or no extra effort to acquire should be included until the evidence shows they are unnecessary. One example in Ohio is external anomalies on fish. We decided to record this information even though it was not apparent how it would be useful. This measure has proved to be one of our most valuable assessment tools. For macroinvertebrates, the decision to identify midges to the genus and species level was also fortuitous given the value of this group in diagnosing impairments. Of course, samples could always be archived for later reinspection, but the logistical burdens that this entails are undesirable.
Another important consideration is to assure that qualified and regionally experienced staff do the fieldwork. In ecological assessment, like many other professions, the most skilled and experienced individuals are sought to direct, manage, and supervise. However, biological field assessment requires an equivalent level of expertise in the field because many of the critical pieces of information are recorded and, to a degree, interpreted in the field. There is simply no substitute for the intangibles gained by direct observations in the field. This is not a job to be left to technicians. The staff who perform the fieldwork should also plan that work, process the data, interpret the results, and write reports. Such staff, particularly the more experienced individuals, also contribute to policy development.
Water-Quality Standards: Designated Uses and Criteria
The Ohio water-quality standards (Ohio Administrative Code 3745-1) consist of designated habitat classifications. Chemical, physical, and biological criteria are specific to each classification and are designed to be consistent with the goals specified by each classification. Protection and restoration requirements are a function of habitat classification. The Ohio water-quality standards de-
scribe five different habitat classifications. The general intent of each with respect to biological criteria are
- Warm-water habitat—This designation defines the most commonly occurring warm-water assemblages of aquatic organisms in Ohio rivers and streams and represents the principal restoration target for the majority of water resource management efforts in Ohio. Biological criteria for warm-water habitat are tailored to the five different ecoregions within Ohio.
- Exceptional warm-water habitat—This designation is reserved for waters that support ''unusual and exceptional" assemblages of aquatic organisms with exceptionally high species richness. Pollution-intolerant species are commonly present, as are significant populations of rare, threatened, or endangered species. This designation represents a protection goal for Ohio's best water resources. Biological criteria for exceptional warm-water habitat are the same for each ecoregion.
- Cold-water habitat—This designation is used for sites that support assemblages of cold-water organisms and sites that are stocked with salmonids for put-and-take fishery purposes. No specific biological criteria have been developed for this habitat classification. The warm-water habitat biocriteria are used to evaluate cold-water habitat sites.
- Modified warm-water habitat—This designation applies to streams and rivers that have been subjected to extensive, persistent, and essentially permanent hydromodifications that are permitted by state or federal law. The warm-water habitat biocriteria are not attainable at these sites. Species present are generally tolerant of low dissolved oxygen, silt, nutrient enrichment, and poor quality habitat. The biological criteria for modified warm-water habitat were derived from a particular set of habitat-modified reference sites and are tailored to the five ecoregions and three major modification types: channelization, run-of-river impoundments, and sites with extensive sedimentation due to nonacidic mine drainage.
- Limited resource water—This designation applies to small streams (usually <3-mi2 drainage area) and other water courses that have been altered to the extent that they can support no functional assemblage of aquatic life. Such waterways generally include small streams in extensively urbanized areas, those that lie in watersheds with extensive drainage modifications, those that completely lack water on a recurring annual basis (i.e., true ephemeral streams), and other irretrievably altered waterways. No formal biological criteria have been established for limited resource water because no organized community is to be expected.
Chemical, physical, and/or biological criteria are assigned to each habitat classification according to the broad ecological goals defined by each. This system constitutes a "tiered" approach in that different levels of protection are designated for each habitat classification. The hierarchy is especially apparent for
parameters such as dissolved oxygen, ammonia-nitrogen, and biological criteria. For other common parameters such as heavy metals, the technology to develop an equally graduated set of criteria has been lacking; thus, the same water-quality criteria may apply to two or three different habitat classifications. The concepts inherent to the system of habitat classifications also reflect the necessity of reconciling ideals, such as the restoration of biological integrity everywhere, with the lasting effects of two centuries of intensive human use of land and water resources.
Framework for Deriving Quantitative Biological Criteria: Ohio Example
The Ohio EPA adopted quantitative biological criteria in the Ohio water-quality standards regulations in 1990, following a 7-year development process based on a 10-year database. These criteria are based on measurable characteristics of fish and macroinvertebrate communities such as species richness, key taxonomic groupings, functional guilds, environmental tolerances, and organism condition (Ohio Environmental Protection Agency, 1987a,b, 1989a,b; Yoder, 1989; Yoder and Rankin, 1995a).
The resulting quantitative biological criteria represent the degree of biological integrity that can reasonably be expected given present background conditions. Although the process does not purport to attempt to define "pristine," pre-Columbian conditions, the design framework includes a provision to change the biocriteria in response to any future improvements in conditions at reference sites. If, however, general ecological decline continues, today's reference conditions will provide an important link from the past to the future. Regardless, this process does not lock in a particular baseline reference condition. Instead, it establishes a realistic range of desired states of ecological health and well-being against which we can evaluate contemporary environmental management and restoration efforts.
Quantitative biological criteria for Ohio's rivers and streams were derived using data from more than 350 reference sites that typify the "least impacted" condition within each Ohio ecoregion (Ohio Environmental Protection Agency, 1987b, 1989a; Yoder and Rankin, 1995a). This information was then used within the existing framework of habitat classifications in the Ohio water-quality standards to establish regional performance expectations for biological communities.
The framework included the following major steps:
- selection of indicator organism groups;
- establishment of standardized field sampling, laboratory, and analytical methods;
- selection and sampling of least-impacted reference sites;
- calibration of each metric in accordance with the methods described by Karr et al. (1986);
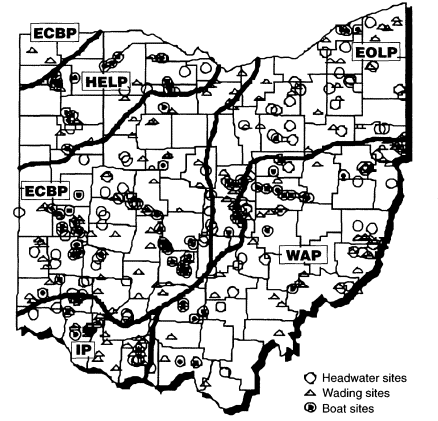
Figure 3A
Map showing regional reference sites for calibration of the Index of Biotic Integrity in Ohio. All of the locations indicated on the map are reference sites. Heavy black lines show boundaries between the five ecoregions: Huron/Erie Lake Plain (HELP), Interior Plateau (IP), Eastern-Ontario Lake Plain (EOLP), Western Allegheny Plateau (WAP), and Eastern Corn Belt Plains (ECBP).
-
- selection of numeric biocriteria based on the attributes specified by the various habitat classifications;
- resampling of reference sites (10 percent of sites sampled each year); and
- a planned periodic (i.e., once per decade) review of the calibration and derivation process and, if necessary, adjustment of the multimetric indices, numeric biological criteria, or both if justified by resampling results from reference sites.
The following example describes the calibration of the Index of Biotic Integrity modification for wading sites. Regional reference sites were first selected and sampled (Figure 3a) according to procedures outlined by the Ohio Environ-
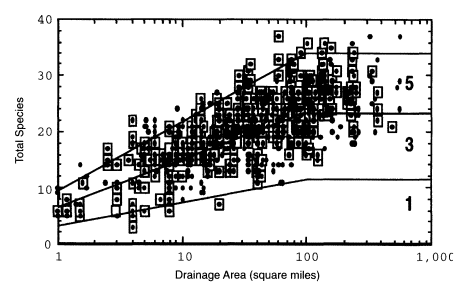
Figure 3B
An example showing the calibration of the species richness metric of the Index of Biotic Integrity for wading and headwater site types. The solid lines divide the figure into regions with Index of Biotic Integrity species richness scores of 1, 3, and 5.
mental Protection Agency (1987b, 1989b). The reference biological database was then used to calibrate the Index of Biotic Integrity metrics (Figure 3b). Three different modifications of the Index of Biotic Integrity were then constructed, one each for headwaters, wading (Table 2), and boat sites. The reference-site results were then used to establish the quantitative biological criteria. Notched box-and-whisker plots portray the results for each biological index by ecoregion (Figure 4). These plots convey sample size, medians, ranges with outliers, and 25th and 75th percentiles. Unlike means and standard errors, box plots do not assume a particular distribution of the data. Furthermore, outliers do not exert an undue influence, as they can on means and standard errors. In establishing biological criteria for a particular area or ecoregion, we attempt to represent the typical biological community, not the outliers. Outliers can be dealt with on a case-bycase basis. The box plot of the wading site reference data shows differences and similarities between ecoregions and the transition from lower scores in the Huron/Erie Lake Plain ecoregion to higher scores in the other four ecoregions. A similar stepwise procedure was used to calibrate the Invertebrate Community Index for macroinvertebrates (DeShon, 1995; Ohio Environmental Protection Agency, 1987b) and derive the quantitative biological criteria for the Modified Index of Well-Being for fish assemblages (Ohio Environmental Protection Agency, 1987b; Yoder and Rankin, 1995a).
TABLE 2 Calibrated Index of Biotic Integrity Modified for Ohio, Wading Sites
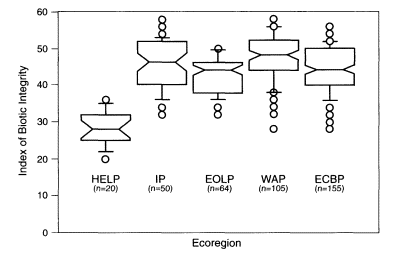
Figure 4
Notched box-and-whisker plot of reference-site results for the Index of Biotic Integrity from wading sites in each of the five ecoregions:Huron/Erie Lake Plain (HELP), Interior Plateau (IP), Eastern-Ontario Lake Plain (EOLP), Western Allegheny Plateau (WAP), and Eastern Corn Belt Plains (ECBP).
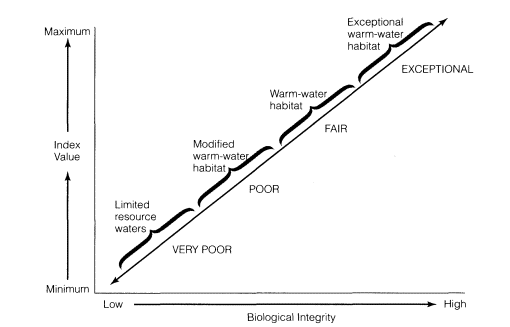
Figure 5
Relationship of biological integrity to quantitative biological criteria and the habitat classifications in the Ohio Water-Quality Standards. The corresponding relationship to narrative categories of biological community performance is also shown.
Figure 5 shows the relationships between the various habitat classifications, relative biological integrity, and the biological index values used to express the quantitative biological criteria. Narrative ratings of biological community performance are given opposite the habitat classifications. The highest biological index values coincide with the highest degree of biological integrity and the designation of exceptional warm-water habitat. Lower biological index values coincide with lesser degrees of biological integrity and poorer habitat classifications. As a matter of policy, only the criteria for warm-water habitat and exceptional warm-water habitat are considered consistent with the biological integrity goal of the Clean Water Act. However, states may designate poorer classifications such as modified warm-water habitat or limited resource waters if they can demonstrate that attempts to attain better biological integrity would cause substantial adverse socioeconomic impacts.
Applications of Quantitative Biological Criteria
Once biological criteria are derived and codified in state regulations, they are ready to use in water-quality management. Biological criteria need not be included in the water-quality standards to use them as an assessment tool, but in our experience, adopting them in water-quality standards significantly broadens and
legitimizes their full use. Biological criteria are employed principally as an ambient monitoring and assessment tool through biological surveys. Biological and water-quality surveys, or biosurveys, are monitoring efforts on a water-body or watershed scale. They may range from a focus on a relatively simple setting with one or two small streams, one or two principal stressors, and a handful of sampling sites, to a much more complex effort that includes entire drainage basins, multiple and overlapping stressors, and dozens of sites. Each year, the Ohio Environmental Protection Agency conducts biosurveys in 10-15 different study areas with a total of 250-300 sampling sites.
The Ohio Environmental Protection Agency employs biological, chemical, and physical monitoring and assessment techniques in biosurveys to meet three major objectives:
- determine the extent to which the habitat classification-specific biological criteria are met;
- determine if habitat classification criteria assigned to each water body are appropriate and attainable; and
- determine if any changes in biological, chemical, or physical indicators have occurred since earlier measurements, particularly before and after the implementation of point-source pollution controls or best-management practices for nonpoint sources.
Identifying the causes of observed impairments requires the interpretation of multiple lines of evidence, including water chemistry data, sediment data, habitat data, effluent data, biomonitoring results, and land-use data (Yoder and Rankin, 1995b). The assignment of principal causes of impairment represents the association of impairments with stressor and exposure indicators. The principal reporting venue for this process is a biological and water-quality report for each watershed or subbasin. These reports include summaries of major findings and recommendations for revisions to water-quality standards, future monitoring needs, or other actions needed to resolve existing impairment. Although the principal focus of a biosurvey is to assess whether conditions meet biological criteria, they also address the status of the site for other uses, such as recreation and water supply. Such reports provide the foundation for aggregated assessments, including the Ohio Water Resource Inventory, the Ohio Nonpoint Source Assessment, and other technical bulletins.
Interpreting Results on the Basis of a Longitudinal Reach or Subbasin
It is often useful to plot results as a function of sampling location with major sources of potential impact and the applicable quantitative biological criteria indicated. Figure 6 shows fish and macroinvertebrate community data for the Scioto River during 1980 and 1991. This type of analysis is critical for demonstrating changes through time. Figure 6 represents the results of bioassessments in a 40-
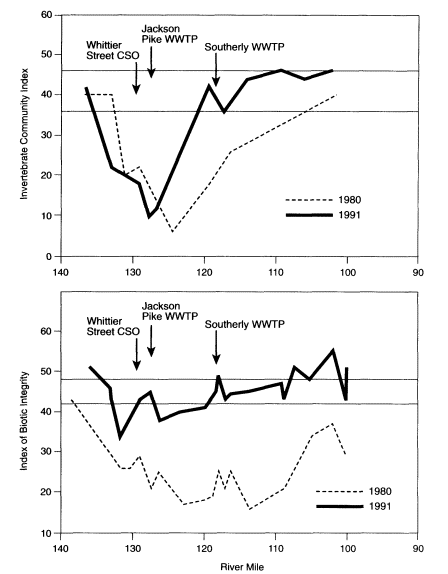
Figure 6
Values of the Invertebrate Community Index and the Index of Biotic Integrity for the Scioto River between Columbus and Circleville, Ohio, based on electrofishing samples collected July-October 1980 and 1991. NOTE: The locations of the Whittier Street combined sewer overflow (CSO) and the Jackson Pike and Southerly waste-water treatment plants (WWTP) are indicated. Horizontal lines indicate the criteria for exceptional warm-water habitat and warm-water habitat designations for the two indices. The exceptional warm-water habitat criterion is 46 for the Invertebrate Community Index and 48 for the Index of Biotic Integrity. The warm-water habitat criterion is 36 for the Invertebrate Community Index and 42 for the Index of Biotic Integrity.
mile river segment that has been sampled repeatedly. The obvious improvements exhibited by both the Index of Biotic Integrity and the Invertebrate Community Index illustrate the benefits of improved municipal waste-water treatment in the Columbus, Ohio, area between 1980 and 1991. Improvements designed to reduce water pollution were put in place at the major waste-water treatment plants during this interval. These changes can also be displayed in tabular form, but the extent and magnitude of the incremental improvements along each index axis can be better demonstrated graphically. Despite improvements between 1980 and 1991, Figure 6 shows that some reaches do not meet their respective criteria, particularly those close to combined sewer overflows and areas subjected to habitat modification.
Determination of Attainment of Habitat Classification Biocriteria
Once metric values have been calculated, each sampling site is classified according to the following criteria (Ohio Environmental Protection Agency, 1987b; Yoder, 1991b; Yoder and Rankin, 1995a):
- Full attainment—All of the applicable biological indices meet their respective criteria.
- Partial attainment—Either the fish or the macroinvertebrate assemblage fails to satisfy its criteria, but with biological index scores that are "fair" or better, whereas the other group (macroinvertebrates or fish) does satisfy its criteria.
- Nonattainment—Neither the fish nor the macroinvertebrate assemblage meets its biocriteria, or one of the assemblages reflects a narrative rating of "poor" or "very poor."
The analysis results provide the formal basis for determining whether biological criteria have been attained and serve as the starting point for all other uses of the data, including reporting (e.g., basin reports, Clean Water Act 305[b] report) and assessment (e.g., Water Quality Permit Support Documents).
The results of biosurveys can also be summarized in terms of Biological Integrity Equivalents (BIEs), a product of results from the Index of Biotic Integrity (IBI), the Modified Index of Well-Being (MIwb), and the Invertebrate Community Index (ICI):
BIE = (IBI + [MIwb x 5] + ICI) x 100.
180
Because the maximum values for IBI and ICI are 60, but the maximum theoretical value of MIwb is 12, MIwb is multiplied by 5 so that equal weight is given to each index. Their sum is then divided by 180, and the result is multiplied by 100 to produce scores that range from 0 to 100. The BIE score, being the composite
of the three indices that comprise the biological criteria, reflects the degree to which a particular sample achieves the ideal of biological integrity. Figure 7 provides BIE results for the Kokosing and Hocking rivers in central Ohio. These rivers represent extremes in terms of impairment, water quality, aquatic community potential, and habitat classifications.
The Kokosing River figure shows longitudinal (i.e., upstream to downstream) changes in habitat classification, application of the quantitative biological criteria, the position of significant influences on water quality, and a change in ecoregion. One result of the 1987 survey was a proposal to change the original warm-water habitat designation to exceptional warm-water habitat for river miles 30 to 0 because the sampling results demonstrated the full attainment of the exceptional warm-water habitat biological criteria for both fish and macroinvertebrates in this area. The existing warm-water habitat designation originally was made in 1985 without the benefit of site-specific biological data.
The Hocking River presents a stark contrast to the Kokosing. The extensive nonattainment observed in 1982 was largely due to point-source discharges, combined sewers, urbanization, and habitat impacts. Improvements in municipal waste-water treatment and industrial pretreatment were primarily responsible for the improved conditions observed in 1990. This example shows how biological criteria can serve as a feedback tool for determining the success of pollution control programs.
Statewide Reporting and Assessment Applications
Biological data and biological criteria are the principal arbiters of habitat classification attainment status for the biennial Ohio Water Resource Inventory (Clean Water Act 305[b] report). Perhaps the question we are most frequently asked is, Is water quality improving? We have developed a standardized approach to biological monitoring and a long-term database that enables us to answer this and other questions. Figures 8 and 9 and Table 3 show data that enable us to track changes and document improvements in water quality. Although the Ohio Environmental Protection Agency database was not collected under a statistically random design and is spatially biased, the large number of sites (>4,500 locations) and thorough coverage of streams and rivers with drainage areas greater than 100 mi2 (71 percent coverage statewide) make valid statewide comparisons possible. (The Ohio Environmental Protection Agency database represents a sampling site density more than 10 times that of the EPA Environmental Monitoring and Assessment Program and the U.S. Geological Survey National Water Quality Assessment monitoring designs.)
To answer the question of whether water quality is improving, we compared the direction and magnitude of change in biological index scores at sites for which we have multiple years of data. In this analysis, trends represent the difference between the earliest and latest results (most of which are approximately 10 years
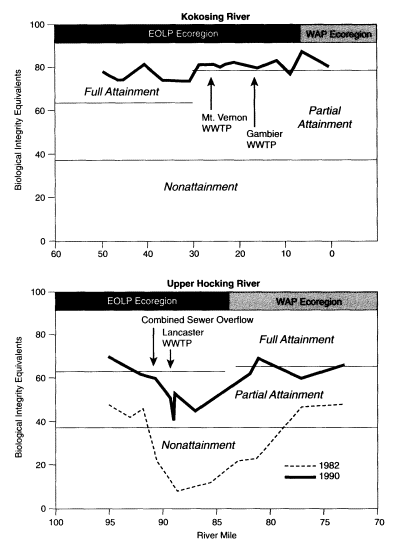
Figure 7
Longitudinal profile of Biological Integrity Equivalents (BIEs) for the Kokosing River in 1987 and the upper Hocking River in 1982 and 1990. NOTE: The BIE scores that generally coincide with full, partial, and nonattainment of the applicable habitat criteria are indicated. The Kokosing River is designated as exceptional warm-water habitat from mile 0 to mile 30 and warm-water habitat from mile 30 to mile 60. The section of the Hocking River represented here is designated as warm-water habitat. Locations of a combined sewer overflow and waste-water treatment plants (WWTP) are indicated in the figure. Shading at the top of each panel identifies river segments in the Eastern-Ontario Lake Plain (EOLP) and the Western Allegheny Plateau (WAP) ecoregions, respectively.
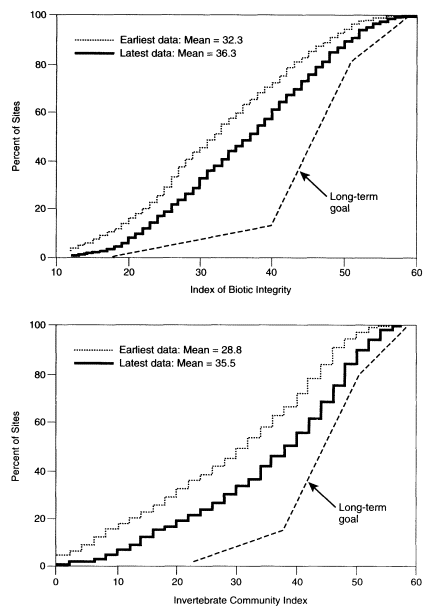
Figure 8
Cumulative frequency diagram for Index of Biotic Integrity scores for 1,160 Ohio sites and Invertebrate Community Index scores for 854 Ohio sites measured before and after 1988. NOTE: Measurements from before 1988 are represented by the line labeled ''Earliest Data." Measurements from after 1988 are represented by the line labeled "Latest Data."
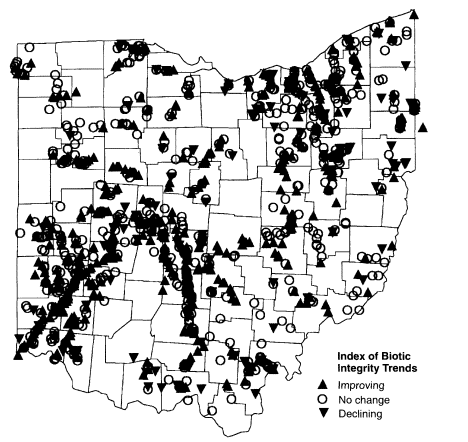
Figure 9
Map of sampling sites on Ohio rivers and streams depicting changes in the Index of Biotic Integrity (IBI) at 1,160 sites and Invertebrate Community Index (ICI) at 527 sites. NOTE: Symbols indicate the directions of changes in the two indicators at the various sites based upon a comparison of measurements from the earliest and latest sampling years before and after 1988.
apart). The analysis included 1,160 sites for the Index of Biotic Integrity, 845 sites for the Modified Index of Well-Being, and 527 sites for the Invertebrate Community Index. Significant improvements have been observed for each index (Table 3; Figures 8 and 9). The Invertebrate Community Index showed both the largest increase and the largest shift in the frequency of sites entering the good and exceptional performance ranges (i.e., scores meeting the warm-water habitat and exceptional warm-water habitat criteria), but the fewest sites exiting the poor and very poor ranges (scores <14). In contrast, the fish community Index of Biotic Integrity
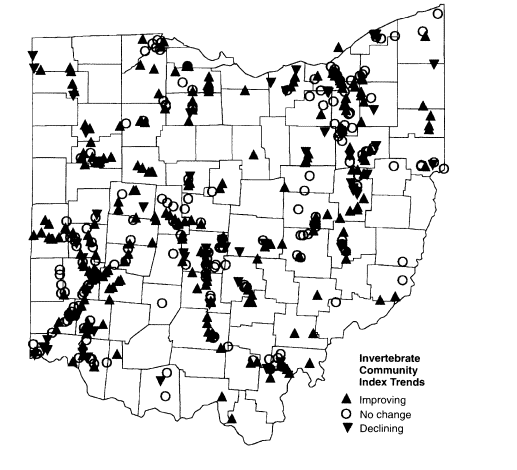
had the greatest number of sites exiting the poor and very poor ranges (scores >26-28) but the fewest sites entering the good and exceptional ranges.
Considerable improvements have been documented in Ohio rivers and streams, as reflected by the biological criteria. The predominant pattern begins with the recovery of the macroinvertebrate community (as measured by the Invertebrate Community Index), followed later by improvements in fish abundance and biomass (as indicated by the Modified Index of Well-Being), and then finally structural and functional improvements (as measured by the Index of Biotic Integrity).
TABLE 3 Summary of Results for Ohio Stream and River Sites with at Least 2 Years of Biological Data Collected between 1979 and 1994, at Least Once Before (earliest) and Once After (latest) 1988
These substantial improvements notwithstanding, a significant proportion of Ohio's rivers and streams remain too polluted and/or physically degraded to meet their biological criteria. Figure 10 illustrates the aggregate changes in impairment that took place between 1988 and 1996 and projects the trend through the year 2002. Figure 10 makes it clear that the proportion of impairment associated primarily with point-source discharges is declining at a more rapid rate than impairment associated with nonpoint sources. Nonpoint sources include habitat modifications, nutrient enrichment, and sedimentation. The state will need to pay more attention to nonpoint sources and watershed-level effects if it is to reach milestones such as the Ohio 2000 goal of 75 percent of full attainment. This will require a significant restructuring of state water-quality management programs that are presently heavily oriented toward point sources of pollutants.
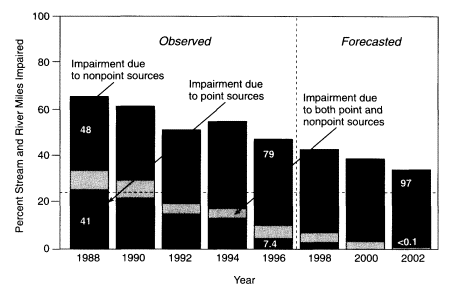
Figure 10
Observed and forecasted reductions, by percent, in the proportion of river and stream miles failing to attain their habitat classification biological criteria. NOTE: Forecasts from 1997 to 2002 are based on the observed rate of restoration during the period 1988-1996. The dashed horizontal line represents the Ohio 2000 goal.
Overall Impact of Biological Criteria
The use of biological criteria has proved useful to the Ohio Environmental Protection Agency for several reasons:
- The results use direct measurements of ecological condition, rather than surrogate or symptomatic measures. This helps focus management programs on actual environmental results rather than administrative goals only (i.e., number of permits issued, grant dollars awarded, etc.).
- The resulting knowledge of aquatic community conditions can more efficiently guide management and regulatory activities that might otherwise be forced to rely on prescriptive approaches to information gathering (e.g., effluent characterization, major discharger lists, 303[d] and 304[1] lists).
- The results provide objective measurements with which to assign appropriate habitat classifications to individual rivers and streams.
- The results provide a means to assess the applicability and effectiveness of the antidegradation policy in the Ohio water-quality standards (i.e., extending antidegradation concerns to nonpoint sources and habitat influences, defining high-quality waters).
- Chemical and narrative water-quality criteria and standards can be more appropriately applied and take into account the integrated dynamics of the receiving waters when relevant biological assessment information is available (Yoder, 1991a,b).
- The biological results provide a legal basis for enforcement against entities discharging chemicals for which there are no existing water-quality standards or effluent guidelines (or at least provide the impetus to designate new chemical criteria or whole-effluent toxicity limits).
- The results provide a basis for regulating nonchemical environmental degradation (e.g., certifications of dredging permits [Section 401 water-quality certifications], non-point-source management).
Remaining Challenges
We have demonstrated how biological criteria can be developed and used within a state water-resource-management framework. Nonetheless, some important challenges remain. The cumulative costs associated with environmental mandates, many of which consist of prescription-based regulations, have recently come into question. Both the regulated community and the public desire evidence of real-world results in return for the expenditures made necessary by federally and state-mandated requirements. Biological criteria seem particularly well suited to address these concerns because the underlying science and theory is robust (Karr, 1991), and biocriteria directly assess the biological condition of aquatic habitats.
Although no single environmental indicator can do it all, biological criteria have a major role to play. A lack of information from or an overreliance on any single class of indicators can result in environmental regulation that is inaccurate and either under- or overprotective of the resource. Accounting for cost is not only a matter of dollars spent but also of program effectiveness. A credible and genuinely cost-effective approach to water-quality management should include an appropriate mix of chemical, physical, and biological measures, each in their respective roles as stressor, exposure, and response indicators. The public must come to see comprehensive monitoring designs using such cost-effective indicators as a part of the cost of doing business, perhaps at the expense of other programs when new evidence suggests that the resources allocated are disproportionate to the magnitude of the present problems (e.g., point versus nonpoint sources).
Based on our experience over the past 17 years, it is evident that including biological criteria in a state's monitoring and assessment effort has multiple benefits: It can foster a more complete integration of important ecological concepts, better focus water resource policy and management, and enhance strategic planning. Some specific examples include:
- Watershed approaches to monitoring, assessment, and management—The monitoring and assessment design inherent to biological criteria is fundamentally oriented to yield information on watersheds.
- Integrated point, nonpoint, and habitat assessment and management—Biological criteria integrate the effects of all stressors over time and space. The attendant use of chemical, toxicological, and physical tools can connect probable causes to observed impairments. This should provide a firm setting for the collaborative use of the same information for the management and regulation of both point and nonpoint sources (including habitat), two realms that have thus far been treated independently.
- Cumulative effects—Biological communities inhabit the receiving waters all of the time and reflect the integrative, cumulative effect of various stressors.
- Biodiversity issues—The basic biological data provide information about species, populations, and communities of concern.
- Interdisciplinary focus—Because biosurvey monitoring and assessment design is inherently interdisciplinary, the biological criteria approach provides the opportunity to bring ecologists, toxicologists, engineers, and other professionals together in planning and conducting assessments, interpreting results, and using information in strategic planning and management actions.
Biological criteria are an emerging and increasingly important issue for the EPA, the states, and the regulated community, and their use is growing nationwide. However, much remains to be done, particularly in the area of national and regional leadership. Technical guidance and expertise is needed to ensure a nationally consistent and credible approach and to resolve outstanding technical concerns (Yoder and Rankin, 1995a). Outstanding policy issues, such as the EPA's policy of independent applicability, need to be resolved in a manner that will encourage states to participate. In an era of declining government resources, we must develop ways to do more biological monitoring to support the biocriteria approach. Based on our experience in Ohio, the staffing of state biological assessment programs should include a minimum of one work year equivalent for every 1,200 miles of perennial streams and rivers. This estimate may vary by region and should incorporate lake-surface area in states with a substantial number of lakes (Yoder and Rankin, 1995a). The EPA must consider the potential for bioassessments and biocriteria to modify the present capital- and resource-intensive system of tracking environmental compliance on the basis of specific pollutants. The biological criteria approach should prove a more cost-effective way of managing the nation's water-quality programs.
Acknowledgments
This paper would not have been possible without the many years of fieldwork, laboratory analysis, and data assessment and interpretation performed by
members (past and present) of the Ohio Environmental Protection Agency, Ecological Assessment Section. Several staff members contributed extensively to the development of the biological assessment program, including Dave Altfater, Randy Sanders, Marc Smith, and Roger Thoma (fish methods, MIwb, and IBI metrics development) and Mike Bolton, Jeff DeShon, Jack Freda, Marty Knapp, and Chuck McKnight (macroinvertebrate methods and ICI metrics development). None of this effort would have been possible without the excellent data management and processing skills contributed by Dennis Mishne. Other staff (past and present) who made important contributions include Paul Albeit, Ray Beaumier, Chuck Boucher, Bernie Counts, Beth Lenoble, and Paul Vandermeer. Dan Dudley and Jim Luey contributed extensively to the early development and review of the then-emerging concepts of biological integrity, ecoregions, reference sites, and biological assessment in general. Charlie Staudt provided many hours of support in the development of the computer programs used for data analysis. Finally, Gary Martin and the late Pat Abrams provided solid management support for the concept of biological criteria and biological assessment at the Ohio Environmental Protection Agency.
References
Angermier, P. L., and J. R. Karr. 1986. Applying an index of biotic integrity based on stream-fish communities: Considerations in sampling and interpretation. North American Journal of Fisheries Management 6:418-427.
Angermier, P. L., and J. E. Williams. 1993. Conservation of imperiled species and reauthorization of the endangered species act of 1973. North American Journal of Fisheries Management 18(7):34-38.
Ballentine, R. K., and L. J. Guarria. 1975. Paper published in The Integrity of Water: Proceedings of a Symposium, March 10-12, 1975, Washington, D.C. U.S. Environmental Protection Agency, Office of Water and Hazardous Materials. Washington, D.C.: U.S. Government Printing Office.
Barbour, M. T., J. Gerritsen, G. E. Griffin, R. Frydenborg, E. McCarron, J. S. White, and M. L. Bastian. 1996. A framework for biological criteria for Florida streams using benthic macroinvertebrates. Journal of the North American Benthological Society 15(2): 185-211.
Benke, A. C. 1990. A perspective on America's vanishing streams. Journal of the North American Benthological Society 9(1):77-88.
Bennet, M. R., J. W. Kleene, and V. O. Shanholtz. 1993. Total maximum daily load nonpoint source allocation pilot project. File Report. Blacksburg, Va.: Virginia Department of Agricultural Engineering.
Bramblett, R. G., and K. D. Fausch. 1991. Variable fish communities and the index of biotic integrity in a western Great Plains river. Transactions of the American Fisheries Society 120:752.
Davies, S. P., L. Tsomides, D. L. Courtemanch, and F. Drummond. 1993. State of Maine Biological Monitoring and Biocriteria Development Program Summary. Augusta: Maine Department of Environmental Protection.
Davis, W. S., and A. Lubin. 1989. Statistical validation of Ohio EPA's invertebrate community index. Pp. 23-32 in Proceedings of the 1989 Midwest Pollution Biology Meeting, Chicago, Ill., W. S. Davis and T. P. Simon, eds. EPA 905/9-89/007. Washington, D.C.: U.S. Environmental Protection Agency.
DeShon, J. D. 1995. Development and application of the invertebrate community index (ICI). Pp. 217-243 in Biological Assessment and Criteria: Tools for Risk-Based Planning and Decision Making, W. S. Davis and T. Simon, eds. Boca Raton, Fla.: Lewis Publishers.
Fore, L. S., J. R. Karr, and L. L. Conquest. 1993. Statistical properties of an index of biotic integrity used to evaluate water resources. Canadian Journal of Fisheries and Aquatic Sciences 51:1077-1087.
Gakstatter, J., J. R. Gammon, R. M. Hughes, L. S. Ischinger, M. Johnson, J. Karr, T. Murphy, T. M. Murray, and T. Stuart. 1981. A recommended approach for determining biological integrity in flowing waters. Corvallis, Ore.: U.S. Environmental Protection Agency.
Gammon, J. R. 1976. The fish populations of the middle 340 km of the Wabash River. Water Resources Research Center Technical Report 86. West Lafayette, Ind.: Purdue University.
Gammon, J. R., A. Spacie, J. L. Hamelink, and R. L. Kaesler. 1981. Role of electrofishing in assessing environmental quality of the Wabash River. Pp. 307-324 in Ecological Assessments of Effluent Impacts on Communities of Indigenous Aquatic Organisms, J. M. Bates and C. I. Weber, eds. ASTM STP 730. Philadelphia, Pa.: American Society for Testing and Materials.
Hughes, R. M., D. P. Larsen, and J. M. Omernik. 1986. Regional reference sites: A method for assessing stream pollution. Environmental Management 10:629.
Intergovernmental Task Force on Monitoring Water Quality. 1992. Ambient Water Quality Monitoring in the United States: First Year Review, Evaluation, and Recommendations. Washington, D.C.: Interagency Advisory Committee on Water Data.
Intergovernmental Task Force on Monitoring Water Quality. 1993. Ambient Water Quality Monitoring in the United States: Second Year Review, Evaluation, and Recommendations and Appendices . Washington, D.C.: Interagency Advisory Committee on Water Data.
Intergovernmental Task Force on Monitoring Water Quality. 1995. The Strategy for Improving Water-Quality Monitoring in the United States. Final report of the Intergovernmental Task Force on Monitoring Water Quality and Appendices. Washington, D.C.: Interagency Advisory Committee on Water Data.
Judy, R. D. Jr., P. N. Seely, T. M. Murray, S. C. Svirsky, M. R. Whitworth, and L. S. Ischinger. 1984. 1982 National Fisheries Survey, Vol. 1, Technical Report Initial Findings. FWS/OBS-84/06. Washington, D.C.: U.S. Fish and Wildlife Service.
Karr, J. R. 1981. Assessment of biotic integrity using fish communities. Fisheries 6(6):21-27.
Karr, J. R. 1991. Biological integrity: A long-neglected aspect of water resource management. Ecological Applications 1(1):66-84.
Karr, J. R., and D. R. Dudley. 1981. Ecological perspective on water quality goals. Environmental Management 5:55-68.
Karr, J. R., K. D. Fausch, P. L. Angermier, P. R. Yant, and I. J. Schlosser. 1986. Assessing biological integrity in running waters: A method and its rationale . Illinois Natural History Survey Special Publication 5. Champaign, Ill.: Illinois Natural History Survey.
Kerans, B. L., and J. R. Karr. 1992. An Evaluation of Invertebrate Attributes and a Benthic Index of Biotic Integrity for Tennessee Valley Rivers. Proceedings of the 1991 Midwest Pollution Biology Conference. EPA 905/R-92/003. Chicago, Ill.: U.S. Environmental Protection Agency.
Leonard, P. M., and D. J. Orth. 1986. Application and testing of an index of biotic integrity in small, coolwater streams. Transactions of the American Fisheries Society 115:401-414.
Lyons, J. 1992. Using the index of biotic integrity (IBI) to measure environmental quality in warmwater streams of Wisconsin. General Technical Report NC-149. St. Paul, Minn.: U.S. Department of Agriculture, Forest Service, North Central Forest Experimental Station.
Lyons, J., and L. Wang. 1996. Development and validation of an index of biotic integrity for coldwater streams in Wisconsin. North American Journal of Fisheries Management 16:241-256.
Miller, D. L., P. M. Leonard, R. M. Hughes, J. R. Karr, P. B. Moyle, L. H. Schrader, B. A. Thompson, R. A. Daniel, K. D. Fausch, G. A. Fitzhugh, J. R. Gammon, D. B. Halliwell, P. L. Angermeier, and D. J. Orth. 1988. Regional applications of an index of biotic integrity for use in water resource management. Fisheries 13:12-20.
Oberdorff, T., and R. M. Hughes. 1992. Modification of an index of biotic integrity based on fish assemblages to characterize rivers of the Seine-Normandie basin, France. Hydrobiologia 228:116-132.
Ohio Environmental Protection Agency (OEPA). 1987a. Biological Criteria for the Protection of Aquatic Life, Vol. 1, The Role of Biological Data in Water Quality Assessment. Columbus, Ohio: OEPA, Division of Water Quality Monitoring and Assessment, Surface Water Section.
Ohio Environmental Protection Agency (OEPA). 1987b. Biological Criteria for the Protection of Aquatic Life, Vol. 2, Users Manual for Biological Field Assessment of Ohio Surface Waters. Columbus, Ohio: OEPA, Division of Water Quality Monitoring and Assessment, Surface Water Section.
Ohio Environmental Protection Agency (OEPA). 1988. Ohio Water Quality Inventory—1988 305(b) Report, Vol. 1 and Executive Summary, E. T. Rankin, C. O. Yoder, and D. A. Mishne, eds. Columbus, Ohio: OEPA, Division of Water Quality Monitoring and Assessment.
Ohio Environmental Protection Agency (OEPA). 1989a. Biological Criteria for the Protection of Aquatic Life, Vol. 3, Standardized Biological Field Sampling and Laboratory Methods for Assessing Fish and Macroinvertebrate Communities . Columbus, Ohio: OEPA, Division of Water Quality Monitoring and Assessment.
Ohio Environmental Protection Agency (OEPA). 1989b. Addendum to Biological Criteria for the Protection of Aquatic Life, Vol. 2, Users Manual for Biological Field Assessment of Ohio Surface Waters. Columbus, Ohio: OEPA, Division of Water Quality Planning and Assessment, Surface Water Section.
Ohio Environmental Protection Agency (OEPA). 1990. Ohio Water Resource Inventory, Vol. 1, Summary, Status, and Trends, E. T. Rankin, C. O. Yoder, and D. A. Mishne, eds. Columbus, Ohio: OEPA, Division of Water Quality Planning and Assessment.
Ohio Environmental Protection Agency (OEPA). 1992. Biological and Habitat Investigation of Greater Cincinnati Area Streams: The Impacts of Interceptor Sewer Line Construction and Maintenance, Hamilton and Clermont Counties, Ohio. OEPA Technical Report EAS/1992-5-1. Columbus, Ohio: OEPA.
Ohio Environmental Protection Agency (OEPA). 1995. Ohio Water Resource Inventory, Vol. 1, Summary, Status, and Trends, E. T. Rankin, C. O. Yoder, and D. A. Mishne, eds. Ohio EPA Technical Bulletin MAS/1994-7-2-I. Columbus, Ohio: OEPA, Division of Surface Water.
Ohio Environmental Protection Agency (OEPA). 1996. Ohio Water Resource Inventory, Vol. 1, Summary, Status, and Trends, E. T. Rankin, C. O. Yoder , and D. A. Mishne, eds. Columbus, Ohio: OEPA.
Plafkin, J. L., M. T. Barbour, K. D. Porter, S. K. Gross, and R. M. Hughes. 1989. Rapid Bioassessment Protocols for Use in Rivers and Streams: Benthic Macroinvertebrates and Fish. EPA/444/4-89001. Washington, D.C.: U.S. Environmental Protection Agency.
Rankin, E. T., and C. O. Yoder. 1990a. A Comparison of Aquatic Life Use Impairment Detection and Its Causes between an Integrated, Biosurvey-Based Environmental Assessment and Its Water Column Chemistry Subcomponent, Vol. 1, Appendix 1. Ohio Water Resource Inventory. Columbus, Ohio: Ohio Environmental Protection Agency, Division of Water Quality Planning and Assessment.
Rankin, E. T., and C. O. Yoder. 1990b. The nature of sampling variability in the index of biotic integrity (IBI) in Ohio streams. Pp. 9-18 in Proceedings of the 1990 Midwest Pollution Control Biologists Conference, W. S. Davis, ed. EPA-905-9-90/005. Chicago, Ill.: U.S. Environmental Protection Agency, Region V, Environmental Sciences Division.
Steedman, R. J. 1988. Modification and assessment of an index of biotic integrity to quantify stream quality in southern Ontario. Canadian Journal of Fisheries and Aquatic Sciences 45:492-501.
Stevens, J. C., and S. W. Szczytko. 1990. The use and variability of the biotic index to monitor changes in an effluent stream following wastewater treatment plant upgrades. Pp. 33-46 in Proceedings of the 1990 Midwest Pollution Biology Meeting, W. S. Davis, ed. EPA-905-9-90/ 005. Chicago, Ill.: U.S. Environmental Protection Agency.
Suter, G. W., II. 1993. A critique of ecosystem health concepts and indexes. Environmental Toxicology and Chemistry 12:1533-1539.
United States Environmental Protection Agency, Office of Water Regulations and Standards. 1990. Biological Criteria, National Program Guidance for Surface Waters. EPA-440/5-90-004. Washington, D.C.: U.S. Environmental Protection Agency.
United States Environmental Protection Agency, Office of Research and Development, Environmental Research Laboratory. 1991. Environmental Monitoring and Assessment Program. EMAP—Surface Waters Monitoring and Research Strategy—Fiscal Year 1991. EPA/600/3-91/022. Corvallis, Ore.: U.S. Environmental Protection Agency.
United States Environmental Protection Agency, Office of Water. 1994. National Water Quality Inventory: 1992 Report to Congress. EPA 841-R-94-001. Washington, D.C.: U.S. Environmental Protection Agency.
Yoder, C. O. 1989. The development and use of biological criteria for Ohio rivers and streams. In Water Quality Standards for the 21st Century. G. H. Flock, ed. Washington, D.C.: Office of Water, U.S. Environmental Protection Agency.
Yoder, C. O. 1991a. Answering some concerns about biological criteria based on experiences in Ohio. In Water Quality Standards for the 21st century, G. H. Flock, ed. Washington, D.C.: U.S. Office of Water, Environmental Protection Agency .
Yoder, C. O. 1991b. The integrated biosurvey as a tool for evaluation of aquatic life use attainment and impairment in Ohio surface waters. In Biological Criteria: Research and Regulation. EPA-440/5-91-005:110. Washington, D.C.: Office of Water, U.S. Environmental Protection Agency.
Yoder, C. O., and E. T. Rankin. 1995a. Biological criteria program development and implementation in Ohio. Pp. 109-144 in Biological Assessment and Criteria: Tools for Water Resource Planning and Decision Making, W. Davis and T. Simon, eds. Boca Raton, Fla.: Lewis Publishers.
Yoder, C. O., and E. T. Rankin. 1995b. Biological response signatures and the area of degradation value: New tools for interpreting multimetric data. Pp. 263-286 in Biological Assessment and Criteria: Tools for Water Resource Planning and Decision Making, W. Davis and T. Simon, eds. Boca Raton, Fla.: Lewis Publishers.


