
Wire Codes
Whether developed as a stroke of serendipity or as a work of expert insight, wire codes and their relatively consistent association with disease end points have persisted and are largely responsible for continued interest in this avenue of research. Wire codes (or wiring configurations) were first used by Wertheimer and Leeper (1979). In that study, houses of cases and controls were classified as either high current configuration (HCC) or low current configuration (LCC), depending on the proximity of the house to several ''wiring classes." In a subsequent paper (Wertheimer and Leeper, 1982), high current configuration was further divided into very high current configuration (VHCC) and ordinary high current configuration (OHCC), and low current configuration was divided into ordinary low current configuration (OLCC) and end pole (VLCC).
The basic components of the wiring codes used by Wertheimer-Leeper are depicted in Figure B-1. As defined by Wertheimer and Leeper, Class 1 wiring comprises high-voltage transmission lines, distribution lines with six or more wires (more than one distribution circuit), or a single three-phase distribution circuit with thick wires. These power line configurations are shown schematically in Figure 2-1 (Chapter 2). Class 1 is represented by the two power-line configurations at the top of the figure. If a Class 1 wiring configuration lies within 50 feet of a home, that home is classified VHCC. If the home is 50 to 130 feet from the line it is OHCC.
Class 2 wiring refers to single-circuit three-phase distribution lines with thin wires. A Class 2 wiring configuration must lie within 25 feet of a home for that home to be classified VHCC. From 25 to 50 feet from Class 2 wiring, the home is classified OHCC, and from 50 to 130 feet, the home is classified OLCC.
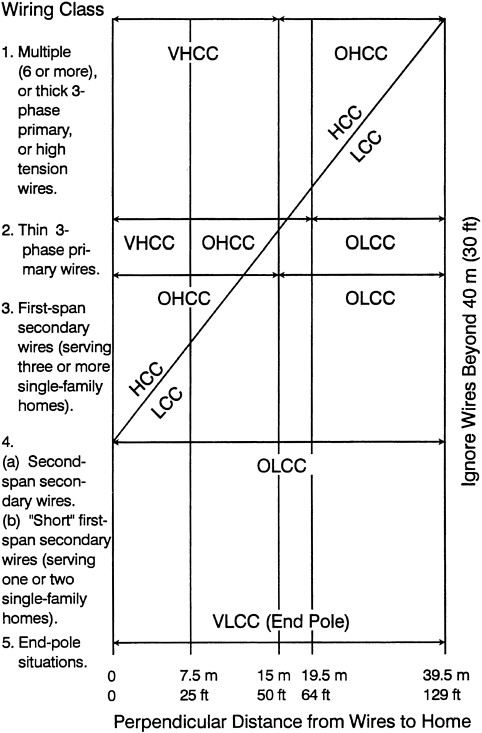
Distribution transformers, usually pole-mounted cylindrical devices, reduce the voltage from relatively high-voltage distribution lines that can carry thousands of volts to low-voltage wiring that normally carries 120 or 220 volts for use directly in homes. Classes 3, 4, and 5 wiring comprise only secondary wires from transformers at 120 and 220 volts.
Class 3 wiring configurations are only those secondary wires that are connected to the transformer on one end (first-span wires), and serve three or more homes. If a Class 3 wiring configuration is within 50 feet of a home, that home is coded OHCC. If the home is between 50 and 130 feet of the line, that home is classified OLCC.
Class 4 wiring configurations are second-span secondary wires that serve three or more homes or first-span secondary wires that serve one or two homes. Homes within 130 feet of Class 4 wiring configurations are coded as OLCC.
Class 5, or end-pole configurations, are secondary wiring configurations that serve only one or two homes and that are not attached directly to the transformer.
It should be noted that the first wire-coding system used by Wertheimer and Leeper (1979) had only two classifications, HCC and LCC. In that scheme the HCC homes comprise both VHCC and OHCC homes as defined above. Those classifications are represented by the shaded area in Figure B-1. The LCC homes include those described above as OLCC and end-pole and are represented in Figure B-1 as the unshaded area.
Various modifications have subsequently been made to the original Wertheimer-Leeper wire codes. Savitz et al. (1988) expanded them to include a separate "buried wire" category, and changed the name "end-pole configuration" to "very low current configuration;" this is the wire code shown in Figure 2-1 (Chapter 2). They found that the coding was very reliable, with agreement over 95% when the code was rescored by independent judges.
The Wertheimer-Leeper wire codes were developed as a nonintrusive way to assess in-home exposure to power-line magnetic flux density. Magnetic flux density is proportional to power-line current (or load) and decreases with distance, factors that were hypothesized to be related to cancer incidence. Magnetic fields also are not shielded by the walls of houses, so they are more likely to reflect residents' actual exposure to power lines than would electric fields, which are easily shielded. Wertheimer and Leeper (1979) also believed that "relatively continuous exposure" to low fields is "more effective than relatively brief but strong exposure" and that the wire codes, which remain the same for years, reflect relatively continuous exposure. Additionally, wire codes do not have the time variability of spot measurements and can be gathered without access to homes. Wertheimer and Leeper (1979) reported taking some magnetic-field measurements and found that wire codes correlated with those measurements.
Some studies have examined the stability of wire codes. In the "Back-to-Denver" study (Dovan et al. 1993), 81 homes were reexamined, comparing 1985 and 1990 coding. In one case, the wire configuration had been changed; for 91%
of the remaining, the two codings were in agreement. Differences arose from errors in estimating distance (four cases), thickness (two cases), and first span (one case).
MAGNETIC-FIELD MEASUREMENTS
As an alternative approach to the classification of magnetic fields in homes, direct measurements of the fields have been incorporated into epidemiologic studies (Tomenius 1986; Savitz et al. 1988; Severson et al. 1988; London et al. 1991). Because these studies are concerned with historical rather than contemporaneous exposures, the measurements should not be viewed as an inherently valid indicator of the magnetic-field exposure of the home occupants but as another potential marker for such exposure.
Measurements typically consist of "spot measurements," in which the magnetic field is measured at a point in time and a predetermined protocol is used to choose the location of the measurement in the home. For example, Savitz et al. (1988) obtained magnetic-field measurements in three standard locations (front door, parents' bedroom, and child's bedroom) and in rooms reported to be occupied by the child for 1 or more hours per day. In those locations, a measurement was taken near the center of the room, 1 m above the floor, but away from local field sources.
Other studies have incorporated longer time periods of measurement, often 24 hr, to incorporate short-term fluctuations. London et al. (1991) monitored exposure for a full day. In principle, the 24-hr measurements should yield a more accurate depiction of long-term exposures of interest and possibly yield a more accurate indication of historical exposures of etiologic interest.
WIRE CODES AND RESIDENTIAL MAGNETIC FIELDS
Prediction of Mean Fields and Variance in Fields
A few studies have examined the degree to which wire codes are associated with magnetic-field measurements. The largest and most recent investigation was based on the national study presented by the Electric Power Research Institute (EPRI),1 Survey of Residential Magnetic Field Sources, also known as the 1,000-home study (EPRI 1993a,b). For the underground wiring configuration, VLCC,
OLCC, OHCC, and VHCC, the median spot magnetic-field measurements were 0.05, 0.04, 0.06, 0.08, and 0.12 µT, and the field exceeded at 5% of the residences was 0.17, 0.19, 0.36, 0.61, and 0.64 µT.
Similar results were obtained in epidemiologic studies with smaller numbers of measurements in Denver (Wertheimer and Leeper 1982; Savitz et al. 1988), Seattle (Kaune et al. 1987), and Los Angeles (London et al. 1991), although the absolute values reported for the high-wire codes from Los Angeles were lower (Table B-1). Measurements in the first four studies listed in Table B-1 were generally made near the centers of rooms, away from obvious local magnetic-field sources. Because people spend some time near such local sources, somewhat higher values might be expected for personal exposure measurements, such as the EMDEX data in Table B-1, than for spot measurements (EPRI 1993c). The spot measurements were similar in VLCC and OLCC homes, increased in OHCC homes, and increased further in VHCC homes.
The magnetic fields used in Table B-1 from the Wertheimer and Leeper (1982), Savitz et al. (1988), and the EPRI (1993a,b) studies were all spot measurements. For the London et al (1991) study, 24-hr measurements were used. Although spot measurements were reported in the London study, they were inconsistent with the 24-hr measurements. The spot measurements, which were made near the centers of rooms, were much lower than the 24-hr measurements, which were made using a different type of instrument near the child's bed location. The bed was more likely to be near sources of magnetic fields. The 24-hr OHCC and VHCC measurements from the Los Angeles study are low in comparison to those from the Denver and Seattle studies (and the underground configuration, VLCC, and OLCC seem high), but they lie within a range that is consistent with the 1,000 home study data. The differences might be related to the comparatively larger proportion of homes in the OHCC and VHCC categories in the Los Angeles study or to the differences in distribution-wiring practices in Denver and Los Angeles, as noted by the authors.
The median field measurements of 0.05, 0.04, and 0.06 µT (0.5, 0.4 and 0.6
TABLE B-1 Measured Magnetic Fields and the Associated Wire-Code Current Configurations
|
|
Median Measured Field (µT) |
|||
|
Study |
VLCC |
OLCC |
OHCC |
VHCC |
|
Wertheimer and Leeper 1982 |
<0.05 |
µ0.05 |
0.12 |
0.25 |
|
Savitz et al. 1988 |
0.03 |
0.051 |
0.09 |
0.216 |
|
London et al. 1991 |
0.043 |
0.058 |
0.066 |
0.107 |
|
1000 Homes Study (EPRI 1993a,b) |
0.04 |
0.06 |
0.08 |
0.12 |
|
EMDEX Study (EPRI 1993c) |
0.063 |
0.09 |
0.124 |
0.205 |
|
Average |
0.044 |
0.065 |
0.096 |
0.180 |
mG) from the 1,000 homes study for the three lowest configurations (underground, VLCC, and OLCC) are very similar because they reflect sources within the residences (appliances and the grounding systems) as well as the power lines that determined the wire codes. The fields for the two highest wire codes (0.08 and 0.12 µT for OHCC and VHCC, respectively) reflect the power-line fields to a greater extent. The local sources within the home appear to add a random component that is more evident in low background fields (EPRI 1993c). The 1,000-homes study mathematically separated the power-line fields from other fields measured within the home, producing a clearer relationship between wire codes and power-line-derived magnetic fields; for underground, VLCC, OLCC, OHCC and VHCC, the median power-line 24-hr average field calculations were 0.03, 0.02, 0.04, 0.06, and 0.10 µT, respectively. On average, sources within residences appear to contribute about 0.02 µT for each of the wire codes.
Although the rank ordering of fields in homes is predicted reasonably well by wire codes, the total variance in fields is not accurately characterized by wire codes. The suggestion that local sources add a random component to residential measurements might help to explain why studies that examine the correlation between wire codes and spot measurements (or personal exposure) generally show low explained variance. In a number of studies, most of which are relatively small, the proportion of variance in measured fields accounted for by wire codes is reported. Kaune and co-workers reported that the Wertheimer-Leeper wire code accounts for about 15-20% of the measured low-power magnetic field in bedrooms in the Seattle (Kaune et al. 1987) and the Denver study (Kaune and Savitz 1994). Similarly, Bracken (1992) reported that wire-code categories accounted for little of the variance (10-16%) in magnetic-field measurements. Yost et al. (1992) found that wire codes were very weakly associated with the average magnetic field in the bedroom, having an explained variance of only 7%, but an alternative multivariate wire code reportedly yielded much higher explained variance (approximately 70%).
The Geomet study (EPRI 1992a), which involved 28 subjects in Frederick City, Maryland, found that wire codes explained 49-56% of the variance in various spot measurements. For a subset of 12 subjects, they found that 76% and 81% for winter and spring personal exposure measurements, respectively, were accounted for by wire codes. The authors of the Geomet study also suggested that the wire codes correlated more strongly with spot measurements that were averaged over two seasons than with season-specific measurements, suggesting that reduction in the random variations due to seasons enhances the predictiveness of wire codes. The study of adult leukemia by Severson et al. (1988) reported 17% explained variance in 24-hr magnetic-field measurements in a "limited sample of the residences." The Enertech study, in which two visits were made to 35 homes in Massachusetts and northern California, reported 36% and 37% explained variance for log-transformed personal exposures based on wire codes (EPRI 1992b).
The EMDEX residential study, a much larger, multicity study involving 993 visits to 380 residences served by 39 different electric utility companies, found that wire codes explained 16% and 17% of the variance in inside and outside spot measurements, respectively. Explained variance in long-term (at least 24-hr) stationary measurements in homes was 7% and that in personal exposure measurements in homes was 9% (EPRI 1993c). Analysis of the data gathered for the 1,000-homes study shows an approximate 10% explained variance of fields measured in bedrooms. The generally lower explained variance in the large multicity studies suggests that some other source of variance, such as differences in distribution-wiring practices among utilities, is involved (EPRI 1993c). That possibility suggests that wire codes might not be useful in multicity epidemiologic studies, if the average magnetic field is the exposure of interest.
Prediction of Categories of Fields
Because random magnetic-field sources in homes seem to dominate measurements for the three lowest wire-code categories (underground, VLCC, and OLCC), an alternative approach to assessing the usefulness of wire codes is to examine the extent to which the original dichotomous wire code (LCC and HCC) defines two exposure groups. That approach was used on the Enertech study data in a recent report by Kaune and Zaffanella (1994). In spite of the modest predictiveness of wire codes for fields overall, they found that 80% of the subjects with personal exposures above 0.2 µT were correctly classified based on their living in HCC homes, and 76% of the subjects with personal exposures below 0.2 µT were correctly classified based on living in LCC homes. A similar result was found in the Geomet study in which it was reported that wire codes correctly classified children's average exposure (above or below 0.2 µT) in about 77% of the cases (87% when only EMDEX-measured fields were considered).
The authors in the Enertech study pointed out that the homes in the study were not selected randomly but were chosen to have various combinations of ground-current and power-line magnetic-field sources. Because of this wire-code sampling bias, they explained, the estimates "may be different (most likely smaller) in a true random sample." The analysis can be improved by normalizing for the number of homes in the various categories and looking at ratios. Using Table B-2, four of five HCC houses in the Enertech study have fields above 0.2
TABLE B-2 Personal-Exposure Data from Kaune and Zaffanella (1994)
|
|
Wire Code |
||
|
Field |
LCC |
HCC |
Total Houses |
|
<0.2 µT |
16 |
5 |
21 |
|
>0.2 µT |
1 |
4 |
5 |
|
Total houses |
17 |
9 |
26 |
µT and 5 of 21 have fields below 0.2 µT, so that if a person lives in an HCC house, that person is 3.4 times more likely than a person in an LCC house (a 77% chance) to have an exposure over 0.2 µT. Similarly, if a person lives in an LCC house, that person is 3.8 times more likely than a person in an HCC house (a 79% chance) to have a personal exposure of 0.2 µT or less.
The Enertech and Geomet studies were small, so the analyses are statistically unreliable regardless of how the calculations are done. The same analysis can be done with data from the much larger EMDEX residential study. As seen in Table B-3, if a person lives in an HCC house, that person is 1.8 times more likely than a person in an LCC house to have a personal exposure over 0.2 µT (a 64% chance). If a person lives in an LCC house, that person is 1.7 times more likely than a person in an HCC house to have a personal exposure under 0.2 µT (a 63% chance).
Data from the 1,000-homes study permits the same type of calculation for average spot measurements at the centers of bedrooms instead of personal exposure (Table B-4). An HCC house is 2.3 times more likely than an LCC house to have a bedroom field over 0.2 µT (a 70% chance). A LCC house is 1.8 times more likely than an HCC house to have a bedroom field under 0.2 µT (a 64% chance).
The EMDEX residential study data permits the same calculation. Using a long-term mean magnetic field (Table B-5), an HCC house is 1.9 times more likely than an LCC house to have a bedroom field over 0.2 µT (a 66% chance). An LCC house is 1.5 times more likely than an HCC house to have a bedroom field under 0.2 µT (a 60% chance).
TABLE B-3 Personal-Exposure Data from the EMDEX Study (EPRI 1993c)
|
|
Wire Code |
||
|
Field |
LCC |
HCC |
Total Houses |
|
<0.2 µT |
357 |
190 |
547 |
|
>0.2 µT |
83 |
137 |
220 |
|
Total houses |
440 |
327 |
767 |
TABLE B-4 Spot-Measurement Data from the 1,000-Homes Study (EPRI 1993a,b)
|
|
Wire Code |
||
|
Field |
LCC |
HCC |
Total Houses |
|
<0.2 µT |
667 |
223 |
890 |
|
>0.2 µT |
39 |
54 |
93 |
|
Total houses |
706 |
277 |
983 |
TABLE B-5 Long-Term Measurements from the EMDEX Study (EPRI 1993c)
|
|
Wire Code |
||
|
Field |
LCC |
HCC |
Total Houses |
|
<0.2 µT |
476 |
267 |
743 |
|
>0.2 µT |
58 |
134 |
192 |
|
Total houses |
534 |
401 |
935 |
WIRE CODES AND PERSONAL EXPOSURE TO MAGNETIC FIELDS
The ultimate inferences from wire codes pertain not to characterizing the home's magnetic fields but rather characterizing the home occupant's magnetic-field exposure. A few studies mentioned above have obtained data pertinent to addressing the question of the extent to which wire codes provide valid estimates of individual exposure.
Wire codes reflect only power-line fields, which, as noted above, are only part of the residential exposure. Spot and long-term-average measurements are generally made near the centers of rooms away from obvious sources of magnetic fields, and personal-exposure measurements are made while the subjects move around the house. Because the subjects occasionally use or are close to appliances, personal-exposure measurements are generally higher than the spot or long-term-average magnetic-field measurements. Based on the measurements reported above, it appears that the average grounding system contributes about 0.02 µT (0.2 mG) to residential personal exposure (regardless of wire code); appliances contribute between 0.02 and 0.03 µT, and power lines contribute the remainder (0.02, 0.04, 0.06, and 0.10 µT for VLCC, OLCC, OHCC, and VHCC wire codes, respectively).
It should not be surprising, therefore, that wire codes account for only a relatively small fraction of the variance in residential background fields and residential personal exposure (approximately 18%). Most of the variance between people in personal exposure is a result of variation in exposure to residential sources (appliances and grounding system); in a recent study of children, the correlation coefficient between log-transformed 24-hr residential background fields and total personal exposure was 0.97 (Kaune et al. 1994).
Although the literature on wire codes, residential measurements, and personal exposure to magnetic fields is still quite incomplete, some tentative conclusions can be drawn. The replicated association of wire codes with residential magnetic fields extends to an association between wire codes and personal time-integrated exposure. As shown in the last section, use of wire codes to classify personal exposure into broad magnetic field categories (e.g., greater than 0.2 µT and less than 0.2 µT) appears to be somewhat more accurate than estimation of actual levels of exposure, for which the proportion of magnetic fields accounted for is
typically, but not always, under 20%. Wire codes (or residential measurements) might more accurately predict exposures of children, who spend a higher proportion of time in their home, than those of adults.
Refinements in Wire Codes
A number of attempts have been made to improve and simplify the Wertheimer-Leeper wire codes by using residential magnetic-field measurements as the standard. Using selected wiring characteristics to optimize the prediction of magnetic fields, Kaune et al. (1987) developed an approach that accounted for 52% of the variance, but that approach has not been shown to be generalizable to other settings. Leeper et al. (1991) reported that spun (wrapped) secondary wires are not good predictors of increased field strengths, but that first-span open secondary wires are. Using this information for the Denver study of Savitz et al. (1988) increases the odds ratio from 1.5 to 1.8, a modest increase because spun secondary wires were rare in the area (Leeper et al. 1991). A three-category wire code proposed more recently is reported to account for slightly more (21% vs. 18%) of the variance in homes in low-power magnetic-field measurements in bedrooms than the Wertheimer-Leeper code (Kaune and Savitz 1994). A recent report from Melbourne, Australia, optimized a wire code to suit their particular electric-distribution system and found an extremely strong relationship between their optimized wire code and 24-hr field measurements. Wire codes accounted for 72% of the variance in field strengths.
Efforts have been made to incorporate additional information on power loads or appliance use to refine the predictiveness of wire codes for measured fields. The Enertech study (EPRI 1992b) examined whether residential power use and utility load-flow records would help in extrapolating exposure predictions by using data from the date of the first visit to the date of the second visit and found that it was not helpful. Calculations using load-flow records are accurate when a transmission line is the sole outdoor magnetic-field source, but calculations are more difficult for distribution lines. Neighborhood homes were also found to contribute substantially to ground currents, and therefore to the fields, in many homes. The Geomet study used an appliance survey for a similar purpose. The survey conducted immediately after exposure monitoring had little predictive power (EPRI 1992a).
Overall, the evidence is fairly consistent that wire codes are weakly predictive of magnetic fields measured in the home. When statistical procedures to optimize the relationship are applied to a specific data set, the strength of the prediction improves markedly. However, unless such approaches can be generalized, they are of little value to subsequent investigators.
Historical Versus Contemporary Measurements
Studies to date are consistent in showing only a weak relationship between wire codes and measured fields, although the use of wire-code categories is more predictive of disease than measurements of present-day field strengths. The evidence linking contemporary magnetic-field spot measurements to cancer incidence is not as strong as the evidence for linking cancer to wire-code categories. However, if magnetic fields are the causal exposure, it is the historical, prediagnosis fields that are of interest, not the contemporary levels. Therefore, contemporary fields are of interest only to the extent that they are predictive of historical fields.
The study by Feychting and Ahlbom (1993) addressed that point in relation to fields from transmission lines in Sweden. They found that average low-power measurements of the magnetic field correlated better with contemporary calculations (0.70) than with historical calculations (0.52); that finding is illustrated in Figures B-2 and B-3. According to the authors, the result was taken ''as an
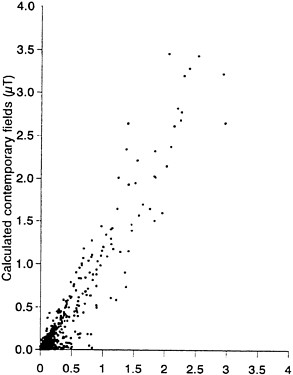
FIGURE B-2 Plot of calculated contemporary fields by low-power measurements: Children living close to 220- or 440-kV power lines in Sweden, 1960-1985. Source: Feychting and Ahlbom 1993. Reprinted with permission; copyright 1993, American Journal of Epidemiology, The Johns Hopkins University School of Hygiene and Public Health.
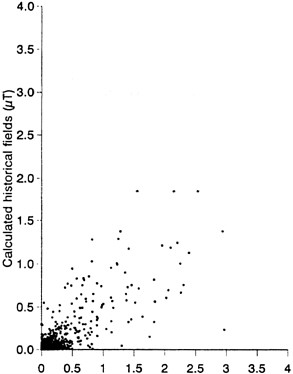
Figure B-3 Plot of calculated historical fields by low-power measurements: Children living close to 220- or 440-kV power lines in Sweden, 1960-1985. Source: Feychting and Ahlbom 1993. Reprinted with permission; copyright 1993, American Journal of Epidemiology, The Johns Hopkins University School of Hygiene and Public Health.
indication that contemporary fields would not be accurate as predictors of past fields."
In the Enertech study (EPRI 1992b), two sets of personal-exposure measurements were made (spring and winter, about 7 or 8 months apart). The correlation between the first-visit and the second-visit personal-exposure levels was "weak to nonexistent." The authors state, "The fact that personal exposures measured months apart in this study were weakly correlated, at best, raises questions as to the precision with which any set of contemporary measurements can be used to assess historical exposures to power-frequency magnetic-fields" (EPRI 1992b).
In contrast, in the Back-to-Denver study (Dovan et al. 1993), the overall correlation between log-transformed spot-measurements of the magnetic field made in 1985 and again in 1990 was 0.70. According to Kaune et al. (1994), that result provides "some evidence for the usefulness of contemporaneous measurements as estimators of historical exposures."
Kaune et al. (1994) examined the correlation in bedroom spot measurements over periods of up to 24 hr. The correlation in spot measurements was generally
greater than 0.9 for measurements taken within 3 hr; the correlations dropped to 0.7-0.8 when the time difference was 6-24 hr.
In the EMDEX residential project (EPRI 1993c), multiple measurements (up to five times over a 17-month period) were made at 380 homes; most homes were measured two or three times. The authors did not examine the correlation between successive measurements, but they did plot the difference between personal-exposure (and stationary measurement) means for pairs of visits as a function of the time between visits (which varied from 2 to 493 days, with a median of 148 days). There was no apparent pattern in the differences between means over time, as might be expected if the 24-hr trend of decreasing correlations (Kaune et al. 1994) continued over a period of weeks or months.
Unfortunately, the available studies do not provide a clear answer to the question of how predictive current magnetic fields are of past exposure levels. This issue is particularly challenging for researchers to address because the period of interest extends over years rather than days or months. At present, the overall impression is that present-day magnetic fields are somewhat predictive of historical fields, with correlations possibly as high as 0.5-0.8.
Variability in the Wire-Code and Magnetic-Field Association
Examination of the current literature on wire codes and residential magnetic-field strengths reveals several anomalous results. In principle, at least in the United States, a specific Wertheimer-Leeper wire-code category would be expected to correspond to approximately the same magnetic-field strength. Although that is the case in Denver (Wertheimer and Leeper 1979; Savitz et al. 1988) and Seattle (Kaune et al. 1987), it is not so clearly true in Los Angeles (London et al. 1991). Because the patterns of cancer risk in relation to the wire code are similar in Denver and Los Angeles, the inconsistency in the corresponding magnetic fields is particularly anomalous and warrants additional evaluation.
The study by Feychting and Ahlbom (1993) presents another apparent anomaly. For leukemia in children and exposure defined from calculated historical fields, the study shows an increase in estimated relative risks, which increase with level of exposure. However, when the data are stratified by type of home, the results seem to be confined to one-family homes; the results disappear for apartments. One possible explanation mentioned by the authors is that the small numbers make the relative risk estimated unstable.
Another possibility is that the calculation method was unsuitable for apartments (which frequently have hidden distribution wiring). When the Feychting and Ahlbom (1993) cross-tabulated contemporary calculated fields with spot measurements for one-family homes and for apartments, the agreement was considerably better for the one-family homes; the analysis also showed that the spot measurements (but not the calculated fields) were higher in apartments than in one-family homes.
The pattern of changes in field strengths in relation to power lines over time observed in Sweden (Feychting and Ahlbom 1993) raises the question of whether wire codes, which predict fields over time more generally, are accurate in predicting temporal changes. For example, when a given power line is constructed, it will be used at far less than its capacity, but over time the use will rise to its intended capacity and perhaps somewhat beyond. Thus, early in its life, the magnetic field predicted from the line will be too low and later it might be too high. Knowledge of such a pattern would be valuable and possibly could result in refinements in estimating magnetic-field exposure.
ALTERNATIVE MAGNETIC-FIELD INDICES
The relation of wire codes to measured fields depends, in part, on the aspect of magnetic field of interest. Much of the literature is concerned with determining the exact value of the field at each point in time (a series of spot measurements), implicitly assuming that all variability in field strengths (from one point in time to the next) is potentially important. An alternative assumption might be that the only important attribute of the magnetic field is whether it falls above or below some critical value. If that were the case, then the apparent predictiveness of the wire code would differ.
When magnetic fields are measured over an extended period, such as 24 or 48 hr, then additional decisions are required in establishing the index of interest. Time-integrated values have typically been the focus of attention, but a broad range of parameters based on percentiles, time above or below thresholds, and indicators of temporal variability might be as appropriate. An approach to better understanding wire codes might be to ask what aspects of magnetic fields they do predict well. For example, they might accurately predict time above a low threshold (e.g., 0.1 µT), yet poorly predict time-integrated residential field strengths. The same concerns apply to personal exposures, which are collected over some extended time.
Kaune et al. (1994) examined the relation between wire codes and other magnetic-field characteristics (such as peak field, fields above a minimum threshold, and occasional or frequent changes in field strength), but found that none was more strongly correlated with the wire-code category than it was with the arithmetic mean of the 24-hr bedroom magnetic field. The EMDEX residential project found no relation between wire-code categories and maximum field strengths, nor was it found between wire-code categories and first measured differences in personal exposures (an estimate of field variance) (EPRI 1993c).
WIRE CODES AND TRANSIENT AND VARIABLE FIELDS
In a study of residential transient magnetic fields (EPRI 1994a), the authors found that transients within the home might be (1) random, originating from
manual and automatic switching devices, such as those associated with lights and appliances, or (2) repetitive, originating from electronic controllers, such as dimmer switches, that produce transients twice per power-frequency cycle. They also found that the rate of occurrence of transients increases from residential locations to business and industrial locations. Transients might propagate from a residence or business through secondary distribution wiring to neighboring residences and along ground pathways (conductive plumbing pipes). Switching operations in the primary distribution lines can also generate transients within the residences.
Personal exposure to transient fields is extremely complex because of their strong spatial dependence. Exposure to high-frequency fields is typically due to sources within the residence, but exposure to low-frequency fields can also be due to external sources in the neighborhood.
The authors suggest that "higher current configurations may correlate locally with higher demand indicating either increased population density or individual customers with large current usage such as industries or businesses. Thus, a residence classified as being in a 'higher' current configuration would more likely be in a locale where the rate of transient occurrence is higher, because of the likelihood of having more neighbors or being closer to businesses and industries. Furthermore, such a residence would be physically closer to neighboring transient sources, implying shorter propagation distances and an increased probability of 'receiving' a transient generated at a neighboring residence" (EPRI 1994a).
On the other hand, current flows are generally more variable at points in the power-delivery system that serve fewer customers; therefore, the most uniform power flows should be found on the multiple or thick three-phase primary lines and high-tension lines near high current configuration (HCC) homes. So, if the causal exposure is related to long-period variability, it would probably not correlate with the average field strength or with wire codes.


