
7
Vitamin D
BACKGROUND INFORMATION
Overview
Vitamin D (calciferol), which comprises a group of fat soluble seco-sterols that are found in very few foods naturally, is photosynthesized in the skin of vertebrates by the action of solar ultraviolet B radiation (Holick, 1994). Vitamin D comes in many forms, but the two major physiologically relevant ones are vitamin D2 (ergocalciferol) and vitamin D3 (cholecalciferol) (Fieser and Fieser, 1959). Vitamin D2 originates from the yeast and plant sterol, ergosterol; vitamin D3 originates from 7-dehydrocholesterol, a precursor of cholesterol, when synthesized in the skin (Figure 7-1). Major metabolic steps involved with the metabolism D2 are similar to those of the metabolism of D3. Vitamin D without a subscript represents either D2 or D3 or both and is biologically inert, requiring two obligate hydroxylations to form its biologically active hormone, 1,25-dihydroxyvitamin D (1,25(OH)2D) (DeLuca, 1988; Reichel et al., 1989).
Vitamin D's major biologic function in humans is to maintain serum calcium and phosphorus concentrations within the normal range by enhancing the efficiency of the small intestine to absorb these minerals from the diet (DeLuca, 1988; Reichel et al., 1989) (Figure 7-2). 1,25(OH)2D enhances the efficiency of intestinal calcium absorption along the entire small intestine, but primarily in the duodenum and jejunum. 1,25(OH)2D3 also enhances dietary phosphorus absorption along the entire small intestine (Chen et
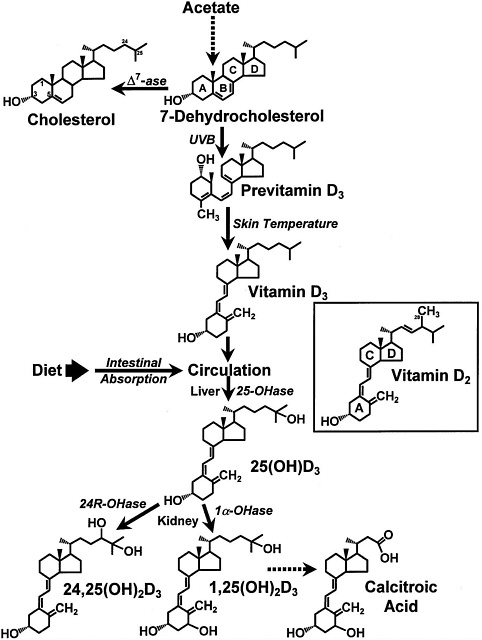
FIGURE 7-1 The photochemical, thermal, and metabolic pathways for vitamin D3. Specific enzymes abbreviated as follows: ∆7ase,7-dehydrocholesterol reductase; 25OHase, vitamin D-25-hydroxylase; 1α-OHase, 25-OH-D-1α-hydroxylase; 24R-OHase, 25(OH)D-24R-hydroxylase. Inset: the structure of vitamin D2. Reproduced with permission, Holick (1996).
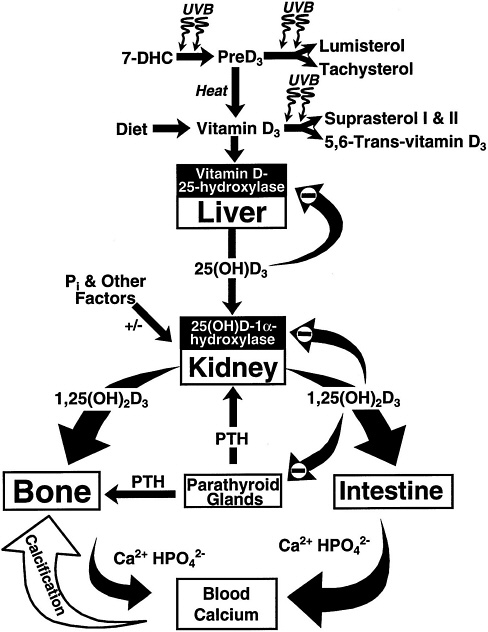
FIGURE 7-2 Photosynthesis of vitamin D3 and the metabolism of vitamin D3 to 25(OH)D3 and 1,25 (OH)2D3. Once formed, 1,25(OH)2D3 carries out the biologic functions of vitamin D3 on the intestine and bone. Parathyroid hormone (PTH) promotes the synthesis of 1,25(OH)2D3, which, in turn, stimulates intestinal calcium transport and bone calcium mobilization, and regulates the synthesis of PTH by negative feedback. Reproduced with permission, Holick (1996).
al., 1974), but its major influence is in the jejunum and ileum. When dietary calcium intake is inadequate to satisfy the body's calcium requirement, 1,25(OH)2D, along with parathyroid hormone (PTH), mobilizes monocytic stem cells in the bone marrow to become mature osteoclasts (Holick, 1995; Merke et al., 1986). The osteoclasts, in turn, are stimulated by a variety of cytokines and other factors to increase the mobilization of calcium stores from the bone (Figure 7-2). Thus, vitamin D maintains the blood calcium and phosphorus at supersaturating concentrations that are deposited in the bone as calcium hydroxyapatite.
A multitude of other tissues and cells in the body can recognize 1,25(OH)2D (Stumpf et al., 1979). Although the exact physiologic function of 1,25(OH)2D in the brain, heart, pancreas, mononuclear cells, activated lymphocytes, and skin remains unknown, its major biologic function has been identified as a potent antiproliferative and prodifferentiation hormone (Abe et al., 1981; Colston et al., 1981; Eisman et al., 1981; Smith et al., 1987). There is little evidence that vitamin D deficiency leads to major disorders in these organ and cellular systems.
Physiology of Absorption, Metabolism, and Excretion
Because dietary vitamin D is fat soluble once it is ingested, it is incorporated into the chylomicron fraction and absorbed through the lymphatic system (Holick, 1995). It is estimated that approximately 80 percent of the ingested vitamin D enters the body via this mechanism. Vitamin D is principally absorbed in the small intestine.
Vitamin D is principally excreted in the bile. Although some of it is reabsorbed in the small intestine (Nagubandi et al., 1980), the enterohepatic circulation of vitamin D is not considered to be an important mechanism for its conservation (Fraser, 1983). However, since vitamin D is metabolized to more water-soluble compounds, a variety of vitamin D metabolites, most notably calcitroic acid, are excreted by the kidney into the urine (Esvelt and DeLuca, 1981).
Once vitamin D enters the circulation from the skin or from the lymph via the thoracic duct, it accumulates in the liver within a few hours. In the liver, vitamin D undergoes hydroxylation at the 25-carbon position in the mitochondria, and soon thereafter, it appears in the circulation as 25-hydroxyvitamin D (25(OH)D) (DeLuca, 1984) ( Figure 7-1 and Figure 7-2). The circulating concentration of 25(OH)D is a good reflection of cumulative effects of exposure to sunlight and dietary intake of vitamin D (Haddad and Hahn, 1973; Holick, 1995; Lund and Sorensen, 1979). In the liver, vitamin D-25-
hydroxylase is regulated by vitamin D and its metabolites, and therefore, the increase in circulating concentration of 25(OH)D after exposure to sunlight or ingestion of vitamin D is relatively modest compared with cumulative production or intake of vitamin D (Holick and Clark, 1978). The appearance in the blood of the parent compound, vitamin D, is short-lived as it is either stored in the fat or metabolized in the liver (Mawer et al., 1972). The half-life of 25(OH)D in the human circulation is approximately 10 days to 3 weeks (Mawer et al., 1971; Vicchio et al., 1993). Administration of 25(OH)D results in approximately two to five times more activity than giving vitamin D itself in curing rickets and in inducing intestinal calcium absorption and mobilization of calcium from bones in rats. However, at physiologic concentrations, it is biologically inert in affecting these functions (DeLuca, 1984).
In order to have biologic activity at physiologic concentrations, 25(OH)D must be hydroxylated in the kidney on the 1-carbon position to form 1,25(OH)2D (Holick et al., 1971; Lawson et al., 1971) (Figure 7-1 and Figure 7-2). It is 1,25(OH)2D that is thought to be the biologically active form of vitamin D and that is responsible for most, if not all, of its biologic functions (DeLuca, 1988; Fraser, 1980; Reichel et al., 1989). The production of 1,25(OH)2D in the kidney is tightly regulated, principally through the action of PTH in response to serum calcium and phosphorus levels (DeLuca, 1984; Portale, 1984; Reichel et al., 1989) (Figure 7-2). The half-life of 1,25(OH)2D in the circulation of humans is approximately 4 to 6 hours (Kumar, 1986). Because of the tight regulation of the production of 1,25(OH) 2D and its relatively short serum half-life, it has not proven to be a valuable marker for vitamin D deficiency, adequacy, or excess.
25(OH)D and 1,25(OH)2D may undergo a hydroxylation on the 24-carbon to form their 24-hydroxy counterparts, 24,25-dihydroxyvitamin D (24,25(OH)2D) (Figure 7-1) and 1,24,25-trihydroxyvitamin D (DeLuca, 1984; Holick, 1995). It is believed that the 24-carbon hydroxylation is the initial step in the metabolic degradation of 25(OH)D and 1,25(OH)2D (DeLuca, 1988). The final degradative product of 1,25 (OH)2D3 is calcitroic acid, which is excreted by the kidney into the urine (Esvelt and DeLuca, 1981) (Figure 7-1).
Although the kidney supplies the body with 1,25(OH)2D to regulate calcium and bone metabolism, it is recognized that activated macrophages, some lymphoma cells, and cultured skin and bone cells also make 1,25(OH)2D (Adams et al., 1990; Holick, 1995; Pillai et al., 1987). Although the physiologic importance of locally produced 1,25 (OH)2D is not well understood, the excessive unregulat-
ed production of 1,25(OH)2D by activated macrophages and lymphoma cells is responsible for the hypercalciuria associated with chronic granulomatous disorders and the hypercalcemia seen with lymphoma (Adams, 1989; Davies et al., 1994).
Factors Affecting the Vitamin D Requirement
Special Populations
Elderly. Aging significantly decreases the capacity of human skin to produce vitamin D3 (MacLaughlin and Holick, 1985). In adults over age 65 years, there is a fourfold decrease in the capacity to produce vitamin D3 when compared with younger adults aged 20 to 30 years (Holick et al., 1989; Need et al., 1993). Although one study suggested that there may be a defect in intestinal calcium absorption of tracer quantities of vitamin D3 in the elderly (Barragry et al., 1978), two other studies demonstrated that aging does not significantly affect absorption of pharmacologic doses of vitamin D (Clemens et al., 1986; Holick, 1986). It is not known whether the absorption of physiologic amounts of vitamin D is altered in the elderly.
Malabsorption Disorders. Patients suffering from various intestinal malabsorption syndromes such as severe liver failure, Crohn's disease, Whipple's disease, and sprue often suffer from vitamin D deficiency because of their inability to absorb dietary vitamin D (Lo et al., 1985). Thus, patients who are unable to secrete adequate amounts of bile or who have a disease of the small intestine are more prone to develop vitamin D deficiency owing to their inability to absorb this fat-soluble vitamin.
Sources of Vitamin D
Vitamin D intake from food and nutrient supplements is expressed in either international units (IU) or micrograms (µg). One IU of vitamin D is defined as the activity of 0.025 µg of cholecalciferol in bioassays with rats and chicks. Thus, the biological activity of 1 µg of vitamin D is 40 IU. The activity of 25(OH)D is 5 times more potent than cholecalciferol; thus, 1 IU = 0.005 µg 25(OH)D.
Sunlight
Throughout the world, the major source of vitamin D for humans is the exposure of the skin to sunlight (Holick, 1994). During sun
exposure, the ultraviolet B photons with energies between 290 and 315 nm are absorbed by the cutaneous 7-dehydrocholesterol to form the split (seco) sterol previtamin D3 (Holick et al., 1980; MacLaughlin et al., 1982). This photosynthesis of vitamin D occurs in most plants and animals (Holick et al., 1989).
However, a variety of factors limit the cutaneous production of vitamin D3. Excessive exposure to sunlight causes a photodegradation of previtamin D3 and vitamin D3 to ensure that vitamin D3 intoxication cannot occur (Holick, 1994; Holick et al., 1981; Webb et al., 1989) (Figure 7-2). An increase in skin melanin pigmentation or the topical application of a sunscreen will absorb solar ultraviolet B photons and thereby significantly reduce the production of vitamin D3 in the skin (Clemens et al., 1982; Matsuoka et al., 1987). Latitude, time of day, and season of the year have a dramatic influence on the cutaneous production of vitamin D3. Above and below latitudes of approximately 40° N and 40° S, respectively, vitamin D3 synthesis in the skin is absent during most of the three to four winter months (Ladizesky et al., 1995; Webb et al., 1988). The far northern and southern latitudes extend this period for up to 6 months (Holick, 1994; Oliveri et al., 1993).
Dietary Intake
Accurate estimates of vitamin D intakes in the United States are not available, in part because the vitamin D composition of fortified foods is highly variable (Chen et al., 1993; Holick et al., 1992) and because the U.S. intake surveys do not include estimates of vitamin D intake. Using food consumption data from the second National Health and Nutrition Examination Survey (NHANES II), median vitamin D intakes from food by young women were estimated to be 2.9 µg (114 IU)/day, with a range of 0 to 49 µg (0 to 1,960 IU)/day (Murphy and Calloway, 1986). A similar median vitamin D intake, 2.3 µg (90 IU)/day, was estimated for a sample of older women (Krall et al., 1989).
Food Sources
In nature, very few foods contain vitamin D. Those that do include some fish liver oils, the flesh of fatty fish, the liver and fat from aquatic mammals such as seals and polar bears, and eggs from hens that have been fed vitamin D (Holick, 1994; Jeans, 1950). Almost all of the human intake of vitamin D from foods comes from fortified milk products and other fortified foods such as breakfast cereals. The vitamin D content of unfortified foods is generally low, with the exception of fish, many of which contain 5 to 15 µg (200 to
600 IU)/100 g; Atlantic herring contain up to as much as 40 µg (1,600 IU)/100 g (USDA, 1991).
After vitamin D was recognized as being critically important for the prevention of rickets, the United States, Canada, and many other countries instituted a policy of fortifying some foods with vitamin D (Steenbock and Black, 1924). Milk was chosen as the principal dietary component to be fortified with either vitamin D2 or vitamin D3. In other countries, some cereals, margarine, and breads also have small quantities of added vitamin D (Lips et al., 1996). In the United States and Canada, all milk, irrespective of its fat content, is fortified with 10 µg (400 IU)/quart and 9.6 µg (385 IU)/liter, respectively, of vitamin D. However, during the past decade, three surveys in which the vitamin D content in milk was analyzed revealed that up to 70 percent of milk sampled throughout the United States and Canada did not contain vitamin D in the range of 8 to 12 µg (320 to 480 IU)/quart (the 20 percent variation allowed by current labeling standards). Furthermore, 62 percent of 42 various milk samples contained less than 8 µg (320 IU)/quart of vitamin D, and 14 percent of skim milk samples had no detectable vitamin D (Chen et al., 1993; Holick et al., 1992; Tanner et al., 1988). All proprietary infant formulas must also contain vitamin D in the amount of 10 µg (400 IU)/liter. However, these products have also been found to have wide variability in their vitamin D content (Holick et al., 1992).
Intake from Dietary Supplements
In the one available study of dietary supplement intake in the United States, use of vitamin D supplements in the previous 2 weeks in 1986 was reported for over one-third of the children 2 to 6 years of age, over one-fourth of the women, and almost 20 percent of the men (Moss et al., 1989). For supplement users, the median dose was the same for men, women, and children: 10 µg (400 IU)/day. However, the ninety-fifth percentile was the same as the median for the children (still 10 µg [400 IU]/day), indicating little variation in the upper range for young children, while the ninety-fifth percentile for adults was considerably higher: 20 µg (800 IU)/day for men and 17.2 µg (686 IU)/day for women.
Effects of Vitamin D Deficiency
Vitamin D deficiency is characterized by inadequate mineralization or demineralization of the skeleton. In children, vitamin
D deficiency results in inadequate mineralization of the skeleton causing rickets, which is characterized by widening at the end of the long bones, rachitic rosary, deformations in the skeleton including frontal bossing, and outward or inward deformities of the lower limbs causing bowed legs and knocked knees, respectively (Goldring et al., 1995). In adults, vitamin D deficiency leads to a mineralization defect in the skeleton causing osteomalacia. In addition, the secondary hyperparathyroidism associated with vitamin D deficiency enhances mobilization of calcium from the skeleton, resulting in porotic bone (Favus and Christakos, 1996).
Any alteration in the cutaneous production of vitamin D3, the absorption of vitamin D in the intestine, or the metabolism of vitamin D to its active form, 1,25(OH)2D, can lead to a vitamin D-deficient state (Demay, 1995; Holick, 1995). In addition, an alteration in the recognition of 1,25(OH) 2D by its receptor can also cause vitamin D deficiency, metabolic bone disease, and accompanying biochemical abnormalities (Demay, 1995).
Vitamin D deficiency causes a decrease in ionized calcium in blood, which in turn leads to an increase in the production and secretion of PTH (Fraser, 1980; Holick, 1995). PTH stimulates the mobilization of calcium from the skeleton, conserves renal loss of calcium, and causes increased renal excretion of phosphorus leading to a normal fasting serum calcium with a low or low-normal serum phosphorus (Holick, 1995). Thus, vitamin D deficiency is characterized biochemically by either a normal or low-normal serum calcium with a low-normal or low-fasting serum phosphorus and an elevated serum PTH. Serum alkaline phosphatase is usually elevated in vitamin D deficiency states (Goldring et al., 1995). The elevated PTH leads to an increase in the destruction of the skeletal tissue in order to release calcium into the blood. The bone collagen by-products, including hydroxyproline, pyridinoline, deoxypyridinoline, and N-telopeptide, are excreted into the urine and are usually elevated (Kamel et al., 1994).
It is well recognized that vitamin D deficiency causes abnormalities in calcium and bone metabolism. The possibility that vitamin D deficiency is associated with an increased risk of colon, breast, and prostate cancer was suggested in epidemiologic surveys of people living at higher latitudes (Garland et al., 1985, 1990; Schwartz and Hulka, 1990). At this time, it is premature to categorically suggest that vitamin D deficiency increases cancer risk. Prospective studies need to be carried out to test the hypothesis.
ESTIMATING REQUIREMENTS FOR VITAMIN D
Selection of Indicators for Estimating the Vitamin D Requirement
Serum 25(OH)D
The serum 25(OH)D concentration is the best indicator for determining adequacy of vitamin D intake of an individual since it represents a summation of the total cutaneous production of vitamin D and the oral ingestion of either vitamin D2 or vitamin D3 (Haddad and Hahn, 1973; Holick, 1995). Thus, serum 25(OH)D will be used as the primary indicator of vitamin D adequacy.
The normal range of serum 25(OH)D concentration is the mean serum 25(OH)D ± 2 standard deviations (SD) from a group of healthy individuals. The lower limit of the normal range can be as low as 20 nmol/liter (8 ng/ml) and as high as 37.5 nmol/liter (15 ng/ml) depending on the geographic location where the blood samples were obtained. For example, the lower and upper limits of the normal range of 25(OH)D in California will be higher than those limits in Boston (Clemens and Adams, 1996). Two pathologic indicators, radiologic evidence of rickets (Demay, 1995) and biochemical abnormalities associated with metabolic bone disease, including elevations in alkaline phosphatase and PTH concentrations in the circulation (Demay, 1995), have been correlated with serum 25(OH)D. A 25(OH)D concentration below 27.5 nmol/liter (11 ng/ml) is considered to be consistent with vitamin D deficiency in infants, neonates, and young children (Specker et al., 1992) and is therefore used as the key indicator for determining the vitamin D reference value.
Little information is available about the level of 25(OH)D that is essential for maintaining normal calcium metabolism and peak bone mass in older children and in young and middle-aged adults. For the elderly, there is mounting scientific evidence to support their increased requirement for dietary vitamin D in order to maintain normal calcium metabolism and maximize bone health (Dawson-Hughes et al., 1991; Krall et al., 1989; Lips et al., 1988). Therefore, the serum 25(OH)D concentration was utilized to evaluate vitamin D deficiency in this age group, but it was not the only indicator used to determine the vitamin D reference value for the elderly.
Serum PTH concentrations are inversely related to 25(OH)D serum levels (Krall et al., 1989; Kruse et al., 1984; Lips et al., 1988; Webb et al., 1990; Zeghoud et al., 1997). Therefore, the serum PTH
concentration, in conjunction with 25(OH)D, has proven to be a valuable indicator of vitamin D status.
The few studies conducted in African Americans and Mexican Americans suggest that these population groups have lower circulating concentrations of 25(OH)D and higher serum concentrations of PTH and 1,25(OH)2D when compared with Caucasians (Bell et al., 1985; Reasner et al., 1990). It is likely that increased melanin pigmentation (which decreases the cutaneous production of vitamin D) and the lack of dietary vitamin D (due to a high incidence of lactose intolerance) are the contributing causes for this.
Serum Vitamin D
The serum concentration of vitamin D is not indicative of vitamin D status. As stated previously, its half-life is relatively short, and the blood concentrations can range from 0 to greater than 250 nmol/liter (0 to 100 ng/ml) depending on an individual's recent ingestion of vitamin D and exposure to sunlight.
Serum 1,25(OH)2D
Similarly, the serum 1,25(OH)2D level is not a good indicator of vitamin D. This hormone's serum concentrations are tightly regulated by a variety of factors, including circulating levels of serum calcium, phosphorus, parathyroid hormone, and other hormones (Fraser, 1980; Holick, 1995).
Evaluation of Skeletal Health
The ultimate effect of vitamin D on human health is maintenance of a healthy skeleton. Thus, in reviewing the literature for determining vitamin D status, one of the indicators that has proven to be valuable is an evaluation of skeletal health. In neonates and children, bone development and the prevention of rickets, either in combination with serum 25(OH)D and PTH concentrations, or by itself, are good indicators of vitamin D status (Gultekin et al., 1987; Koo et al., 1995; Kruse et al., 1984; Markested et al., 1986; Meulmeester et al., 1990). For adults, bone mineral content (BMC), bone mineral density (BMD), and fracture risk, in combination with serum 25(OH)D and PTH concentrations, have proven to be the most valuable indicators of vitamin D status (Brazier et al., 1995; Dawson-
Hughes et al., 1991, 1995; Lamberg-Allardt et al., 1989, 1993; Sorva et al., 1991; Webb et al., 1990).
Recommendations for Adequate Intake
The recommendation for how much vitamin D is required to maintain adequate calcium metabolism and good bone health for all ages may be considered the easiest, as well as at times the most difficult, to determine. Humans of all ages, races, and both sexes can obtain all of their body's requirement for vitamin D through exposure to an adequate amount of sunlight. However, the sunlight-mediated synthesis of vitamin D in the skin is profoundly affected by a wide variety of factors, including degree of skin pigmentation, latitude, time of day, season of the year, weather conditions, and the amount of body surface covered with clothing or sunscreen (Holick, 1994). Therefore, it is very difficult to determine an accurate value for an Estimated Average Requirement (EAR) as most of the studies are subject to one or more of these variables, especially exposure to sunlight, which is difficult to quantitate.
Vitamin D is a hormone, and therefore, when considering the requirements for vitamin D, EARs would represent gross estimates of the need for the active hormone. The only studies that provide an approximation of how much vitamin D is required to maintain an individual's serum 25(OH)D concentration above that associated with abnormalities in BMD are ones that have been conducted in the winter at far northern and southern latitudes where exposure to sunlight does not produce any significant quantities of vitamin D (Ladizesky et al., 1995; Markestad and Elzouki, 1991). However, these studies still do not account for subjects' exposure to sunlight in the spring, summer, and fall when the cutaneous synthesis of vitamin D occurs and it is stored in the body fat for use in the winter.
Another limitation of the reported studies is the assumption made regarding the vitamin D content of various foods. Despite government mandates for vitamin D fortification of milk in both the United States and Canada, actual analysis has shown this fortification to be highly variable (Chen et al., 1993; Holick et al., 1992; Tanner et al., 1988). Furthermore, the amount of vitamin D found naturally in foods, such as fish liver oils, fatty fish, and egg yolks, is very dependent on the time of the year these foods are harvested. Studies that report the dietary intake of vitamin D based on the expected amount of vitamin D fortification of milk, margarine, cereals, and breads are highly suspect because the analysis of the vitamin D con-
tent in the foods at the time of the studies may have been either inadequate or not determined (Chen et al., 1993; Holick et al., 1992; Tanner et al., 1988). Although dietary intake studies rarely conduct simultaneous analysis of the chemical composition of food, it is assumed that the data in the food composition database are adequate.
Infants aged 0 to 6 months who are born in the late fall in far northern and southern latitudes can only obtain vitamin D from their own stores, which have resulted from transplacental transfer in utero, or from that provided by the diet, including mother's breast milk, infant formula, or supplements. Because human milk has very little vitamin D, breast-fed infants who are not exposed to sunlight are unlikely to obtain adequate amounts of vitamin D from mother's milk to satisfy their needs beyond early infancy (Nakao, 1988; Specker et al., 1985b). Therefore, an Adequate Intake (AI) for infants ages 0 through 12 months is based on the lowest dietary intake of vitamin D that has been associated with a mean serum 25(OH)D concentration greater than 2.2 IU (11 mg)/liter (the lower limit of normal). Further, it is assumes no exogenous source of vitamin D from sunlight exposure.
Children aged 1 through 18 years and most adults obtain some of their vitamin D requirement from sunlight exposure. Since the issue of sunlight exposure confounds the literature, intake data are not available to determine an EAR, a true estimated average requirement, that can be strongly supported as a value at which half of the population group for which it is derived would be at increased risk of inadequate serum 25(OH)D. In addition, no studies have evaluated how much vitamin D is required to maintain normal blood levels of 25(OH)D and PTH in children or adults who have been deprived of sunlight and dietary vitamin D for a period of more than 6 months. Because sufficient scientific data are not available to estimate an EAR, an AI will be the reference value developed for vitamin D. The AI represents the intake that is considered likely to maintain adequate serum 25(OH)D for individuals in the population group who have limited but uncertain sun exposure and stores, multiplied by a safety factor of 100 percent for those unable to obtain sunlight. When consumed by an individual, the AI is sufficient to minimize the risk of low serum 25 (OH)D and may actually represent an overestimate of true biological need.
The recommended AI assumes that no vitamin D is available from sun-mediated cutaneous synthesis. This synthesis is especially important for calcium metabolism and bone health for the very young and for older adults. It is well documented that infants and young
children who live in far northern latitudes are at high risk for developing rickets (Lebrun et al., 1993). At the other end of the age spectrum, older adults are more prone to developing vitamin D deficiency (Holick et al., 1989; Need et al., 1993). Indeed, vitamin D deficiency is now a significant concern in adults over the age of 50 years who live in the northern industrialized cities of the world (Dawson-Hughes et al., 1991; Gloth et al., 1995; Lips et al., 1988).
FINDINGS BY LIFE STAGE AND GENDER GROUP
Ages 0 through 6 Months
Indicators Used to Estimate the AI
Human Milk. The vitamin D available to the infant during the first 6 months of life depends initially on the vitamin D status of the mother during pregnancy and later on the infant's exposure to sunlight and diet. Conservative estimates of the length of time a human milk-fed infant in the Midwest must be exposed to sunlight to maintain serum concentrations above the lower limit of normal are 2 hours/week with only the face exposed to sunlight or 30 minutes/week with just a diaper on (Specker et al., 1985b). Human milk contains low amounts of vitamin D, and colostrum averages 397 ± 216 ng (15.9 ± 8.6 IU)/liter of vitamin D (Nakao, 1988). In a population of 25 Caucasian and African American women who had a mean vitamin D intake of 11.4 µg (457 IU)/day, milk concentrations of vitamin D and 25(OH)D were 315 ng (12.6 IU)/liter and 188 ng (37.6 IU)/liter respectively, with a total of 51 IU/liter of biologic activity (1 IU of vitamin D = 25 ng and 1 IU of 25(OH)D = 5 ng). Women consuming 15 to 17.5 µg (600 to 700 IU)/day of vitamin D had total milk vitamin D concentrations ranging from 120 to 3,400 ng (5 to 136 IU)/liter with a predicted mean of 645 ng (26 IU)/liter (Specker et al., 1985b). Although maternal vitamin D intake is associated with the vitamin D content of human milk, the latter is not correlated with the infant 's serum 25(OH)D concentrations, due to the overwhelming effect of sunlight exposure on the infant's vitamin D status (Ala-Houhala, 1985; Ala-Houhala et al., 1986; Feliciano et al., 1994; Hillman, 1990; Markestad and Elzouki, 1991).
Serum 25(OH)D, Linear Growth, and Bone Mass. Although an individual's serum 25(OH)D concentration is the best biochemical
marker of vitamin D status, functional indicators of bone length and reduced bone mass (rickets in the extreme form) serve as useful evaluative outcomes of deficiency. Vitamin D intakes between 8.5 and 15 µg (340 and 600 IU)/day would have the maximum effect on linear growth (Feliciano et al., 1994; Fomon et al., 1966; Jeans and Stearns, 1938; Stearns, 1968). At intakes greater than 45 µg (1,800 IU)/day, linear growth may be reduced (Jeans and Stearns, 1938).
A recent study in Chinese infants (Specker et al., 1992) demonstrated that both latitude and intake of vitamin D over a relatively narrow range affect infant vitamin D status. Although there was no evidence of rickets in any of the infants from northern China (40 to 47° N), vitamin D supplements of 2.5 or 5 µg (100 or 200 IU)/day resulted in 17 of 47 and 11 of 37 infants, respectively, having serum 25(OH)D concentrations less than 27.5 nmol/liter (11 ng/ml) by 6 months of age. For infants supplemented with 10 µg (400 IU)/day, only 2 of 33 had deficient vitamin D status. In contrast, Chinese infants from two southern cities (22° N and 30° N) maintained normal vitamin D status even on 2.5 µg (100 IU)/day of vitamin D.
Seasonal variation in vitamin D status of infants is also apparent. In studies from the United States (Greer et al., 1982a; Specker and Tsang, 1987) and Norway (Markestad and Elzouki, 1991), serum 25(OH)D concentrations in human milk-fed infants not receiving vitamin D supplements decreased in winter due to less sunlight exposure. However, this decrease did not occur in infants receiving a vitamin D supplement of 10 µg (400 IU)/day beginning at 3 weeks of age (Greer et al., 1982a). The impact of the seasonal reduction in vitamin D status on bone mineral mass has not been clearly delineated. In Greer's (1982) study, BMC of the placebo group was significantly less than the vitamin D-supplemented group at 12 weeks, but this difference was no longer significant by 26 weeks of age. However, there were no differences in the mean serum calcium, alkaline phosphatase, or PTH levels between the placebo and vitamin D-supplemented groups.
AI Summary: Ages 0 through 6 Months
With habitual small doses of sunshine, breast- or formula-fed infants do not require supplemental vitamin D. For infants who live in far northern latitudes or who are restricted in exposure to sunlight, a minimal intake of 2.5 µg (100 IU)/day of vitamin D will likely prevent rickets (Glaser et al., 1949; Specker et al., 1992). However, at this intake and in the absence of sunlight, many infants will have
serum 25(OH)D concentrations within the range often observed in cases of rickets (Specker et al., 1992). For this reason, and assuming that infants are not obtaining any vitamin D from sunlight, an AI of at least 5 µg (200 IU)/day is recommended.
|
AI for Infants |
0 through 6 months |
5.0 µg (200 IU)/day |
Special Considerations
Infant Formula. Dietary needs for vitamin D are similar for infants fed formula or human milk. Koo et al. (1995) studied infants of very low birth weight who were fed high-calcium and high-phosphorus infant formulas. They found that an average intake of vitamin D as low as 4 µg (160 IU)/day in the experimental formula maintained normal and stable vitamin D status, physical growth, biochemical and hormonal indices of bone mineral metabolism, and skeletal radiographs. In another study of exclusively formulafed Norwegian infants who received 7.5 µg (300 IU)/day of vitamin D, all infants attained a serum 25(OH)D concentration above 27.5 nmol/liter (11 ng/ml) (Markestad and Elzouki, 1991). This result was similar to the concentrations attained by infants studied at the end of the summer who were fed human milk.
From a physiological perspective, whether infants are fed human milk or formula, their needs for dietary vitamin D when not exposed to sunlight are the same. Thus, vitamin D intake of formulafed infants not exposed to sunlight should be at least 5 µg (200 IU)/day. However, 10 µg (400 IU)/day, the current amount included in 1 liter of standard infant formula or 1 quart of commercial cow milk, would not be excessive.
Ages 7 through 12 Months
Indicator Used to Estimate the AI
Serum 25(OH)D. Studies from three countries provide evidence for the lower range of intake of vitamin D that will support normal serum 25(OH)D concentration in infants between 7 and 12 months of age. In Norway, Markestad and Elzouki (1991) reported that in the winter, older infants who had received a vitamin preparation containing on average 5 µg (200 IU)/day of vitamin D achieved serum 25(OH)D levels that were intermediate between those of the infants studied at the end of summer and formula-fed infants. In
the United States, Greer et al. (1982a) followed groups of infants who were fed human milk and exposed on average to 35 minutes/day of sunshine. Those who received either a placebo or 10 µg (400 IU)/day of vitamin D had similar serum 25(OH)D concentrations at 1 year of age. Similarly, in Hong Kong, Leung et al. (1989) followed 150 formula-fed infants who had a mean intake of 8.6, 3.9, and 3.8 µg (345, 154, and 153 IU)/day of vitamin D at 6, 12, and 18 months, respectively. They observed that none of the infants at 18 months had a serum 25(OH)D level less than 25 nmol/liter (10 ng/ml) and that the mean values in May and June were higher than in January through April.
AI Summary: Ages 7 through 12 Months
In the absence of any sunlight exposure, an AI of 5 µg (200 IU)/day will result in few infants ages 7 through 12 months with serum 25(OH)D concentrations less than 27.5 nmol/liter (11 ng/ml). This is based on the observation that, in the absence of sun-mediated vitamin D synthesis, approximately 5 µg (200 IU)/day of vitamin D maintained 25(OH)D levels in the normal range, but below circulating concentrations attained by infants in the summer. However, an intake of 10 µg (400 IU), which is supplied by 1 liter of most infant formulas or 1 quart of milk, would not be excessive.
|
AI for Infants |
7 through 12 months |
5 µg (200 IU)/day |
Ages 1 through 3 and 4 through 8 Years
Indicator Used to Estimate the AI
Serum 25(OH)D. Essentially no scientific literature exists that systematically evaluates the influence of different amounts of vitamin D intake on either BMC, bone radiography, or serum 25(OH)D in children aged 1 through 3 and 4 through 8. Although vitamin D intake was not reported, Meulmeester et al. (1990) measured circulating concentrations of 25(OH)D and PTH in 8-year-old children in an observational study and found that the serum PTH increased when the 25(OH)D levels were below 20 nmol/liter (8 ng/ml). Because serum 25(OH)D concentrations in children correlate well with cumulative exposure to sunlight or dietary intake of vitamin D, this biochemical marker is appropriate for assessment of vitamin D needs of growing children. The major limiting factor in interpret-
ing relevant studies in this age group is the inconsistency in control of sun exposure when measuring dietary intake as the intervention and vice versa. Often, relative sun exposure has to be presumed from the country where the study was conducted.
When sun exposure is consistently adequate throughout the year, as it is presumed to be in South Africa, 1- to 8-year-old children of mixed race showed no evidence of vitamin D deficiency (serum 25(OH)D > 77.5 nmol/liter [31 ng/ml]) (Pettifor et al., 1978b). Unfortunately, dietary intake was not evaluated. When vitamin D intakes were less than 2.5 µg (100 IU)/day (mean intakes 0.6 ± 1.8 µg or 25 ± 70 IU/day) in vegetarian children younger than 6 years living in Boston, 4 out of 70 children in this 3-year longitudinal study developed radiologic evidence of vitamin D deficiency (Dwyer et al., 1979).
In the absence of age-specific data, additional observations in slightly older children were considered. In a longitudinal study in Norway, where sun exposure is presumed to vary over the year, an intake of vitamin D of about 2.5 µg (100 IU)/day from fortified margarine maintained normal vitamin D status in children aged 8 to 18 years (Aksnes and Aarskog, 1982). In 6- to 17-year-old Indian children in Turkey, a daily average intake (calculated from a 1-week diet history) of 2.0 ± 0.4 µg (78.6 ± 17.9 IU) compared with 1.1 ± 0.3 µg (45.3 ± 10.8 IU) vitamin D, appeared to support a better serum 25(OH)D status in most children in this observational study (Gultekin et al., 1987). In neither study was sun exposure measured. Taken together, these studies suggest that a dietary vitamin D intake of 1.9 to 2.5 µg (75 to 100 IU)/day may be adequate when skin synthesis of vitamin D is limited by sun exposure or skin pigmentation.
Children aged 2 to 8 years obtain most of their vitamin D from exposure to sunlight (Ala-Houhala et al., 1984; Gultekin et al., 1987; Meulmeester et al., 1990; Oliveri et al., 1993; Pettifor et al., 1978a; Riancho et al., 1989; Taylor and Norman, 1984) and therefore do not normally need to ingest vitamin D. However for children who live in far northern latitudes such as in northern Canada and Alaska, vitamin D supplementation may be necessary.
AI Summary: Ages 1 through 3 and 4 through 8 Years
There are no data on how much vitamin D is required to prevent vitamin D deficiency in children aged 1 through 8 years. Extrapolating from available data in slightly older children (Aksnes and Aarskog, 1982; Gultekin et al., 1987) and from different continents for
children who are not exposed to adequate sunlight, most children who had a mean dietary intake of 1.9 to 2.5 µg (75 to 100 IU)/day (Gultekin et al., 1987) showed no evidence of vitamin D deficiency and had normal serum 25(OH)D values. To cover the needs of almost all children ages 1 though 8, regardless of exposure to sunlight, the above value is doubled for an AI of 5 µg (200 IU)
|
AI for Children |
1 through 3 years |
5.0 µg (200 IU)/day |
|
AI for Children |
4 through 8 years |
5.0 µg (200 IU)/day |
Ages 9 through 13 and 14 through 18 Years
Indicator Used to Estimate the AI
Serum 25(OH)D. During puberty, the metabolism of 25(OH)D to 1,25(OH)2D increases (Aksnes and Aarskog, 1982). The increased blood concentrations of 1,25(OH)2D enhance intestinal calcium absorption to provide adequate calcium for the rapidly growing skeleton. However, there is no scientific evidence that demonstrates an increased requirement for vitamin D. In boys and girls aged 8 to 18 years, who are estimated to ingest 2.5 µg (100 IU)/day of vitamin D from margarine, the mean 25(OH)D concentration in the children in late March was 55 ± 2.5 nmol/liter (22 ± 1 ng/ml) (Aksnes and Aarskog, 1982).
In the few studies available, children during the pubertal years maintained a normal serum 25(OH)D level with dietary vitamin D intakes of 2.5 to 10 µg (100 to 400 IU)/day. Aksnes and Aarskog (1982) had the same result in Scandinavian children aged 8 to 18 years consuming 2.5 µg (100 IU)/day from margarine or 10 µg (400 IU)/day from supplements during the winter months. At intakes less than 2.5 µg (100 IU)/day, Turkish children aged 12 to 17 years had mean serum 25(OH)D concentrations that were consistent with vitamin D deficiency (< 27.5 nmol/liter [< 11 ng/ml]) (Gultekin et al., 1987). In those with mean intakes of 2.0 ± 0.5 ± µg (79 ± 18 IU)/day of vitamin D, serum 25(OH)D levels were 32.75 ± 2.75 nmol/liter (13.1 ± 1.1 ng/ml) for boys and 14.5 ± 1.75 nmol/liter (5.8 ± 0.7 ng/ml) for girls. With regular sun exposure, there would not be a dietary need for vitamin D (Ala-Houhala et al., 1984; Gultekin et al., 1987; Pettifor et al., 1978a; Riancho et al., 1989; Taylor and Norman, 1984). However, children who live in the far northern and southern latitudes, may be unable to synthesize enough vitamin D in their skin that can be stored for use in the
winter. These children may need a vitamin D supplement (Oliveri et al., 1993).
AI Summary: Ages 9 through 13 and 14 through 18 Years
Vitamin D that is synthesized in the skin during the summer and fall months can be stored in the fat for use in the winter (Mawer et al., 1972), thereby minimizing the requirement for vitamin D. There is no reason to believe that the increased conversion of 25(OH)D to 1,25(OH)D seen in puberty results in a change in the borderline amount of circulating 25(OH)D that would be considered the minimum for adequacy. Thus, in the absence of additional data, 27.5 nmol/liter (11 ng/ml) is the appropriate cutoff for this age group. Most children aged 8 to 18 years who ingested 2.5 µg (100 IU)/day of vitamin D from margarine had no evidence of vitamin D deficiency and had a normal serum 25(OH)D level (Aksnes and Aarskog, 1982). To cover the needs of all children ages 9 through 18 years, regardless of exposure to sunlight, the above value is doubled for an AI of 5 µg (200 IU)/day.
|
AI for Boys |
9 through 13 years |
5.0 µg (200 IU)/day |
|
14 through 18 years |
5.0 µg (200 IU)/day |
|
|
AI for Girls |
9 through 13 years |
5.0 µg (200 IU)/day |
|
14 through 18 years |
5.0 µg (200 IU)/day |
Ages 19 through 30 and 31 through 50 Years
Indicator Used to Estimate the AI
Serum 25 (OH)D. There is little scientific information that relates vitamin D intake, bone health, and vitamin D status as determined by serum 25(OH)D and PTH concentrations in young adult and adult age groups. A descriptive longitudinal study of seven adult female patients in Great Britain (age range 20 to 46 years) who consumed a diet that contained from 0.4 to 1.7 µg (15 to 68 IU)/day of vitamin D revealed that the women developed clinical and biochemical features of osteomalacia after 1 to several years. No information about sunlight exposure was provided, and the patients achieved a positive calcium balance when consuming 2.5 µg (100 IU)/day of vitamin D (Smith and Dent, 1969).
Racial differences were not evident in measures of serum 25(OH)D and PTH in a cross-sectional study in 67 Caucasian (age
36.5 ± 6.4 years) and 70 African American (age 37 ± 6.7 years) premenopausal women living in the New York City area, who were active and exposed to sunlight. With an average daily intake of 3.5 ± 2.1 µg (139 ± 84 IU) and 3.6 ± 1.8 µg (145 ± 73 IU)/day, respectively, as measured by food frequency questionnaires and interviews, the Caucasian and African American women had similar normal serum 25(OH)D and PTH concentrations. However, BMD in both the lumbar spine and radius was significantly higher in the African American women (Meier et al., 1991). During the winter months (November through May) in Omaha, Nebraska, all except 6 percent of a group of young women aged 25 to 35 years (n = 52) maintained serum 25(OH)D levels greater than 30 nmol/liter (12 ng/ml) when daily vitamin D intake was estimated to be 3.3 to 3.4 µg (131 to 135 IU)/day (Kinyamu et al., 1997). Taken together, these studies suggest that adults younger than 50 years of age in the United States depend on sunlight for most of their vitamin D requirement. Physiological reliance on dietary vitamin D probably only occurs in the winter months in a small proportion who are not exposed to sunlight during the summer.
Indirect evidence of the importance of sunlight to vitamin D status was obtained from a recent study in 22 young male submariners (aged 18 to 32 years) who were not exposed to sunlight but who maintained their serum 25(OH)D at concentrations similar to those measured just before entering the submarine for 3 months with 15 µg (600 IU)/day of vitamin D (Holick, 1994). Those submariners who did not receive a vitamin D supplement had a 38 percent decline in serum 25(OH)D concentration after 1.5 and 3 months in the submarine. Lower supplement doses were not studied. The serum 25(OH)D levels of the nonsupplemented group increased by more than 80 percent when the submariners were exposed to sunlight for one month.
The importance of dietary sources of vitamin D was demonstrated by observations of significantly lower serum 25(OH)D (67.5 ± 47.5 nmol/liter [27 ± 19 ng/ml]) concentrations in males and females who were strictly vegetarian (mean age 42 ± 10 years) in the winter in Helsinki, Finland, compared with a control group of healthy omnivorous women with mean serum 25(OH)D concentration of 117.5 ± 37.5 nmol/liter (47 ± 15 ng/ml). Six of the 10 strict vegetarians had 25(OH)D levels below the lower reference limit of the group (62.5 nmol/liter [25 ng/ml]) indicating vitamin D deficiency (Lamberg-Allardt et al., 1993). Based on a 2-week food record, vitamin D intake in the strict vegetarians (0.3 µg or 10 IU/day) was markedly lower than in the
control group (4.5 µg or 180 IU/day). Serum PTH concentrations were significantly higher in the vegetarians (57 ng/liter) compared with the control group (28 ng/liter), and 3 out of 10 subjects had concentrations that were higher than the upper reference limit (65 ng/liter), indicating secondary hyperparathyroidism.
AI Summary: Ages 19 through 30 and 31 through 50 Years
Based on the available literature, both sunlight and diet play an essential role in providing vitamin D to this age group. Because cutaneous vitamin D synthesis is markedly diminished or absent in the winter, young and middle-aged adults who live in northern (> 40°N) and southern latitudes (> 40°S) can become vitamin D deficient (Kinyamu et al., 1997). During the winter months in Omaha, Nebraska, most women with an average intake of 3.3 to 3.4 µg (131 to 135 IU)/day of vitamin D had serum 25(OH)D concentrations greater than 30 nmol/liter (12 ng/ml) (Kinyamu et al., 1997). Because there are no data for men only, other than those from submariners at a high supplement intake, it is assumed that the AI for men is similar to that for women. To cover the needs of adults ages 19 through 50 years, regardless of exposure to sunlight, the above value is rounded down to 2.5 µg (100 IU) and then doubled for an AI of 5.0 µg (200 IU)/day.
|
AI for Men |
19 through 50 years |
5.0 µg (200 IU)/day |
|
AI for Women |
19 through 50 years |
5.0 µg (200 IU)/day |
Ages 51 through 70 Years
Indicators Used to Estimate the AI
Serum 25(OH)D. Although this age group also depends on sunlight for most of its vitamin D requirement, this population may be more prone to developing vitamin D deficiency, owing to a variety of factors that reduce the cutaneous production of vitamin D3. Increased use of clothing to cover the skin and prevent the damaging effects of sunlight (Matsuoka et al., 1992) and increased use of sunscreen can increase the risk of vitamin D deficiency (Holick, 1994). Aging also decreases the capacity of the skin to produce vitamin D (Holick et al., 1989; Need et al., 1993).
Bone Loss. Dietary supplementation of vitamin D in older women has been shown to influence bone loss. When vitamin D intake from food (2.5 to 5.0 µg or 100 to 200 IU/day) was supplemented with 2.5 or 17.5 µg (100 or 700 IU)/day in a double-blind, randomized 2-year trial in 247 postmenopausal women (mean age 64 ± 5 years) from Boston, loss of BMD of the femoral neck was less (−1.06 ± 0.34 percent) in the group supplemented with 17.5 µg (700 IU)/day than in the group supplemented with 2.5 µg (100 IU)/day (−2.54 ± 0.37 percent) (Dawson-Hughes et al., 1995).
Two further studies underline the importance of dietary intakes of vitamin D during the winter season in older adult populations. In 333 ambulatory Caucasian women (mean age 58 ± 6 years), serum PTH concentrations were elevated in winter (between March and May) in women consuming less than 5.5 µg (220 IU)/day of vitamin D, whereas no seasonal variation in serum PTH concentration occurred when vitamin D intakes were greater than 5.5 µg (220 IU)/day (Krall et al., 1989). In a study that measured bone loss between seasons in older women (62 ± 0.5 years) who had usual vitamin D intakes of 2.5 µg (100 IU)/day, dietary supplements of 10 µg (400 IU)/day appeared to reduce loss of spinal bone, at least during the 1 year of this randomized intervention trial (DawsonHughes et al., 1991). This finding is similar to that reported above regarding bone loss in the femoral neck, which was less in postmenopausal women who supplemented their diet containing 2.5 µg (100 IU)/day of vitamin D with 17.5 µg (700 IU)/day vitamin D compared with those who did not (Dawson-Hughes et al., 1995). Taken together, these studies provide evidence, at least in women, that dietary intakes of vitamin D higher than 2.5 µg (100 IU)/day are necessary at ages 51 through 70 years to prevent higher rates of bone loss during periods of low sun exposure.
AI Summary: Ages 51 through 70 Years
Using bone loss as an indicator of adequacy and data from studies of women, described above, a dietary vitamin D intake of 2.5 µg (100 IU)/day is inadequate. Although data do not exist for males in this age range, there is no reason to believe that their dietary vitamin D requirement should be different from that for females. At a vitamin D intake greater than 5.5 µg (220 IU)/day, there was no seasonal variation in serum PTH concentration (Krall et al., 1989). Given that there are few data from individuals with limited but uncertain sun exposure and stores to precisely determine a value between 2.5 µg (100 IU) and 17.5 µg (700 IU), 5 µg (200 IU) was
chosen. To cover the needs of all adults ages 51 through 70 years, the above value was doubled for an AI of 10 µg (400 IU).
|
AI for Men |
51 through 70 years |
10 µg (400 IU)/day |
|
AI for Women |
51 through 70 years |
10 µg (400 IU)/day |
Ages > 70 Years
Indicator Used to Estimate the AI
Serum 25(OH)D. There is strong evidence for a decrease in circulating concentrations of 25(OH)D and increased risk of skeletal fractures with aging, and it is most apparent after the age of 70 years (Chevalley et al., 1994; Dawson-Hughes et al., 1991; Hordon and Peacock, 1987; Lamberg-Allardt et al., 1989; Lips et al., 1988; McGrath et al., 1993; Ng et al., 1994; Ooms et al., 1995; Villareal et al., 1991; Webb et al., 1990). Villareal et al. (1991) concluded that subclinical vitamin D deficiency with serum 25(OH)D concentrations of less than 37.5 nmol/liter (15 ng/ml) was associated with mild secondary hyperparathyroidism, lower serum calcium and phosphate levels, lower urinary calcium, and higher serum alkaline phosphatase.
Information from descriptive studies in the aging population suggests that both lack of sunlight and low intake of vitamin D influence serum 25(OH)D concentration in elderly subjects. During the winter months (November to May) in Omaha, Nebraska, all but 8 percent of 60 women living in nursing homes (mean age 84 years) and all but 1.6 percent of 64 free-living women (mean age 71 years) maintained serum 25(OH)D levels greater than 30 nmol/liter (12 ng/ml), when daily vitamin D intake was estimated to be 5.2 µg (207 IU) for the nursing home residents and 3.4 µg (135 IU) for the free-living women (Kinyamu et al., 1997). In another study during the winter months (January to May) in New York City with 109 male and female nursing home residents (mean age 82 years), serum 25(OH)D concentration was greater than 37.5 nmol/liter (15 ng/ml) in those taking a vitamin D supplement of 10 µg (400 IU)/day (O'Dowd et al., 1993). In those residents with mean vitamin D intakes of 7.1 µg (283 IU)/day, 14 percent had serum 25(OH)D levels below 25 nmol/liter (10 ng/ml). Similarly, in 116 subjects (mean age 81) who were confined indoors for at least 6 months in Baltimore, serum 25(OH)D concentration was below 25 nmol/liter
(10 ng/ml) in 45 percent with vitamin D intakes ranging from 3.0 to 7.1 µg (121 to 282 IU)/day (Gloth et al., 1995).
Based on several randomized, double-blind clinical trials with elderly women or both men and women, a vitamin D intake of 10 µg (400 IU)/day is needed to maintain normal 25(OH)D and serum PTH status. This result was observed when the duration of the vitamin D intervention was for 1 year (Lips et al., 1988) or 3.5 years (Lips et al., 1996). In the latter study, there was no advantage to 10 µg (400 IU)/day versus placebo in the incidence of hip fractures or other peripheral fractures despite the better vitamin D status. However, a subset of the women who participated in the Lips et al. (1996) study and who were supplemented with 10 µg (400 IU)/day of vitamin D had a significant gain in change in BMD at the femoral neck after 2 years, in addition to increased 25(OH)D and decreased circulating PTH (Ooms et al., 1995). No significant BMD effects were found in the other bone sites measured: the femoral trochanter and the distal radius.
Studies in both women and men supplemented with 10 to 25 µg (400 to 1,000 IU)/day of vitamin D have shown reduced bone resorption by various urinary markers (Brazier et al., 1995; Chapuy et al., 1992; Egsmose et al., 1987; Fardellone et al., 1995; Kamel et al., 1996; Sebert et al., 1995; Sorva et al., 1991). In women supplemented for 18 months with both calcium and 20 µg (800 IU)/day of vitamin D, BMC increased significantly, and vertebral and nonvertebral fractures decreased significantly (Chapuy et al., 1992).
AI Summary: Ages > 70 Years
Evidence is strong that the elderly are at high risk for vitamin D deficiency, which causes secondary hyperparathyroidism and osteomalacia and exacerbates osteoporosis, resulting in increased risk of skeletal fractures (Chapuy et al., 1992; Egsmose et al., 1987; Honkanen et al., 1990; McKenna, 1992; Pietschmann et al., 1990). In a comparison of vitamin D status in the elderly in Europe and North America, Byrne et al. (1995) and McKenna (1992) concluded that the elderly are prone to hypovitaminosis D and associated abnormalities of bone chemistry and that a supplement of 10 to 20 µg (400 to 800 IU)/day would be of benefit. In support of this, 8, 14, and 45 percent of elderly subjects who had daily dietary vitamin D intakes of 9.6, 7.1, and 5.2 µg (384, 283, and 207 IU), respectively, were considered to be vitamin D deficient based on low serum 25(OH)D levels (Gloth et al., 1995; Kinyamu et al., 1997; O'Dowd et al., 1993). Therefore, based on the available literature, a value of 7.5 µg (300 IU)/day may be prudent for
those individuals over 70 years of age with limited sun exposure and stores. In order to cover the needs of adults over age 70, regardless of exposure to sunlight and stores, the above value is doubled for an AI of 15 µg (600 IU)/day.
|
AI for Men |
> 70 years |
15 µg (600 IU)/day |
|
AI for Women |
> 70 years |
15 µg (600 IU)/day |
Special Consideration
Medications. Glucocorticoids are well known for their anti-inflammatory properties. One of the most undesirable side effects of glucocorticoid therapy is severe osteopenia. One of the mechanisms by which glucocorticoids induce osteopenia is by inhibiting vitamin D-dependent intestinal calcium absorption (Lukert and Raisz, 1990). Therefore, patients on glucocorticoid therapy may require additional vitamin D in order to maintain their serum 25(OH)D levels in the mid-normal range (25 to 45 ng/ml [62.5 to 112.5 nmol/liter]).
Medications to control seizures, such as phenobarbital and dilantin, can alter the metabolism and the circulating half-life of vitamin D (Favus and Christakos, 1996). Holick (1995) recommended that patients on at least two antiseizure medications who are institutionalized, and therefore not obtaining most of their vitamin D requirement from exposure to sunlight, increase their vitamin D intake to approximately 25 µg (1,000 IU)/day to maintain their serum 25(OH)D levels within the mid-normal range of 25 to 45 ng/ml (62.5 to 112.5 nmol/liter). This should prevent the osteomalacia and vitamin D deficiency associated with antiseizure medications.
Pregnancy
Indicators Used to Set the AI
Serum 25(OH)D. Paunier et al. (1978) evaluated the vitamin D intake from foods, supplements, and sunshine exposure of 40 healthy women at the time of delivery of their babies during the months of January and February. Women taking less than 3.8 µg (150 IU)/day had an average serum 25(OH)D concentration of 9.1 ± 1.5 ng/ml (22.75 ± 3.75 nmol/liter), while women taking more than 12.5 µg (500 IU)/day had a concentration of 11.1 ± 1.3 ng/ml (27.75 ± 3.25 nmol/liter). Although the authors noted no significant difference between
these two values in the mothers, newborns of mothers who received the vitamin D supplement had a statistically higher serum calcium level on the fourth day of life than those from mothers with the lower vitamin D intake. Several studies have evaluated supplementation after the pregnant woman's first trimester with either 10 or 25 µg (400 or 1,000 IU)/day of vitamin D. It was concluded that vitamin D supplementation increased circulating concentrations of 25(OH)D in the mother (Anderson et al., 1988; Cockburn et al., 1980; Delvin et al., 1986; Mallet et al., 1986; Markested et al., 1986; Reddy et al., 1983) and may improve neonatal handling of calcium (Cockburn et al., 1980; Delvin et al., 1986).
During pregnancy, there is a gradual rise in a woman's serum 1,25(OH)2D concentration that is paralleled by an increase in her blood concentration of vitamin D binding protein (Bikle et al., 1984; Bouillon et al., 1981). However, during the last trimester, the woman's serum 1,25(OH) 2D level continues to rise without any change in the vitamin D binding protein level, causing an increase in the free concentration of 1,25(OH) 2D. Evidence is strong that the placenta metabolizes 25(OH)D to 1,25(OH) 2D and therefore contributes to the maternal and possibly fetal blood levels of 1,25(OH)2D (Gray et al., 1979; Weisman et al., 1979).
AI Summary: Pregnancy
Although there is ample evidence for placental transfer of 25(OH)D from the mother to the fetus (Paunier et al., 1978), the quantities are relatively small and do not appear to affect the overall vitamin D status of pregnant women. Women, whether pregnant or not, who receive regular exposure to sunlight do not need vitamin D supplementation. However, at vitamin D intakes less than 3.8 µg (150 IU)/day, pregnant women during the winter months at high latitudes had a mean 25(OH)D concentration of 9.1 ng/ml (22.75 nmol/liter) at delivery (Paunier et al., 1978). Thus, there is no additional need to increase the vitamin D age-related AI during pregnancy above that required for nonpregnant women. However, an intake of 10 µg (400 IU)/day, which is supplied by prenatal vitamin supplements, would not be excessive.
|
AI for Pregnancy |
14 through 18 years |
5.0 µg (200 IU)/day |
|
19 through 30 years |
5.0 µg (200 IU)/day |
|
|
31 through 50 years |
5.0 µg (200 IU)/day |
Lactation
Indicator Used to Set the AI
Serum 25(OH)D. During lactation, small and probably insignificant quantities of maternal circulating vitamin D and its metabolites are secreted into human milk (Nakao, 1988; Specker et al., 1985a). Although there is no reason to expect the mother's vitamin D requirement to be increased during lactation, some investigators have determined whether the infant can be supplemented via the mother's milk. Ala-Houhala (1985) and Ala-Houhala et al. (1986) evaluated the vitamin D status of mothers and their infants supplemented with vitamin D. Healthy mothers delivering in January received either 50 µg (2,000 IU)/day, 25 µg (1,000 IU)/day, or no vitamin D. Their infants were exclusively breast-fed and received 10 µg (400 IU)/day of vitamin D if their mothers received none. After 8 weeks of lactation, 25(OH)D concentrations of infants who were breast-fed from women receiving 50 µg (2,000 IU)/day of vitamin D were similar to those of infants supplemented with 10 µg (400 IU)/day. The serum 25(OH)D levels in the infants from mothers receiving 25 µg (1,000 IU)/day were significantly lower. None of the infants showed any clinical or biochemical signs of rickets, and all infants showed equal growth. Although it was concluded that postpartum maternal supplementation with 50 µg (2,000 IU)/day of vitamin D, but not 25 µg (1,000 IU)/day, seemed to normalize serum 25(OH)D concentration in infants fed human breast milk in the winter, the maternal 25(OH)D level increased in the two groups of mothers receiving 50 or 25 µg (2,000 or 1,000 IU)/day of vitamin D compared with mothers who received no vitamin D supplementation.
AI Summary: Lactation
There is no scientific literature that has determined a minimum vitamin D intake to sustain serum 25(OH)D concentration in the normal range during lactation, and there is no evidence that lactation increases a mother's AI for vitamin D. Therefore, it is reasonable to extrapolate from observations in nonlactating women that when sunlight exposure is inadequate, an AI of 5.0 µg (200 IU)/day is needed. However, an intake of 10 µg (400 IU)/day, which is supplied by postnatal vitamin supplements, would not be excessive.
|
AI for Lactation |
14 through 18 years |
5.0 µg (200 IU)/day |
|
19 through 30 years |
5.0 µg (200 IU)/day |
|
|
31 through 50 years |
5.0 µg (200 IU)/day |
TOLERABLE UPPER INTAKE LEVELS
Hazard Identification
Hypervitaminosis D is characterized by a considerable increase in plasma 25(OH)D concentration to a level of approximately 400 to 1,250 nmol/liter (160 to 500 ng/ml) (Jacobus et al., 1992; Stamp et al., 1977). Because changes in circulating levels of 1,25(OH)2D are generally small and unreliable, the elevated levels of 25(OH)D are considered the indicator of toxicity. However, increases in circulating levels of 1,25(OH)2D in the range of 206.5 to 252.6 pmol/liter (85.9 to 105.1 pg/ml) have been reported (DeLuca, 1984; Holick, 1995; Reichel et al., 1989), which might contribute to the expression of toxic symptoms. As indicated earlier, serum 25(OH)D is a useful indicator of vitamin D status, both under normal conditions and in the context of hypervitaminosis D (Hollis, 1996; Jacobus et al., 1992).
The data in Table 7-1 suggest a direct relationship between vitamin D intake and 25(OH)D levels. Serum levels of 25(OH)D have diagnostic value, particularly in distinguishing the hypercalcemia due to hypervitaminosis D from that due to other causes, such as hyperparathyroidism, thyrotoxicosis, humoral hypercalcemia of malignancy, and lymphoma (Lafferty, 1991; Martin and Grill, 1995).
The adverse effects of hypervitaminosis D are probably largely mediated via hypercalcemia, but limited evidence suggests that direct effects of high concentrations of vitamin D may be expressed in various organ systems, including kidney, bone, central nervous system, and cardiovascular system (Holmes and Kummerow, 1983). Human case reports of pharmacologic doses of vitamin D over many years describe severe effects at intake levels of 250 to 1,250 µg/day (10,000 to 50,000 IU/day) (Allen and Shah, 1992). The available evidence concerning the adverse effects of hypervitaminosis D mediated by hypercalcemia and direct target tissue toxicity are briefly discussed below.
Hypercalcemia of Hypervitaminosis D
Hypercalcemia results primarily from the vitamin D-dependent increase in intestinal absorption of calcium (Barger-Lux et al., 1996) and the enhanced resorption of bone. Resorption of bone (hyperosteolysis) has been shown to be a major contributor to the hypercalcemia associated with hypervitaminosis D in studies that demonstrated rapid decreases in blood calcium levels following the
TABLE 7-1 Vitamin D Intake and Blood and Urinary Parameters in Adults Taking Vitamin D Supplements
|
Vitamin D Intake (IU/day) |
Duration |
Serum Calcium (mmol/L) |
Serum 25(OH)D (nmol/L) |
Serum Creatinine (µmol/liter) |
Urinary Calcium (mmol/liter GFR) |
Study |
|
800 |
4–6 months |
NCaa |
60-105 (5 studies; n = 188) |
— |
— |
Byrne et al., 1995 |
|
1,800 |
3 months |
NCa |
65, 80 (2 studies; n = 55) |
— |
— |
Byrne et al., 1995 |
|
1,800 |
3 months |
NCa |
57–86 |
82.4–83.8 |
— |
Honkanen et al., 1990 |
|
2,000 |
6 months |
NCa |
— |
— |
— |
Johnson et al., 1980 |
|
10,000 |
4 weeks |
— |
105b |
— |
— |
Stamp et al., 1977 |
|
10,000 |
10 weeks |
— |
110b |
— |
— |
Davies et al., 1982 |
|
20,000 |
4 weeks |
— |
150b |
— |
— |
Stamp et al., 1977 |
|
50,000 |
6 weeks |
3.75 |
320 |
388 |
— |
Schwartzman and Franck, 1987 |
|
50,000 |
15 years |
3.12 |
560 |
— |
— |
Davies and Adams, 1978 |
|
100,000 |
10 years |
3.20 |
865 |
215 |
0.508 |
Selby et al., 1995 |
|
200,000 |
2 years |
3.78 |
1202 |
207 |
— |
Selby et al., 1995 |
|
300,000 |
6 years |
3.30 |
1692 |
184 |
0.432 |
Rizzoli et al., 1994 |
|
300,000 |
3 weeks |
2.82 |
800 |
339 |
0.065 |
Rizzoli et al., 1994 |
|
Vitamin D poisoning |
4.0 (n = 11) |
1162 (n = 11) |
— |
— |
Pettifor et al., 1995 |
|
|
Overfortification of milk |
3.28 (n = 35) |
560 (n = 35) |
— |
— |
Blank et al., 1995 |
|
|
Reference levels |
2.15–2.65 |
20–100 (10) 25–200 (9) |
18–150 |
< 0.045 |
Blank et al., 1995 Haddad, 1980 |
|
|
a NCa = normo-calcemic. b Indicates extrapolation from graphic data. |
||||||
administration of a bone resorption inhibitor, bisphosphonate (Rizzoli et al., 1994; Selby et al., 1995).
As Table 7-1 illustrates, hypercalcemias can result either from clinically prescribed intakes of vitamin D or from the inadvertent consumption of high amounts of the vitamin. The plasma (or serum) calcium levels reported range from 2.82 to 4.00 mmol/liter (normal levels are 2.15 to 2.62 mmol/liter) in those individuals with intakes of 1,250 µg (50,000 IU)/day or higher. There is no apparent trend relating “vitamin D intake-days” with plasma calcium levels.
The hypercalcemia associated with hypervitaminosis D gives rise to multiple debilitating effects (Chesney, 1990; Holmes and Kummerow, 1983; Parfitt et al., 1982). Specifically, hypercalcemia can result in a loss of the urinary concentrating mechanism of the kidney tubule (Galla et al., 1986), resulting in polyuria and polydipsia. A decrease in glomeruler filtration rate also occurs. Hypercalciuria results from the hypercalcemia and the disruption of normal reabsorption processes of the renal tubules. In addition, the prolonged ingestion of excessive amounts of vitamin D and the accompanying hypercalcemia can cause metastatic calcification of soft tissues, including the kidney, blood vessels, heart, and lungs (Allen and Shah, 1992; Moncrief and Chance, 1969; Taylor et al., 1972).
The central nervous system may also be involved: a severe depressive illness has been noted in hypervitaminosis D (Keddie, 1987). Anorexia, nausea, and vomiting have also been observed in hypercalcemic individuals treated with 1,250 to 5,000 µg (50,000 to 200,000 IU)/day of vitamin D (Freyberg, 1942). Schwartzman and Franck (1987) reviewed cases in which vitamin D was used to treat osteoporosis in middle-aged and elderly women. These women had health problems in addition to osteoporosis. Intake of vitamin D between 1,250 µg (50,000 IU)/week and 1,250 µg (50,000 IU)/day for 6 weeks to 5 years was found to be associated with reduced renal function and hypercalcemia.
Renal Disease
Some evidence supports calcification of renal and cardiac tissue following excess vitamin D intake that is not associated with hypercalcemia. In a study of 27 patients with hypoparathyroidism, Parfitt (1977) found that a mean intake of 2,100 µg (84,000 IU)/day of vitamin D for 5 years was associated with reduced renal function, nephrolithiasis, and nephrocalcinosis. Parfitt hypothesized that these results were a direct effect of vitamin D, since it was not associated with hypercalcemia in these patients. However, these results
were judged inappropriate for use in deriving a tolerable upper intake level (UL) since the study subjects had hypoparathyroidism, which possibly increased their susceptibility to vitamin D toxicity. Irnell (1969) also reported a case of nephrocalcinosis and renal insufficiency in a thyroidectomized patient taking 1,125 µg (45,000 IU)/day of vitamin D for 6 years.
Cardiovascular Effects
Animal data in monkeys (Peng and Taylor, 1980; Peng et al., 1978), rabbits (Lehner et al., 1967), and pigs (Kummerow et al., 1976) suggest that calcification may also occur in nonrenal tissue. Human studies of cardiovascular effects are largely negative or equivocal. Although Linden (1974) observed that myocardial infarct patients in Tromso, Norway, were more likely to consume vitamin D in excess of 30 µg (1,200 IU)/day than were matched controls, two subsequent studies (Schmidt-Gayk et al., 1977; Vik et al., 1979) failed to confirm these results.
Although the data for nephrocalcinosis and arteriosclerosis are insufficient for determination of a UL, they point to the necessity for conservatism. There is a large uncertainty about progressive health effects, particularly on cardiovascular tissue and the kidney, with regular ingestion of even moderately high amounts of vitamin D over several decades.
Dose-Response Assessment
Adults: Ages > 18 Years
Data Selection. The most appropriate data available for the derivation of a UL for adults are provided by several studies evaluating the effect of vitamin D intake on serum calcium in humans (Honkanen et al., 1990; Johnson et al., 1980; Narang et al., 1984). The available animal data were not used to derive a UL for adults because the data were judged to have greater associated uncertainty than the human data.
Identification of a NOAEL (or LOAEL) and a Critical Endpoint. Narang et al. (1984) studied serum calcium levels in humans, with and without tuberculosis, where diet was supplemented with daily vitamin D doses of 10, 20, 30, 60, and 95 µg (400, 800, 1,200, 2,400, and 3,800 IU) for 3 months. Thirty healthy males and females rang-
ing in age from 21 to 60 years and without tuberculosis were in one study group. Statistically significant increases in serum calcium were observed in these subjects at vitamin D doses of 60 and 95 µg (2,400 and 3,800 IU)/day. However, increases in serum calcium level in some subjects, while statistically significant, were not necessarily adverse, or indicative of hypercalcemia (for example, serum calcium levels above 2.75 mmol/liter). For example, the mean serum calcium level in normal controls following administration of 60 µg (2,400 IU)/day of vitamin D increased from 2.43 mmol/liter to 2.62 mmol/liter (p < 0.01). The mean serum calcium level in normal controls treated with 95 µg (3,800 IU)/day of vitamin D increased from 2.46 mmol/liter to 2.83 mmol/liter. At 30 µg (1,200 IU)/day, in normal controls, the increase was from 2.35 mmol/liter to 2.66 mmol/liter, but this was not a significant increase. The study thus demonstrates an effect of relatively low doses of supplementary vitamin D on serum calcium levels, although the degree of hypercalcemia was modest. It should also be noted that the effect developed over a relatively short time (3 months or less), so it is not known whether the effect would have progressed and worsened, or whether it would have disappeared, over a longer time period.
Hypercalcemia, defined as a serum calcium level above 2.75 mmol/liter (11 mg/dl), was observed at the highest dose of 95 µg (3,800 IU)/day, which is, therefore, the lowest-observed-adverse-effect level (LOAEL). Although a significant rise in serum calcium levels occurred at 60 µg (2,400 IU)/day, they were still within a normal range. Therefore, 60 µg (2400 IU)/day is designated as a no-observed-adverse-effect level (NOAEL).
Uncertainty and Uncertainty Factors. In using a NOAEL of 60 µg (2,400 IU)/day based only on the results of Narang et al. (1984) to derive a UL for adults, it appears to be uncertain whether any increase in serum calcium, even though still within normal limits, might be adverse for sensitive individuals and whether the short duration of this study and small sample size affected the results. The selected uncertainty factor (UF) of 1.2 was judged to be sufficiently conservative to account for the uncertainties in this data set. A larger UF was judged unnecessary due to the availability of human data and a reasonably well-defined NOAEL in a healthy population.
Derivation of a UL. Based on a NOAEL of 60 µg (2,400 IU)/day divided by a composite UF of 1.2, the estimated UL for adults is 50 µg (2,000 IU)/day. Supportive evidence for a UL of 50 µg (2,000 IU)/day is provided by Johnson et al. (1980) and Honkanen et al.
(1990). Johnson et al. (1980) conducted a double-blind clinical trial of men (all over 65 years) and women (all over 60 years) treated with 50 µg (2,000 IU)/day of vitamin D for approximately 6 months. Assuming a normally distributed population, these data as presented would appear to suggest that the risk of hypercalcemia in a population exposed to intakes of 50 µg (2,000 IU)/day ranges from 5/1,000 to less than 1/10,000. In addition, Honkanen et al. (1990) reported that 45 µg (1,800 IU)/day of supplementary vitamin D administered to Finnish women aged 65 to 72 years for 3 months produced no ill effects.
|
UL for Adults |
> 18 years |
50 µg (2,000 IU)/day |
Infants: Ages 0 through 12 Months
Data Selection. Data from several studies in infants (Fomon et al., 1966; Jeans and Stearns, 1938; Stearns, 1968) were judged appropriate for use in deriving a UL for infants up to 1 year of age since the data document the duration and magnitude of intake, and as an aggregate, they define a dose-response relationship. Available data from animal studies were judged inappropriate due to their greater uncertainty.
Identification of a NOAEL (or LOAEL) and Critical Endpoint. Jeans and Stearns (1938) found retarded linear growth in 35 infants up to 1 year of age who received 45 to 112.5 µg (1,800 to 4,500 IU)/day of vitamin D as supplements (without regard to sunlight exposure, which was potentially considerable during the summer months) when compared with infants receiving supplemental doses of 8.5 µg (340 IU)/day or less for a minimum of 6 months. At 45 weeks of age, infants were found to have a linear growth rate 7 cm lower than the controls.
Fomon et al. (1966), in a similar study, explored the effects on linear growth in infants (n = 13) ingesting 34.5 to 54.3 µg (1,380 to 2,170 IU)/day of dietary vitamin D (mean = 44.4 µg or 1,775 IU/day) from fortified evaporated milk formulas as the only source of vitamin D compared with infants who were receiving 8.8 to 13.8 µg (350 to 550 IU)/day (n = 11) from another batch of formula. No effect was found in infants who were enrolled in the study during the first 9 days after birth up to 6 months of age. Given the small sample size used in this study, it was deemed appropriate to deviate from the model for the development of ULs (see Chapter 3 which
defines a NOAEL as the highest intake at which no adverse effects have been observed) and identify the NOAEL for infants in this study based on the mean intake (for example, 44.4 µg or 1,775 IU/day) rather than the high end of the range. The NOAEL was rounded up to 45 µ g (1,800 IU)/day. Stearns (1968) subsequently commented that Fomon et al. (1966) did not study the infants long enough since the greatest differences in the Jeans and Stearns (1938) study appeared after 6 months. However, taken together, these papers support a NOAEL of 45 µg (1,800 IU)/day.
In two different surveys at two different time periods, the British Paediatric Association (BPA) (BPA, 1956, 1964) reported a marked decline in hypercalcemia in infants, from 7.2 cases per month in a 1953–1955 survey, to 3.0 cases per month in a 1960–1961 survey. This change occurred at the same time as new guidelines were introduced for fortification of food products with vitamin D. Data from BPA (1956) and Bransby et al. (1964) also show the estimated total vitamin D intake in infants at the seventy fifth percentile of 100 µg (4,000 IU)/day declining to a range of 18.1 to 33.6 µg (724 to 1,343 IU)/day between the two surveys.
Graham (1959) studied 38 infants aged 3 weeks to 11 months with hypercalcemia in Glasgow from 1951 to 1957. The data as reported offer no definitive proof of a relationship between vitamin D intake and hypercalcemia. However, Graham does report that the highest serum calcium value obtained, 4.65 mmol/liter (18.6 mg/dl), occurred in an infant with an estimated daily intake of 33 µg (1,320 IU)/day of vitamin D and that the infant made a complete recovery when vitamin D was omitted from the diet.
Taken together, these data indicate that excessive vitamin D intake is probably a risk factor for hypercalcemia in a few sensitive infants. However, these data are inadequate for quantitative risk assessment because the daily dosage is so uncertain. This is because of the inaccuracies of survey data, but also and more importantly, because sunlight exposure was not reported, and the level of fortification of food was probably not accurately determined, and was most likely underestimated.
Uncertainty and Uncertainty Factors. Given the insensitivity of the endpoint, the fact that sample sizes were small, and that little data exist about sensitivity at the tails of the distributions, an adjustment in the NOAEL or use of a UF of 1.8 is warranted.
Derivation of the UL. Based on a NOAEL of 45 µg (1,800 IU)/day for infants and a UF of 1.8, the UL for infants up to 1 year of age is set at 25 µg (1,000 IU)/day.
|
UL for Infants |
0 through 12 months |
25 µg (1,000 IU)/day |
Children: Ages 1 through 18 Years
No specific data are available for age groups other than adults and infants. Increased rates of bone formation in toddlers (1 year of age and older), children, and adolescents suggest that the adult UL is appropriate for these age groups. In addition, serum calcium levels must support the increased deposition occurring, and no data indicate impairment or insufficiency in renal handling mechanisms by 1 year of age. Therefore, the UL of 50 µg (2,000 IU)/day for adults is also specified for toddlers, children, and adolescents.
|
UL for Children |
1 through 18 years |
50 µg (2,000 IU)/day |
Pregnancy and Lactation
The available data were judged inadequate to derive a UL for pregnant and lactating women that is different from other adults. Given the minor impact on either circulating vitamin D levels or serum calcium levels in utero or in infants seen with vitamin D supplements of 25 and 50 µg (1,000 and 2,000 IU)/day as previously discussed (Ala-Houhala et al., 1984, 1986), a concern about increased sensitivity during this physiologic period is not warranted.
|
UL for Pregnancy |
14 through 50 years |
50 µg (2,000 IU)/day |
|
UL for Lactation |
14 through 50 years |
50 µg (2,000 IU)/day |
Special Considerations
The UL for vitamin D, as with the ULs for other nutrients, only applies to healthy individuals. Granulomatous diseases (for example, sarcoidosis, tuberculosis, histoplasmosis) are characterized by hypercalcemia and/or hypercalciuria in individuals on normal or less-than-normal vitamin D intakes or with exposure to sunlight. This association is apparently due to the extrarenal conversion of 25(OH)D to 1,25(OH) 2D by activated macrophages (Adams, 1989; Sharma, 1996). Increased intestinal absorption of calcium and a proposed increase in bone resorption contributes to the hypercalcemia and hypercalciuria, and the use of glucocorticoids is a well-established treatment in these disorders (Grill and Martin, 1993).
Exposure Assessment
The vitamin D content of unsupplemented diets is, for the most part, low and averages about 2.5 µg (100 IU)/day for women (Krall et al., 1989; Murphy and Calloway, 1986). Diets high in fish, an exceptionally rich natural source of vitamin D (USDA, 1991) are considerably higher in vitamin D. Because milk is fortified to contain 10 µg (400 IU)/quart (9.6 µg [385 IU]/liter) of vitamin D, persons with high milk intakes also may have relatively high vitamin D intakes. A 1986 survey estimated that the ninety-fifth percentile of supplement intake by users of vitamin D supplements was 20 µg (800 IU)/day for men and 17.2 µg (686 IU)/day for women (Moss et al., 1989).
The endogenous formation of vitamin D3 from sunlight irradiation of skin has never been implicated in vitamin intoxication. This is due to the destruction of the previtamin and vitamin D3 remaining in skin with continued exposure to ultraviolet irradiation (Holick, 1996).
Risk Characterization
For most people, vitamin D intake from food and supplements is unlikely to exceed the UL. However, persons who are at the upper end of the ranges for both sources of intake, particularly persons who use many supplements and those with high intakes of fish or fortified milk, may be at risk for vitamin D toxicity.
RESEARCH RECOMMENDATIONS
-
Research is needed to evaluate different intakes of vitamin D throughout the lifespan by geographical and racial variables that reflect the mix of the Canadian and American population and the influence of sunscreens.
-
Regarding puberty and adolescence, research is needed to evaluate the effect of various intakes of vitamin D on circulating concentrations of 25 (OH)D and 1,25(OH)2D during winter at a time when no vitamin D comes from sunlight exposure. During this time, the body adapts by increasing the renal metabolism of 25(OH)D to 1,25(OH)2D and the efficiency of intestinal calcium absorption, thereby satisfying the increased calcium requirement by the rapidly growing skeleton.
-
It is very difficult to determine the reference values for vitamin D in healthy young adults aged 18 through 30 and 31 through 50
-
years in the absence of sunlight exposure because of their typically high involvement in outdoor activity and the unexplored contribution of sunlight to vitamin D stores. More studies are needed that evaluate various doses of vitamin D in young and middle-aged adults in the absence of sunlight exposure.
-
A major difficulty in determining how much vitamin D is adequate for the body's requirement is that a normal range for serum 25(OH)D is 25 to 137.5 nmol/liter (10 to 55 ng/ml) for all gender and life stage groups. However, there is evidence, especially in the elderly, that in order for the PTH to be at the optimum level, a 25(OH)D of 50 nmol/liter (20 ng/ml) or greater may be required. Therefore, more studies are needed to evaluate other parameters of calcium metabolism as they relate to vitamin D status including circulating concentrations of PTH.
-
The development of methodologies to assess changes in body stores of vitamin D is needed to accurately assess requirements in the absence of exposure to sunlight. Such work would markedly assist in the estimation of reference values for all life stage groups.


