
2
Background to Contemporary U.S. Immigration
At many times in the last two decades, photographs of our planet from outer space would have revealed movements of people on a massive scale. People have moved in response to the growing interdependence of the major economic powers and to the wide disparities between countries in income and employment opportunities. Migrants have also been driven by political factors—witness the large-scale shifts of populations from Eastern Europe and the former Soviet Union after the break-up of the Soviet hegemony and the famine- and war-induced migrations in Africa. By the early 1980s, 77 million people were living outside their country of birth, 14 million of them (about one in five) in the United States.
Because of its commanding economic position and its long-held reputation as a haven, the United States continues to attract immigrants—although movements of refugees and asylum seekers affect many European countries, Australia, and Canada as well. Temporary movements, stimulated in part by the demands of multinational companies for the rapid transfer of their employees, have become a major concern for developed nations. And fears about illegal immigration are not confined to the United States; other developed countries have experienced large, and often organized, flows of illegal immigrants. These developments highlight the need for a better understanding of the historical context for the global changes that form the backdrop to U.S. immigration.
In this chapter, we briefly outline the landmarks of this country's immigration legislation to highlight their role in shaping the historical ebbs and flows in the number of immigrants and in their characteristics. Second, we describe the main features of the long-term swings in these features of immigration. We detail the main characteristics of contemporary immigration laws, as shaped by our current "preference system." We then highlight the numbers and attributes of the other foreigners who come to our shores—the nonimmigrants and undocumented
immigrants. Finally, we compare U.S. approaches to immigration with those of other countries.
A Word about Terminology
For clarity's sake we first define a few terms that will be used in this volume. Immigration and emigration generally refer to movements of people into and out of the United States. Foreign-born persons who enter the United States for residence are immigrants;1 residents of the United States, whether native- or foreign-born, who leave the country to settle elsewhere are emigrants. Net migration is the difference between the two. If the number of people entering the United States exceeds the number who leave, net migration will be positive and immigration will contribute to America's population growth.
A distinction is made between legal and illegal (or undocumented) immigrants. Among those who intend to reside permanently in this country, legal immigrants apply for and receive permanent resident visas, "green cards" allowing them to live here indefinitely. Although illegal immigrants are often lumped together as if they formed one homogeneous group, people become illegal immigrants in three ways. The first way is by entering the country illegally; they enter without inspection and at some place other than a lawful point of entry, usually across a land border. The second way is by staying beyond the authorized period after their legal entry, as some foreign students do. And the third way is by violating the terms of their legal entry; tourists become illegal immigrants by taking jobs here.
Most people who enter the United States legally do not intend to become permanent residents. These people, referred to as nonimmigrants by the Immigration and Naturalization Service (INS), are authorized to stay in the United States for a specified length of time. The types of visas granted reflect the purpose of the visit to the United States, of which tourism is by far the most dominant. In addition, foreign students may study in the United States for several years; foreign diplomats and foreign members of the staffs of international organizations also have nonimmigrant status. This report largely ignores nonimmigrants, except when pertinent to its focus on the economic and demographic consequences of immigration.2
Finally, refugees and asylees are a special group of foreign residents who have fled their own countries because of a fear of persecution. The distinction between these two groups is that refugees apply for admission to an Immigration and Naturalization Service official outside the United States (think of Cubans seeking to flee Castro's Cuba), whereas asylees seek protection within the United States or at a port of entry (think of a defector from a foreign ballet company on tour in this country). Refugees and asylees are generally admitted to the United States as nonimmigrants, although their status may be adjusted later.
Although these are useful formal definitions, much of the evidence presented in this volume is based on data compiled by the Bureau of the Census, which frequently do not permit distinctions based on these terms of law. For example, the Census Bureau typically presents information on foreign-born persons without regard to their immigrant status. Many foreign-born persons enumerated in the decennial census are immigrants, but some are nonimmigrants and some are illegal immigrants. Census data also do not designate the visa status at the time of arrival in the United States, so we do not know whether a person may have entered the United States as a legal immigrant, as a refugee, or as a nonimmigrant who subsequently adjusted his or her status to permanent resident.
Moreover, census data on immigrants by period of arrival do not correspond to INS data on annual immigrant admissions. In INS data, immigrant arrivals are dated by the year in which an alien is admitted to the United States as a permanent resident; respondents to the census, however, are directed to provide the date at which they came to stay in the United States, which may be different.
U.S. Immigration Laws and Trends
During the last century, many restrictions on immigration have been placed into law by the federal government. These restrictions have dealt with five generic issues that have always been at the core of the country's political dialogue on immigration policy. First and most basic, how many people should be allowed into the United States? Second, within that number, who shall be let in and who shall be excluded? In those decisions, what weights should be assigned to nationality or race, family ties, economic contribution, and economic self-sufficiency?
Third, how should the United States deal with the unique problems that refugees pose? Fourth, what resources should be devoted to interdiction and deportation of illegal or undocumented immigrants, and what sanctions should be imposed on American institutions that deal with illegal immigrants, whether in the workplace, the schools, or hospitals? Finally, to what extent should the United States treat immigrants, whether legal or illegal, differently from citizens—in the right to vote, treatment by the criminal justice system, and eligibility for publicly provided services.3
|
3 |
An important aspect of immigration is the meaning and criteria for U.S. citizenship. Chapter 8 presents a comparison of citizenship requirements in the United States and in other countries, as well |
Immigration legislation over the past century has embodied the ever-evolving answers to these questions. Ebbs and flows in the volume and composition of immigration have not always been dictated by conscious policy decisions and legislation, but they certainly have been shaped by them. This section describes that evolution and also reviews recent legislation of special significance.
Until 1875, no direct federal legislation restricted admission of aliens into the country or the automatic qualification of immigrants and their children as citizens. States and the federal government did, however, impose some restrictions on immigration before 1875. In the colonial period, several colonies enacted laws to prohibit the entrance of criminals. After independence, many states restricted the entrance of paupers from outside the United States. And, before 1875, certain federal provisions affected immigration, such as laws to prohibit Chinese ''coolies" on American vessels. But even when there was little federal immigration legislation, immigration has been a subject of ongoing discussion throughout U.S. history. Changes in public policy have quickened in this century, which has witnessed periodic and significant revisions in federal immigration policy.
Table 2.1 provides a brief summary of major federal immigration legislation. The initial federal attempts at controlling immigration dealt not with overall numbers, but instead with the types of people who were admitted. The first restrictive immigration law, passed in 1875, prohibited persons who were destitute, engaged in immoral activities, or physically handicapped. Direct and blatant exclusion of people based on their race was a major focus of early immigration legislation. The Chinese Exclusion Act of 1882, for example, was largely a response to racism and to anxiety about threats from cheap immigrant labor. Until 1860, virtually all immigrants to the United States were from Germany, Ireland, and the United Kingdom. After 1860, growing numbers came from Scandinavia, China, and South America, drawn by the job opportunities in the expanding American West. In the 1860s, for instance, about one-third of the western miners were Chinese.4 As the numbers of immigrant laborers increased, so did opposition from native-born labor groups. This was the impetus behind the Chinese Exclusion Act. It limited the number of Chinese allowed to enter the United States; later amendments ultimately prohibited immigration of Chinese altogether.
The Immigration Act of 1891 broadened the role of the federal government in monitoring and regulating immigration. Creating the Office of Immigration, the precursor to today's Immigration and Naturalization Service, this act directed the superintendent of immigration to enforce immigration laws under the supervision of the secretary of the treasury.
Concern about Asian immigration, originally specific only to the Chinese,
|
|
as a discussion of recent naturalization trends. For a background on the evolution of the concept of citizenship, see Klusmeyer (1996). |
TABLE 2.1 Major U.S. Legislation on Immigration
|
Legislation |
Provisions |
|
Chinese Exclusion Act, 1882 |
Restricted immigration of Chinese laborers for 10 years. |
|
Prohibited Chinese naturalization. |
|
|
Provided deportation procedures for illegal Chinese in the United States. |
|
|
Immigration Act of 1891 |
Provided the first comprehensive immigration laws for the United States. |
|
Established the Bureau of Immigration within the Department of the Treasury. |
|
|
Directed the Immigration Bureau to deport unlawful aliens. |
|
|
Immigration Act of 1924 |
Imposed the first numerical limit on immigration. |
|
Began a national-origin quota system, which greatly restricted immigration from countries outside Northern and Western Europe. |
|
|
Immigration and Nationality Act of 1952 |
Continued national-origin quotas. |
|
Set a quota for aliens with skills needed in the United States. |
|
|
Immigration and Nationality Act Amendments of 1965 |
Repealed the national-origin quotas. |
|
Initiated a 7-category visa system for family unification and skills. |
|
|
Set a quota for Western Hemisphere immigration for the first time and set a country limit of 20,000 immigrants for the Eastern Hemisphere. |
expanded to the Japanese in the early twentieth century. The 1907 Gentleman's Agreement with Japan—so called because it was arranged with the cooperation of the Japanese government—restricted immigration from that country. Japanese immigration was formally and unilaterally prohibited in the Japanese Exclusion Act of 1924.
Even though the distinctions made in successive pieces of legislation may seem peculiar in today's light, each "new" wave of immigrants always has seemed different from its predecessors. For example, the sharp increases in the 1880s in "new" European immigrants—from Austria-Hungary, Italy, Greece, Poland, and Russia—provoked a strong reaction in the United States. This reaction intensified with the wave of immigrants in the first two decades of the new century—more than 1 million immigrants each year for several years, over half of whom were from Italy, Russia, and Austria-Hungary. And concerns became more urgent because the rise of immigration coincided, for some years, with periods of economic weakness and high unemployment in the United States. The Dillingham Commission, one of several appointed around this time to examine
|
Legislation |
Provisions |
|
Immigration and Nationality Act Amendments of 1976 |
Extended the 20,000 country limit for the Western Hemisphere. |
|
Refugee Act of 1980 |
Established the first systematic procedures for refugee admission. |
|
Removed refugees from the preference system for visa categories. |
|
|
Began a program for refugee resettlement. |
|
|
Immigration Reform and Control Act of 1986 |
Started employer sanctions for knowingly hiring illegal aliens. |
|
Created a program for legalizing illegal aliens already residing in the United States. |
|
|
Increased border enforcement. |
|
|
Immigration Act of 1990 |
Increased legal immigration ceilings. |
|
Tripled the numerical limits for employment-based immigration. |
|
|
Created a diversity admissions category. |
|
|
Illegal Immigration Act of 1996 |
Introduced a pilot telephone verification program for employer to authenticate the legal immigration status of potential workers. |
|
Expanded restrictions on access of legal immigrants to welfare benefits. |
|
|
Increased border enforcement. |
immigration, recommended that immigrants be required to be literate and that the ban on Asian immigrants be continued. Congress followed these recommendations in 1917 when it required immigrants over age 16 to be literate in English or their own language, and it banned those from certain "barred zones" in Asia.
Immigration slackened during World War I but resumed at a high level after the war, despite shortages of jobs and housing in this country. Then, public opinion shifted again. In response to the economic situation and with widespread public support, Congress enacted the 1921 Quota Act. This important piece of legislation and its follow-up in 1924 set the broad outlines of immigration policy for the next half century. Most important, it dictated that the favored few would come from countries that had already sent large numbers of immigrants. Using data from the 1910 census, the act limited immigration to 3 percent of the foreign-born population, by national origin, already in the United States.
In 1924, Congress reduced immigration to 2 percent of the foreign-born groups in the United States according to the 1890 census population. This cut immigration from Southern and Eastern Europe further. This change, like that
using the 1910 census, was temporary, and new national-origin limits went into effect (after several postponements) in 1929. The national origins system put into place then limited immigration from the Eastern Hemisphere to approximately 150,000.5 Each nation received a quota based on its proportion of the population according to the 1920 census. This system increased immigration from Southern and Eastern European nations compared with using the 1890 census of the foreign-born, but it still gave the largest quotas to the countries in Northern and Eastern Europe. The 1924 act also barred aliens who were ineligible for citizenship, thus excluding Asian immigrants (except for Filipinos) who, as a group, had been declared ineligible for U.S. citizenship in previous naturalization legislation.6
During the Great Depression and World War II, few immigrants came to America. The quota of 150,000 from the Eastern Hemisphere—in practice from Europe, because immigration from Asia was barred—was not fully filled because the United States at times made it difficult for immigrants to enter. Various groups feared that immigrants might take jobs from native-born Americans and they wanted tight enforcement of laws to prevent immigrants from becoming public charges. For the Western Hemisphere there were no quotas, either for the entire hemisphere or for individual nations. Immigrants had difficulty, however, finding employment, and local, state and federal governments sent many Mexicans home instead of placing them on welfare.
By the 1940s, there were substantial numbers of Hispanic residents in the southwestern region of the United States. Some Hispanic residents were descendants of original settlers in the area, having resided there prior to its incorporation by the United States. Others had entered in previous decades from Mexico, although many Mexicans were deported from the United States in the 1930s during the Great Depression.
An unintended consequence of the 1920s legislation was an increase in illegal immigration. Many Europeans who did not fall under the quotas migrated to Canada or Mexico, which were not subject to national-origin quotas; subsequently they slipped into the United States illegally. In response, during the 1920s, additional funds were regularly granted to establish the Border Patrol and to expand its operations. By the early 1930s, the Bureau of Immigration aimed the bulk of its attention at exclusion and deportation.
From 1943 to 1964, the United States authorized a special program for the admission of temporary agricultural workers from Mexico and other Latin American countries. Initiated as a way of aiding agricultural production during World War II, in 1947 the program became the legal basis for the Bracero Program, which lasted until 1964. This program allowed seasonal agricultural workers to be admitted on a temporary basis from Mexico to meet U.S. agricultural labor shortages. In practice, the federal government operated reception centers near the Mexican border that screened applicants who arrived from Mexican recruitment centers. The program oversaw the transportation of the farmworkers to the work sites and ensured that employers provided transportation and wages. Employers were required to pay the prevailing wages in the area, to employ the workers for at least three-quarters of the contract period, and to provide free housing and meals at reasonable cost. By the early 1960s, critics of the program were claiming that Braceros adversely affected the wages, working conditions, and job opportunities of resident farmworkers (Martin, 1996). At the same time, increased mechanization was reducing the heavy reliance on agricultural workers for several crops and political support for the program from farmers had weakened. In the final stages, the Mexican ambassador asked the U.S. government to continue the program, but President John F. Kennedy supported only a final two-year extension, and the program ended in 1964.
Although immigrants were relatively few throughout the 1930s and 1940s, there were large numbers of applications for refugee admission from Europeans fleeing Nazi persecution. Applications for legal admission into the United States increased following World War II—and so did illegal immigration. It was also clear by the late 1940s that many of the old immigration laws were outdated. Faced with large numbers of refugees seeking entrance into the United States, special legislation was required for each group. The national-origin quotas severely limited the numbers who could be admitted from Asia and Eastern Europe, yet many from these areas who wished to immigrate had desirable occupational skills. Congress responded by passing several laws permitting displaced persons and refugees to enter the United States outside the quotas.
President Harry S Truman believed that special legislation for refugees was not enough. He appointed a special commission in 1952 to examine immigration and naturalization law. Although the commission recommended substantial changes, Congress took no action. President Dwight D. Eisenhower also wanted the system liberalized, but reforms were delayed until 1965, when major amendments to the Immigration and Nationality Act were enacted. These amendments removed quotas and placed all countries on an equal footing with similar numerical quotas. Although only 20,000 immigrant visas could be issued to any single country in the Eastern Hemisphere, by the new rules, immigrants who had immediate relatives (spouses, children, and parents) in the United States would not be automatically excluded because of their national origin. The 1965 act also placed the first numerical limitation on immigration from the Western Hemisphere.
Thus, amid the complex workings of the 1965 preference system, the main outcome was that about 80 percent of the numerical limits were allocated to family members, mostly U.S. citizens; the rest went primarily to those with desirable job skills and their dependents. 7 A major feature of the 1965 reforms was that the number of immediate relatives of U.S. citizens was "uncapped" and not subject to numerical limits. In 1965, few policymakers foresaw that this provision would increase immigration, particularly from developing countries.
One of the unintended consequences of the 1965 legislation was that, in its wake, the labor market skills of successive groups of new immigrants (as measured by wages and education) gradually declined relative to those of native-born workers. The countries favored by the old 1924 national-quota system had become increasingly prosperous over time, and, with that prosperity, their citizens had become better educated and more skilled. In the 1950s, three of the top five sending countries of immigrants to the United States were in Europe—Germany, the United Kingdom, and Italy (the second was Canada and the fifth was Mexico). By contrast, the two European countries in the top 10 in the 1990s have been Poland and Ireland—and Ireland only in the single year 1994, because of a special provision favoring Ireland in the Immigration Act of 1990.8 Instead, Mexico has risen to the head of the list of sending countries, followed by the Philippines, Vietnam, the Dominican Republic, and China; the introduction of the 1965 rules has seen a dramatic increase in other Asian immigration. These countries are much less prosperous than those favored by the old national-origin system. Not surprisingly, their immigrants tend also to be less educated and less skilled, although a large number of professionals have come from Asia. This shift in major sending countries brought about by the 1965 legislation toward those of lesser economic development continues to have a major effect on the composition of U.S. immigration.
The 1980s and 1990s witnessed four major pieces of new legislation. Before 1980, the admission and resettlement of refugees had been governed by several pieces of legislation, including laws dealing with such special groups as Indochinese refugees. Refugees had been admitted to the United States with the humanitarian goal of offering protection to those fleeing persecution. The Refugee Act of 1980 modernized refugee policy and provided a systematic way of deciding who is a refugee. It also established a program for settling and assisting
refugees and established better coordination between the president and the Congress on this issue.
A major focus of recent legislation has been how to deal with problems associated with illegal immigrants, including the large numbers already living in the United States. The primary purpose of the Immigration Reform and Control Act of 1986 (IRCA) was to decrease the number of illegal immigrants by limiting their flow and by legalizing the status of illegal aliens already residing here. To accomplish the first goal, IRCA strengthened the Border Patrol and established penalties for employers who knowingly hire illegal immigrants—the so-called employer sanctions. It also set up a program that would admit agricultural workers when not enough native farmworkers were available; however, this program has not been used to date. The result of IRCA was the legalization of about 2.7 million persons who were residing in the United States before 1986 as illegal immigrants. The role of employer sanctions has been widely debated (Fix, 1991), but those established by IRCA, even in combination with a strengthened Border Patrol, may not have significantly diminished the flow of illegal immigrants (Bean et al., 1990).
The Immigration Act of 1990 substantially revised the laws relating to legal immigrants for the first time in 25 years. It continued the policy of family reunification by allowing an unlimited number of visas for immediate relatives of U.S. citizens; it addressed labor issues by reducing the number of visas for unskilled workers, simultaneously increasing the number of visas for priority workers and professionals with U.S. job offers; it made available 10,000 visas for investors with $1 million or more that they intended to use to create employment for at least 10 U.S. residents; and it promoted a more heterogeneous immigrant stream by opening "diversity" immigrant visas for "underrepresented" countries (countries that were adversely affected by the 1965 immigration amendments), with 40 percent of the visas for the years 1992 to 1994 reserved for Irish applicants.9
The vigorously debated Illegal Immigration Act of 1996 also sought to reduce illegal immigration in two ways. First, it set up a pilot project through which employers can verify by telephone the immigration status of potential workers. This effort is aimed at stemming the use of fraudulent identification records and thus hindering illegal immigrants in their search for work. Second, the act bolstered the Border Patrol by adding guards and by strengthening the physical barriers where crossing traffic is heaviest.
Although immigration policy is not their principal focus, several pieces of recent legislation have a bearing on immigration and offer examples of the ways in which the federal government has been developing immigrant policies. The
Anti-Terrorism Act of 1996 was concerned primarily with strengthening the prevention of terrorism in the United States and imposing the death penalty for acts of terrorism. The act sets out criteria for the exclusion of foreign-born persons who are members of terrorist organizations and precludes asylum for them. The act broadens the range of offenses for federal prosecution, permits faster deportation procedures (for nonviolent crimes), and authorizes state and local police to arrest illegal immigrants.
The Personal Responsibility and Work Opportunity Reconciliation Act of 1996 has several features of great importance for U.S. immigrants. First and foremost, during the first five-years of their residence in the United States, it restricts access to and use of public assistance programs for legal immigrants who are not citizens. It also bars noncitizen immigrants who have been here for more than five-years from some federal welfare programs. It thus increases the incentive for permanent-resident aliens, especially poorer ones, to apply for naturalization after the requisite five-years because citizenship is a prerequisite for welfare eligibility. The act also sets a lifetime limit of five-years on the use of public assistance by any individual—a restriction that applies not just to legal immigrants but to all residents.
The exclusion of immigrants from public programs is not without precedent. For example, before current welfare reforms, some permanent residents whose entry was family-based had part of their sponsor's income taken into account in determining eligibility for three federal assistance programs—Supplemental Security Income (SSI), Aid to Families with Dependent Children, and food stamps) in their first three-years in the United States (the first five-years for SSI). (The sponsor is the person who promised to provide support for the immigrant as part of the immigration process.) Until the early 1950s, most Asian Americans who were foreign-born could not become naturalized citizens and so they could not vote or, in some states, own land. In another situation, Mexicans who came to the United States under the Bracero Program were not eligible for citizenship, nor could they apply for state or federal public assistance programs. Until an immigrant becomes a U.S. citizen, he or she does not have the right to vote. Finally, the Constitution provides that no immigrant can become president of the United States. Although always part of the national dialogue on immigration, the extent to which distinctions should be made between the native-born and the foreign-born has become an increasingly intense part of the debate.
Background to Immigration Numbers
Immigration affects the size, composition, and distribution of populations, at any particular time and also, with continued immigration, over time. From a policy perspective, it is important to distinguish between flows and stocks of immigrants. Flows refer to people moving into the United States over a given period of time—say, the number of people admitted in calendar year 1990, as
tallied by the Immigration and Naturalization Service.10 Stocks consist of immigrants resident in the United States at a given point in time— say, as enumerated in the 1990 census. In general, policy most directly affects the flows of immigrants into the United States rather than the accumulated stock of all immigrants. Such an emphasis is understandable since, when compared with longer-term residents, recent immigrants are more likely to experience problems of economic and social adjustment, and they are likely to affect the community more immediately and more visibly.
Although it is important to monitor and analyze contemporary patterns of immigration, they must also be placed in a longer-term perspective. Doing so not only aids in the detection of emerging trends, but also promotes understanding of the unique characteristics and problems of the stock of immigrants at any particular point in time. In the remainder of this section, we briefly sketch the history of American immigration.
Volume of Immigration
U.S. immigration has been characterized by several wide swings. The data that have been compiled since the inception of official record keeping in 1821 reveal the boom in immigration from the late decades of the nineteenth century through the period immediately preceding World War I (see Figure 2.1).11 This period, one of rapid urbanization and industrialization in the United States, saw especially large immigration from Southern and Eastern Europe. The peak year for admission of new legal immigrants to the United States was 1907, when almost 1.3 million immigrants entered and added more than 3 percent to the U.S. labor force.
After a trough during World War I, the Great Depression, and World War II, immigration increased steadily in subsequent decades. Compared with Europe
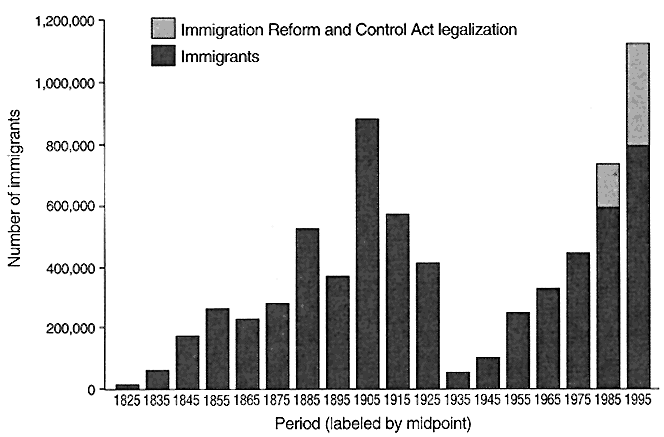
Figure 2.1
Average annual number of legal immigrants into the United States, 1820-1995.
and many other areas of the world, the United States enjoyed a high degree of political freedom and economic prosperity. Its expanding manufacturing and construction sectors offered ample job opportunities for a new wave of immigrants. The 1965 liberalizing changes in immigration legislation prompted even further increases, as the United States began to receive new immigrants from Asia and Latin America. At the same time, illegal immigrants began appearing in significant numbers. Since 1965, both the de jure changes in immigration law and the de facto situation regarding enforcement that has affected illegal immigration have dramatically altered the pattern of countries of origin.12
As the result of the liberalizing changes, coupled with the steady allure of the U.S. economy, immigration has had considerable influence on population growth in the United States during the twentieth century. Any meaningful discussion of that impact must deal not only with sheer numbers, but also with the ratio of immigrants to the resident population. Figure 2.2 presents the same immigration
|
12 |
One complexity in Figure 2.1 deserves special mention. About 2.7 million formerly illegal immigrants received amnesty in 1986 and were allowed to seek permanent-resident status beginning in 1989. As these legalized aliens adjusted their legal status, the Immigration and Naturalization Service recorded them as new immigrants. A large proportion of the "immigrants" in official government data from 1989 to 1992 were persons who in fact had resided in the United States since before 1986. In 1991, for example, the INS recorded a total of 1,827,000 new immigrants; 1,123,000, or 61 percent, of those immigrants were IRCA legalization residents. The balance included 443,000 new arrivals and 261,000 persons adjusting from refugee and other forms of nonimmigrant status. |
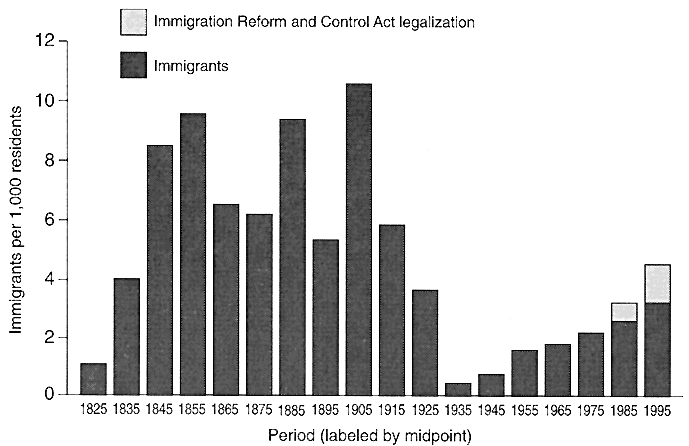
Figure 2.2
Average annual number of legal immigrants into the United States per 1,000 residents, 1820-1995.
data that is arrayed in Figure 2.1, but expressing the annual number of immigrants relative to 1,000 U.S. residents. This relative measure is a much better index of the nation's ability to absorb, both economically and culturally, a given number of immigrants.13 Figure 2.2 puts the volume of current immigration in a very different light. For example, the U.S. population was 263 million in 1995, more than three times the 76 million of 1900, and it will probably reach about 277 million in 2000. The number of immigrants has grown, too, but the ratio to total population is now about one-half that of the early twentieth century—5 per 1,000 for 1990-2000 compared with 11 per 1,000 in 1900-1910. 14
Another way to look at immigration and population change is to ask how much of population growth is attributable to immigration. Assuming a continuation of current trends through the end of the decade, the U.S. population will
grow by 22.1 million. Net immigration will be 8.2 million, or 37 percent of the population change for the 1990s. Even though immigration is now at a much lower rate than it was at the turn of the century, it plays a greater role in population growth than it did then—37 percent compared with 28 percent for the 1900 to 1910 decade. The reason lies with the other contributor of population growth—the number of births to the resident population, which has dropped with the decline in overall fertility rates.
The Impact of Immigration on Population
Changes in the foreign-born population lag shifts in immigration. As immigrants enter the country, they affect the composition of the population in several ways. First, they can alter the racial and ethnic composition of the population if their proportions on those dimensions differ from those of the resident population. Second, new immigrants add to the foreign-born population, thus increasing the fraction of the population that is foreign-born. The size of the foreign-born population derives principally from past levels of immigration, but it is also affected by emigration and mortality. High levels of recent immigration combined with little emigration would increase the size of the foreign-born population. As time passes, mortality begins to diminish entry cohorts so that the numbers of foreign-born decrease if they are not replenished by additional immigrants.
The foreign-born population then represents the cumulative number of past immigrants, diminished by mortality and emigration. Figure 2.3 charts the number of foreign-born residents over time; Figure 2.4 expresses that number as a fraction of the U.S. Population.
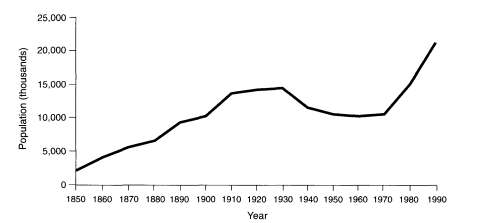
Figure 2.3
Number of foreign-born residents in the United States, 1850-1990.
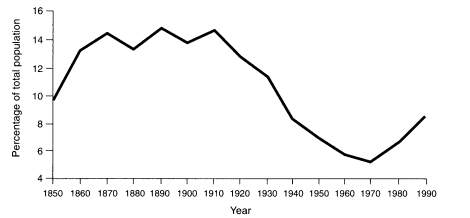
Figure 2.4
Percentage foreign-born residents in the United States, 1850-1990.
The size of the foreign-born population in the United States has reflected, with a lag, the changing course of immigration. Approximately 2.2 million foreign-born persons resided in the United States in 1850, accounting for 9.7 percent of the total population. With the continuing heavy immigration of the late nineteenth and early twentieth centuries, the foreign-born population grew steadily, reaching a peak of about 14.4 million in 1930. At the same time, it increased as a proportion of the U.S. population. The proportion peaked at about 15 percent in 1890, but it changed little between 1860 to 1920, hovering around 13 to 15 percent, because the native-born population grew at the same rate as the foreign-born population during that period.
With the decline in immigration and with considerable emigration during World War I, the Great Depression, and World War II, the foreign-born population decreased in both number and proportion as mortality reduced the aging wave of immigrants from the turn of the century. From 1930 to 1970, the number of foreign-born residents in the United States declined to 10.5 million, roughly the same as in 1900. The proportion of foreign-born in the total population began decreasing earlier, after 1910, as the native-born population grew relatively more rapidly. It reached a low in 1970, when it accounted for only 1 out of 20 Americans.
The large increase in immigration that began in the 1960s ended the 40 year decline in the foreign-born population. By 1995, the number of foreign-born persons residing in the United States reached 25 million, the highest level in the nation's history. Their current proportion to the population, however, is less than two-thirds of that which prevailed from 1860 to 1920: just over 8 percent of the population was foreign-born in 1990 versus 13 to 15 percent at the turn of the century. Assuming that immigration and emigration continue at current levels to
2000, the foreign-born population will increase to about 28 million and the percentage will increase to about 10 percent, a ratio still considerably below those of a century ago.
Country and Region of Origin of Immigrants
Our review of the history of immigration legislation indicated that the national origin of immigrants into the United States has experienced large shifts twice: in the period from about 1880 to 1920, immigration from the United Kingdom (including Ireland at that time), France, Germany, the Benelux countries, and the Scandinavian countries decreased and immigration from Southern and Eastern Europe increased. More recently, a greater proportion of immigrants has been originating in Asia and Latin America.
With these recent shifts, the composition of the foreign-born by national origin has changed; Figure 2.5 displays these historical trends. As a companion to this series, Table 2.2 lists the region of origin of the foreign-born population in selected census years from 1850 to 1990. Before the Immigration and Nationality Act Amendments of 1965 changed the national-origin quotas, Europe and Canada were the dominant sources of U.S. immigrants. Almost two-thirds of immigrants during the 1950s came from these areas. The rest were from Asia (6 percent), Mexico (12 percent), and other countries of Latin America (14 percent).
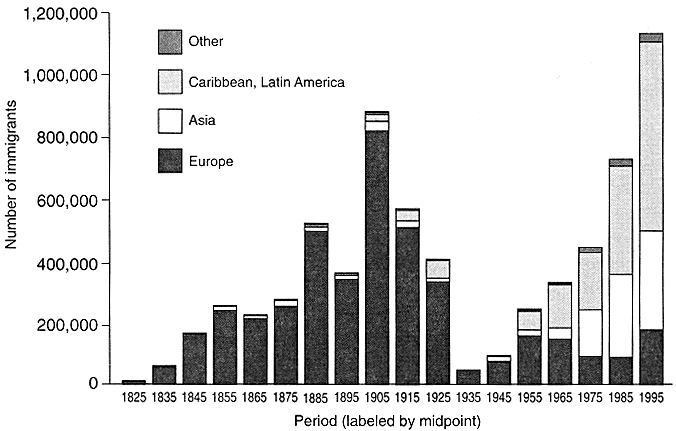
Figure 2.5
Average annual number of legal immigrants into the United States by region of last residence, 1820-1995.
TABLE 2.2 Region of Origin of Foreign-Born Population in the United States, 1850-1990
|
Region of Origin |
1850 |
1900 |
1950 |
1970 |
1990 |
|
Canada and Europe |
97% |
98% |
89% |
67% |
26% |
|
Caribbean and Latin America |
1 |
1 |
6 |
19 |
43 |
|
Asia |
0 |
1 |
3 |
9 |
25 |
|
All othersa |
2 |
0 |
2 |
5 |
6 |
|
Total Foreign-born population (in millions) |
2.2 |
10.3 |
10.4 |
9.6 |
19.8 |
|
a The all other category includes Africa, Oceania, Pacific and Atlantic Islands, persons born at sea, and persons with no reported region of origin. Source: U.S. Bureau of the Census (1975: Part 1; 1993). |
|||||
As the number of legal immigrants rose during each of the past four decades, from 2.5 million in the 1950s to 6 million in the 1980s, their racial and ethnic composition has also changed.
Immigration from Europe and Canada has decreased steadily both in absolute and relative terms during the past four decades. By the 1990s, only about 14 percent of legal immigrants came from these traditional sources.15 In relative terms, the biggest gain has been by Asia, which had 6 percent of legal immigrants in the 1950s and 44 percent in the 1980s. About 2.6 million Asians entered legally in the 1980s, more than all immigrants in the 1950s.
Latin American immigration expanded from 26 percent of legal immigration in the 1950s to 40 percent in the 1960s, where it has remained since. In the 1980s, Latin America accounted for 2.4 million of legal immigrants. Mexico is the largest single source of legal immigrants, accounting for 12 to 14 percent of the flow during each of the past four decades. When illegal immigration is included, Latin America far surpasses Asia as the source for immigration, and Mexico becomes the predominant single source of immigrants into the United States.
Current U.S. Immigration Policy
U.S. immigration policy has revolved around five fundamental factors: social, economic, diversity, humanitarian, and national security. Although current
debate tends to emphasize the economic aspects of immigration, immigration policy has historically been based on a broader set of policy goals, especially on the principles of family reunification. The social goal of family reunification is principally to unite nuclear families. It has strong and sustained political support from its main beneficiaries—U.S. citizens who wish to sponsor their family relatives for immigration to the United States.
Some aspects of the economic goals for immigration may conflict—for example, allowing workers to enter who have skills and can secure U.S. employment, yet guarding the wages and employment opportunities for resident workers.
One aim of the 1990 Immigration Act was to diversify immigration into the United States. In a major reversal from the early decades of the twentieth century, the stream of immigrants in recent decades has been dominated by Hispanics and Asians. The effort became to promote pluralism by expanding the proportion of European immigrants.
Fulfilling the goal of humanitarian assistance, about one-fourth of the immigrants admitted into the United States since 1945 have been refugees and asylees. Refugee admissions as a proportion of total immigration, including illegal immigration, has decreased in recent years, now accounting for about 15 percent. These admissions have been guided by the goal of offering protection to those fleeing persecution. The current legislative framework for humanitarian admissions is the 1980 Refugee Act, which has three goals: to base admissions on recognized international criteria; to create a more manageable flow of refugees; and to establish a program for resettling refugees with financial, medical, and social support. Since 1980, U.S. policy has recognized that many refugees arrive in the United States without money, family, or ways of making a living.
Emigration
A substantial proportion of immigrants leave the United States. Some fail to find jobs or to adjust to life here. Others discover better opportunities back home. A few decide to move to a third country.
There have been emigrants as long as there have been immigrants. Some of the first colonists eventually returned to England. After the War of Independence, many U.S. residents moved to Canada, primarily to New Brunswick and Nova Scotia. Many turn-of-the-century immigrants from Italy, Greece, and Poland went home. It appears that a substantial proportion of immigrants at the turn of the century, particularly males, moved to the United States on a temporary basis. They earned income, accumulated some money, and returned after several years to their home country. These temporary immigrants were, in some ways, similar to the temporary farmworkers who were admitted to the United States under the Bracero Program from 1943 to 1964 and possibly also to recent illegal sojourners to the United States.
Information on emigration is important for several reasons. In terms of simple numbers, emigration is part of the equation that yields net immigration—which, after all, is what implants lasting effects in the U.S. economy and population. Even in the short term, the admission of I million immigrants a year would have vastly different consequences, depending on whether, say, all of them stayed or 500,000 among them returned. Beyond mere numbers, emigration alters the characteristics of immigrant cohorts; we discuss in Chapter 8 the issues in connection with language. Similarly, virtually all labor market tests of the ability of immigrants to assimilate into the labor market follow cohorts of entering immigrants. If large fractions of a cohort emigrate and we do not have good estimates of the selectivity of this emigration, then it is impossible to know whether the cohort successfully assimilated or not.
Emigrants select themselves, but why? They may be the most skilled, drawn by better job prospects in other countries, in which case the average labor market success among those who remain is lowered. The less skilled, too, may be drawn by better prospects elsewhere, thus improving the average quality of the remaining cohort of immigrants.
Demographic information on emigration is particularly scarce and elusive. Estimates of the level of emigration are periodically updated, but these contain a substantial range of estimates. There is some information on the relationship between emigration and variables such as country of origin and sex. However, definitive knowledge is lacking on the relationship between emigration and many important behavioral variables, including fertility, the use of public assistance programs, and labor force characteristics.16
Some demographic studies have sought to identify the influence of sex and schooling on emigration (see Jasso and Rosenzweig, 1990:138-148). They suggest that men tend to emigrate more than women do, and, at least in earlier periods, that those with more schooling tend to return more than those with less. Interpreting these observations calls for caution, because the information is limited and because it is not current.
Still, available studies suggest that a high proportion of illegal immigrants are sojourners: they come to the United States for several years but eventually return to their home countries. According to studies by Douglas Massey and his colleagues (Massey et al., 1990), a high proportion of Mexican illegal immigrants return to their original villages after one or more prolonged periods of working in the United States.
These caveats aside, available estimates suggest that between roughly 35 and
45 percent of immigrants emigrate—either to return to their home country or to move to a third country (Jasso and Rosenzweig, 1990:124). Gross legal immigration numbers of about 800,000 per year, therefore, overstate the net effect of immigration.
Immigrants have a lesser or greater tendency to return to their home country, depending on where that is. Europeans have the highest rate of emigration, followed by those from the Western Hemisphere and from Asia. These numbers are of obvious importance for assessing the net immigration rates of people from these regions. The differences between gross and net immigration figures are generally greater for European countries than for Asian countries, for example, because of their higher emigration rates.
Using data from the 1990 decennial census and from the Current Population Survey in conjunction with demographic estimates of immigration and mortality, Census Bureau demographers Bashir Ahmed and Gregg Robinson (1996) suggest that emigration currently totals about 300,000 per year. Given about 800,000 legal immigrants a year, emigration claims about one-third of immigrants.17
Legal Immigrants
The tension among policy goals becomes clear in examining the complex set of rules governing entry of legal immigrants. Current U.S. policy sets limits on both the overall number of immigrants and the number of immigrants in various categories. In pursuit of varying policy goals, however, these limits are tempered by exceptions. Categories are temporarily changed to accommodate new needs for humanitarian assistance, and new categories are introduced to allow for special cases. Given this complexity, it would be impossible to completely describe current policy in a few pages, so the following gives only its outlines—intended both to give a general idea of current policy and to illustrate its complexity.
Current U.S. immigration policy sets a flexible annual limit on the number of new legal immigrants, and then uses a complex preference system to decide which applicants will be given visas. The baseline annual limit now stands at 675,000 immigrants, down from 700,000 during the 1992-94 fiscal years. The annual
limit is flexible in the sense that it may be higher in a given fiscal year if some of the preference visas went unused in the previous year. It is also not an absolute limit, in that the number of immigrants in a given year can exceed the cap because some categories of immigrants have no numerical limits—spouses, minor children, and parents of adult U.S. citizens; children born abroad to legal permanent residents; refugees and asylees who are adjusting their status to permanent resident; and a few other groups such as Amerasians and persons eligible for legalization under IRCA.
Numerically limited immigration consists of two broad categories with separate limits—family-sponsored preferences and employment-based preferences. These are subdivided into groups, each of which is allotted a certain number of visas based on immigration levels in the previous years. Table 2.3 gives the categories of admission with their limits and numbers of admissions for 1995. Admissions for a particular category include dependents of immigrants admitted under that classification, where applicable. Unused visas in higher preference subgroups may be reallocated to lower preference subgroups within that same category. Small differences between the numerical limit and the number of actual immigrant admissions may also occur because immigrants who are granted visas have four months to use them and may not decide to enter the United States until the following year.
In addition to the limits on overall numbers, there is a provision requiring that no more than 7 percent of family or employment preferences go to immigrants from any one country. Because of uneven demand within the categories, visas in one country may go unused while applicants from other countries are denied visas because their country's limit has been reached.18
Most recent immigrants were admitted on the basis of family ties to persons living in the United States. In 1995, relatives accounted for almost two-thirds of total admissions. Spouses and minor children of U.S. citizens made up 31 percent of total admissions. Those admitted under employment-based preferences and refugees accounted for most of the remainder of total admissions: 12 percent and 16 percent, respectively. Even among employment-based admissions, family ties are important: as can be seen in Table 2.4, over half of immigrants admitted in 1995 on employment-preference visas were spouses or children of those entering for employment purposes.
Because relatives of U.S. citizens account for such a large fraction of current immigration, that group would be affected by any sharp decrease in the number of immigrants admitted into the United States. Although admission of close rela-
TABLE 2.3 Allocation of Permanent Residence Visas, Fiscal Year 1995
|
Type of Visa |
1995 Limit |
1995 Admissions |
|
|
Family-sponsored preferences, total |
253,721 |
238,122 |
|
|
1st |
Unmarried adult children of U.S. citizens |
23,400 |
15,182 |
|
2nd |
Spouses, minor children, and unmarried adult children of permanent residents |
114,200 |
144,535 |
|
3rd |
Married adult children of U.S. citizens |
23,400 |
20,876 |
|
4th |
Brothers and sisters of U.S. citizens (at least 21 years of age) |
65,000 |
57,529 |
|
Employment-based preferences, total |
146,503 |
85,336 |
|
|
1st |
Priority workers |
41,858 |
17,339 |
|
2nd |
Professionals with advanced degrees or aliens of exceptional ability |
41,858 |
10,475 |
|
3rd |
Skilled workers and professionals, Chinese Student Protection Act, and needed unskilled workers |
41,858 |
50,245 |
|
4th |
Special immigrants |
10,465 |
6,737 |
|
5th |
Employment creation (''investors") |
10,465 |
540 |
|
IRCA dependents |
0 |
277 |
|
|
Diversity immigrants |
55,000 |
47,245 |
|
|
Immediate relatives of U.S. citizens |
none |
220,360 |
|
|
Children born abroad to permanent residents |
none |
1,894 |
|
|
Refugee and asylee adjustments to permanent resident |
none |
114,664 |
|
|
Miscellaneous categories (IRCA legalization, Amerasians, parolees) |
none |
12,563 |
|
|
Total |
|
720,461 |
|
|
IRCA = Immigration Reform and Control Act of 1986 Sources: Data from U.S. Immigration and Naturalization Service (1997:Tables A and 4). |
|||
TABLE 2.4 Admissions by Detailed Category, Fiscal Years 1993 and 1995
|
Type of Admission |
1995 |
1993 |
|
|
Family-preference admissions, total |
238,122 |
226,776 |
|
|
1st |
Unmarried adult children of U.S. citizens |
11,219 |
9,636 |
|
|
Children of those unmarried adult children |
3,963 |
3,183 |
|
2nd |
Spouses of permanent residents |
38,828 |
43,033 |
|
|
Children of permanent residents |
59,574 |
41,450 |
|
|
Children of those spouses or children |
12,558 |
14,121 |
|
|
Unmarried adult children of permanent residents |
24,174 |
23,221 |
|
|
Children of those unmarried adult children |
9,401 |
6,483 |
|
3rd |
Married adult children of U.S. citizens |
5,719 |
6,475 |
|
|
Spouses of those married adult children |
5,052 |
5,667 |
|
|
Children of those married adult children |
10,105 |
11,243 |
|
4th |
Brothers and sisters of U.S. citizens |
19,332 |
20,983 |
|
|
Spouses of those brothers and sisters |
13,293 |
14,014 |
|
|
Children of those brothers and sisters |
24,904 |
27,267 |
|
Employment-preference admissions |
85,336 |
147,012 |
|
|
1st |
Aliens with extraordinary ability |
1,194 |
1,259 |
|
|
Outstanding professors or researchers |
1,617 |
1,676 |
|
|
Multinational executives or managers |
3,922 |
5,088 |
|
|
Spouses and children of 1st preference immigrants |
10,606 |
13,091 |
|
2nd |
Professionals holding advanced degrees |
4,952 |
13,801 |
|
|
Spouses and children of those professionals |
5,523 |
15,667 |
|
3rd |
Skilled workers |
9,094 |
12,813 |
|
|
Professionals with a baccalaureate degree |
5,792 |
9,560 |
|
|
Spouses and children of skilled workers and professionals |
23,262 |
28,434 |
|
|
Chinese Student Protection Act |
4,213 |
26,915 |
|
|
Needed unskilled workers |
3,636 |
4,405 |
|
|
Spouses and children of unskilled workers |
4,248 |
5,562 |
|
4th |
Ministers and their spouses and children |
1,993 |
2,291 |
|
|
Other religious workers and their spouses and children |
2,506 |
2,909 |
|
|
Miscellaneousa |
2,238 |
2,958 |
|
5th |
Employment creation |
540 |
583 |
|
Immediate relatives of U.S. citizens, total |
220,360 |
255,059 |
|
|
Spouses |
123,238 |
145,843 |
|
|
Children |
48,740 |
46,788 |
|
|
Parents of adult U.S. citizens |
48,382 |
62,428 |
|
|
Children born abroad to permanent residents |
1,894 |
2,030 |
|
|
Type of Admission |
1995 |
1993 |
|
Dependents of IRCA-legalized permanent residents, total |
277 |
55,344 |
|
Spouses |
105 |
17,145 |
|
Children |
172 |
38,199 |
|
Diversity immigrants |
47,245 |
33,468 |
|
Refugee and asylee adjustments, total |
114,664 |
127,343 |
|
Cuban refugees |
9,579 |
6,976 |
|
Other refugees |
97,248 |
108,563 |
|
Asylees |
7,837 |
11,804 |
|
Amerasians |
939 |
11,116 |
|
Miscellaneous other adjustments and arrivalsb |
7,357 |
21,866 |
|
Total |
720,461 |
904,292 |
|
IRCA = Immigration Reform and Control Act of 1986 a Employees of U.S. government abroad, Panama Canal Act, foreign medical graduates, retired employees of international organizations, juvenile court dependents, aliens serving in the U.S. Armed Forces, and the spouses and children of such immigrants. b Includes displaced Tibetans, employees of U.S. businesses in Hong Kong, Cuban/Haitian entrants, former H-1 nurses, parolees from the Soviet Union or Indochina, miscellaneous other adjustments, American Indians born in Canada, and children born subsequent to issuance of visa. Source: U.S. Immigration and Naturalization Service (1994:Table 5; 1997:Table 5). |
||
tives of U.S. citizens seems to have broad support, even some of these immigrants have aroused misgivings. For instance, concern that sham marriages were being used to gain admission led to passage of the Immigration Marriage Fraud Amendments of 1986. Under these amendments, an immigrant who is admitted based on his or her recent marriage to a U.S. citizen or permanent-resident alien receives a conditional visa and must show the Immigration and Naturalization Service that the marriage was and is still intact at the end of two-years, a condition that 94 percent of the cases reviewed in 1994 satisfied. A second concern has been use of Supplementary Security Income (SSI) benefits by immigrant parents of U.S. citizens. Without a history of work in the United States, most such immigrants are not eligible to receive earned Social Security retirement benefits, and SSI becomes an alternative source of income for some elderly people with few other resources. Partially in response to this concern, the recent welfare reform legislation has cut off immigrants' eligibility for SSI until they achieve citizenship.
Immigrants with family ties to U.S. citizens account not only for the majority of current immigrants, but also for the vast majority of those who are on waiting
lists for visas. As Table 2.5 illustrates, as of January 1994, about 3.6 million people were on the U.S. State Department lists of persons registered for visas, most of whom had registered as family-preference immigrants. Two preferences had over 1 million registrants: spouses and minor children of permanent residents and brothers and sisters of U.S. citizens. Waits for visas are particularly long for applicants from the Philippines, Mexico, and India. For example, in December 1996 immigrant visas for brothers and sisters of U.S. citizens from the Philippines were issued to those whose U.S. relative had petitioned for their immigration in November 1977 (Bureau of Consular Affairs). Given the growth in the number of registrants in this category since 1977, recent applicants can expect an even longer wait if current immigration provisions are maintained.
In the employment-preference categories, the majority of admissions are of skilled workers or those admitted on the basis of high levels of education, along with their dependents. Executives and managers of multinational corporations are also an important component of these admissions, accounting for 58 percent
TABLE 2.5 Immigrant Waiting List, January 1994
|
Type of Preference |
Number |
|
|
Family Preferences, total |
3,462,147 |
|
|
1st |
Unmarried adult children of citizens |
63,499 |
|
2nd |
Total |
1,498,075 |
|
|
Spouses, minor children of permanent residents |
1,047,496 |
|
|
Unmarried adult children of permanent residents |
450,579 |
|
3rd |
Married adult children of citizens |
257,110 |
|
4th |
Brothers and sisters of citizens |
1,643,463 |
|
Employment preferences, total |
149,974 |
|
|
1st |
Priority workers |
8,315 |
|
2nd |
Professionals with advanced degrees, aliens of exceptional ability |
11,159 |
|
3rd |
Total |
125,083 |
|
|
Skilled workers and bachelor's degree holders |
30,735 |
|
|
Unskilled workers |
94,348 |
|
4th |
Special immigrants |
5,241 |
|
5th |
Employment creation ("investors") |
176 |
|
Total |
|
3,612,121 |
|
Source: U.S. Commission on Immigration Reform (1994:Table 6:198). |
||
of all priority workers in 1995. The majority (56 percent) of employment-preference immigrants in 1995 were born in Asia, with China, the Philippines, and India sending the largest numbers. A relatively small number of unskilled workers are admitted each year as employment-preference immigrants. This unskilled category accounts for the largest backlog of applications for employment-preference visas, with about 94,000 registrants in January 1994, of a total of about 150,000 in the employment category.
Diversity immigrants fall outside the preference system but also face numerical limits. In 1994, Poland, Ireland, the United Kingdom, and Canada together accounted for 92 percent of the immigrants admitted under the temporary version of this program. The permanent version of this program, which started in 1995, provides 55,000 visas to nationals of countries that have sent fewer than 50,000 legal immigrants to the United States over the previous five-years. Applicants from eligible countries must have at least a high school education and two-years of work experience. The 55,000 visas are allocated to six broad regions in proportion to their populations (excluding ineligible countries) and then are distributed to applicants from eligible countries within those regions through an annual lottery. For the 1998 lottery, the majority of visas will be allocated to Africa and Europe, from which Great Britain and Poland are excluded.
Total immigrant admissions vary substantially from year to year, due both to legislated changes and to changes in the number of visa applicants in the categories that are not oversubscribed. To illustrate these shifts, Table 2.4 includes detailed admissions for 1993 as well as 1995. The higher level of immigration in 1993 was due in part to special provisions for particular immigrant groups: the allocation of 55,000 additional visas specifically for the spouses and children of IRCA-legalized permanent residents in fiscal years 1992-94; the allowance for certain Chinese nationals to adjust their status to permanent resident as employment-preference immigrants, put in place by the Chinese Student Protection Act in October 1992; and provision of visas for Amerasians, for whom admissions peaked in 1992. The difference between admissions in the two-years also reflects changes in the number of admissions in certain categories; the number of immigrant spouses and parents of U.S. citizens admitted into the United States was substantially lower in 1995 than in 1993, as were employment-preference immigrants.
The Changing Size of Government
The America to which the immigrants are arriving today differs in salient ways from the America of earlier immigrant waves. One of the most critical lies in the changing role of government at all levels. Immigrants have always affected governmental outlays and receipts, and cries that they bankrupt school budgets or the dole were often heard in the nineteenth and early twentieth centuries.
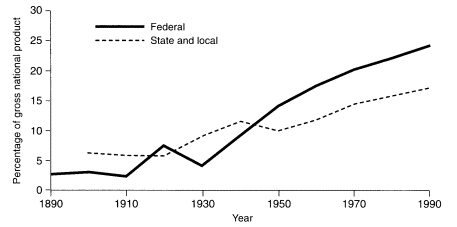
Figure 2.6
Government expenditures as a proportion of gross national product, federal and state and local governments, 1890-1990 (percentage).
Source: U.S. Bureau of the Census (1975, 1996).
On this dimension, America is very different today. To demonstrate this difference, Figure 2.6 presents government expenditures as a fraction of gross national product (GNP) for federal, state, and local units.19 During the last decades of the nineteenth century and the first few decades of the twentieth, the relative size of governments was low and stable. Expenditures at the federal level were only 3 percent of GNP and those at all levels accounted for less than 10 percent. Any assessment of the fiscal effects of these earlier waves of immigration, whether positive or negative, must be considerably less important in an overall evaluation of immigration. Figure 2.6 shows how different our world has become. Starting with the initiatives of the New Deal, government spending at all levels expanded rapidly, with little sign of abatement. By 1993, the federal government allocated about one-quarter of the gross domestic product (GDP), and state and local governments nearly one-fifth. Combined, the share of government spending in the country's economy has expanded four-fold from the time of the immigrant waves at the beginning of this century.
Nor it is only the level of government that has changed. Figure 2.7 divides the federal government spending into four categories: national defense, interest on the public debt, veterans benefits (largely veterans of the Civil War in the early periods), and other government expenditures. The principal historical trend
|
19 |
A portion of the federal budget consists of outlays to state and local governments. There is some double counting in Figure 2.6, but it is a relatively small amount and does not significantly alter these trends. |
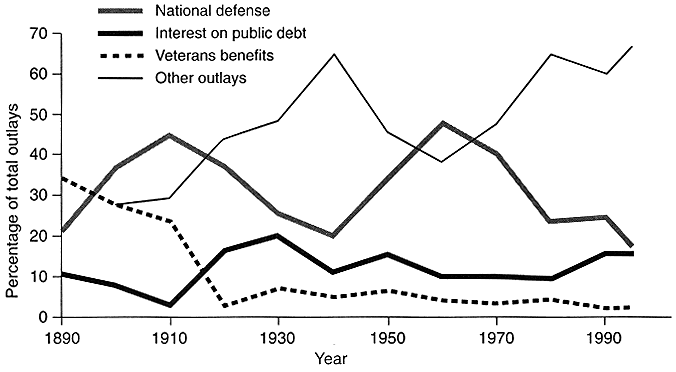
Figure 2.7
Outlays of the federal government by major categories, 1890-1996.
Source: U.S. Bureau of the Census (1975, 1996).
is the decline in the first three categories in favor of the fourth. For example, in 1900 other government expenditures accounted for 28 percent of the total: today it represents 66 percent.
This shift in type of spending is important because immigration largely represents a net fiscal benefit to natives in the first three categories, but a net fiscal cost in the fourth. As we argue in Chapter 6, national defense and interest on the national debt are public goods. Having immigrants pay for some of these public goods reduces the amount that natives have to pay. Similarly, immigrants who arrived after the end of the Civil War contributed to the pension payments of those who participated in that war. The final category, however, includes all government transfer payments, for which immigrants are included as beneficiaries.
These simple figures alone argue that the fiscal effects of immigration should assume a much large role in our immigration debate than they did in earlier times. This conviction is reinforced by an examination of the changing composition of government spending. Because these effects are potentially so much larger, we will devote two chapters in this volume to them.
Nonimmigrants
Although this report concentrates on the economic and demographic effects of legal immigrants, two other groups of foreign-born people enter this country and ultimately affect attitudes toward immigration: nonimmigrants and illegal immigrants. The size and demographic composition of these two groups are briefly discussed.
TABLE 2.6 Nonimmigrants Admitted, by Class of Admission, Fiscal Year 1994
|
Class of Admission |
Number |
|
All classes |
22,118,706 |
|
Tourists (temporary visitors for business or pleasure) |
20,318,933 |
|
Students |
394,001 |
|
Temporary workers and trainees (and their families) |
229,195 |
|
Transit aliens |
330,936 |
|
Treaty traders and investors (and their families) |
141,030 |
|
Exchange visitors and families |
259,171 |
|
Intracompany transferees and families |
154,427 |
|
Foreign government officials |
105,229 |
|
Representatives of international organizations |
74,722 |
|
Others |
111,182 |
|
Source: U.S. Immigration and Naturalization Service (1996:Table 39). |
|
As explained above, a nonimmigrant is an alien admitted into the country for a specific purpose and period of time. Most nonimmigrant categories are subject to no restrictions on the total number of admissions, but length of stay or of employment is often limited. Consequently, the number of nonimmigrants admitted in recent years far exceeds the number of legal immigrants. As Table 2.6 documents, more than 22 million nonimmigrants arrived during 1994, more than 25 times the number of legal immigrants admitted in that year. These numbers grossly understate the relative importance of legal immigrants, since many nonimmigrants stay for only a short time. On one hand, these statistics also may count some individuals more than once, since many nonimmigrants make more than one trip in a fiscal year. On the other hand, they leave out many nonimmigrant arrivals; for example, tourists from Canada or Mexico are not counted when they cross the border.
Nonimmigrants come for a variety of purposes. More than 9 in every 10 (approximately 20 million) were temporary visitors or tourists, most of whom visit for only a few days or a few weeks. The next two most important categories are students and those who were admitted for some type of temporary employment or training.
Nonimmigrants have nontrivial economic effects on this country. Foreign tourists pour money into many large U.S. cities—especially New York, San Francisco, Los Angeles, Miami, and Washington, D.C.—as well as into major tourist sites, including national parks and theme parks. More than 500,000 foreign students, most of whom have financial support from abroad, are in the United States as nonimmigrants; they form an important part of undergraduate, graduate, and professional programs and constituted about 4 percent of U.S. college enrollments in 1990 (Institute for International Education, 1996).20 Nonimmigrants
who enter the United States for temporary employment range from international opera stars to employees of international companies who come to the United States for short-term training or work.
Nonimmigrants are a component of larger immigration processes. Although the overwhelming majority of nonimmigrants leave the United States after satisfying the terms of their U.S. admission, it is thought that about 40 percent of resident illegal immigrants originally enter the United States as nonimmigrants, usually as tourists or students, and then overstay their visas or work illegally. Nonimmigrants are also an important source of subsequent immigration. A substantial number of foreign-born college students complete their education in the United States and, responding to suitable employment opportunities here, eventually seek permanent-resident status so that they can live and work in the United States.
Illegal Immigrants
The increasing ease and relative cheapness of travel and improvements in information have greatly spurred illegal international immigration around the world in recent decades. Although most developed countries experience them, illegal flows into the United States have been comparatively high, especially from Mexico. In other countries experiencing large-scale immigration, such as Australia and Canada, illegal immigration has stirred less concern, mostly because it is assumed that it has been negligible.21 (It is more difficult to slip into these two countries because the one does not share a land border with any other country and the other shares one only with the United States.)22
Illegal immigration has accounted for a substantial proportion of overall population change due to international migration to the United States. Figure 2.8 shows the average annual number of legal and illegal immigrants by decade. During the 1980s, illegal immigration accounted for about 225,000, or about one-fifth, of the 1.4 million average annual immigrants. Illegal immigration into the United States is not new, but no demographic estimates are available for these earlier periods.23
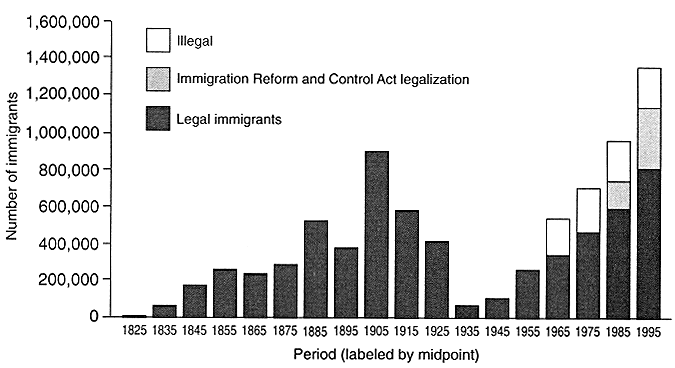
Figure 2.8
Average annual number of immigrants, legal and illegal, into the United States, 1820-1995. Source: Passel and Edmonston (1994:Figure 2.1). Data for the 1990s from the Immigration and Naturalization Service for legal immigrants and from the Bureau of the Census for illegal immigrants.
The characteristics of illegal immigrants emerge in studies about those who sought amnesty in 1986 under the general provisions of IRCA (as distinct from those who applied as agricultural workers). The heavy majority of the formerly illegal aliens were from Mexico (70 percent), and most were working-age men (Neuman and Tienda, 1994). Most illegal immigrants reside in only a few states, with about 40 percent living in California.
One effect of IRCA was to greatly reduce the number of illegal immigrants residing in the United States—in a sense by redefinition, because it gave amnesty to those who could prove long-time residence. Yet, even with this fiat, tougher border enforcement, and the requirement that employers check new employees for legal residence, the number of illegal immigrants is estimated to have reached about 3 to 5 million in 1996, about the same level as before IRCA (Warren, 1996).
Current estimates of net illegal immigration are in the range of 200,000 to 300,000 per year, with some consensus that the number has been closer to the high end of the range in recent years (Warren, 1996; U.S. Bureau of the Census, 1996). A lot more people go back and forth across the border illegally. Moreover, it is believed, about 40 percent of the net addition of illegal immigrants were those who entered the United States legally, as nonimmigrant students or as tourists.
Although the United States has long directed the Border Patrol to restrict the entry of illegal immigrants, public concern about large numbers of illegal immi-
grants has come only in recent decades. The 1986 enactment of IRCA provided a more extensive program of control of illegal immigration. IRCA was designed to reduce illegal immigration through several means: by using employer sanctions to weaken the magnet of work for illegal immigrants, by legalizing formerly illegal immigrant farmworkers and thereby providing a legal labor force for agriculture, and by increasing the resources available for detection and apprehension of those trying to cross illegally into the United States from Mexico. Implementing the amnesty conditions of IRCA has been widely regarded as successful (Gonzalez Baker, 1990); following the 1986 legislative program, the flow of illegal entries appeared to decrease for several years (Passel et al., 1990). The latest estimates are that it has increased since then to about 275,000 per year, on average (Warren, 1996). Employer sanctions have proved difficult to enforce because of the increased use of fraudulent documents and the limited resources of the federal government. At the same time, there has been little success in developing a fraud-proof system that employers could easily use to verify the legal status of job applicants.
Population increases from illegal immigration have continued in recent years. Although many persons actually enter the United States illegally and about 1.5 million persons are apprehended each year as illegal immigrants, these numbers are misleading for policy discussion. First, many of those apprehended are arrested more than once, and INS data thus involve double- or triple-counting of people. Second, and just as important, many persons who enter as illegal immigrants subsequently return to their home country. Greater resources have been allocated to the Border Patrol to prevent the entrance of illegal immigrants.
Before the enactment of IRCA in 1986, it was estimated, 3 to 5 million illegal immigrants lived in the United States. As a result of IRCA's legalization program, more than 3 million persons sought legalization and, at last count, about 2.7 million have become legal residents. The 1986 legalization reduced substantially the size of the illegal immigrant population. But by 1996, the flow of new illegal entrants had brought the number to an estimated 5 million (Warren, 1996).
Illegal immigrants enter the United States by many routes. Although most of the public attention has been on clandestine crossings of the land border with Mexico, they account for about 60 percent of illegal immigrants. The rest enter legally and then overstay their visas. Restricting the growth of the illegal immigrant population, therefore, calls also for programs that address this group of would-be residents.
Immigrant Characteristics
Gender
In earlier periods of immigration to the United States, immigrants were predominantly male. Figure 2.9 shows that this sharp gender imbalance did not give
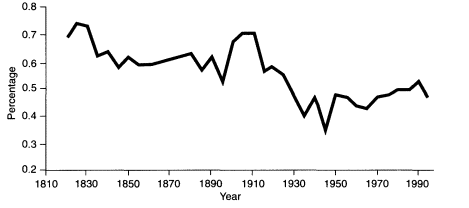
Figure 2.9
Proportion of immigrants who are male, 1820-1990. Source: U.S. Bureau of the Census (1975, 1996); U.S. Immigration and Naturalization Service (1994, 1996, 1997).
way to relatively equal numbers of women and men until the 1930s. This historic imbalance was even more pronounced among prime-aged adults. Among immigrants in their late twenties, the ratio of men to women was greater than 3 to 1 (Carter and Sutch, 1996). This tilt toward men should not be surprising; in virtually all contexts, men have been historically more migratory than women, especially when economic betterment was the primary motive for moving. As U.S. immigration policy changed and family reunification became a more dominant reason to come to the United States, the gender balance shifted. Since the 1930s, cohorts of immigrants—the successive groups of immigrants who arrive in a given period of time—have been more equally split between men and women (Carter and Sutch, 1996). In 1995, for example, women accounted for slightly over half of all legal immigrants—54 percent.
Why should the proportion of males and females matter for the way immigrants affect American society? A male-dominated immigrant pool has the following implications: without mates from their home country, many will eventually return home. Others will marry outside their group; their children will be of mixed parentage, with looser ties to the original home country. Men are also far more likely to engage in criminal activity, so that the crime rate associated with immigration may be higher.
The differences may also appear in the labor market. Women still work less than men do. With more women in the immigrant pool, the aggregate effect on the job market of a given number of new immigrants will generally be smaller. Since women hold different types of jobs than men do, different segments of the labor market will hear the competitive footsteps of these immigrants.
Because the sex ratio among immigrants is close to that among the native-born and is unlikely to change in the foreseeable future, the gender composition
of immigrants is unlikely to have any significant effect on how immigrant outcomes differ from those of natives.
Age
New immigrants have always been disproportionately young adults, a pattern that continues to hold. Figure 2.10 compares the age distribution among 1992-94 immigrants to that of the U.S. population. The differences are especially marked at the extreme ends of the scale. Taking the native-born population as the standard, people aged 15 to 34 are substantially overrepresented among new immigrants, whereas those in the older age groups are significantly underrepresented. Children and those aged 35 to 44 account for about the same proportion among immigrants as among those already in the United States.
Young adults comprised an even larger fraction of immigrants in the earlier waves of U.S. immigration (see Figure 2. 1). Since then, the age distribution has shifted gradually toward both children and older immigrants. This shift has mirrored changes in immigration policy, especially as family unification moves to center stage. In addition, longer life-spans and easier travel made migration more attractive to older people.
The concentration of immigrants among young working adults has fundamental implications for U.S. society. Immigrants are more likely to be workers, and they will make fewer demands on social programs geared to the elderly. As an illustration, current immigrants are more likely than the native-born to be paying into the Social Security system and less likely to be receiving benefits. Their presence in the United States may be beneficial to the current balance of that program, an issue we address in depth in Chapters 6 and 7.
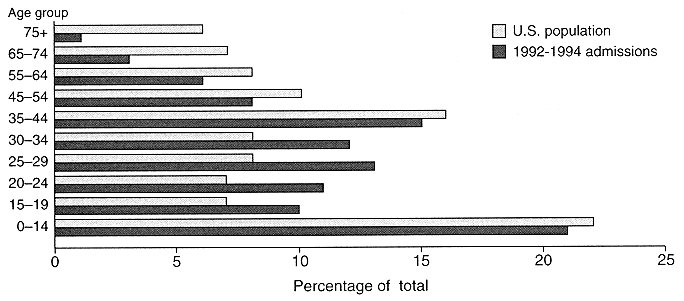
Figure 2.10
Age distribution of 1992-1994 immigrant admissions and 1990 U.S. population.
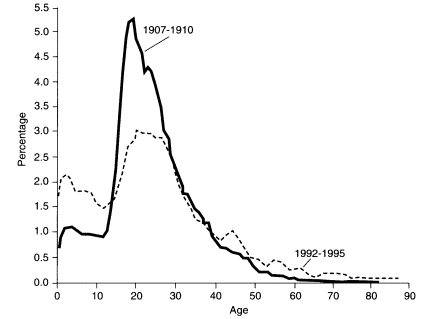
Figure 2.11
Age distribution of immigrants, 1907-1910 and 1992-1995.
The recent shift toward both more younger and more older immigrants means that immigrants may make greater demands on social programs that redistribute resources to those age groups than immigrants have in the past. Spending on education may be affected by these changes, both through increases in the number of children overall and through the need to help those with special needs (for example, non-English-speaking children). Public support programs, such as SSI and Medicaid, also reflect the influx of more elderly immigrants (when they were eligible under these programs). These fiscal impacts of immigration, and how they are affected by the age structure of immigrants, are explored in depth in Chapters 6 and 7.
Family Structure
Because family composition interacts with so many economic and social outcomes, it is central to the way immigrants influence U.S. society. For example, it affects whether immigrants will be eligible for many public assistance programs, how much they will work, and the costs of educating their children. It may also be relevant to such cultural concerns as trends in marriage and in extramarital childbearing.
There are many ways to characterize families but, no matter which one is
used, immigrants and the native-born are not the same. As Table 2.7 shows, compared with the native-born of the same age, new (1995) immigrants are more likely to be married and are less likely to be divorced, widowed, or separated. The differences between the native-born and all foreign-born residents are smaller, but the same general pattern holds. The image of immigration in this country is not one of lone, young men with little attachment to place, family, or country. Instead, it is couples who have married and are starting families. These higher marriage rates are not surprising, since family reunification receives such high priority in our system. In choosing between a woman married to a green card holder and an unattached single woman, the current policy selects the married women.
This image of a family-oriented immigrant is reinforced by examining the kind of families in which immigrants live. As Table 2.8 reveals, consistent with their higher rates of marriage, recent immigrants have a greater likelihood of living in family households (people living together related by blood or marriage)24 than the average native, especially if there are minor children present. These households are slightly more likely to include the spouse of the householder and so to constitute a married-couple family.25
Many immigrant families have a male head but with no wife present: such a household is more than two and a half times as common among recent immigrants as it is among the population in general. The greater frequency of male-headed family households with no spouse is at least partially accounted for by householders living with their extended families—comprising, say, siblings, parents, cousins, grandchildren, other relatives, or a combination of any or all of those.26 By virtue of the larger number of other relatives, immigrant families are larger on average, including 3.85 persons, compared with 3.16 for the United States as a whole.27
TABLE 2.7 Marital Status of Immigrant Admissions, 1995 and U.S. Population, 1990 by Age Group (percentage)
|
|
Men |
Women |
||
|
Age Group and Marital Status |
Immigrants |
U.S. Population |
Immigrants |
U.S. Population |
|
25-34 |
||||
|
Never married |
34.8 |
36.1 |
18.8 |
25.0 |
|
Married |
63.9 |
54.0 |
79.7 |
60.8 |
|
Widowed |
0.1 |
0.2 |
0.2 |
0.6 |
|
Divorced |
1.0 |
7.3 |
1.1 |
9.8 |
|
Separated |
0.2 |
2.5 |
0.2 |
3.8 |
|
35-44 |
||||
|
Never married |
14.5 |
13.4 |
10.2 |
10.0 |
|
Married |
82.4 |
71.1 |
85.4 |
69.1 |
|
Widowed |
0.2 |
0.4 |
0.8 |
1.6 |
|
Divorced |
2.5 |
12.1 |
3.2 |
15.4 |
|
Separated |
0.4 |
2.9 |
0.4 |
3.9 |
|
45-54 |
||||
|
Never married |
5.7 |
6.8 |
7.7 |
5.6 |
|
Married |
90.3 |
77.4 |
82.5 |
70.3 |
|
Widowed |
0.6 |
1.1 |
4.0 |
5.2 |
|
Divorced |
3.1 |
12.1 |
5.3 |
15.7 |
|
Separated |
0.4 |
2.7 |
0.5 |
3.3 |
|
55-64 |
||||
|
Never married |
3.7 |
4.8 |
7.5 |
4.5 |
|
Married |
90.9 |
69.0 |
72.0 |
66.3 |
|
Widowed |
2.3 |
12.5 |
15.1 |
15.9 |
|
Divorced |
2.8 |
7.5 |
4.9 |
11.0 |
|
Separated |
0.4 |
6.2 |
0.5 |
2.2 |
|
65 and older |
||||
|
Never married |
3.7 |
4.8 |
9.5 |
5.5 |
|
Married |
84.3 |
73.1 |
46.1 |
38.6 |
|
Widowed |
9.7 |
13.9 |
40.5 |
49.4 |
|
Divorced |
1.8 |
4.7 |
3.6 |
5.5 |
|
Separated |
0.4 |
3.5 |
0.2 |
1.0 |
|
Sources: U.S. Immigration and Naturalization Service (1997:Table 14); and U.S. Bureau of the Census (1993:Population Characteristics, Table 34). |
||||
Finally, immigrant women have more children than the average resident of the United States, another contributor to differences in family and household size (see Table 2.9). As we discuss in the next chapter, the greater rates of childbearing among immigrant women are an important factor in the effect of immigration on American society.
TABLE 2.8 Household and Family Type of Immigrants Who Arrived 1980-1990 and of U.S. Population, 1990 (percentage of all households)
|
Type of Household |
1980-1990 Immigrants |
United States Total |
|
Nonfamily households |
21.0 |
29.8 |
|
Family households, total |
79.0 |
70.2 |
|
With own children under 18 |
52.1 |
33.6 |
|
With own children under 6 |
19.6 |
15.5 |
|
Type of family |
||
|
Married-couple families |
59.2 |
55.1 |
|
With own children under 18 |
41.7 |
25.6 |
|
With own children under 6 |
16.1 |
12.4 |
|
Family with female householder, no husband present, total |
10.8 |
11.6 |
|
With own children under 18 |
7.2 |
6.6 |
|
With own children under 6 |
2.0 |
2.6 |
|
Family with male householder, no wife present |
9.0 |
3.4 |
|
Source: U.S. Bureau of the Census (1993:Foreign-Born Population of United States, Table 2; General Population Characteristics, Table 36). |
||
TABLE 2.9 Children Ever Born to Female Immigrants Who Arrived in 1980-1990 and U.S. Women, by Age of Mother (children born per 1,000 women)
|
Age of Mother |
1980-1990 Immigrants |
All U.S. Women |
|
15-24 |
404 |
305 |
|
25-34 |
1,361 |
1,330 |
|
35-44 |
2,200 |
1,960 |
|
Source: U.S. Bureau of the Census (1993:Foreign Born Population of the United States, Table 1; Social and Economic Characteristics of the Population, Table 16). |
||
Geography
Immigrants have always moved to relatively few places, settling where they have family or friends, or where there are people from their ancestral country or community—in short, with people with similar backgrounds and nationalities. This phenomenon, observed in earlier waves of immigrants, characterizes the first decades after arrival in the United States; thereafter, their children may dis-
TABLE 2.10 Intended Destination of Legal Immigrants Entering the United States, 1974, 1984, and 1994 (percentage)
perse more widely.28 Most immigrants live in a handful of states and in less than a dozen major metropolitan areas. This extreme geographic concentration implies that any state or local fiscal effects of immigration will likewise be concentrated in a relatively few communities. Similarly, labor market effects of immigration may also be more pronounced in the places where most immigrants live.
In 1990, 76 percent of immigrants arriving in the United States in the 1980s resided in only six states: California, New York, Texas, Florida, New Jersey, and Illinois (in descending rank order of the numbers of recent immigrants in the state in 1990—see Table 2.10). California and New York alone account for over 40 percent of new immigrants. Figures 2.12 and 2.13 show the state of residence for newly arriving legal and illegal immigrants in 1994. By and large, recent immigrants are going to the same places that immigrants went to 10 and 20 years ago—the majority to those same six states.
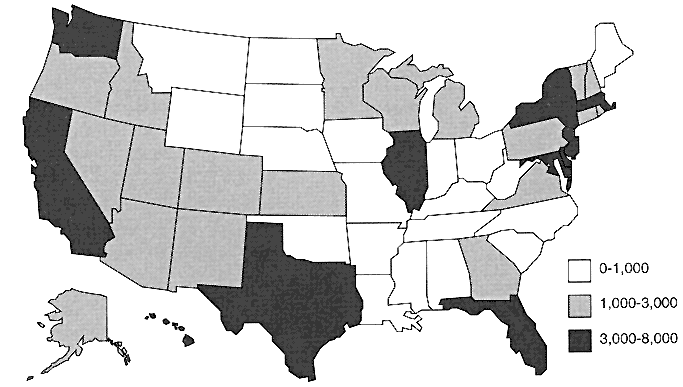
Figure 2.12
Legal immigrants entering the United States in 1995 per 1 million residents by state.
Note: total number of immigrants for the United States in 1995 was 720,461.
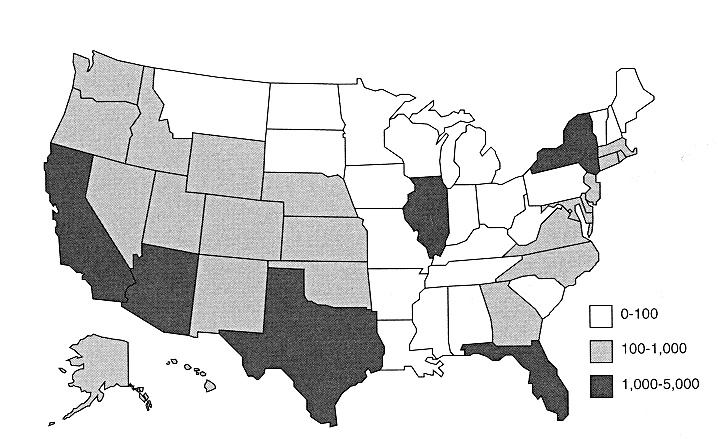
Figure 2.13
Illegal immigrants entering the United States in 1996 per 1 million residents by state. Note: net illegal immigrants entering the United States in 1996 estimated to be 275,000.
The differences in state destinations for legal and illegal immigrants are modest: some states have relatively large numbers of legal immigrants compared with their numbers of illegal immigrants (the New England and northern Great Lakes areas, Maryland, Pennsylvania, and Washington); others have higher numbers of illegal immigrants compared with legal immigrants (Nebraska, North Carolina, Oklahoma, and Wyoming). The mix of illegal and legal immigrants appears to reflect the balance of demand for farmworkers (attracting illegal immigrants) and employment opportunities in expanding larger industries (attracting primarily legal immigrants).
This concentration need not be static. On one hand, the foreign-born population in a state may decrease if many immigrants move to other states or if they are very old and will soon die. On the other hand, the foreign-born population could increase if other immigrants resettle in the state. However, the state distribution of the foreign-born population closely resembles that of new immigrants. In 1990, one-third of the foreign-born population resided in California and another 14 percent lived in New York. Texas and Florida each had 8 percent, and New Jersey and Illinois 4 percent each. Combined, these six states accounted for over three-fourths of the nation's foreign-born population. The remaining quarter of the foreign-born population were widely distributed across the other 44 states and the District of Columbia.
The geographic concentration is even more pronounced than state-level data indicate because most immigrants live in remarkably few metropolitan areas. According to the 1990 census, over 93 percent of the foreign-born population reside in metropolitan areas, compared with 73 percent of native-born residents. About one-half of the immigrants who entered the United States during the 1980s lived in eight metropolitan areas in 1990: Los Angeles, New York, Miami, Anaheim, Chicago, Washington, D.C., Houston, and San Francisco—again in rank order. The two metropolitan areas with the highest proportion of foreign-born in 1990 were Miami (46 percent foreign-born) and Los Angeles (33 percent foreign-born).
The patterns of immigration (foreign-born arrivals) and internal migration (by both immigrants and native-born within the United States) are often interrelated. In many instances, the same forces that attract immigrants into a state entice internal migrants from other states. In other cases, the arrival of new immigrants into a state may induce out-migration by some native-born workers with whom they may compete. These patterns varied widely among the major immigration-receiving states in the 1980s. For example, California and Florida attracted a sizeable number of internal migrants as well as a large number of immigrants during that period. By contrast, New York, Texas, Illinois, and New Jersey received many immigrants, but experienced a large number of departures to other states. For these four states, population gains from immigration were largely offset by losses from internal migration. The degree to which native workers move out of an area under pressure from new immigrants will be a critical ele-
ment of any analysis of the labor market effects of immigration. This issue is addressed further in Chapter 5.
Comparison with Other Countries
The United States has not been alone in receiving large numbers of immigrants in recent decades. The same forces that draw people to the United States—global interdependence, wide disparities in economic circumstances, and political upheaval—are incentives to immigrants into other countries as well. Although often in other languages, the same rhetoric that characterizes domestic debates about immigration are carried on almost verbatim in many other countries. Concerns about economic competition from immigrant workers, crime, the cost to domestic taxpayers, and the loss of cultural uniqueness are mainstays of the political debate on immigration policy across Europe, Asia, and Africa. On the major issues of immigration policy—the numbers of immigrants to admit, who they shall be, how to treat them during their stay—the solutions adopted vary widely. This variety can be used to test the wisdom or limitations inherent in U.S. policy choices.
Table 2.11 documents international differences in three salient dimensions of the scale of immigration: the number of immigrants, the rate of immigration per 1,000 residents, and the percentage foreign-born. Among European countries, immigration has increased greatly in recent years. In 1990, European countries combined received more than 2 million immigrants, almost twice as many as the United States. However, this number hides wide differences among countries. Several European countries, along with such countries as Kuwait, Canada, and Australia, currently receive proportionately more immigration than the United States does. In contrast, other European countries, such as the United Kingdom, Denmark, and Finland, as well as Japan, admit few immigrants relative to their domestic population.
The uniqueness of the United States is not in how many immigrants it has relative to its population, but in its position as the only large country that is attracting significant numbers of immigrants. The other countries with large populations—China, Russia, and India—have not been magnets for immigrants from other countries. Consequently, America dominates other countries in terms of the fraction of all international migrants who live within its borders—23 percent of all immigrants arriving in 1990 in the countries listed in Table 2.11.
The percentage of foreign-born is an index of the persistence of immigration over longer periods of time. For example, Kuwait, Israel, and Australia rank at the top in the fraction foreign-born, but Australia and Israel are in the middle in terms of the number of new immigrants in the population. This discrepancy indicates that Israel and Australia's current restrictions on immigration are quite tight in comparison with its past. The United States, with 9 percent foreign-born, is in the middle of the range; Switzerland, Canada, and Australia, for example,
TABLE 2.11 The Role of Immigration in Selected Countries, Calendar Year 1990
|
Country |
Immigrants per 1,000 Population |
Number of Immigrants (thousands) |
Percentage Foreign-Born in Country |
|
Kuwait |
150 |
325 |
60 |
|
Austria |
16 |
123 |
6 |
|
Switzerland |
15 |
101 |
16 |
|
Germany |
11 |
842a |
4 |
|
Canada |
8 |
213 |
17 |
|
Australia |
7 |
121 |
23 |
|
Sweden |
6 |
53 |
6 |
|
Netherlands |
5 |
81 |
5 |
|
Norway |
4 |
16 |
3 |
|
Denmark |
4 |
26 |
3 |
|
Israel |
3 |
15 |
42 |
|
United States |
3 |
656b |
9 |
|
France |
2 |
102 |
8 |
|
United Kingdom |
1 |
52 |
3 |
|
Finland |
1 |
7 |
1 |
|
Italy |
1 |
43 |
1 |
|
Japan |
1 |
82 |
1 |
|
a The high number of immigrants into Germany reflects, in large part, the arrival of ''Aussiedler," that is, persons of German origin from Central and Eastern European countries with a constitutional right to come to Germany. About 400,000 Aussiedler arrived in Germany in 1990. The flow of Aussiedler increased from 1986 to 1992, before Germany established a ceiling of 225,000 per year in 1993, with a waiting list for the remaining Aussiedler who wish to come to Germany. b In addition to the 656,000 nonlegalized immigrants in 1990, there were 880,000 persons who adjusted their status to permanent resident under the terms of the 1986 Immigration Reform and Control Act. Most of the legalized residents who adjusted their status had lived in the United States since 1982. If the total of both the legalized and nonlegalized immigrants are combined, there was a total of 1,090,000 new permanent resident aliens in 1990, comprising 10 new aliens per 1,000 population. Source: International Centre for Migration Policy Development (1994:53); United Nations (1991:Tables 28, 30, and 31; 1996:Table 3); Organization for Economic Co-operation and Development (1995). |
|||
have over 15 percent. Several countries, including Finland, Italy, and Japan, have relatively few foreign-born persons.
Within their own numerical limits, countries also differ in their policies concerning whom to admit. This variety is revealed in Table 2.12, which divides immigrants in 1991 into four categories; employment related, family reunification, asylees and refugees, and those admitted based explicitly on ethnicity.
TABLE 2.12 Composition of Immigration, by Type of Admission, Calendar Year 1991 (percentage)
|
Country |
Employment Related |
Family Reunificaton |
Asylee/Refugee |
Ethnic Background |
|
France |
47 |
19 |
19 |
15 |
|
Austria |
43 |
12 |
45 |
0 |
|
Australia |
37 |
50 |
14 |
0 |
|
Netherlands |
33 |
17 |
42 |
8 |
|
Canada |
29 |
42 |
29 |
0 |
|
Norway |
29 |
36 |
35 |
0 |
|
United States |
29 |
49 |
21 |
0 |
|
United Kingdom |
28 |
40 |
28 |
4 |
|
Switzerland |
27 |
31 |
43 |
0 |
|
Germany |
20 |
14 |
46 |
20 |
|
Finland |
19 |
21 |
25 |
35 |
|
Denmark |
12 |
32 |
55 |
0 |
|
Sweden |
7 |
49 |
44 |
0 |
|
Source: International Centre for Migration Policy Development (1994:55). |
||||
Employment-related immigration is defined on the basis of a labor permit issued before entry. For European countries, labor immigration also includes foreign labor within the framework of the free European Union and Nordic labor circulation zones. Family-reunification immigration is based on a residence permit issued to kin of a resident in the country. The category labeled "ethnic background" refers to "Aussiedler" visas in Germany29 and groups allowed to immigrate into France, the Netherlands, and the United Kingdom because of colonial obligations. A U.S. program of this kind extends the right to immigrate to past employees of the Panama Canal Company, an obligation undertaken as part of the Panama Canal Treaty to turn the canal and the Canal Zone over to the government of Panama. In the case of Finland, the category comprises ethnic Finns arriving from the former Soviet Union. Finally, refugees are those from other countries who are fleeing persecution.
Several European countries use a "guest-worker" system in addition to permanent residence immigration. Germany, for example, has received a large number of temporary guest-workers from Turkey, who entered Germany on specific work contracts for a limited time. Some guest-workers have remained in Germany for many years and have recently availed themselves of the German asylum
system to seek permanent residence. Germany has enacted a series of visa obligations and special control measures for guest-workers, but it has had continued problems with regulating the increasing number of asylum applications.
A significant proportion of immigrants into European countries—two in five—are refugees, almost twice the proportion for the United States. Labor migration plays roughly the same role in many European countries and in traditional immigrant-receiving countries, including the United States—about one-third of total immigration. Where the United States stands apart is in the relative numbers of family-oriented immigrants.
As shown in Table 2.13, the source countries for immigration are diverse. Among countries receiving immigrants, the top three source countries vary greatly. Although Mexico is the major source country for immigration into the United States, Mexico is not a major source country for other immigrant-receiving countries. Other countries also tend to receive specialized immigration flows: only the United Kingdom tends to receive a significant proportion of immigrants from Australia and New Zealand.
Canada and the United States receive immigrants from a large number of countries. Less than one-fourth of immigrants into these two countries are from the top three sources. This contrasts with the situation in several other countries, such as France, where most immigrants are from only two or three countries.
Although the concern of this report is with immigration into the United States, the United States also supplies immigrants to other countries. Australia is the only major immigrant-receiving country that receives a substantial proportion from the United States. In addition, although the United Kingdom, Japan, and Israel do not receive a large volume of immigrants, persons from the United States constitute an important source of their immigrants.
The Canadian Case
Any time immigration is restricted, there must be a mechanism for choosing immigrants. Countries have adopted a wide variety of procedures that emphasize different factors. Which set of rules is chosen has large consequences for the composition of immigration. Canada offers an interesting contrast to the United States, because it places less emphasis on family unification and more on employment skills, admitting more than one-half of its annual immigrants on economic grounds.
A comparison of the United States and Canada illustrates how immigration selection works in another country. It is not meant as an endorsement or criticism of the Canadian immigration system, nor that the United States should place more weight on a point-based preference system that stresses employment skills.
The Canadian immigration system, which has been operating for two decades, begins by setting a total for immigration for planning purposes, along with projected immigration in several components (Citizenship and Immigration
TABLE 2.13 Top Three Sending Countries for Selected Immigrant-Receiving Countries, 1989
Canada, 1996a). Canada's legislation requires that the government make an annual announcement of the number of immigrants and refugees that Canada plans to admit over the next five-years. This number is determined after consultation with the provinces, government organizations, and other appropriate institutions.
Canadian immigrants fall into three broad classes. First, Family Class immigrants are sponsored on the basis of family reunification by Canadian citizens and permanent residents who are living in Canada. Second, Independent Immigrants, including those under the Business Class, are selected for their special occupational skills and experience, assessed in a point-based preference system. Third, Convention Refugees are admitted in accordance with Canadian laws governing refugee admissions and are evaluated not on a formal point system, but on their education, job skills, knowledge of English and French, and ability to adapt successfully to Canadian life.
The Canadian immigration system is distinctive in its selection of immigrants under the Independent Class. Immigrants are evaluated on 10 factors and admitted to Canada only if they score a minimum of 70 points. Most of the factors are related to labor market skills, including occupation, practical training, experience, ability to communicate in English or French, and general education. Canadian immigration officials maintain a fairly detailed list of occupations, which are updated periodically, that indicates the "value" of occupations and their labor market demands. If an applicant, such as a janitor, has an occupation with a very low score, he or she will be denied admission. An applicant with a university degree, in contrast, receives the full 16 points available for education. The appendix to this chapter describes the point-based system in more detail and presents examples of the factors and their scoring.
The September 1996 projection for 1996 immigration into Canada was for 199,000 to 205,000 total immigrants and refugees. Of these, 52 percent will be admitted on economic grounds (42 percent under skilled workers and 10 percent under one of the three business classes), 31 percent will be admitted under the Family Class, 13 percent will be admitted as refugees, and the remaining 4 percent will be in an "other" category.30
Conclusions
Throughout this country's history, immigrants have arrived, ever changing in their numbers and composition and presenting daunting economic and social challenges to successive American generations. The nation's history offers abundant legislative experiments alongside the 200 year history of successes and fail-
ures of the immigrants themselves. And the experiences of other nations assure us that we do not stand alone in deciding how many and which citizens of the world should be permitted to join our national experiment.
As long as there is a virtually unlimited supply of potential immigrants, the nation has to make choices on how many immigrants to admit, and within that number, who should be selected. Since colonial times, successive waves of immigrants have forced us to make these choices. The answers, in regulations and legislation, have reflected the nation's notion of itself and, often, reactions to the characteristics of the immigrants.
An important piece of national legislation was the Immigration Act of 1924, which established a system of national origins quotas for immigrants. The 1924 act restricted total immigration, with limits set for annual immigration by country or nationality based on its relative proportion of the population according to the 1920 census. Because there were relatively fewer persons from some countries with high immigration demands, this system resulted in large reductions in immigrants from Eastern and Southern Europe and essentially ended immigration from Asia.
Impeded by the Great Depression and the Second World War, immigration slackened during the 1930s, and the pressure of legislation eased. But after the war, as applications for both legal and refugee admissions rose, it became clear that many of the old immigration laws were outdated. This eventually led to the second major piece of legislation, the Immigration and Nationality Act Amendments of 1965, which abolished the national-origins quota system that had been governing U.S. immigration for more than 40 years. The 1965 act replaced national-origin, race, and ancestry quotas with a preference system based on family reunification and special occupational skills or training. The 1965 act also was the first legislation that placed numerical limits on immigration from the Western Hemisphere.
With the 1965 legislation, the emphasis of immigration policy shifted to a new approach, introducing employment-based preferences to a system with family-sponsored preferences. Family ties clearly dominate, accounting in 1995 for two-thirds of admissions; moreover, nearly half those admitted in this category were spouses or children of men and women with preferred occupations.
References
Ahmed, B., and J.G. Robinson 1996 Estimates of Emigration from the United States. Washington, D.C.: U.S. Bureau of the Census.
Bean, F.D., B. Edmonston, and J.S. Passel, eds. 1990 Undocumented Migration to the United States: IRCA and the Experience of the 1980's. Washington, D.C.: The Urban Institute Press.
Bureau of Consular Affairs 1977 Visa Bulletin. U.S. Department of State 7(69):2.
Carter, S.B., and R. Sutch 1996 The Economic and Demographic Consequences of Immigration to the United States: Quantitative Historical Perspectives. Paper prepared for panel. Department of Economics, University of California, Riverside & Berkeley, September.
Citizenship and Immigration Canada 1996a Canada's Immigration Law. Ottawa, ON: Minister of Supply and Services Canada.
1996b Applying for Permanent Residence in Canada: A Self-Assessment Guide for Independent Applicants. March 1996 version downloaded from the Web Site of the Canadian Consulate in Buffalo, New York.
1996c Occupational Demand List, as of February 29, 1996: List of Occupations Open to Prospective Independent Skilled Worker Immigrants. December 1996 version downloaded from the Web Site of the Commission for Canada, Hong Kong.
Duleep, H.O. 1994 Social Security and the emigration of immigrants. Pp. 97-128 in International Social Security Association, Migration: A Worldwide Challenge for Social Security. Geneva, Switzerland: International Social Security Association.
Fix, M., ed. 1991 The Paper Curtain: Employer Sanctions' Implementation, Impact, and Reform. Washington, D.C.:The Urban Institute Press.
Gonzalez Baker, S. 1990 The Cautious Welcome: The Legalization Programs of the Immigration Reform and Control Act. Washington, D.C.: The Urban Institute Press.
Institute for International Education 1996 Open Doors 1995/6. New York: Institute for International Education.
International Centre for Migration Policy Development 1994 The Key to Europe: A Comparative Analysis of Entry and Asylum Policies in Western Countries. Vienna, Austria: International Centre for Migration Policy Development.
Jasso, G., and M.R. Rosenzweig 1990 The New Chosen People: Immigrants in the United States. New York: Russell Sage Foundation.
Klusmeyer, D. 1996 Between Consent and Descent: Concepts of Democratic Citizenship. Washington, D.C.: Carnegie Endowment for International Peace.
Lieberson, S., and M. Waters 1988 From Many Strands: Ethnic and Racial Groups in Contemporary America. New York: Russell Sage.
Martin, P. 1996 Promises to Keep: Collective Bargaining in California Agriculture. Ames: Iowa State University Press.
Martin, P., and J. Widgren 1996 International Migration: A Global Challenge. Washington, D.C.: Population Reference Bureau (May).
Massey, D.S., K.M. Donato, and Zai Liang 1990 Effects of Immigration Reform and Control Act of 1986: Preliminary data from Mexico. Chapter 6 in F.D. Bean, B. Edmonston, and J.S. Passel (editors), Undocumented Migration to the United States: IRCA and the Experience of the 1980's. Washington, D.C.:The Urban Institute Press.
McInnis, Marvin 1994 Immigration and emigration: Canada in the late nineteenth century. Pp. 139-155 in T.J. Hatton and J.G. Williamson (editors), Migration and the International Labor Market, 1850-1939. New York: Routledge.
Neuman, K.E., and M. Tienda 1994 The settlement and secondary migration patterns of legalized immigrants: Insights from administrative records. Chapter 7 in B. Edmonston and J.S. Passel (editors), Immigration and Ethnicity: Immigration and the Adjustment of America's Newest Immigrants. Washington, D.C.: The Urban Institute.
Organization for Economic Co-operation and Development 1995 Trends in International Migration, Annual Report, 1994. Paris: Organization for Economic Co-operation and Development.
Passel, J.S., F.D. Bean, and B. Edmonston 1990 Undocumented migration since IRCA: An overall assessment. Chapter 9 in F.D. Bean, B. Edmonston, and J.S. Passel (editors), Undocumented Migration to the United States: IRCA and the Experience of the 1980's. Washington, D.C.: The Urban Institute Press.
Passel, J.S., and B. Edmonston 1994 Immigration and race: Recent trends in immigration to the United States. In B. Edmonston and J.S. Passel (editors), Immigration and Ethnicity: Immigration and the Adjustment of America's Newest Immigrants. Washington, D.C.: The Urban Institute.
United Nations 1991 U.N. Demographic Yearbook, 1989. New York: United Nations.
1996 U.N. Demographic Yearbook, 1994. New York: United Nations.
U.S. Bureau of the Census 1975 Historical Statistics of the United States, Colonial Times to 1970, Bicentennial Edition. Part 1. Washington, D.C.: U.S. Department of Commerce.
1993 1990 Census of Population. The Foreign-Born Population of the United States. 1990 CP-3-1. Washington, D.C.: U.S. Department of Commerce.
1996 Statistical Abstracts of the United States, 1996. Washington, D.C.: U.S. Department of Commerce.
U.S. Commission on Immigration Reform 1994 U.S. Immigration Policy: Restoring Credibility. Washington, D.C.: U.S. Commission on Immigration Reform
U.S. Immigration and Naturalization Service 1975 Statistical Yearbook of the Immigration and Naturalization Service, 1974. Washington, D.C.: U.S. Department of Justice.
1985 Statistical Yearbook of the Immigration and Naturalization Service, 1984. Washington, D.C.: U.S. Department of Justice.
1994 Statistical Yearbook of the Immigration and Naturalization Service, 1993. Washington, D.C.: U.S. Department of Justice.
1996 Statistical Yearbook of the Immigration and Naturalization Service, 1994. Washington, D.C.: Department of Justice.
1997 Statistical Yearbook of the Immigration and Naturalization Service, 1995. Department of Justice.
Warren, R. 1996 State Population Estimates: Legal Permanent Residents and Aliens Eligible for Naturalization. Office of Policy and Planning, Immigration and Naturalization Service, Washington, D.C.
Appendix 2.A
Admission of Immigrants into Canada
Because Chapter 2 is concerned with U.S. immigration and the U.S. immigration system, this appendix describes how immigration selection works in another country. We illustrate the selection system in Canada, not because we wish to endorse it, but because Canada admits a large number of immigrants and has emphasized the admission of immigrants based on employment skills.
Classes of Immigrants
Immigrants and refugees are admitted to Canada without discrimination on the basis of race, national or ethnic origin, color, religion, or sex (Citizenship and Immigration Canada, 1996a). They are selected according to universal standards that assess their ability to adapt to Canadian society and to settle successfully. Canadian immigration includes three broad classes of immigrants. The major components of Canadian immigration are Family Class, Independent Immigrants, and Convention Refugees as well as members of Designated Classes.
- Family Class immigrants are sponsored on the basis of family relationships. Canadian citizens and permanent residents, age 19 years and over and living in Canada, have the right to sponsor certain close relatives who wish to immigrate to Canada. Relatives eligible for Family Class sponsorship include wife or husband; fiancé(e); dependent son or daughter (under 19 and unmarried, full-time student, or with disability); parents or grandparents; brothers, sisters, nephews, nieces, or grandchildren who are orphans, unmarried, and under 19 years of age; children under 19 whom the sponsor will adopt; and any other relative if the sponsor does not have any of the above or any family in Canada.
- Independent Immigrants comprise persons selected on the basis of special occupational skills and experience, business immigrants, assisted relatives, retirees, and other independent immigrants. Immigrants in the Independent class are assessed against formal selection criteria. The point-based preference is described in the section below. This class includes skilled workers, assisted relatives, and three types of immigrants within Canada's Business Immigration Program. Assisted relatives include applicants who have a Canadian relative who is willing to help them or relatives who do not qualify under the Family Class of admission. There are three categories within the Business Immigration Program: entrepreneurs,31 self-employed persons,32 and investors.33
- Convention Refugees are refugees admitted to Canada in accordance with Canadian laws governing refugee admissions. Canada defines a refugee in accordance with the United Nations Convention on refugee status. Groups of at least five Canadian citizens or permanent residents, 19 years of age or greater, or local organizations that are legally incorporated may sponsor Convention Refugees. Refugees are not subject to a formal point system for evaluation. Nevertheless, Canadian visa officers take into account the refugee's level of education, job skills, and knowledge of English or French as a guide to determining whether the applicant will adapt successfully to Canadian life.
Point-Based Preference System
Canada uses formal selection criteria for admission of the Independent Class of immigrants. The criteria are used to determine whether independent immigrants are likely to become successfully established in Canada. The criteria's factors and weights are designed to meet Canada's demographic and labor market needs. Emphasis is placed on the applicant's intended occupation, practical training, work experience, education, ability to communicate in French or English, and personal suitability. Employment-related factors account for about half of the total possible units of assessment that can be awarded.
In order to be admitted to Canada as an independent immigrant, the applicant must receive a minimum number of points. Immigrants must also have an occupation that is in demand or can be easily absorbed in the labor markets. In most cases, applicants are also required to have at least one-year of work experience in their intended occupation.
|
|
than the entrepreneur and his or her dependents. The applicant must also have the ability to provide active participation in the management of the business. |
Occupations that are in short supply in specific provinces are referred to as ''designated occupations." Additional points, as well as priority processing, are awarded to an applicant in a designated occupation.
Not every independent immigrant is assessed on all of the selection criteria. Applicants are assessed on only those factors that actually reflect their ability to become successfully adapted. Since occupation is not a relevant factor in selecting self-employed applicants, for example, it is not assessed for this category. Rather, more emphasis is placed on ability and experience by it making it possible to gain bonus points for being self-employed. Skilled workers are evaluated on all the factors. Assisted relatives are assessed on the same factors as other independent immigrants, but they receive bonus units of assessment if they have a relative in Canada.
This section describes the operation of the Canadian point-based selection system for immigrant admissions in 1996 (Citizenship and Immigration Canada, 1996b). Prospective independent immigrants to Canada are assessed on a point-based system; they must obtain a qualifying score to receive an immigrant visa. In addition, prospective candidates must have valid passports, be able to support themselves and their dependents in Canada, be of good health and character, and pay administrative fees.
The Canadian point-based system scores an immigrant on 10 categories. In 1996, the candidate needed to score 70 points in order to qualify for an immigrant visa. Applicants with scores less than 70 are refused a visa. Several of the factors relate to employment. Arranged employment is a guaranteed offer of employment from a Canadian employer. The employment must be approved by the Canada Employment Centre, and the applicant must be qualified for the arranged employment. Designated occupations are occupations identified by the province or territory as being especially in demand in that region (Citizenship and Immigration Canada, 1996c). The list of these occupations changes periodically and varies among provinces and territories. Points are calculated (in 1996) on the following:
|
Factor |
Maximum Points |
Points Calculation |
|
(1) Age |
10 |
0 points for 17 |
|
increasing points for 18 to 20 |
||
|
10 points for 21 to 44 |
||
|
decreasing points for 45 to 48 |
||
|
0 points for 49 and over |
||
|
(2) Education |
16 |
0 points for less than high school diploma |
|
5 to 15 points for various types of high school and post-secondary training |
||
|
16 points for four-year university degree |
|
(3) Specific Vocational Preparation |
18 |
The score for this factor is based on whether the applicant has a designated occupation, and length of training, education, and/or apprenticeship for Canadian work (for example, an aerospace engineer receives 18 points, a locksmith receives 11 points, and a janitor receives 0 points) |
|
(4) Occupation |
10 |
0 points if there are no listed occupations for which the candidate is qualified; if the applicant scores zero on this factor, then then are automatically refused a visa |
|
Intermediate points awarded on the basis of the candidate's qualified occupation (for example, an aerospace engineer and a locksmith both receive 5 points) |
||
|
10 points if the candidate has arranged employment in Canada or has a designated occupation with high specific occupation preparation value |
||
|
(5) Arranged Employment/ Designated Occupation |
10 |
0 points if no arranged employment or a designated occupation |
|
10 points if the person has arranged employment or a designated occupation with high specific vocational preparation |
||
|
10 points for a member of the clergy with a congregational position offering employment |
||
|
10 points for full-time employment in a family business approved by the Canada Immigration Centre |
||
|
(6) Work Experience |
8 |
The points are calculated based on the specific vocational experience (factor 3) and the years of experience; a maximum of 8 points is awarded to an applicant with the maximum specific vocational experience and 4 years or more experience in the occupation |
|
(7) Language Ability |
15 |
0 points if the person speaks English and French with difficulty |
|
Intermediate points are awarded based on the reading, writing, and speaking of English and French |
||
|
15 points if the person is fluent in both French and English |
|
(8) Demographic Factor |
8 |
These points are set by the federal government to adjust the volume of annual immigration; 8 points are awarded in 1996 |
|
(9) Personal Suitability |
10 |
These points are awarded based on a personal assessment of a Canadian visa officer; the points are based on adaptability, motivation, initiative, and resourcefulness; the purpose is to predict whether the applicant and family will be able to settle successfully in Canada |
|
(10) Relative in Canada |
5 |
5 points are awarded if the applicant has a brother, sister, mother, father, grandparent, aunt, uncle, niece, or nephew as a permanent resident or Canadian citizen living in Canada |


