
7
Labor Market Outcomes of Female Immigrants in the United States
Edward Funkhouser and Stephen J. Trejo
INTRODUCTION
In recent years, the increased volume and changing national origins of immigration to the United States have reopened public debate over immigration policy. During the postwar period, the share of immigrants originating in Europe and Canada fell sharply, with the slack taken up by surging immigration from Asia and Latin America. A growing body of empirical research indicates that more recent immigrant arrival cohorts are less skilled and have been less successful in the labor market than earlier cohorts, and that there are important links between the shifts in national origins and declining immigrant skills (Borjas, 1994).1 Contrary to the traditional view that immigrants rapidly assimilate into the economic mainstream of American society, the revisionist studies predict that most foreign-born workers who entered the United States during the past two decades will throughout their lifetimes earn substantially less than native workers (Borjas, 1995).
These conclusions, however, are based almost entirely on analyses of immigrant men. Few studies of foreign-born women have attempted to estimate the effects of arrival cohort and assimilation on outcomes in the manner that has revolutionized research on male immigrants.2 Using microdata from the 1980
|
1 |
In particular, immigrant earnings in the United States are strongly correlated with per capita gross national product in the source country (Jasso and Rozenzweig, 1986; Borjas, 1987), presumably because workers from industrialized countries are better trained than workers from developing countries and their skills transfer more readily to the U.S. labor market. |
|
2 |
We know of three studies that analyze immigrant women to the United States using this approach, and two of these are somewhat limited in scope. Blau's (1992) research on fertility includes only immigrants from high-fertility regions (the Middle East, Asia, Latin America, and the Caribbean), and Reimer's (1996) wage analysis focuses on Mexican immigrants living in California and Texas. In work done independently of but concurrently with our research, Schoeni (1996b) estimates female employment regressions broadly similar to those we report below, and in general his results are similar to ours. Recently, we have received the paper by Baker and Benjamin (1997) —which finds different patterns than ours for employment—for Canada. |
and 1990 U.S. censuses, we perform such an analysis of two key labor market outcomes for immigrant women: employment and hourly earnings. The availability of census data at more than one point in time allows us to track changes for arrival cohorts as they gain experience in the United States, and it also lets us compare outcomes across cohorts.
The chapter proceeds as follows. In the next two sections we describe the census data and some of the basic patterns evident in these data. In the fourth section we discuss the regression framework we use to estimate the effects of arrival cohort and assimilation on immigrant outcomes. In the fifth and sixth sections we present our regression analyses of the employment and hourly earnings of foreign-born women. For comparison purposes, in these sections we also report similar employment and wage regressions for men. In the concluding section we summarize our results.
DATA
We analyze microdata from the 1980 and 1990 U.S. censuses. We started with the 5 percent samples of the population available in each census, but to lighten the computational burden we randomly sampled U.S.-born individuals while retaining all foreign-born individuals so as to end up with 1 percent samples of natives and 5 percent samples of immigrants.3 All of the estimates reported here are weighted to reflect both our differential sampling of natives and immigrants and the sampling weights that accompany the 1990 Census microdata.4
Persons born abroad of American parents were excluded from study because the distinction between immigrant and native is ambiguous for such individuals. For persons born in outlying areas of the United States (e.g., Puerto Rico), information on year of arrival in the United States is available in the 1990 Census but not in the 1980 Census, and therefore we group these persons separately from other immigrants for whom we can track arrival cohorts across censuses.
We restrict attention to persons aged 25–59. For each woman in the sample, we searched all other records in the same household to ascertain the number and
|
3 |
In this chapter, we use the term "immigrant" as synonymous with foreign-born individuals not born of U.S. parents, in contrast to the official terminology used by the U.S. Immigration and Naturalization Service in which immigrants are legal permanent residents, and other foreigners such as tourists, business travelers, and recent refugee arrivals are "nonimmigrant aliens." The census data analyzed here cannot make such distinctions among foreign-born individuals. |
|
4 |
The 1980 census microdata are self-weighting. |
ages of her children under age 18 who were living with her.5 In the 1990 (but not 1980) Census data, the Census Bureau provides its own imputation of this type of information, and our imputation matches the Census Bureau's quite closely.
Our calculation of an hourly wage measure requires a bit of explanation. We compute average hourly earnings for each worker as the ratio of annual earnings to annual hours of work in the calendar year preceding the census, where annual earnings are the sum of wage and salary income and self-employment income, and annual hours of work are the product of weeks worked and usual weekly hours of work. Only individuals with positive earnings and hours were included in the wage analyses. Because the top codes and bottom codes applied to the income variables differ between the 1980 and 1990 censuses, we imposed top and bottom codes that were the same (in real dollars) across years.6 In addition, observations in the 1980 Census data with computed hourly wages below $1 or above $200 are considered outliers and excluded. In the 1990 Census data, corresponding wage thresholds of $1.66 and $332 are applied so as to be consistent in real terms.
BASIC PATTERNS
Before turning to the regression analysis, we describe the characteristics of immigrant and native women in our census samples. In the first part of this section, we examine the cross-sectional patterns of immigrant cohorts using the 1990 Census. In the second part of the section, we follow synthetic arrival cohorts of immigrants and natives between the 1980 and 1990 censuses. To examine the potential importance of household decisions in labor market outcomes, we distinguish between two age groups of women: those most likely to bear children during the 1980s (women age 25–39 in 1980) and those beyond the main childbearing years (women age 40–49 in 1980).
Characteristics by Arrival Cohort in the 1990 Census
One of the important aspects of analysis of immigrants is the changing country composition of immigration as immigration laws, economic conditions, and political conditions have changed. Changes in the region of origin of immigrant females
|
5 |
In census data, it is often impossible to distinguish stepchildren from biological children when matching mothers with their children, and so our counts of children do not make this distinction. |
|
6 |
For example, wage and salary income is top coded at $75,000 in the 1980 Census and at $140,000 in the 1990 Census. According to the gross national product deflator for personal consumption expenditure, the price level rose by 66 percent between 1979 and 1989. Therefore, we lowered the ceiling on wage and salary income in the 1990 Census data to $124,500 ($75,000 inflated from 1979 to 1989 dollars), so as to impose top codes that are equivalent in real terms. In a similar fashion, we reconciled across years the top and bottom codes for farm and nonfarm self-employment incomes. |
TABLE 7-1 Region of Origin (1990 Census)
|
Before 1950 (1) |
1950– 1959 (2) |
1960– 1969 (3) |
1970– 1979 (4) |
1980– 1984 (5) |
1985– 1989 (6) |
Total (7) |
|
|
North America |
0.139 |
0.098 |
0.105 |
0.019 |
0.016 |
0.019 |
0.036 |
|
Western Europe |
0.393 |
0.469 |
0.259 |
0.097 |
0.060 |
0.078 |
0.157 |
|
Eastern Europe |
0.050 |
0.159 |
0.042 |
0.035 |
0.034 |
0.053 |
0.045 |
|
Mexico |
0.163 |
0.130 |
0.163 |
0.241 |
0.183 |
0.169 |
0.189 |
|
Latin America |
0.071 |
0.087 |
0.269 |
0.225 |
0.285 |
0.230 |
0.231 |
|
Asia |
0.063 |
0.096 |
0.163 |
0.322 |
0.351 |
0.379 |
0.281 |
|
Other |
0.047 |
0.039 |
0.046 |
0.061 |
0.071 |
0.072 |
0.060 |
|
Share of Total |
0.018 |
0.089 |
0.202 |
0.301 |
0.194 |
0.195 |
1.000 |
|
NOTE: For Rows 1 to 7, entries are percent of each immigrant cohort from the indicated region. Other includes country not specified. Sample size is 824,501. |
|||||||
reported in the 1990 Census are shown in Table 7-1. Overall, over 70 percent of all female immigrants reported Mexico, Latin America, or Asia as their country of birth and only 19.3 percent reported North America or Western Europe.
These total percentages reflect the change in source country of immigration from those of Europe to the developing countries of Asia and Latin America. Female immigrants from North America and Western Europe were over half of the immigrant cohorts that arrived prior to 1960. The proportion of immigrants from these countries fell significantly, especially during the 1960s and 1970s, to less than 10 percent of the arrival cohorts of the 1980s.
Over the arrival cohorts in which the share from North America and Western Europe declined, the share of immigrants from Latin America and Asia increased from less than one-third of the pre-1960 arrival cohorts to over three-fourths of the total of the arrival cohorts of the 1970s and 1980s. This increase occurred in two stages, with the proportion of immigrants from Latin America increasing to one-fourth of the total during the 1960s and the increase in the proportion of immigrants from Asia to over one-third of the total occurring in the cohorts of the 1970s and 1980s.7
Mean characteristics calculated from the 1990 Census for each immigrant cohort, persons born in outlying areas of the United States, and natives are shown in Table 7-2.8 In columns (1) through (6), values for each immigrant arrival cohort are shown, grouping the 1960s arrivals and 1970s arrivals into one column for each decade. In columns (7), (8), and (9), the values for all immigrants, persons from outlying areas of the United States, and natives are shown, respectively.
|
7 |
Passel and Edmonston (1994) have noted the importance of the changes in country composition of immigration on the ethnic composition of the U.S. population. |
|
8 |
The patterns are similar when regressions controlling for age are estimated. |
The first rows of Table 7-2 report mean values of several human capital variables—age, education, and English ability. These data show the bimodality in educational attainment that has also been observed for males. Overall, immigrants are disproportionately in the high and low categories of educational attainment—they are much more likely than natives not to have graduated from high school (30.6 to 12.2 percent) and they are nearly as likely to have graduated from college (20.2 to 21.3 percent). The declining trend in education levels over the cohorts from the 1960s through the first half of the 1980s is reversed slightly with the cohort of the second half of the 1980s.
The difference in English ability between immigrants and natives is substantial. In the 1980 and 1990 censuses, all respondents were asked whether they "speak a language other than English at home," and only those who answered affirmatively were asked how well they speak English, with possible responses of "very well," "well," "not well," or ''not at all." Only 52.1 percent of all immigrants speak English at least "very well" (speak only English or speak English very well), compared with 98.7 percent for natives. In contrast to improvement in educational attainment among the cohorts that arrived during the late 1980s, the English ability of the most recent immigrant cohorts (39.9 percent of the 1970–74 cohort and 35.3 percent of the 1975–79 cohort) is lower than that of all previous arrivals.
In the next rows of the table, labor market outcomes—percent employed, weeks worked, hours worked, log hourly earnings, and annual earnings—are shown. The main finding from these rows is the low employment rate, low number of weeks worked, and lower earnings of the two most recent immigrant cohorts (1980–1984 and 1985–1989) compared both with earlier immigrants and with natives.
Overall, immigrant women have lower employment rates than natives (67.3 percent for immigrants compared with 77.3 percent for natives). These rates are extremely low for immigrant arrivals in the 1985 –1989 cohort, who had an employment rate of only 54.5 percent. The deficit diminishes with increases in time spent in the United States. The cohort of arrivals with six to ten years of experience, the 1980 –1984 cohort, has employment rates only 4 to 6 percentage points below those of the immigrant cohorts that arrived in the 1960s and 1970s (67.3 percent for the 1980–1984 cohort relative to 71 to 73 percent for the earlier ones). Among employed females, the most recent immigrants also worked fewer weeks during the previous calendar year of 1989 (38.8 weeks compared with 42.6 weeks for the 1980–1984 cohort and 44.1 weeks for natives). Usual hours worked per week for those who report positive hours are very similar across both nativity and arrival cohort, including the most recent arrivals.
On average, immigrant females who report positive earnings have lower log hourly earnings (2.122 compared with 2.167 for natives). The pattern in these data are similar to the pattern of "catch-up" in earnings that has been documented in cross-sectional data for males. Recent immigrants earn significantly
TABLE 7-2 Mean Characteristics Females 25–59 in 1990
|
Before 1950 (1) |
1950– 1959 (2) |
1960– 1969 (3) |
1970– 1979 (4) |
1980– 1984 (5) |
1985– 1989 (6) |
Total (7) |
Outlying Areas (8) |
Natives (9) |
|
|
Age |
50.93 |
48.15 |
43.42 |
39.08 |
36.09 |
35.02 |
39.61 |
40.48 |
39.55 |
|
(0.245) |
(0.111) |
(0.074) |
(0.061) |
(0.075) |
(0.075) |
(0.034) |
(0.122) |
(0.011) |
|
|
Less than |
0.215 |
0.210 |
0.247 |
0.347 |
0.356 |
0.306 |
0.306 |
0.423 |
0.122 |
|
High School |
(0.009) |
(0.004) |
(0.003) |
(0.002) |
(0.003) |
(0.003) |
(0.001) |
(0.004) |
(0.000) |
|
High School |
0.323 |
0.360 |
0.310 |
0.252 |
0.260 |
0.259 |
0.278 |
0.300 |
0.365 |
|
Graduate |
(0.012) |
(0.006) |
(0.004) |
(0.003) |
(0.004) |
(0.004) |
(0.002) |
(0.006) |
(0.001) |
|
Some |
0.237 |
0.261 |
0.256 |
0.204 |
0.194 |
0.186 |
0.215 |
0.179 |
0.300 |
|
College |
(0.012) |
(0.005) |
(0.004) |
(0.003) |
(0.004) |
(0.004) |
(0.002) |
(0.006) |
(0.001) |
|
College |
0.226 |
0.168 |
0.188 |
0.196 |
0.190 |
0.249 |
0.202 |
0.098 |
0.213 |
|
Graduate |
(0.010) |
(0.005) |
(0.003) |
(0.003) |
(0.003) |
(0.003) |
(0.001) |
(0.005) |
(0.001) |
|
English |
0.845 |
0.809 |
0.678 |
0.497 |
0.399 |
0.353 |
0.521 |
0.518 |
0.987 |
|
Very Well |
(0.005) |
(0.002) |
(0.001) |
(0.001) |
(0.002) |
(0.001) |
(0.001) |
(0.002) |
(0.000) |
|
Percent |
0.687 |
0.692 |
0.727 |
0.712 |
0.673 |
0.545 |
0.673 |
0.534 |
0.773 |
|
Employed |
(0.011) |
(0.005) |
(0.003) |
(0.003) |
(0.003) |
(0.003) |
(0.001) |
(0.005) |
(0.001) |
|
Weeks |
44.71 |
44.68 |
44.57 |
43.55 |
42.57 |
38.78 |
42.95 |
42.67 |
44.09 |
|
Worked |
(0.43) |
(0.19) |
(0.12) |
(0.10) |
(0.13) |
(0.15) |
(0.06) |
(0.24) |
(0.02) |
|
Hours |
36.57 |
36.60 |
37.90 |
38.48 |
38.37 |
37.78 |
38.01 |
37.28 |
37.12 |
|
Worked |
(0.37) |
(0.17) |
(0.11) |
(0.09) |
(0.11) |
(0.13) |
(0.05) |
(0.21) |
(0.02) |
|
Log Hourly |
2.321 |
2.249 |
2.236 |
2.147 |
2.017 |
1.943 |
2.122 |
2.129 |
2.167 |
|
Earnings |
(0.020) |
(0.009) |
(0.006) |
(0.005) |
(0.006) |
(0.007) |
(0.003) |
(0.011) |
(0.001) |
|
Annual |
13,961 |
12,950 |
13,774 |
12,276 |
9,663 |
6,565 |
11,047 |
8,311 |
13,243 |
|
Earnings |
(364) |
(165) |
(109) |
(90) |
(112) |
(111) |
(49) |
(181) |
(16) |
|
Poverty |
0.083 |
0.068 |
0.090 |
0.144 |
0.195 |
0.266 |
0.159 |
0.314 |
0.102 |
|
Rate |
(0.008) |
(0.004) |
(0.002) |
(0.002) |
(0.002) |
(0.002) |
(0.001) |
(0.004) |
(0.000) |
|
Percent |
0.696 |
0.735 |
0.709 |
0.739 |
0.708 |
0.702 |
0.718 |
0.503 |
0.667 |
|
Married |
(0.012) |
(0.005) |
(0.004) |
(0.003) |
(0.004) |
(0.004) |
(0.002) |
(0.006) |
(0.001) |
|
Children |
2.722 |
2.425 |
2.143 |
2.282 |
2.081 |
1.786 |
2.139 |
2.650 |
1.967 |
|
Ever Born |
(0.013) |
(0.019) |
(0.013) |
(0.011) |
(0.013) |
(0.013) |
(0.006) |
(0.021) |
(0.002) |
|
Any |
0.868 |
0.853 |
0.814 |
0.830 |
0.790 |
0.698 |
.796 |
0.871 |
0.776 |
|
Children |
(0.011) |
(0.005) |
(0.003) |
(0.003) |
(0.003) |
(0.003) |
(.001) |
(0.005) |
(0.001) |
|
Note: Employment status, weeks worked, usual hours worked, logarithm of hourly income, and annual income are for 1989 calendar year. Means for weeks worked, usual hours worked, and logarithm of hourly income are calculated for those with positive values. Sample sizes are 824,501 for age, education, English ability, and percent employed; 602,530 for weeks worked and usual hours; 586,490 for logarithm of hourly wage; 824,501 for annual earnings; 822,099 for poverty status; 824,501 for marital status and fertility. |
|||||||||
below natives (1.943), but the cohorts that arrived 10–20 years prior to the census have log hourly earnings similar to natives (2.147 for the 1970–1979 arrivals). And immigrants who arrived more than 20 years prior to the 1990 Census earn significantly above natives (2.236 for the 1960–1969 cohort). The combination of lower employment rates, fewer weeks worked, and lower hourly wages result in lower annual earnings for immigrants ($11,047) compared with those of than natives ($13,243).
In this table, we include poverty levels as a measure of household economic status. The pattern is similar to that for earnings except that the increase across successive earlier cohorts is more gradual, with even the 1970–1979 cohort having significantly higher poverty rates than natives. Only for immigrants who arrived prior to 1970 are poverty rates similar to or lower than those of natives.
In the final rows of the table, marriage and fertility characteristics are shown. Overall, immigrants are more likely to be married with spouse present than are natives (71.8 to 66.7 percent). In contrast to the patterns in the other variables in the table, the two most recent cohorts have marriage rates that are similar to the average for all immigrants (70.2 percent for the 1985–1989 cohort and 70.8 percent for the 1980–1984 cohort).9 In these data, the cohort that arrived between 1970 and 1979 has the highest marriage rate (73.9 percent). Even from these summary data, it can be seen that the role for changes in marital status to explain labor market behavior during the first years of entry to the United States is low.
There are significant fertility differences between immigrants and natives. In the next row, it can be seen that immigrants have had more children than natives (2.139 to 1.967) and that earlier arrivals (who are, on average, older) have had more children than more recent arrivals. The lower total number of children of the most recent cohort (1.786 compared with 1.967 for natives), reflects a lower number of woman who have had any children (69.8 to 77.6 percent), while the number of children per woman who has had children is similar to that of natives.
Although not the primary focus of our study, the patterns for immigrants from outlying areas, 90 percent of whom are from Puerto Rico, are an interesting comparison because of their unique legal status. The characteristics of immigrants from these areas are shown in column (8). These immigrants have out
|
9 |
An issue of interest is the effect of the Immigration and Reform Control Act (IRCA) on the household composition of immigrants. Because 56 percent of the population legalized under the provisions of IRCA are male and 84 percent are from Mexico and Central America, initial projections were that other family members entered the United States to reside with the recently legalized, predominantly male immigrants. In addition, the Legalized Population Survey followed households that legalized under the provisions of IRCA. The average household size of the legalized population decreased from 4.7 members to 4.5 members, while the size of the immediate family increased from 2.9 to 3.4 members. The main shifts in the composition of the immediate family include an increase in the proportion with spouses from 51 to 63 percent and an increase in the mean number of children from 1.4 to 1.7 members. |
comes in the labor market that are similar to those of the most recent immigrant arrivals. In fact, this group has employment rates that are lower and poverty rates that are higher than those of the 1985 –1989 immigrant cohort. Their household characteristics are quite different, however, from the most recent immigrant arrival cohorts. Women from these areas have the lowest marriage rates and have high fertility.
The patterns in this table show that more recent immigrants have lower employment and lower earnings than both earlier arrivals and natives. Among the observable characteristics we have examined, these immigrants have lower mean age, a higher proportion with less than high school education, and worse English ability than other groups, characteristics that may explain some of the differences in labor market outcomes.
Assimilation and Changes Across Cohorts without Controls
Although interesting, the mean characteristics provide only partial information on the role of the U.S. experience on immigrant outcomes. The comparison of the performance of an earlier immigrant cohort (the 1975–1979 cohort with 11–15 years of experience in the United States at the time of the 1990 Census, for example) with the performance of a more recent cohort (the 1985–1989 cohort with 0–5 years of experience in the United States, for example) does not provide all the information necessary to infer how the more recent cohort will perform as it gains more experience in the United States. Two things are changing when we compare immigrant arrival groups using one cross-section of data. The first is the number of years in the United States (going from 0–5 years of experience to 11–15 years of experience in the example). The second change is the population that is being observed (the 1975–1979 arrival cohort versus the 1985–1989 arrival cohort). Because of changes in country composition or changes in the self-selection within the pool of immigrants from a particular country, immigrants are not drawn from the same population over time. An earlier cohort may perform better because it has had more time to integrate into the labor market or because it arrived in the United States with better observable or unobservable skills than more recent cohorts. We refer to differences in how different immigrant cohorts may perform at all levels of experience in the United States as cohort effects and the changes related to additional time in the United States as assimilation effects.10
To examine how immigrant characteristics change with additional time in the United States, it is necessary to follow immigrant cohorts between the data
|
10 |
It is not surprising, for example, that more recent immigrant cohorts do not speak English as well as do earlier arrivals since they are more likely to come from non-English-speaking countries. Similarly, it may not be surprising that more recent immigrant cohorts that arrived after U.S. immigration policy placed greater emphasis on family reunification and less emphasis on labor market skills do not perform as well in the labor market. |
provided in the censuses. For each initial level of experience (0 –5 years of U.S. experience for the 1975–1979 cohort in 1980, for example), the change in an outcome between the census years provides a measure of the effect of an additional ten years in the United States. To examine how more recent immigrant cohorts compare with earlier ones (how the 1985–1989 cohort compares with the 1975–1979 cohort), it is necessary to compare groups at times in which they have factors other than an immigrant's assimilation may be changing between the two census years. For each of the two types of comparisons, natives provide a baseline to capture these other factors that change between census dates.
Given our initial sample, we follow arrival cohorts separately for two age groups—those aged 25–39 in 1980 (and 35–49 in 1990) and those aged 40–49 in 1980 (50–59 in 1990).11 Changes in labor market behavior related to fertility are most likely to affect females aged 25–39. In contrast, as will be seen in Table 7-6, most of the females aged 40–49 in 1980 had completed their fertility (though not child care) and did not experience changes between 1980 and 1990. The older group is a natural control group to examine changes in labor market behavior related to fertility, although not necessarily for the presence of children.
Tables 7-3 to 7-6—employment, logarithm of hourly earnings, marital status, and fertility, respectively—include a column for 1980, a column for 1990, and a column for the difference between the two years. To control for general economic conditions, each entry in columns (1) and (2) for the immigrant groups is the difference calculated relative to natives. The comparison of changes between the two years in column (3) then indicates the extent to which immigrant groups are catching up to or falling behind natives.
For the two outcome variables that we examine in more detail with regression analysis in the next section—employment rates and the logarithm of hourly earnings—and a third potentially important outcome —fertility—we include two additional columns so we can calculate cohort effects. The cleanest comparison of outcomes across cohorts compares immigrants of the same age and same amount of experience in the United States, but from different arrival cohorts. We make these comparisons in columns (4) and (5). In column (4), cohort means are calculated for 1990 that use the same age restrictions as those used in 1980. In column (5), we calculate the mean difference between each cohort and the cohort that arrived ten years prior.12 An important note about all of these tables is that,
|
11 |
For groups for which emigration and death are not large, these samples are drawn from the same population in the two years. For most groups, attrition does not appear to be a large issue. The exception is the immigrant cohort that arrived prior to 1950. To a lesser extent there is also attrition from the 1950–1959 cohort. |
|
12 |
In the tables for education, English ability, and marital status, in which we are most interested in assimilation between the two census dates, we do not provide calculations of the cohort effects at the same point in the life cycle for most immigrant groups. In the bottom rows of these tables, we calculate cohort effects for the arrival cohorts of the 1980s relative to those of the 1970s. |
by following narrow age groups over time, year of arrival is also an indicator of age at arrival. For example, within the 25–39 age group observed in the 1990 Census, those who arrived between 1970 and 1974 were between the ages of 5 and 23 at arrival, while those who arrived between 1980 and 1984 were between the ages of 15 and 33 at arrival.
Labor Market Assimilation
We begin with the measures that have been most studied for males—employment rates and the logarithm of hourly earnings, shown in Tables 7-3 and 7-4, respectively. To see how these tables are organized, consider employment rates in Table 7-3. In 1980, employment rates of native females were 70.7 percent for those
TABLE 7-3, Panel A Employment in Previous Year in 1980 and 1990
|
Age 25 to 39 in 1980 |
Age 35 to 49 in 1990 |
Age 25 to 39 in 1990 |
|||
|
Percent Employed |
Actual Changes |
Percent Employed |
Cohort |
||
|
1980 |
1990 |
1980–1990 |
1990 |
Change |
|
|
(1) |
(2) |
(3) |
(4) |
(5) |
|
|
Natives |
0.707 |
0.797 |
0.090 |
0.801 |
|
|
(0.001) |
(0.001) |
(0.001) |
(0.001) |
||
|
Relative to Natives: |
|||||
|
Outlying |
-0.267 |
-0.222 |
0.045 |
-0.242 |
|
|
Areas |
(0.009) |
(0.007) |
(0.011) |
(0.008) |
|
|
Immigrants: |
|||||
|
Pre-1950 |
-0.054 |
-0.021 |
0.033 |
||
|
(0.016) |
(0.016) |
(0.023) |
|||
|
1950–1959 |
-0.025 |
-0.023 |
0.002 |
-0.022 |
|
|
(0.008) |
(0.007) |
(0.011) |
(0.011) |
||
|
1960–1964 |
-0.045 |
-0.046 |
-0.001 |
-0.020 |
|
|
(0.008) |
(0.007) |
(0.011) |
(0.009) |
||
|
1965–1969 |
-0.052 |
-0.057 |
-0.005 |
-0.038 |
|
|
(0.006) |
(0.006) |
(0.008) |
(0.007) |
||
|
1970–1974 |
0.069 |
-0.076 |
-0.007 |
-0.077 |
-0.032 |
|
(0.006) |
(0.005) |
(0.008) |
(0.006) |
(0.010) |
|
|
1975–1979 |
-0.157 |
-0.068 |
0.089 |
-0.094 |
-0.042 |
|
(0.005) |
(0.005) |
(0.007) |
(0.005) |
(0.008) |
|
|
1980–1984 |
-0.125 |
-0.056 |
|||
|
(0.004) |
(0.007) |
||||
|
1985–1989 |
-0.247 |
-0.090 |
|||
|
(0.004) |
(0.006) |
||||
|
NOTE: Entries are the proportion of each group that being employed during the previous calendar year. Sample sizes are 343,713 in Column 1,331,543 in Column 2, and 430,836 in Column 4. |
|||||
aged 25–39 in 1980 (shown in Panel A of Table 7-3) and 66.7 percent for those aged 40–49 in 1980 (shown in Panel B of Table 7-3). In 1990, this proportion had increased to 79.7 percent for the younger group and declined to 66.2 percent for the older group. The changes of 9.0 percent (in Panel A) and -0.5 percent (in Panel B) are shown in the third column of the first row in each panel.
Similar calculations relative to natives are shown for each immigrant cohort. For example, the employment rate of persons aged 25–39 who arrived between 1950 and 1959 was 68.2 percent, or 2.5 percentage points below natives (-0.025 in the fourth row and first column of Table 7-3, Panel A) in 1980. In 1990, the employment rate of this group increased to 77.4 percent. But because the employment rate of natives grew as well, the gain on natives was only 0.2 percentage points to a deficit in 1990 of 2.3 percentage points.
TABLE 7-3, Panel B Employment in Previous Year in 1980 and 1990
For persons aged 25–39 in 1980, there is a large increase in employment rates for all groups. The increases for immigrants who arrived prior to 1974 are insignificantly different from the increases for natives. The most recent arrival cohort in 1980 (those who arrived in 1975–1979), however, experienced an increase in employment rates of 17.8 percent, or 8.6 percentage points above the gain for natives.
In contrast to the increase in employment rates for all younger females, for persons aged 40–49 in 1980, there is little change in employment rates between 1980 and 1990 for any group except the most recent arrivals (1975–1979) in 1980. This older group of recent arrivals also had a large deficit in the employment rate relative to natives in 1980 (13.6 percentage points) and gained considerably between 1980 and 1990 (11.0 percentage point gain relative to natives). For both age groups, however, there is some "catching up" for the most recent arrivals; employment rates of immigrant females do not overtake those of native females of similar ages.
In columns (4) and (5) of Table 7-3, the changes across immigrant cohorts with the same amount of U.S. experience, or cohort effects, are shown. Column (4) reports means for the same age group as that reported in column (1). In column (5), the difference between the value in column (4) and the value in column (1) for the cohort that arrived 10 years earlier is calculated. For example, the 1975–1979 cohort in 1990 and the 1965–1969 cohort in 1980 each had 11–15 years of U.S. experience at the time of the census. In Panel A, persons aged 25–39 in the 1975–1979 cohort in 1990 had employment rates 9.4 percentage points below natives (column 4). Persons aged 25–39 in the 1965–1969 cohort in 1980 (at the same level of U.S. experience) had employment rates 5.2 percentage points below the comparison group of natives (column 1). In column (5), we calculate the employment rate of the 1975–1979 cohort to be 4.2 percentage points lower than that of the 1965–1969 cohort at the same level of U.S. experience.
Similarly, the employment rate for immigrants aged 25–39 in the 1985–1989 cohort at 0–5 years of U.S. experience in column (4) is 24.7 percentage points below the rate of natives in 1990. The corresponding deficit for the 1975–1979 cohort in 1980 of the same age group is 15.7 percentage points in column (1). Thus, even though the employment rate of the 1985–1989 cohort during the first five years in the United States was the same as that of the 1975–1979 cohort, this cohort performed 9 percentage points worse relative to natives, and we conclude that there was a decline across these cohorts.
Calculations of changes across cohorts in employment rates in column (5) of Panels A and B show that more recent cohorts perform worse relative to earlier ones. Each of the arrival cohorts over the 1970s and 1980s have significantly lower employment rates relative to natives than the cohort that arrived ten years earlier, ranging from 3 to 9 percentage points.13
|
13 |
These patterns contrast with those found by Baker and Benjamin (1997) for Canada. Using samples of married couples for 1986 and 1991, they find that immigrant women work more than comparable natives and the difference erodes over time. |
Table 7-4 provides similar calculations for the logarithm of real hourly earnings (deflated by the consumer price index) for the two age groups. Between 1980 and 1990, native earnings grew by 0.102 log points for the 25 to 39-year age group (Panel A) and 0.064 log points for the 40 to 49-year age group (Panel B). Hourly earnings of most immigrant cohorts grew more rapidly than that of natives, although the differences are not statistically significant. The most recent immigrants are again an exception, with rapid earnings growth in both age groups. Among those 25–39, hourly earnings of the 1975–1979 arrivals grew by 0.049 log points more than the growth in earnings of natives between 1980 and 1990 (column 3, Panel B). For those aged 40–49 in 1980, the growth was 0.074 log points relative to natives.
TABLE 7-4, Panel A Log Hourly Earnings in Previous Year in 1980 and 1990
TABLE 7-4, Panel B Log Hourly Earnings in Previous Year in 1980 and 1990
As in Table 7-3, cohort effects are calculated for those aged 25–39 in each census year in Panel A and for those aged 40–49 in Panel B. Comparison of immigrant arrival cohorts at similar levels of U.S. experience, shown in column (5), suggests that the labor market quality of immigrant cohorts has fallen continuously since the 1970s. The 1970–1974 cohort performs similarly, relative to natives, to the 1960–1964 cohort ten years earlier. After this cohort, however, each successive cohort earns less than the arrival cohort ten years earlier. For the younger age group, these differences range from 6–8 percentage points. For the older age group, these differences are larger, reaching 9–14 percentage points.
Educational Attainment and English Ability
As was seen in the overall means with the 1990 Census data, there are differences among natives, earlier immigrant cohorts, and later immigrant cohorts in educational attainment and English ability. Changes in these characteristics over time may explain some of the observed differences in labor market outcomes. Although we do not report the results here in a table format, we conducted comparisons of cohorts over time for educational attainment and English ability similar to those reported for employment and hourly earnings.
To summarize changes in educational attainment between 1980 and 1990, the proportion of each cohort with less than a high school degree and the proportion with a college degree were calculated. The main finding is that there is relatively little difference between natives and immigrant cohorts in the accumulation of education after arrival in the United States. For all immigrant and native groups—including those age 40 and above in 1980, there was a reduction in the proportion without a high school diploma between 1980 and 1990, but this difference is between 0.06 and 0.08 points for all groups (including those over age 40 in 1980) except the younger group of recent arrivals (age 25–39 in 1980, who arrived in 1975–1979). These drops are slightly greater for earlier immigrant cohorts.
For college completion, there is a difference by age group. For persons aged 25–39 in 1980, immigrants who arrived in the 1960s are were less likely to have completed college than natives in 1980, while the most recent arrival cohort (1975–1979) was more likely to have completed college. Between 1980 and 1990, the 1960s arrival cohorts continued college at rates similar to natives, while the college completion rate of subsequent cohorts declined relative to natives. For the older age group, there is very little difference relative to natives in the change in college completion for any of the arrival cohorts.
For both age groups there has been a drop in the proportion that has completed high school across arrival cohorts that leveled off with the most recent arrival cohort of 1985–1989. At the high end of educational attainment, there has been an increase in the college completion rate across successive cohorts for the younger age group and a decline for the older age group.
We summarize English ability by grouping those who only speak English or speak English very well and grouping all other abilities to speak English. Because there was no change in the English ability of natives in either age group, all changes relative to natives between 1980 and 1990 reflect changes in immigrant English ability. Over this period, all immigrant groups improved English ability, with more rapid gains for more recent immigrant groups (that were also younger at the time of arrival). The gains were largest for immigrants aged 25–39 who arrived in the United States between 1975 and 1979—an improvement of 9.1 percentage points between the two census years. Comparison of the cohorts at the same level of U.S. experience shows a continuous decline
in English ability across cohorts through the cohort that arrived in the first half of the 1980s (1980–1984). For the cohort of the late 1980s (1985–1989), this trend levels off and there is a slight improvement relative to the cohort that arrived in 1975–1979.
Marital Status and Fertility
The potential role of household behavior in explaining differences between labor market outcomes of native and immigrant females is seen in Tables 7-5 and 7-6. For each age group, percent married and children ever born relative to natives are shown for each arrival cohort in 1980 and 1990. There are two patterns to note before turning to the comparison of immigrants and natives. First, when followed over time, fewer women in each nativity age group were married in 1990 than in 1980 (Table 7-5). This pattern is more pronounced for those aged 40–49 in 1980, but is statistically significant for many of the younger female groups as well. Second, women age 40 and over in 1980 had completed their fertility (Table 7-6, Panel B). For no nativity group is there a statistically significant increase in the number of children ever born between 1980 and 1990 for those over age 40.
In the comparison of immigrant and native marriage rates for the group aged 25–39 in 1980 (columns 1 and 2 of Table 7-5), all of the immigrant arrival cohorts have higher marriage rates than natives. The changes in the marriage rates are quite similar for immigrants and natives, however, and only for the 1965–1969 cohort is the decline in percent marriage statistically different from that of natives. Again, the one exception to the pattern of decline in marriage rates is the most recent immigrant cohort that arrived between 1975 and 1979. After ten years in the United States (in 1990), the marriage rate of this cohort increases significantly relative to natives.14
In Table 7-5, we present the cohort changes only for the most recent two five-year cohorts in the final rows of the table. These rows compare the marriage rates of immigrants relative to natives using the same age group in both 1980 and 1990. It can be seen that the arrival cohorts of the 1980s are more likely to be married in 1990 than earlier cohorts at the point in which they had the same amount of experience in the United States.
Changes in fertility for immigrants and natives are presented in the two panels of Table 7-6. Between 1980 and 1990, native women aged 25–39 in 1980 had an additional one-third of a child, on average (column 3). Immigrant females in this age group who arrived prior to 1970 had higher levels of fertility than natives in 1980 (by 0.2 to 0.3 children per women in column 1), but changes in
|
14 |
Unfortunately, because we do not know the marital status at the time of entry to the United States, we cannot determine changes in marital status within the first five years after arrival in the United States. |
TABLE 7-5 Marital Status in 1980 and 1990
|
Age 25 to 39 in 1980 (35 to 49 in 1990) |
Age 40 to 49 in 1980 (50 to 59 in 1990) |
|||||
|
Percent Married |
Actual |
Percent Married |
Actual |
|||
|
1980 |
1990 |
Changes |
1980 |
1990 |
Change |
|
|
(1) |
(2) |
(3) |
(4) |
(5) |
(6) |
|
|
Natives |
0.707 |
0.697 |
-0.01 |
0.767 |
0.698 |
-0.069 |
|
(0.001) |
(0.001) |
(0.001) |
(0.001) |
(0.001) |
(0.001) |
|
|
Relative to Natives: |
||||||
|
Outlying |
-0.154 |
-0.175 |
-0.021 |
-0.164 |
-0.197 |
-0.033 |
|
Areas |
(0.009) |
(0.008) |
(0.012) |
(0.012) |
(0.013) |
(0.018) |
|
Immigrants: |
||||||
|
Pre-1950 |
0.028 |
0.001 |
-0.027 |
-0.021 |
-0.004 |
0.017 |
|
(0.015) |
(0.018) |
(0.027) |
(0.013) |
(0.015) |
(0.020) |
|
|
1950–1959 |
0.013 |
0.032 |
0.019 |
0.046 |
0.050 |
03004 |
|
(0.008) |
(0.008) |
(0.011) |
(0.007) |
(0.007) |
(0.010) |
|
|
1960–1964 |
0.049 |
0.031 |
-0.018 |
0.036 |
0.021 |
-0.015 |
|
(0.008) |
(0.008) |
(0.011) |
(0.008) |
(0.009) |
(0.012) |
|
|
1965–1969 |
0.073 |
0.056 |
-0.017 |
0.001 |
0.003 |
0.002 |
|
(0.006) |
(0.006) |
(0.008) |
(0.009) |
(0.009) |
(0.013) |
|
|
1970–1974 |
0.090 |
0.083 |
-0.007 |
0.013 |
0.003 |
-0.010 |
|
(0.006) |
(0.005) |
(0.008) |
(0.010) |
(0.011) |
(0.015) |
|
|
1975–1979 |
0.059 |
0.078 |
0.019 |
0.012 |
-0.001 |
-0.013 |
|
(0.005) |
(0.006) |
(0.008) |
(0.010) |
(0.012) |
(0.016) |
|
|
Aged 25 to 39 Relative to Natives 25 to 39 (40 to 49): |
||||||
|
1980–1984 |
0.074 |
0.018 |
||||
|
(0.004) |
(0.008) |
|||||
|
1985–1989 |
0.061 |
0.035 |
||||
|
(0.005) |
(0.009) |
|||||
|
NOTE: Entries are percent of group that were married at time of census. Sample sizes are 343,713 in Column 1; 331,543 in Column 2; 159,595 in Column 4; and 154,365 for Column 5, not including the 1980s cohorts. The sample sizes in the regressions used to estimate the coefficients for the 1980s cohorts are 430,836 in Column 2 and 229,102 in Column 5. |
||||||
fertility between 1980 and 1990 for most immigrant arrival cohorts are statistically similar to those of natives (column 3).
Once again, the exception to this pattern is the most recent immigrant arrival group—in this case, those who arrived between 1970 and 1979. The two five-year arrival cohorts in this group had much higher changes in fertility between 1980 and 1990 than did either natives or earlier immigrant cohorts. The immigrant cohort that arrived between 1970 and 1974 had an initial mean number of 0.13 children more than natives in 1980, which increased to 0.35 more than natives in 1990. This represents a gain of 0.21 children relative to natives (column
TABLE 7-6, Panel A Children Ever Born in 1980 and 1990, Women 25 to 39 in 1980
|
Age 25 to 39 in 1980 |
Age 35 to 49 in 1990 |
Age 25 to 39 in 1990 |
|||
|
Children Ever Born |
Actual Changes |
Children Ever Born |
Cohort |
||
|
1980 |
1990 |
1980–1990 |
1990 |
Change |
|
|
(1) |
(2) |
(3) |
(4) |
(5) |
|
|
Natives |
1.723 |
2.058 |
0.335 |
1.475 |
|
|
(0.003) |
(0.003) |
(0.004) |
(0.002) |
||
|
Relative to Natives: |
|||||
|
Outlying |
0.734 |
0.670 |
-0.064 |
0.602 |
|
|
Areas |
(0.028) |
(0.028) |
(0.040) |
(0.025) |
|
|
Immigrants: |
|||||
|
Pre-1950 |
0.460 |
0.269 |
-0.191 |
||
|
(0.050) |
(0.060) |
(0.078) |
|||
|
1950–1959 |
0.008 |
0.062 |
0.054 |
0.292 |
|
|
(0.026) |
(0.027) |
(0.037) |
(0.036) |
||
|
1960–1964 |
0.303 |
0.225 |
-0.078 |
0.046 |
|
|
(0.027) |
(0.027) |
(0.038) |
(0.029) |
||
|
1965–1969 |
0.212 |
0.259 |
0.047 |
0.157 |
|
|
(0.021) |
(0.021) |
(0.030) |
(0.024) |
||
|
1970–1974 |
0.136 |
0.349 |
0.213 |
0.517 |
0.214 |
|
(0.018) |
(0.018) |
(0.025) |
(0.019) |
(0.033) |
|
|
1975–1979 |
-0.153 |
0.374 |
0.527 |
0.517 |
0.305 |
|
(0.018) |
(0.018) |
(0.025) |
(0.015) |
(0.026) |
|
|
1980–1984 |
0.250 |
0.114 |
|||
|
(0.013) |
(0.022) |
||||
|
1985–1989 |
-0.139 |
0.014 |
|||
|
(.013) |
(0.022) |
||||
|
NOTE: Entries are number of children ever born. Sample sizes are 343,713 in Column 1; 331,543 in Column 2; and 430,836 in Column 4. |
|||||
3). For the 1975–1979 cohort, the change is even more dramatic. This cohort had fertility less than that of natives in 1980 and, after having nearly one additional child per women between 1980 and 1990, had fertility levels significantly more than native females in 1990. This cohort gained 0.53 children relative to natives between 1980 and 1990.
The comparisons of cohort changes in columns (4) and (5) are calculated similarly to those shown above for employment rates and hourly earnings. These calculations show a steadily increasing number of children ever born across immigrant cohorts through the 1980–1984 cohort. For women 25–39, the 1970–1974 and 1975–1979 cohorts had 0.2 to 0.3 more children, on average, than the 1960s cohorts at the same level of U.S. experience. In the 1980s, these two
TABLE 7-6, Panel B Children Ever Born in 1980 and 1990, Women 40 to 49 in 1980
|
Age 25 to 39 in 1980 |
Age 35 to 49 in 1990 |
Age 25 to 39 in 1990 |
|||
|
Children Ever Born |
Actual Changes |
Children Ever Born |
Cohort |
||
|
1980 |
1990 |
1980–1990 |
1990 |
Change |
|
|
(1) |
(2) |
(3) |
(4) |
(5) |
|
|
Natives |
3.029 |
3.010 |
-0.019 |
2.202 |
|
|
(0.005) |
(0.005) |
(0.007) |
(0.003) |
||
|
Relative to Natives: |
|||||
|
Outlying |
0.542 |
0.576 |
0.034 |
.704 |
|
|
Areas |
(0.058) |
(0.056) |
(0.081) |
(.035) |
|
|
Immigrants: |
|||||
|
Pre-1950 |
-0.060 |
-0.006 |
0.054 |
.125 |
|
|
(0.062) |
(0.067) |
(0.091) |
(.062) |
||
|
1950–1959 |
-0.189 |
-0.247 |
-0.058 |
.056 |
|
|
(0.032) |
(0.032) |
(0.045) |
(.034) |
||
|
1960–1964 |
-0.551 |
-0.560 |
-0.009 |
.211 |
|
|
(0.039) |
(0.038) |
(0.054) |
(.032) |
||
|
1965–1969 |
-0.500 |
-0.502 |
-0.002 |
.124 |
|
|
(0.041) |
(0.041) |
(0.058) |
(.025) |
||
|
1970–1974 |
-0.216 |
-0.196 |
0.020 |
.202 |
0.355 |
|
(0.048) |
(0.046) |
(0.066) |
(.023) |
(0.045) |
|
|
1975–1979 |
0.125 |
0.231 |
0.106 |
.380 |
0.731 |
|
(0.050) |
(0.051) |
(0.071) |
(.027) |
(0.049) |
|
|
1980–1984 |
.410 |
0.194 |
|||
|
(.028) |
(0.057) |
||||
|
1985–1989 |
.420 |
0.295 |
|||
|
(.030) |
(0.058) |
||||
|
NOTE: Entries are number of children ever born. Sample sizes are 159,595 in Column 1; 154,365 in Column 2; and 229,102 in Column 4. |
|||||
cohort effects are smaller, with the difference between the 1975–1979 and 1985–1989 cohort being statistically insignificant. For females 40–49, the differences in number of children ever born across immigrant arrival cohorts are larger, ranging from 0.2 to 0.7 additional children, and continue through the 1985–1989 cohort.
ESTIMATION APPROACH
We now turn to a multivariate analysis of employment and wages. We adopt the regression framework developed by Borjas (1985, 1995) for estimating the effects of year of arrival and duration of U.S. residence on immigrant outcomes.
This framework exploits the availability of comparable cross-sectional data from two different points in time, and the resulting regression analysis is very similar in spirit to that in Tables 7-3 through 7-6 in the previous section. Without strong restrictions, cross-sectional regressions cannot distinguish immigrant cohort and assimilation effects because, at any given point in time, variation across immigrants in years of U.S. residence arises only from differences in year of entry to the United States. With repeated cross sections, however, outcomes for immigrant arrival cohorts can be tracked over time, and the trick then becomes to isolate changes that are due to assimilation from changes that are caused by different economic conditions in the survey years being compared (i.e., period effects). The most popular solution to this problem, and the one adopted here, is to estimate period effects from the outcome changes experienced by an appropriate group of native workers. After netting out these estimates of the period effects, remaining changes for immigrant cohorts are attributed to assimilation.15
To be explicit, let ygj represent the outcome for worker j, where the superscript g takes on the values I for immigrants and N for natives. Pooling data from the 1980 and 1990 censuses, immigrant outcomes are determined by the equation
yIj = Cjλ1 + Ajδ1 + sπTj + (1-Tj)XjβI80 + TjXjβI90 + εIj, (1)
where the vector C is a set of mutually exclusive dummy variables identifying immigrant arrival cohorts, the vector A is a set of mutually exclusive dummy variables indicating duration of U.S. residence, T is a dummy variable marking observations from the 1990 Census, the vector X contains other determinants of outcomes, ε is a random error term, and the remaining parameters are the objects of estimation. This specification gives each immigrant arrival cohort its own intercept, and differences in these intercepts represent permanent outcome differentials between cohorts. The coefficients of the duration of U.S. residence dummies measure the effects of immigrant assimilation on the outcome variable. In addition, the coefficients of the variables in X are allowed to vary across census years, with the subscripts 80 and 90 indicating the survey year of a particular parameter vector.
The corresponding equation for natives is
yNj = αN + πTj + (1-Tj)XjβN80 + TjXjβN90 + εNj, (2)
where αN is the intercept for natives, and the immigrant arrival cohort and duration of U.S. residence variables are excluded from this equation because they are not relevant for U.S.-born workers.
To see the identification problem in equation (1), it is easiest to think of C, A, and T as being scalar variables denoting, respectively, year of entry to the United
|
15 |
A key assumption of this approach is that compositional changes in the subsample of an immigrant cohort observed in the U.S. labor market—such as those caused by emigration, mortality, and labor force entry and exit—do not bias measured outcome changes. |
States, years since entry, and survey year. In this case, C + A = T, which implies that we cannot estimate the separate effects of these variables without imposing some restriction. An analysis of immigrant outcomes must confront the classic problem of identifying cohort, age, and period effects. The identifying restriction imposed in equations (1) and (2) is that the period effect π is the same for immigrants and natives, as indicated by the absence of a superscript on this parameter. In essence, the period effect is estimated from U.S.-born individuals, and this information is used to identify cohort and assimilation effects for the foreign born. To estimate the parameters of equations (1) and (2), we pool observations on immigrants and natives from both the 1980 and the 1990 censuses into a single regression, and then impose the restrictions implicit in these equations by introducing the appropriate interaction terms between nativity, the 1990 Census dummy, and the other explanatory variables.
EMPLOYMENT REGRESSIONS
The first characteristic of female immigrants that we analyze in detail is their attachment to the labor market. Tables 7-7 and 7-8 present estimates of equations (1) and (2) in which the dependent variable is a dummy identifying women who worked at any time during the calendar year preceding the census.16 The coefficients were estimated by least squares, with sampling weights used in the regressions.17 Standard errors are shown in parentheses. These regressions, and all further regressions reported in this chapter, exclude immigrants who arrived prior to 1950, both because of the ambiguity as to when these immigrants arrived, and also because this is the only cohort to show signs of substantial attrition between the 1980 and 1990 censuses. To avoid complications that arise with immigrants who arrived as children, we also exclude all foreign-born individuals whose age and arrival cohort imply any possibility that they entered the United States prior to age 15.18
Table 7-7 reports the immigrant cohort and assimilation effects, as well as the period effects, from employment regressions that successively add control
|
16 |
We experimented with indicators of labor market attachment other than employment last year, including weeks worked last year and employment or labor force participation during the census survey week. Similar patterns emerged using these alternative measures. |
|
17 |
Given our very large sample, we employ least squares here with a dichotomous dependent variable for the sake of computational convenience. Probit estimates produced similar results. |
|
18 |
Immigrants who arrive as children, and who therefore acquire much of their education and all of their work experience in the United States and who are more likely to speak English fluently, experience greater economic success than immigrants who come as adults (Kossoudji, 1989; Friedberg, 1991; Smith, 1991). Given the age and other restrictions typically used to construct analysis samples, the average age at arrival within the extracted subsample of a cohort falls with duration of residence in the United States, because as an immigrant arrival cohort ages, its youngest members enter the sample and its oldest members leave the sample. These factors combine to produce a spurious correlation between immigrant outcomes and duration of U.S. residence. |
variables.19 In column (1), the only controls are for geographic location (dummy variables identifying census division and whether the individual lives in a metropolitan area) and age (dummy variables representing five-year age groups). Column (2) adds controls for racial-ethnic affiliation (Mexican, Puerto Rican, other Hispanic, non-Hispanic black, non-Hispanic Asian, non-Hispanics who report some other nonwhite race, and the reference category of non-Hispanic white). Column (3) also includes indicators of educational attainment, English language proficiency, marital status, and whether the woman is the mother of any children under age 18 who currently live with her. The coefficients of the geographic controls are restricted to be the same for immigrants and natives, but these coefficients can differ in 1980 and 1990. 20 The coefficients of all other control variables are allowed to vary both by nativity and by census year.
In column (1) of Table 7-7, the estimated coefficients of the immigrant cohort dummies represent differences in the employment rates of U.S.-born women aged 25–29 and foreign-born women the same age who are members of a particular immigrant arrival cohort and who have lived in the United States for five years or less. The negative coefficients indicate that, on arrival, young immigrant women from all cohorts are much less likely to work than young native women, with this employment gap ranging from 13 to 28 percentage points across arrival cohorts. In addition, the estimates imply that employment rates are similar for immigrant cohorts arriving before 1970, but jobholding has declined steadily among later cohorts. For example, 1970–1974 arrivals have an employment rate about 5 percentage points below that of the 1965 –1969 cohort, and the most recent immigrants in our data (1985–1989 arrivals) are in turn 10 percentage points less likely to work than the 1970–1974 cohort.
Continuing down the first column of estimates in Table 7-7, the pattern of coefficients for the duration of U.S. residence dummies suggests that migration may initially disrupt the labor market activities of women. Employment rates for female immigrants jump 9 percentage points between their first five years in the United States and their second five years, and then employment declines somewhat with further exposure to America. In his analysis of microdata from the 1970–1990 censuses, Schoeni (1996b) finds a similar pattern of labor force assimilation for female immigrants from most national origin groups.
When ethnicity is controlled for in column (2) of Table 7-7, employment differences between immigrant arrival cohorts shrink somewhat, with the largest intercohort differential now reaching 9 percentage points, as compared with the maximum differential of 15 percentage points in column (1). This result provides
|
19 |
To ease computing requirements, these regressions use a 30 percent random sample of the larger data set described in the second section. The resulting data set provides a 1.5 percent sample of the relevant immigrant population and a 0.3 percent sample of the native population. |
|
20 |
The geographic variables are included to control for regional variation in the cost of living and economic conditions, factors which may impact immigrants and natives to a similar extent. |
TABLE 7-7 Female Employment Regressions, Immigrant Cohort and Assimilation Effects and Period Effects
|
Regressor |
(1) |
(2) |
(3) |
|
Immigrant Cohort: |
|||
|
1985–89 Arrivals |
-.281 |
-.277 |
-.203 |
|
(.009) |
(.011) |
(.015) |
|
|
1980–84 Arrivals |
-.241 |
-.248 |
-.195 |
|
(.030) |
(.031) |
(.031) |
|
|
1975–79 Arrivals |
-.199 |
-.224 |
-.165 |
|
(.011) |
(.013) |
(.019) |
|
|
1970–74 Arrivals |
-.177 |
-.208 |
-.171 |
|
(.028) |
(.029) |
(.032) |
|
|
1965–69 Arrivals |
-.132 |
-.195 |
-.158 |
|
(.023) |
(.030) |
(.040) |
|
|
1960–64 Arrivals |
-.131 |
-.187 |
-.168 |
|
(.029) |
(.035) |
(.043) |
|
|
1950–59 Arrivals |
-.144 |
-.220 |
-.192 |
|
(.038) |
(.048) |
(.062) |
|
|
Born in Outlying Area of U.S. |
-.290 |
-.179 |
-.144 |
|
(.010) |
(.024) |
(.025) |
|
|
Duration of U.S. Residence: |
|||
|
0–5 Years (reference group) |
|||
|
6–10 Years |
.089 |
.099 |
.131 |
|
(.028) |
(.028) |
(.027) |
|
|
11–15 Years |
.071 |
.111 |
.123 |
|
(.015) |
(.019) |
(.024) |
|
|
16–20 Years |
.051 |
.098 |
.111 |
|
(.028) |
(.030) |
(.033) |
|
|
21–30 Years |
.031 |
.107 |
.102 |
|
(.029) |
(.037) |
(.048) |
|
|
31–40 Years |
.051 |
.148 |
.126 |
|
(.047) |
(.058) |
(.072) |
|
|
1990 Census Dummy |
.065 |
.074 |
-.030 |
|
(.006) |
(.006) |
(.007) |
|
|
R2 |
.043 |
.045 |
.128 |
a rough indication that changes in the national origin composition of immigrant flows to the United States account for perhaps a third of the employment decline observed between pre-1970 and post-1980 cohorts of female immigrants. To determine whether more detailed controls for immigrant source countries can explain a larger portion of this employment decline, we re-estimated the specification in column (2) after replacing the ethnicity dummies for immigrants with an alternative set of dummies identifying 17 different world regions of birth.21 This
|
21 |
As was the case with the immigrant ethnicity dummies, the coefficients of the immigrant birthplace dummies are allowed to differ across census years. These birthplace dummies identify the following regions: Africa, North America, Mexico, South America, Central America, the Caribbean, East Asia, Southwest Asia, Southeast Asia, the Middle East, Northern Europe, Western Europe, Southern Europe, Eastern Europe, the former USSR, Oceania, and a final category for immigrants whose specific birthplace is not reported. |
alternative specification produced similar estimates of immigrant cohort and assimilation effects, and the less aggregated information on national origins did not further attenuate the estimated employment differentials between arrival cohorts.
In column (2) we once again observe a steep rise in employment as foreign-born women move from 0–5 to 6–10 years in the United States. Unlike the column (1) estimates, however, employment rates do not decline with further time spent in the United States.
The final column in Table 7-7 adds controls for education, English proficiency, marital status, and children. Educational attainment is represented by a set of dummy variables identifying the following categories for completed years of schooling: 0–8 years, 9–11 years, 12 years (the omitted dummy), 13–15 years, and 16 or more years.22 For immigrants, we measure English proficiency with a set of dummy variables identifying each of the five possible responses, with the omitted group representing English monolinguals. Because few U.S.-born individuals report speaking English ''not well" or "not at all," for natives we collapse
|
22 |
We follow Jaeger's (1997) recommendations for how to maximize consistency between the different education questions asked in the 1980 and 1990 censuses. |
the three lowest categories of English proficiency into a single dummy variable identifying bilinguals who speak English worse than "very well." Marital status is represented by a set of dummies assigning women to three categories: never married (the omitted group); currently married, excluding those who are separated; and widowed, divorced, or separated. Finally, dummy variables signal the presence of any own children living in the household who fall into the following age groups: 0–2, 3–6, and 7–17 years old.
After conditioning on the extensive control variables included in the column (3) specification, remaining employment differences between immigrant cohorts are small, with the most noticeable distinction being that 1950s and 1980s arrivals have employment rates 2–4 percentage points below those of other immigrants. With these controls for observable characteristics, the jump in immigrant employment occurring after the initial five years in the United States increases to 13 percentage points, and the subsequent employment changes that are due to assimilation are small.
Recall that the employment regressions include a vector of dummy variables identifying five-year age groups whose coefficients are allowed to vary by nativity and census year. In all three specifications and in both survey years, these age coefficients (not reported) imply that employment rates fall with age more sharply for natives than immigrants. According to our estimates, predicted employment differences between immigrants and natives vary with age, partly because of the differential age effects, and also because assimilation can influence the employment of foreign-born women as they age in the United States.
Figure 7-1 displays representative employment profiles for immigrant and native women that illustrate the combined impact of age and assimilation on immigrant-native employment differentials. The top panel of Figure 7-1 derives from the estimates of specification (1) in Table 7-7. In addition to immigrant cohort and assimilation effects, age effects, and period effects, this specification includes controls for census division and metropolitan status. The predicted employment rates pictured in the top panel of Figure 7-1 are for women in 1990 who live in a metropolitan area in the Pacific division. For natives, we use their 1990 age coefficients to calculate how employment rates vary across five-year age groups. For immigrants, we perform a similar calculation using both their 1990 age coefficients and the appropriate duration of U.S. residence coefficients from column (1) of Table 7-7, under the assumption that immigrants arrive in the United States at age 25. Employment differences between immigrant cohorts are calculated from the cohort coefficients in column (1) of Table 7-7, with simple averages of the relevant coefficients used to aggregate up to ten-year arrival cohorts.
The bottom panel of Figure 7-1 presents analogous predictions from specification (3) in Table 7-7 that include a more extensive set of control variables. As before, the calculations represent women in 1990 who live in a metropolitan area
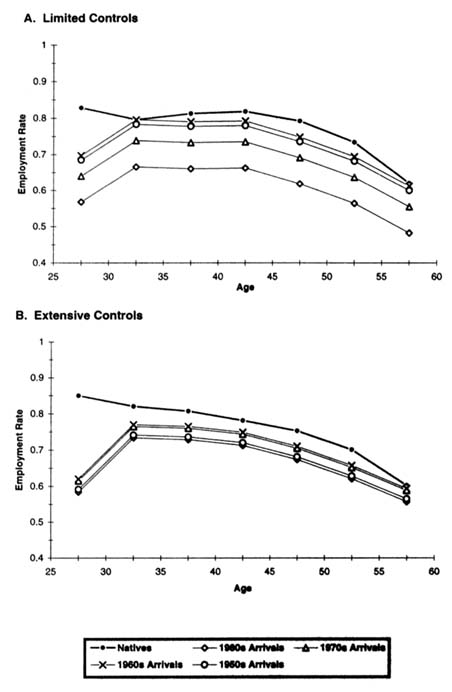
in the Pacific division, but we now also specify that these are white, married women with 12 years of schooling who speak only English and have no children.
Figure 7-1 nicely illustrates the main features of employment differentials both between U.S.-born and foreign-born women and across immigrant arrival cohorts. Considering first the top panel with limited control variables, we see that the predicted employment rate of female immigrants rises sharply between the 25–29 and 30–34 age groups, even as the employment rate of native women falls between these same age groups. This pattern arises because of the jump in immigrant employment that takes place after five years of U.S. residence. After this initial adjustment period, the employment rate of foreign-born women varies with age in much the same manner as the employment rate of U.S.-born women, and immigrants who arrived before 1970 are only slightly less likely to work than natives. The figure also highlights the decreased labor market activity of more recent cohorts of female immigrants, with the 1970s arrivals having an employment rate about 6 percentage points below that of earlier arrivals, and the employment rate falling an additional 7 percentage points for 1980s arrivals.
The bottom panel of Figure 7-1 shows that qualitatively similar patterns emerge after controlling extensively for observable characteristics. In this case, however, the rise in immigrant employment after five years in the United States is even more dramatic, and employment differences across immigrant cohorts are greatly reduced. Indeed, observable variables can account for essentially all of the employment differential between the 1970s arrivals and earlier cohorts, and these same variables explain most of the employment deficit for the 1980 arrivals.
A word of caution is in order regarding the employment profiles depicted in Figure 7-1. Because the age coefficients in our model are identified by cross-sectional variation,23 they undoubtedly confound birth cohort effects with true age effects. This issue is particularly relevant in the current context, because the dramatic growth in female labor force participation witnessed during this century was in large part driven by the changing behavior of birth cohorts (Smith and Ward, 1985; Goldin, 1990:Chap. 2). For this reason, Figure 7-1 and similar figures presented below are only intended to illustrate how comparisons between immigrants and natives vary with age, rather than to portray life-cycle changes.
Table 7-8 presents the estimated coefficients of selected control variables from the most extensive specification. These coefficients are from the same employment regression reported in column (3) of Table 7-7. For both immigrants and natives, the positive relationship between education and employment strengthened over the 1980s, and there is also some indication that during this decade English language deficiencies became a bigger obstacle to holding a job,
|
23 |
Although we pool data from the 1980 and 1990 censuses, the intertemporal variation is used to identify period effects and distinguish for immigrants the separate effects of arrival cohort and assimilation. |
TABLE 7-8 Female Employment Regressions, Selected Coefficients, by Nativity and Census Year
|
Natives |
Immigrants |
|||
|
Regressor |
1980 |
1990 |
1980 |
1990 |
|
Education: |
||||
|
0–8 Years |
-.205 |
-.289 |
-.029 |
-.058 |
|
(.004) |
(.006) |
(.011) |
(.009) |
|
|
9–11 Years |
-.100 |
-.156 |
-.023 |
-.059 |
|
(.003) |
(.004) |
(.013) |
(.012) |
|
|
12 Years (reference group) |
||||
|
13–15 Years |
.055 |
.083 |
.038 |
.062 |
|
(.003) |
(.002) |
(.012) |
(.009) |
|
|
16 or More Years |
.114 |
.132 |
.087 |
.111 |
|
(.003) |
(.003) |
(.013) |
(.009) |
|
|
English Proficiency: |
||||
|
Speaks Only English (reference group) |
||||
|
Speaks English Very Well |
.033 |
-.013 |
.008 |
.0003 |
|
(.006) |
(.005) |
(.012) |
(.010) |
|
|
Speaks English Well |
-.006 |
-.034 |
-.025 |
-.029 |
|
(.009) |
(.009) |
(.013) |
(.011) |
|
|
Speaks English Not Well |
-.066 |
-.100 |
||
|
(.015) |
(.012) |
|||
|
Speaks English Not at All |
-.133 |
-.169 |
||
|
(.018) |
(.015) |
|||
|
Marital Status: |
||||
|
Never Married (reference group) |
||||
|
Married |
-.056 |
.015 |
-.102 |
-.052 |
|
(.004) |
(.003) |
(.014) |
(.010) |
|
|
Widowed, Divorced, or Separated |
.084 |
.083 |
-.005 |
.014 |
|
(.004) |
(.004) |
(.016) |
(.012) |
|
|
Presence of Own Children in Household: |
||||
|
Age 0–2 |
-.204 |
-.131 |
-.159 |
-.124 |
|
(.004) |
(.003) |
(.012) |
(.010) |
|
|
Age 3–6 |
-.176 |
-.133 |
-.126 |
-.110 |
|
(.003) |
(.003) |
(.011) |
(.009) |
|
|
Age 7–17 |
-.052 |
-.039 |
-.061 |
-.035 |
|
(.002) |
(.002) |
(.009) |
(.007) |
|
|
NOTE: These coefficients are from the same employment regression reported in column (3) of Table 7-7; see the note to that table for more information. Standard errors are shown in parentheses. For natives, the English proficiency categories representing bilinguals who speak English "well," "not well," or "not at all" have been collapsed into a single dummy variable. |
||||
TABLE 7-9 Male Employment Regressions, Immigrant Cohort and Assimilation Effects and Period Effects
|
Regressor |
(1) |
(2) |
(3) |
|
Immigrant Cohort: |
|||
|
1985–89 Arrivals |
-.127 |
-.124 |
-.070 |
|
(.005) |
(.007) |
(.009) |
|
|
1980–84 Arrivals |
-.168 |
-.162 |
-.102 |
|
(.020) |
(.020) |
(.021) |
|
|
1975–79 Arrivals |
-.146 |
-.161 |
-.092 |
|
(.007) |
(.008) |
(.012) |
|
|
1970–74 Arrivals |
-.163 |
-.177 |
-.110 |
|
(.019) |
(.019) |
(.021) |
|
|
1965–69 Arrivals |
-.162 |
-.197 |
-.116 |
|
(.015) |
(.019) |
(.025) |
|
|
1960–64 Arrivals |
-.169 |
-.205 |
-.131 |
|
(.019) |
(.022) |
(.027) |
|
|
1950–59 Arrivals |
-.165 |
-.227 |
-.137 |
|
(.024) |
(.030) |
(.039) |
|
|
Born in Outlying Area of U.S. |
-.152 |
-.104 |
-.066 |
|
(.007) |
(.014) |
(.014) |
|
|
Duration of U.S. Residence: |
|||
|
0–5 Years (reference group) |
|||
|
6–10 Years |
.135 |
.135 |
.121 |
|
(.019) |
(.019) |
(.019) |
|
|
11–15 Years |
.133 |
.152 |
.119 |
|
(.009) |
(.012) |
(.015) |
|
|
16–20 Years |
.150 |
.169 |
.133 |
|
(.018) |
(.020) |
(.022) |
|
|
21–30 Years |
.161 |
.201 |
.144 |
|
(.018) |
(.023) |
(.029) |
|
|
31–40 Years |
.143 |
.202 |
.128 |
|
(.031) |
(.037) |
(.045) |
|
|
1990 Census Dummy |
-.019 |
-.016 |
-.0001 |
|
(.004) |
(.004) |
(.004) |
|
|
R2 |
.021 |
.040 |
.095 |
especially for immigrants who speak little or no English. These findings are consistent with other well-documented signs that the demand for skilled workers was rising over this period (Bound and Johnson, 1992; Murphy and Welch, 1992; Juhn et al., 1993). In addition, the employment differential between married and never-married women shrank during the 1980s, disappearing altogether for natives. Similarly, children were less of a deterrent to work in 1990 than they were a decade earlier.
Turning now to immigrant-native comparisons, Table 7-8 indicates that employment differences by education level are wider for natives than for immigrants, particularly when comparing high school dropouts with high school gradu-
|
Regressor |
(1) |
(2) |
(3) |
|
Other Controls: |
|||
|
Census Division and Metropolitan Status |
es |
Yes |
Yes |
|
Age |
Yes |
Yes |
Yes |
|
Ethnicity |
No |
Yes |
Yes |
|
Educational Attainment |
No |
No |
Yes |
|
English Proficiency |
No |
No |
Yes |
|
Marital Status |
No |
No |
Yes |
|
Note: The dependent variable is a dummy indicating whether the individual worked at any time during the calendar year preceding the Census. The coefficients were estimated by least squares, with standard errors shown in parentheses. Sampling weights were used in the regressions. Data are from the 1980 and 1990 Censuses. The sample includes men aged 25–59. Excluded are any immigrants who may have been younger than age 15 when they first arrived in the United States. The total sample size is 391,537 observations: 109,174 immigrants and 282,363 natives. The effects of Census division and metropolitan status are restricted to be the same for immigrants and natives, but these effects can differ in 1980 and 1990. The effects of all other control variables are allowed to vary both by nativity and Census year. |
|||
ates. This result suggests that the U.S. labor market values an additional increment of U.S. schooling by more than it values an additional increment of foreign schooling, which is the interpretation often used to explain the finding that the returns to education— in terms of earnings—are higher for natives than for immigrants (Chiswick, 1978). Table 7-8 also implies that the relationship between marital status and employment is different for immigrants and natives. Using never-married women as the reference group, marriage reduces employment more for immigrants than for natives, and losing a husband (through either death or divorce) does not raise employment for immigrants the way it does for natives.
For purposes of comparison, we estimated similar employment regressions for men; Tables 7-9 and 7-10 and Figure 7-2 report these results.24 In contrast to the strong pattern for female immigrants of lower employment rates for more recent arrival cohorts, employment differences between cohorts of male immigrants are negligible, particularly in the column (1) regression that employs a minimal set of control variables. Indeed, when ethnicity and other controls are
|
24 |
The specifications of the male and female employment regressions are identical except that the dummy variables indicating the presence of own children in the household are never included in the male regressions. |
TABLE 7-10 Male Employment Regressions, Selected Coefficients, by Nativity and Census Year
|
Natives |
Immigrants |
|||
|
Regressor |
1980 |
1990 |
1980 |
1990 |
|
Education: |
||||
|
0–8 Years |
-.115 |
-.199 |
-.038 |
-.051 |
|
(.002) |
(.003) |
(.008) |
(.006) |
|
|
9–11 Years |
-.045 |
-.080 |
-.023 |
-.033 |
|
(.002) |
(.002) |
(.010) |
(.007) |
|
|
12 Years (reference group) |
||||
|
13–15 Years |
.008 |
.031 |
-.033 |
.013 |
|
(.002) |
(.002) |
(.009) |
(.006) |
|
|
16 or More Years |
.030 |
.052 |
-.007 |
.022 |
|
(.002) |
(.002) |
(.008) |
(.006) |
|
|
English Proficiency: |
||||
|
Speaks Only English (reference group) |
||||
|
Speaks English Very Well |
-.005 |
-.011 |
-.019 |
-.016 |
|
(.004) |
(.003) |
(.008) |
(.007) |
|
|
Speaks English Well |
-.020 |
-.025 |
-.035 |
-.031 |
|
(.006) |
(.005) |
(.009) |
(.007) |
|
|
Speaks English Not Well |
-.075 |
-.061 |
||
|
(.010) |
(.008) |
|||
|
Speaks English Not at All |
-.126 |
-.122 |
||
|
(.013) |
(.010) |
|||
|
Marital Status: |
||||
|
Never Married (reference group) |
||||
|
Married |
.119 |
.106 |
.105 |
.073 |
|
(.002) |
(.002) |
(.008) |
(.005) |
|
|
Widowed, Divorced, or Separated |
.045 |
.042 |
.057 |
.022 |
|
(.003) |
(.002) |
(.011) |
(.008) |
|
|
Note: These coefficients are from the same employment regression reported in column (3) of Table 7-9; see the note to that table for more information. Standard errors are shown in parentheses. For natives, the English proficiency categories representing bilinguals who speak English "well," "not well," or "not at all" have been collapsed into a single dummy variable. |
||||
added in columns (2) and (3), the estimates indicate that the most recent cohorts of immigrant men have slightly higher employment rates than earlier cohorts.25
The impact of assimilation on immigrant employment, however, is strikingly similar for men and women. Male employment rates shoot up 13 percentage
|
25 |
Other analyses of the labor force activity of male immigrants have found a different pattern of cohort effects (Borjas, 1992; Fry, 1996a, 1996b, 1996c). Using various indicators, ranging from census week employment or labor force participation to Fry's definition of long-term idleness (not currently enrolled in school and jobless for at least the past 15 months), these studies report lower activity among more recent cohorts. Nevertheless, the estimated differences across cohorts of male immigrants are quite small, especially when compared with the much larger employment differences across cohorts of female immigrants that we report here. |
points after five years of U.S. residence and change relatively little thereafter. Figure 7-2 displays predicted employment profiles for immigrant men that strongly resemble those for immigrant women. After an initial period of adjustment, immigrant employment rates follow the same age path as native employment rates.
To investigate employment differences across national origin groups in a broad yet informative fashion, we repeated this analysis separately for immigrants from five major racial-ethnic categories: non-Hispanic white, non-Hispanic black, non-Hispanic Asian, Mexican, and other Hispanic.26 The regressions for particular immigrant groups are much less precisely estimated than the previous regressions for all immigrants combined. As a result, many of the differences across arrival cohorts or duration of U.S. residence intervals are no longer statistically significant. Nonetheless, the basic patterns within and across ethnic groups are of some interest, and we briefly describe these results below.
In general, the patterns noted above for all immigrants combined are also evident within ethnic groups. For example, women and men of every immigrant group experience a sizable burst in labor market activity following the initial five years of U.S. residence. In addition, all groups of female immigrants exhibit employment declines for more recent arrival cohorts, although the usual ordering of employment rates across cohorts is reversed for blacks and Asians when extensive control variables are introduced.
In Figures 7-3 and 7-4, we present the patterns for immigrants from the most important country of origin, Mexico, for females and males. The organization of the figures is the same as for Figures 7-1 and 7-2—we use the specification with limited controls in the top panel and the specification with extensive controls in the bottom panel. The lower employment rates during the first five years in the United States is evident for females, although there is a predicted drop in employment rates as age increases above 40. The lower employment rates of more recent cohorts for females have been especially large for Mexican and other Hispanic immigrants. The employment rates of the 1950s arrivals exceed those of the 1980s arrivals at the same point in the U.S. experience profile by as much as 20 percentage points. The comparison of these two panels for females reveals that much of this difference is due to differences across arrival cohorts in observable characteristics.
|
26 |
So that it is easy to compare results across these groups, the same native sample—non-Hispanic whites—was used in all regressions. We now employ the full 5 percent sample for each of the immigrant groups, and we use a 0.1 percent sample of non-Hispanic white natives. Because the 1980 Census does not report when they arrived in this country, immigrants born in outlying areas of the United States (including Puerto Rico) are excluded. |
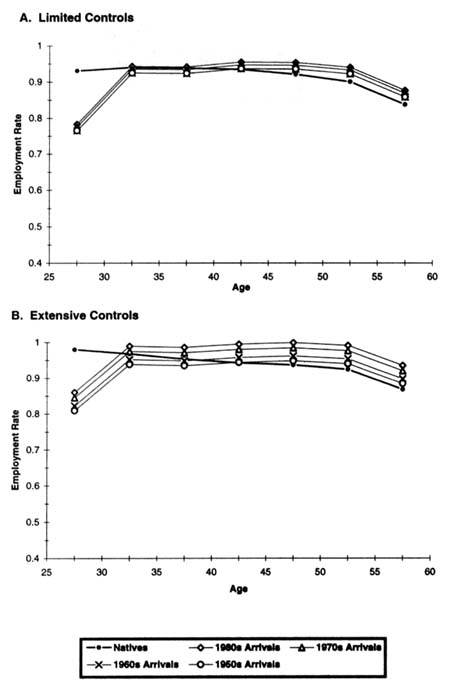
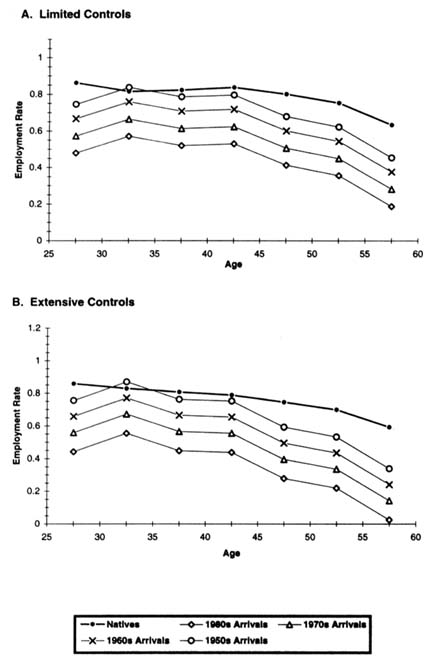
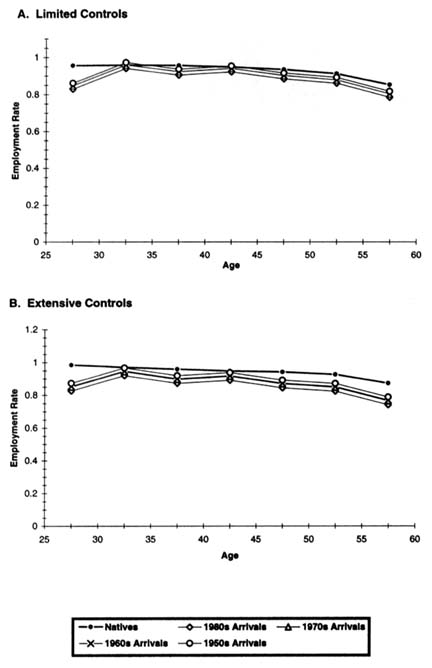
For immigrant men, intercohort employment differences are small among Asians, Mexicans, and other Hispanics, whereas recent cohorts of white and black immigrants are more likely to work than their predecessors. The patterns for Mexicans, shown in Figure 7-4, show significantly lower employment rates during the first five years of U.S. experience. These assimilation patterns are very similar for the lines representing each arrival cohort. In contrast to the patterns for females, there is not much difference in the cohort effects between the two panels.
HOURLY EARNING REGRESSIONS
We now analyze the hourly wages of female immigrants using the same approach that guided the employment analysis in the preceding section. The dependent variable is the natural logarithm of average hourly earnings in the calendar year preceding the census. Only women with positive earnings are included in the sample.
Tables 7-11 and 7-12 present log wage regressions with the same independent variables as the female employment regressions, except that specification (3) no longer includes the children dummies as control variables. Once again, the coefficients were estimated by least squares, with sampling weights used in the regressions.27 These regressions pool immigrants from all ethnic groups, using the same sampling proportions as before (see footnote 19).
The predicted wage profiles in Figure 7-5 summarize the regression results. The top panel of the figure, in which the only controls are for census division and metropolitan status (i.e., specification (1) in Table 7-11), shows lower wages for female immigrants arriving in the 1970s and 1980s. The coefficients on the duration of U.S. residence dummies suggest that wage growth that is due to assimilation emerges after ten years of U.S. experience, and subsequent wage growth of this kind allows foreign-born women to erase some of their initial wage disadvantage relative to U.S.-born women. Nonetheless, even at the end of their careers immigrant women from all arrival cohorts are estimated to earn less than native women, with final wage gaps ranging from about 8 percent for pre-1970 arrivals to 20 percent for 1980s arrivals. Column (1) of Table 7-11 indicates that the wage deficit is particularly large for the most recent immigrants, the 1985–1989 arrivals.
The bottom panel of Figure 7-5 shows that the additional variables included in specification (3) of Table 7-11—ethnicity, education, English proficiency, and marital status—explain why foreign-born women earn less than U.S.-born
|
27 |
Selective labor force participation can bias least-squares estimates of wage equations for women. To correct for this sample selection problem, we employed the two-step procedure developed by Heckman (1979). In implementing Heckman's procedure, we assumed that the presence of children influences the employment decision but does not affect wages conditional on employment. The pattern of immigrant cohort and assimilation effects estimated with the selection correction is similar to what we get using least squares, so only the least-squares estimates are reported here. |
TABLE 7-11 Female Wage Regressions, Immigrant Cohort and Assimilation Effects and Period Effects
|
Regressor |
(1) |
(2) |
(3) |
|
Immigrant Cohort: |
|||
|
1985–89 Arrivals |
-.256 |
-.127 |
-.063 |
|
(.017) |
(.020) |
(.026) |
|
|
1980–84 Arrivals |
-.190 |
-.056 |
-.007 |
|
(.052) |
(.053) |
(.053) |
|
|
1975–79 Arrivals |
-.189 |
-.138 |
-.051 |
|
(.021) |
(.025) |
(.032) |
|
|
1970–74 Arrivals |
-.117 |
-.059 |
-.005 |
|
(.049) |
(.051) |
(.053) |
|
|
1965–69 Arrivals |
-.113 |
-.141 |
-.050 |
|
(.044) |
(.054) |
(.068) |
|
|
1960–64 Arrivals |
-.095 |
-.129 |
-.054 |
|
(.052) |
(.062) |
(.073) |
|
|
1950–59 Arrivals |
-.106 |
-.234 |
-.116 |
|
(.071) |
(.086) |
(.107) |
|
|
Born in Outlying Area of U.S. |
-.082 |
.094 |
.113 |
|
(.020) |
(.042) |
(.042) |
|
|
Duration of U.S. Residence: |
|||
|
0–5 Years (reference group) |
|||
|
6–10 Years |
.006 |
.022 |
.041 |
|
(.049) |
(.049) |
(.047) |
|
|
11–15 Years |
.091 |
.188 |
.151 |
|
(.028) |
(.035) |
(.042) |
|
|
16–20 Years |
.079 |
.184 |
.148 |
|
(.048) |
(.053) |
(.057) |
|
|
21–30 Years |
.162 |
.335 |
.239 |
|
(.054) |
(.067) |
(.081) |
|
|
31–40 Years |
.190 |
.414 |
.275 |
women. After controlling for these variables, wage differences among post-1960 immigrant cohorts shrink dramatically, and immigrants from these cohorts earn about as much as natives during their initial ten years in the United States and more than natives after labor market assimilation takes place. Female immigrants who arrived during the 1950s stand out as having the lowest wages of any cohort.28
|
28 |
The low unobserved skills of the 1950–1959 cohort compared with the 1960s arrivals may explain why Long's (1980) cross-sectional analysis of 1970 Census data led him to conclude that the earnings of married female immigrants decrease rather than increase with duration of U.S. residence. Because over the relevant time period immigrant wages were rising across arrival cohorts, cross-sectional estimates of the impact of U.S. experience would be biased downward by the omitted cohort effects. Log wage equations for immigrant women estimated on the 1980 and 1990 Census cross-sections show the more familiar pattern of higher wages for earlier cohorts, which is consistent with the switch to wage declines across cohorts that took place for immigrants arriving after 1960. |
|
Regressor |
(1) |
(2) |
(3) |
|
(.088) |
(.105) |
(.124) |
|
|
1990 Census Dummy |
.451 |
.456 |
.387 |
|
(.010) |
(.010) |
(.011) |
|
|
R2 |
.203 |
.208 |
.299 |
|
Other Controls: |
|||
|
Census Division and Metropolitan Status |
Yes |
Yes |
Yes |
|
Age |
Yes |
Yes |
Yes |
|
Ethnicity |
No |
Yes |
Yes |
|
Educational Attainment |
No |
No |
Yes |
|
English Proficiency |
No |
No |
Yes |
|
Marital Status |
No |
No |
Yes |
|
Note: The dependent variable is the natural logarithm of average hourly earnings in the calendar year preceding the Census. The coefficients were estimated by least squares, with standard errors shown in parentheses. Sampling weights were used in the regressions. Data are from the 1980 and 1990 Censuses. The sample includes women aged 25–59 with positive earnings in the calendar year preceding the Census. Excluded are any immigrants who may have been younger than age 15 when they first arrived in the United States. The total sample size is 276,776 observations: 70,632 immigrants and 206,144 natives. The effects of Census division and metropolitan status are restricted to be the same for immigrants and natives, but these effects can differ in 1980 and 1990. The effects of all other control variables are allowed to vary both by nativity and Census year. |
|||
Comparing the cohort coefficients in columns (1) and (2) of Table 7-11, we see that controlling for immigrant ethnicity shakes up the pattern of wage differences across arrival cohorts, but overall these wage differences do not narrow substantially. Similar results were obtained using the more detailed birthplace dummies (described previously in footnote 21) in place of the immigrant ethnicity dummies. It is adding the controls for education, English proficiency, and marital status in column (3) that compresses wage differences among immigrant cohorts arriving after 1960.
Table 7-12 reports the estimated coefficients of the additional variables included in the third specification. For both immigrants and natives, the returns to education and English proficiency increased during the 1980s. Over the same decade, the marriage penalty vanished for foreign-born women and came close to doing so for U.S.-born women. Finally, the returns to education are lower for immigrants than for natives. These findings for wages echo the patterns described above for employment, and the explanations proposed for employment are likely to apply here as well.
Tables 7-13 and 7-14 present the coefficients from comparable wage regressions for men, and Figure 7-6 displays predicted wage profiles from these regressions. The estimates reported in column (1) of Table 7-13 and graphed in the top panel of Figure 7-6 reproduce the familiar earnings decline for successive cohorts
TABLE 7-12 Female Wage Regressions, Selected Coefficients, by Nativity and Census Year
|
Natives |
Immigrants |
|||
|
Regressor |
1980 |
1990 |
1980 |
1990 |
|
Education: |
||||
|
0–8 Years |
-.184 |
-.184 |
-.083 |
-.080 |
|
(.008) |
(.012) |
(.021) |
(.017) |
|
|
9–11 Years |
-.121 |
-.174 |
-.063 |
-.075 |
|
(.006) |
(.006) |
(.025) |
(.021) |
|
|
12 Years (reference group) |
||||
|
13–15 Years |
.127 |
.181 |
.131 |
.160 |
|
(.005) |
(.004) |
(.021) |
(.015) |
|
|
16 or More Years |
.425 |
.519 |
.360 |
.434 |
|
(.005) |
(.004) |
(.022) |
(.015) |
|
|
English Proficiency: |
||||
|
Speaks Only English (reference group) |
||||
|
Speaks English Very Well |
.010 |
.002 |
.013 |
-.005 |
|
(.010) |
(.008) |
(.022) |
(.016) |
|
|
Speaks English Well |
.009 |
-.031 |
-.039 |
-.092 |
|
(.017) |
(.015) |
(.023) |
(.018) |
|
|
Speaks English Not Well |
-.097 |
-.175 |
||
|
(.027) |
(.021) |
|||
|
Speaks English Not at All |
-.131 |
-.216 |
||
|
(.036) |
(.028) |
|||
|
Marital Status: |
||||
|
Never Married (reference group) |
||||
|
Married |
-.068 |
-.029 |
-.068 |
.001 |
|
(.006) |
(.004) |
(.022) |
(.016) |
|
|
Widowed, Divorced, or Separated |
-.026 |
.002 |
-.042 |
-.006 |
|
(.006) |
(.005) |
(.026) |
(.019) |
|
|
Note: These coefficients are from the same hourly earnings regression reported in column (3) of Table 7-11; see the note to that table for more information. Standard errors are shown in parentheses. For natives, the English proficiency categories representing bilinguals who speak English ''well," "not well," or "not at all" have been collapsed into a single dummy variable. |
||||
of male immigrants (Borjas, 1994, 1995). Note that the magnitude of the earnings decline is broadly similar for women and men: the estimates in column (1) of Table 7-11 indicate that the relative wages of immigrant women fell 15 percent between the 1950–1959 and 1985–1989 arrival cohorts, whereas in Table 7-13 the corresponding wage decline for immigrant men is 18 percent. Controlling for ethnicity reverses the direction of the cohort wage effects for men, a finding which attests to the powerful link between immigrant skill changes and the dramatic shifts in the national origin composition of U.S. immigration flows that have occurred during the postwar period (Borjas, 1992; LaLonde and Topel, 1992).
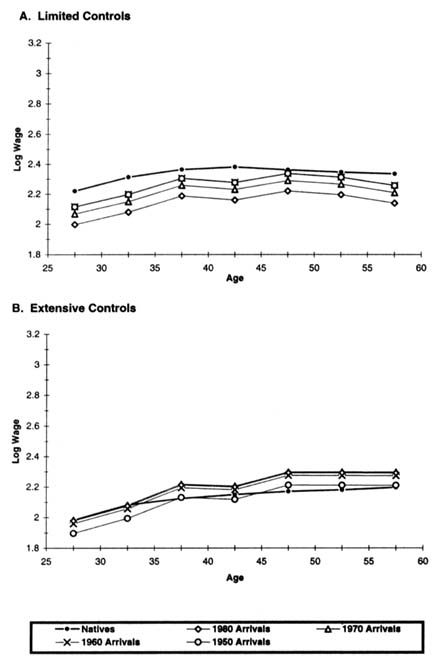
TABLE 7-13 Male Wage Regressions, Immigrant Cohort and Assimilation Effects and Period Effects
|
Regressor |
(1) |
(2) |
(3) |
|
Immigrant Cohort: |
|||
|
1985–89 Arrival |
-.286 |
-.007 |
.105 |
|
(.014) |
(.017) |
(.021) |
|
|
1980–84 Arrivals |
-.272 |
.019 |
.155 |
|
(.047) |
(.048) |
(.048) |
|
|
1975–79 Arrivals |
-.256 |
-.118 |
.034 |
|
(.017) |
(.021) |
(.028) |
|
|
1970–74 Arrivals |
-.195 |
-.033 |
.112 |
|
(.045) |
(.046) |
(.049) |
|
|
1965–69 Arrivals |
-.182 |
-.212 |
-.031 |
|
(.037) |
(.046) |
(.059) |
|
|
1960–64 Arrivals |
-.084 |
-.126 |
.025 |
|
(.046) |
(.054) |
(.065) |
|
|
1950–59 Arrivals |
-.102 |
-.351 |
-.151 |
|
(.060) |
(.073) |
(.093) |
|
|
Born in Outlying Area of U.S. |
-.210 |
.095 |
.195 |
|
(.016) |
(.035) |
(.035) |
|
|
Duration of U.S. Residence: |
|||
|
0–5 Years (reference group) |
|||
|
6–10 Years |
.035 |
.052 |
.037$D |
|
(.045) |
(.045) |
(.043) |
|
|
11–15 Years |
.124 |
.312 |
.247$D |
|
(.023) |
(.029) |
(.035) |
|
|
16–20 Years |
.135 |
.329 |
.251$D |
|
(.044) |
(.047) |
(.051) |
|
|
21–30 Years |
.220 |
.574 |
.440$D |
|
(.045) |
(.057) |
(.070) |
|
|
31–40 Years |
.243 |
.753 |
.582$D |
|
(.077) |
(.091) |
(.109) |
|
|
1990 Census Dummy |
.358 |
.369 |
.390$D |
|
(.009) |
(.009) |
(.010) |
|
Finally, we briefly discuss results from wage regressions estimated separately for immigrants from the major racial-ethnic groups. For both women and men, white and Asian immigrants have wage profiles similar to those of U.S.-born workers. As in the case of employment, we present a separate figure for Mexican wage profiles in Figures 7-7 and 7-8. In contrast to some other groups, Mexicans stand out with a very pronounced pattern of lower wages for more recent immigrant cohorts, even after controlling for observable characteristics. Moreover, wages do not grow for Mexican immigrants as they acquire experience living and working in the United States, which results in huge wage deficits relative to natives for Mexicans from all age and duration of U.S. residence groups. Previous studies have documented these patterns for Mexican men (Smith, 1991; Borjas, 1995; Schoeni, 1996a), and our analyses indicate that labor market outcomes are similar for Mexican women.
|
Regressor |
(1) |
(2) |
(3) |
|
R2 |
.190 |
.206 |
.286 |
|
Other Controls: |
|||
|
Census Division and Metropolitan Status |
Yes |
Yes |
Yes |
|
Age |
Yes |
Yes |
Yes |
|
Ethnicity |
No |
Yes |
Yes |
|
Educational Attainment |
No |
No |
Yes |
|
English Proficiency |
No |
No |
Yes |
|
Marital Status |
No |
No |
Yes |
|
Note: The dependent variable is the natural logarithm of average hourly earnings in the calendar year preceding the Census. The coefficients were estimated by least squares, with standard errors shown in parentheses. Sampling weights were used in the regressions. Data are from the 1980 and 1990 Censuses. The sample includes men aged 25–59 with positive earnings in the calendar year preceding the Census. Excluded are any immigrants who may have been younger than age 15 when they first arrived in the United States. The total sample size is 350,074 observations: 94,792 immigrants and 255,282 natives. The effects of Census division and metropolitan status are restricted to be the same for immigrants and natives, but these effects can differ in 1980 and 1990. The effects of all other control variables are allowed to vary both by nativity and Census year. |
|||
CONCLUSION
In this concluding section, we summarize our findings about the employment and wages of female immigrants and place these findings in the context of other studies that compare labor market outcomes across immigrant arrival cohorts and track changes experienced by cohorts as they adapt to life in the United States. Existing empirical research of this type focuses almost exclusively on male immigrants.
Broadly speaking, the employment and wages of foreign-born women exhibit the same pattern of decline across arrival cohorts that has been uncovered for immigrant men, but some important differences emerge. For women, the pattern of cohort decline is particularly strong for employment, with steady reductions in the employment rate of successive immigrant cohorts arriving after 1970. This basic trend shows up for female immigrants from every ethnic group that we examine, and the drop in labor market activity is particularly severe for women from Mexico. Shifts in the national origin composition of immigrant flows to the United States account for roughly a third of the employment decline between pre-1970 and post-1980 cohorts of female immigrants, and remaining cohort differences are largely explained by variables such as education, English proficiency, marital status, and fertility. Even with extensive control variables, however, the employment rate of the 1980s arrivals remains well below that of earlier immigrants. Finally, after an initial period of adjustment to the United States, female immigrants who arrived before 1970 are only slightly less likely to
TABLE 7-14 Male Wage Regressions, Selected Coefficients, by Nativity and Census Year
|
Natives |
Immigrants |
|||
|
Regressor |
1980 |
1990 |
1980 |
1990 |
|
Education: |
||||
|
0–8 Years |
-.226 |
-.221 |
-.082 |
-.122 |
|
(.006) |
(.008) |
(.019) |
(.014) |
|
|
9–11 Years |
-.102 |
-.151 |
-.040 |
-.076 |
|
(.005) |
(.005) |
(.023) |
(.018) |
|
|
12 Years (reference group) |
||||
|
13–15 Years |
.069 |
.114 |
.071 |
.095 |
|
(.004) |
(.003) |
(.020) |
(.014) |
|
|
16 or More Years |
.277 |
.407 |
.363 |
.400 |
|
(.004) |
(.004) |
(.019) |
(.014) |
|
|
English Proficiency: |
||||
|
Speaks Only English (reference group) |
||||
|
Speaks English Very Well |
-.041 |
-.025 |
-.063 |
-.080 |
|
(.008) |
(.008) |
(.019) |
(.015) |
|
|
Speaks English Well |
-.079 |
-.043 |
-.136 |
-.144 |
|
(.014) |
(.013) |
(.020) |
(.016) |
|
|
Speaks English Not Well |
-.238 |
-.250 |
||
|
(.024) |
(.018) |
|||
|
Speaks English Not at All |
-.333 |
-.326 |
||
|
(.033) |
(.024) |
|||
|
Marital Status: |
||||
|
Never Married (reference group) |
||||
|
Married |
.255 |
.237 |
.161 |
.148 |
|
(.005) |
(.004) |
(.019) |
(.013) |
|
|
Widowed, Divorced |
.140 |
.080 |
.081 |
.030 |
|
or Separated |
(.006) |
(.005) |
(.028) |
(.019) |
|
Note: These coefficients are from the same hourly earnings regression reported in column (3) of Table 7-13; see the note to that table for more information. Standard errors are shown in parentheses. For natives, the English proficiency categories representing bilinguals who speak English "well," "not well," or ''not at all" have been collapsed into a single dummy variable. |
||||
work than native women, whereas more recent immigrants display much lower levels of labor market attachment.
For immigrant men, studies by Borjas (1992) and Fry (1996a, 1996b, 1996c) use census data to analyze differences in labor force activity across arrival cohorts, and these authors report a tendency for lower activity among more recent cohorts. The estimated differences across cohorts of male immigrants are quite small, however, especially when compared with the much larger employment differences observed across cohorts of female immigrants. Indeed, the employment regressions for men that we report here imply negligible cohort differen-
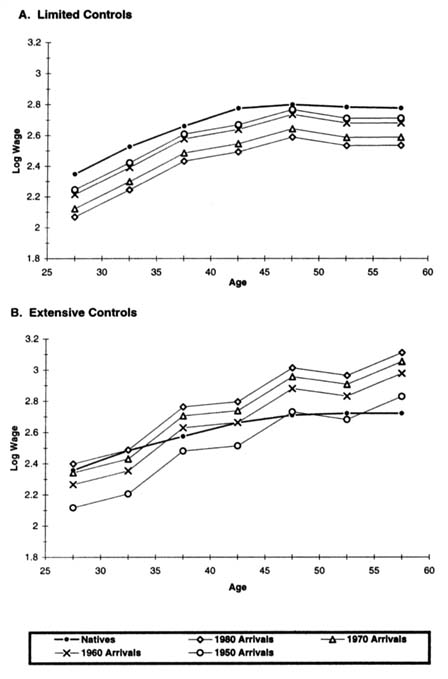
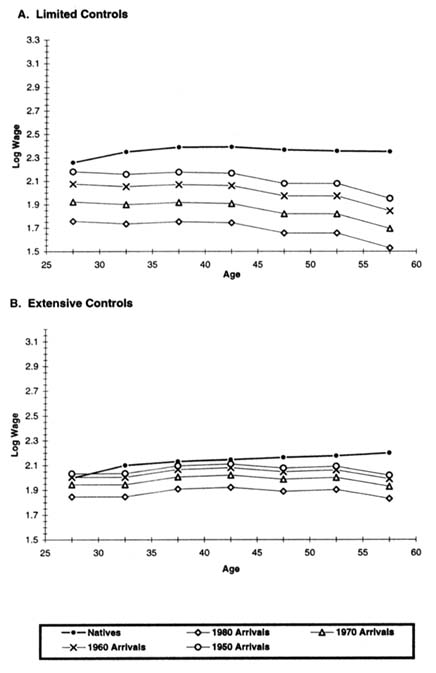
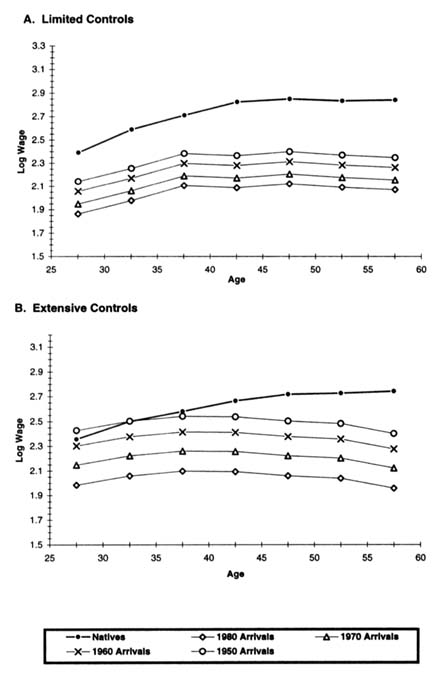
tials. Our reading of the available evidence is that a strong pattern of lower employment rates for more recent immigrant arrival cohorts exists only for women and not for men.
The impact of assimilation on immigrant employment, however, is strikingly similar for men and women. Regardless of gender, employment rates rise sharply—on the order of 10 percentage points—as the foreign born pass from their initial five years of U.S. residence to the next five years, and thereafter employment rates change relatively little with further exposure to America. 29 Except during this period of adjustment, immigrant employment rates follow a similar age path as native employment rates.
A growing body of evidence indicates that recent cohorts of foreign-born men have lower wage profiles than earlier cohorts.30 Our analysis of hourly earnings reveals a similar pattern of cohort decline for the wages of immigrant women. The magnitude of this wage decline does not appear to differ much by gender, with our own estimates indicating that the hourly earnings of immigrants (relative to natives) fell by 15 percent for women and 18 percent for men between the 1950 –1959 and 1985–1989 arrival cohorts. For Mexican immigrants, in particular, the same story describes male and female earnings: sharply declining wages across arrival cohorts, large wage deficits relative to native workers, and little indication that immigrants erase much of this wage gap over their lifetimes. Previous studies have documented these patterns for Mexican men (Smith, 1991; Borjas, 1995; Schoeni, 1996a), and we find similar patterns for Mexican women.
The source of the wage decline across immigrant arrival cohorts, however, may differ for men and women. Specifically, shifts in the national origins of U.S. immigration flows can account for the diminished earning capacity of more recent male immigrant cohorts, whereas these shifts play a relatively minor role in explaining the earnings changes observed for female immigrant cohorts. Instead, wage differences across arrival cohorts of foreign-born women are more closely related to human capital variables such as education, English proficiency, and martial status. After controlling for these variables, wage differences among post-1960 cohorts of female immigrants shrink dramatically, and these immigrants earn about as much as native women during their initial ten years in the United States and more than natives after labor market assimilation takes place.
Overall, our analysis indicates that the empirical techniques that have revolutionized research on the labor market outcomes of foreign-born men can also provide insight into the experiences of female immigrants to the United States. Many of the same patterns arise for men and women, along with some interesting
|
29 |
Schoeni (1996b), for women, and Chiswick et al. (1997), for men, report patterns of immigrant labor force assimilation consistent with what we find. |
|
30 |
Borjas (1994) surveys this literature. |
differences, and both the similarities and the differences invite further study. In particular, theoretical and empirical models that emphasize the family context of migration decisions (Mincer, 1978; Borjas and Bronars, 1991) have the potential to advance our understanding of immigrant selectivity and adaptation.
REFERENCES
Baker, Michael, and Dwayne Benjamin 1997. "The Role of Family in Immigrants' Labor Market Activity: An Evaluation of Alternative Explanations." American Economic Review 87(4):705–727.
Blau, Francine D. 1992. "The Fertility of Immigrant Women: Evidence from High-Fertility Source Countries." Pp. 93–133 in Immigration and the Work Force: Economic Consequences for the United States and Source Areas, George J. Borjas and Richard B. Freeman, eds. Chicago: University of Chicago Press.
Borjas, George J. 1985. "Assimilation, Changes in Cohort Quality, and the Earnings of Immigrants." Journal of Labor Economics 3(4):463–489.
Borjas, George J. 1987. "Self-Selection and the Earnings of Immigrants." American Economic Review 77 (4):531–553.
Borjas, George J. 1992. "National Origin and the Skills of Immigrants in the Postwar Period" Pp. 17–47 in Immigration and the Work Force: Economic Consequences for the United States and Source Areas, George J. Borjas and Richard B. Freeman, eds. Chicago: University of Chicago Press.
Borjas, George J. 1994. "The Economics of Immigration." Journal of Economic Literature 32(4):1667–1717.
Borjas, George J. 1995. "Assimilation and Changes in Cohort Quality Revisited: What Happened to Immigrant Earnings in the 1980s?" Journal of Labor Economics 13(2):201–245.
Borjas, George J., and Stephen G. Bronars 1991. "Immigration and the Family." Journal of Labor Economics 9(2):123–248.
Bound, John, and George Johnson 1992. "Changes in the Structure of Wages in the 1980's: An Evaluation of Alternative Explanations." American Economic Review 82(3):371–392.
Chiswick, Barry R. 1978. "The Effect of Americanization on the Earnings of Foreign-Born Men." Journal of Political Economy 86(5):897–921.
Chiswick, Barry R., Yinon Cohen, and Tzippi Zach 1997. "The Labor Market Status of Immigrants: Effects of the Unemployment Rate at Arrival and Duration of Residence." Industrial and Labor Relations Review 50(2):289–303.
Friedberg, Rachel M. 1991. "The Labor Market Assimilation of Immigrants in the United States: The Role of Age at Arrival." Boston: Massachusetts Institute of Technology.
Fry, Richard 1996a. "Has the Quality of Immigrants Declined? Evidence from the Labor Market Attachment of Immigrants." Contemporary Economic Policy 14(3):53–70.
Fry, Richard 1996b. What Explains the Decline in the Relative Employment of Immigrants? Washington, D.C.: U.S. Department of Labor.
Fry, Richard 1996c. The Increase in Idleness of Immigrant Arrivals: The Role of Age at Arrival, Refugees, and Country of Origin. Washington, D.C.: U.S. Department of Labor.
Goldin, Claudia 1990. Understanding the Gender Gap: An Economic History of American Women. New York: Oxford University Press.
Heckman, James J. 1979. "Sample Selection Bias as a Specification Error." Econometrica 47(1):153–261.
Jaeger, David A. 1997. "Reconciling the Old and New Census Bureau Education Questions: Recommendations for Researchers." Journal of Business and Economics Statistics 15(3).
Jasso, Guillermina, and Mark R. Rosenzweig 1986. "What's in a Name? Country-of-Origin Influences on the Earnings of Immigrants in the United States." Pp. 75–106 in Research in Human Capital and Development, Vol. 4, Oded Stark, ed. Greenwich, Conn.: JAI Press.
Juhn, Chinhui, Kevin M. Murphy, and Brooks Pierce 1993. "Wage Inequality and the Rise in Returns to Skill." Journal of Political Economy 101(3):410–442.
Kossoudji, Sherrie A. 1989. "Immigrant Worker Assimilation: Is It a Labor Market Phenomenon?" Journal of Human Resources 24(3):494–527.
LaLonde, Robert J., and Robert H. Topel 1992. "The Assimilation of Immigrants in the U.S. Labor Market." Pp. 67–92 in Immigration and the Work Force: Economic Consequences for the United States and Source Areas, George J. Borjas and Richard B. Freeman, eds. Chicago: University of Chicago Press.
Long, James E. 1980. "The Effect of Americanization on Earnings: Some Evidence for Women." Journal of Political Economy 88(3):620–629.
Mincer, Jacob 1978. "Family Migration Decisions." Journal of Political Economy 86(5):749–773.
Murphy, Kevin M., and Finis Welch 1992. "The Structure of Wages." Quarterly Journal of Economics 107(1):285–326.
Passel, Jeffrey S., and Barry Edmonston 1994. "Immigration and Race: Recent Trends in Immigration to the United States." Pp. 31–71 in Barry Edmonston and Jeffrey S. Passell, eds., Immigration and Ethnicity: The Integration of America's Newest Arrivals. Washington, D.C.: The Urban Institute Press.
Reimers, Cordelia W. 1996. "The Progress of Mexican and White Non-Hispanic Immigrants in California and Texas, 1980 to 1990." Unpublished manuscript, Hunter College, New York.
Schoeni, Robert F. 1996a. "New Evidence on the Economic Progress of Immigrant Men in the 1970s and 1980s." Unpublished manuscript, The RAND Corporation, Santa Monica, Calif.
Schoeni, Robert F. 1996b. "Labor Market Assimilation of Immigrant Women." Unpublished manuscript, The RAND Corporation, Santa Monica, Calif.
Smith, James P. 1991. "Hispanics and the American Dream: An Analysis of Hispanic Male Labor Market Wages 1940–1980." Manuscript, The RAND Corporation, Santa Monica, Calif.
Smith, James P., and Michael P. Ward 1985. "Time-Series Growth in the Female Labor Force." Journal of Labor Economics 3(1, pt. 2):S59–S90.


