
10
The Impact of Recent Immigration on Population Redistribution within the United States
William H. Frey and Kao-Lee Liaw
INTRODUCTION
In this chapter we examine how recent immigration affects population redistribution within the United States, both directly and indirectly, by promoting a secondary domestic migration among native-born residents. Although this impact has been given less prominence in public and academic forums than recent immigration's impact on the nation as a whole, the redistributional aspects of immigration hold important local consequences for the labor force, public service costs, and minority-majority relations. Even from a national perspective, the concentrated distribution of the recent foreign-born immigrant population in comparison with the longer-term resident native-born portends widening demographic disparities across broad regions of the country with respect to race-ethnic composition, race-class structures, and age profiles.
Our research to date on these issues suggests that these kinds of divisions may be emerging from the following: (1) most recent immigrants still locate in a small number of traditional port-of-entry states and metropolitan areas; (2) greatest domestic native-born migrant gains occur in different areas than those attracting recent immigrants; and (3) evidence of a unique, accentuated out-migration of less-skilled domestic migrants away from high-immigration areas.
Though there were hints of these patterns already at the end of the 1970s (Frey and Speare, 1988; Filer, 1992; White and Imai, 1994; Long and Nucci, 1995), these patterns are especially evident in the two five-year periods for which the most recent data are available: 1985–1990 and 1990–1995. Of the three redistribution patterns noted above, it is the latter which holds the greatest poten-
tial significance as an immigration impact. The apparent demographic displacement of domestic migrants by immigrants at the low-skilled end of the spectrum implies that a more bifurcated race-class structure may emerge in areas of high immigration if this process persists. Moreover, if the mechanism for this displacement is a labor substitution, this may explain why many earlier studies, that do not take domestic migration into explicit account, show only modest or negligible impacts of immigration on a local area's unemployment rate or wage level (see review in Borjas, 1994).
In this chapter we review evidence for the 1985–1990 and 1990–1995 periods and relevant findings from our own and others' work to assess the impacts of immigration on internal redistribution patterns in the United States. Particular attention is given to the apparent demographic displacement of less-skilled domestic migrants by new immigrants in high-immigration areas where we estimate the nature of this displacement under assumed increases or decreases in current immigration levels. In the sections that follow we provide an overview of immigration and internal migration processes over the 1985–1995 period, review findings that document the nature of selective demographic displacement in metropolitan areas and states, and present findings from a model that estimates the impact of changing immigration levels on this displacement. In the concluding section we discuss some implications of these redistributional impacts of immigration.
IMMIGRATION AND INTERNAL MIGRATION-RELATED POPULATION SHIFTS
The clustering of immigrants into areas that are not attractive destinations for domestic migrants can be illustrated by recent census statistics and estimates. Between 1985 and 1995, approximately two-thirds of all immigrant growth accrued to just ten metropolitan areas. These areas housed only 30 percent of the total U.S. 1995 population and an estimated 19 percent of the native-born non-Hispanic white population. Moreover, nine of the ten areas registered a net out-migration of internal migrants for at least some part of the 1985–1995 period. In the aggregate, these areas lost 4.5 million internal migrants, while they gained 5.3 million immigrants over the 10-year period (Frey, 1996).
Concentration of Immigrants
The concentration of immigrants in a few familiar port-of-entry areas is consistent with the nation's immigration preference statutes that favor family reunification and with earlier research that indicates that kinship ties give rise to chain migration that links family members and friends to common destinations (Massey et al., 1994; Pedraza and Rumbaut, 1996). Yet post-1965 shifts in the origin countries of U.S. immigrants toward Latin America and Asia (Immigration
and Naturalization Service, 1996) and toward widening disparities between immigrant and native skill levels (Borjas, 1994) may have increased the importance of kinship ties and, hence, the geographic concentration of immigrants. This is an implication of our analysis of 1985–1990 young adult (aged 20–34) immigrants to the United States (Liaw and Frey, 1998). We found that race-specific immigrant destination choices were most concentrated for Hispanics and least concentrated for whites, with blacks and Asians lying in between. Furthermore, within each race, demographic concentration was greatest for those with less than a high school education and tended to decrease monotonically with higher education levels. For example, 81 percent of Hispanics with less than a high school education resided in the top five states with highest concentrations, compared with 68 percent of Hispanics with college degrees. This pattern of findings is consistent with Bartel's (1989) analysis of immigrant destinations in the 1970s.
In the same paper (Liaw and Frey, 1998), we also conducted a multivariate analysis of these immigrants' destination choices. Using the destination state's racial composition similarity (to the immigrant) as a proxy for the influence of "friends and relatives," we found this factor to be more important than conventional labor market attributes in these immigrants' destination selections. This was especially the case for Hispanics and blacks and for those with a high school education or less. This finding reinforces the inference that the immigration country-of-origin patterns and skill-level profiles of recent immigrants are associated with their high geographic concentration within select destination areas.
A related issue involves the degree to which new foreign-born immigrants eventually disperse from these high-immigration states and metropolitan areas. Earlier studies suggest that the internal migration patterns of Hispanics and Asians are highly channelized, following same-race and ethnic networks and social ties (Bean and Tienda, 1987; McHugh, 1989; Pedraza and Rumbaut, 1996). Specific research on the internal migration of foreign-born or new immigrants from the 1980 Census (Bartel and Koch, 1991) or 1990 Census (Nogle, 1996) indicates that broader dispersal did not occur, especially among those with lower levels of education. This and other evidence for legalized aliens from administrative records (Newman and Tienda, 1994) suggest that the overall impact of internal migration toward reducing the concentration of recent foreign-born immigrants has been small.
Figure 10-1 provides data from the 1995 Current Population Survey (CPS) that confirms this continued concentration of recent immigrant cohorts. Displayed here are the concentration of the native-born and of specific foreign-born cohorts in the ten high-immigration metropolitan areas (listed in Table 10-1). These data show that post-1965 foreign-born immigrants are more concentrated than either the native born or pre-1965 immigrants. Moreover, among Latinos, 1965–1985 arrivals are no more dispersed than those who arrived in the past decade. Asians who arrived between 1975–1985 are no more dispersed than more recent immigrants. Both these Hispanic and Asian contrasts hold, as well, when
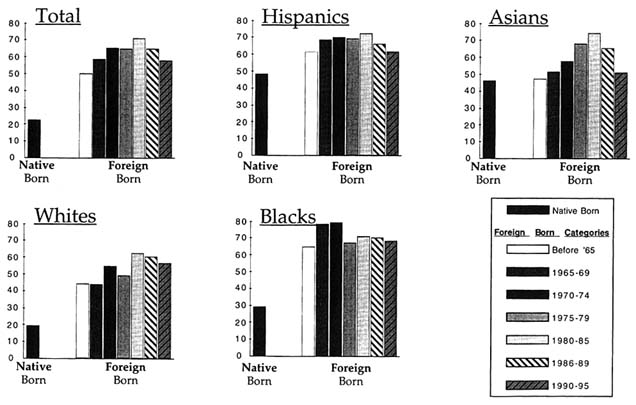
controls are included for education attainment, family income, and age (Frey, 1996). These statistics, along with the previously cited studies, suggest a continuing concentration of the recent foreign born in selected areas.
Dispersed Internal Migration
Unlike recent immigrants who are often dependent on their families and friends to integrate them into job networks in traditional port-of-entry areas, internal migrants tend to be less constrained in their destinations and are more apt to respond to labor market forces, as well as other amenities, that occasionally shift in response to economic cycles and global economic forces (Long, 1988; Gober, 1993). For most of this century, the port-of-entry areas for immigrants were also attractive employment centers for internal migrants so that these areas grew from both sources of migration. However, this was not the case in the past decade. In addition, for a variety of reasons (discussed in later sections), there is a possible immigrant push effect to consider that may be precipitating the selective out-migration of native-born less-skilled workers in high-immigration areas.
The sections below make plain that internal migrants are relocating to different states, metropolitan areas, and regions of the country than recent immigrants. These are reviewed in the context of the changing economic and amenity attractions for those geographic units.
States
During the 1985–1995 period, internal migrants were attracted to primary destinations than the traditional port-of-entry states of immigrants. It is, in fact, possible to classify states into "high-immigration states" and "high internal migration states." The former represents states that receive the largest number of immigrants but where immigration is not overwhelmed by internal migration. The latter represents states that receive the greatest number of internal migrants and where internal migration substantially dominates immigration as a component of change.
Table 10-1 presents the high-immigration states and high internal migration states as defined by the migration patterns of the 1990–1995 and 1985–1990 periods.1 High-immigration states are the same for both periods and include the port-of-entry states: California, New York, Texas, Illinois, New Jersey, and
|
1 |
In this chapter, we use the term "internal migration" to denote all within-U.S. migration and the term "domestic migration" to denote within-U.S. migration of the native-born population only. It is the latter that is of primary interest in this chapter. However, in some cases it is not possible to identify separately the native-born migrants from all internal migrants. This is the case in the analysis of 1985 –1990 and 1990–1995 trends shown in this section of the chapter. In reality, most internal migration is domestic migration, so we interpret internal migration patterns as a proxy for domestic migration patterns. |
TABLE 10-1 A Migration Classification of U.S. States for the Periods 1990–1995 and 1985–1990
|
Contribution to 1990–95 Change |
Contribution to 1985–90 Change |
||||||
|
Rank |
State |
Immigration |
Net Internal Migration |
Rank |
State |
Immigration |
Net Internal Migration |
|
HIGH IMMIGRATION STATES* — 1990–95 |
HIGH MIGRATION STATES* — 1985–90 |
||||||
|
1 |
California |
1,314,792 |
-1,531,979 |
1 |
California |
1,356,920 |
173,586 |
|
2 |
New York |
546,713 |
-1,001,379 |
2 |
New York |
550,846 |
-820,886 |
|
3 |
Texas |
355,295 |
318,840 |
3 |
Texas |
268,498 |
-331,369 |
|
4 |
Illinois |
221,926 |
-283,043 |
4 |
New Jersey |
186,510 |
-193,533 |
|
5 |
New Jersey |
184,887 |
-220,131 |
5 |
Illinois |
173,548 |
-342,144 |
|
6 |
Massachusetts |
78,527 |
-181,117 |
6 |
Massachusetts |
133,897 |
-96,732 |
|
HIGH INTERNAL MIGRATION STATES** —1990–95 |
HIGH INTERNAL MIGRATION STATES** —1985–90 |
||||||
|
1 |
Florida |
245,482 |
615,670 |
1 |
Florida |
314,039 |
1,071,682 |
|
2 |
Georgia |
39,792 |
344,574 |
2 |
Georgia |
51,419 |
302,597 |
|
3 |
Arizona |
48,302 |
291,661 |
3 |
North Carolina |
32,059 |
280,882 |
|
4 |
North Carolina |
22,359 |
269,440 |
4 |
Virginia |
90,133 |
227,872 |
|
5 |
Washington |
61,032 |
257,234 |
5 |
Washington |
67,145 |
216,270 |
|
6 |
Colorado |
27,889 |
244,969 |
6 |
Arizona |
56,518 |
216,177 |
|
7 |
Nevada |
18,447 |
227,145 |
||||
|
8 |
Tennessee |
13,241 |
217,044 |
||||
|
SOURCE: Compiled by the authors from Special 1990 US Census migrationtabulations and US Census postcensusal estimates. * States with largest immigration (excepting Florida, where internal migration substantially dominates) ** States with largest net internal migration and substantially exceeds immigration. |
|||||||
Massachusetts. The high internal migration states that attract more than 200,000 net internal migrants differ over the two five-year periods, however. (Note: Florida is included in this group because its internal migration contribution substantially exceeds its immigration contribution.)
Florida and Georgia appear at the top of this list for both periods. It is clear that the states in the South Atlantic division and Mountain and Pacific divisions are attractive to internal migrants during each period. Some Mountain states, such as Colorado, sustained declines in the late 1980s but rebounded in the early 1990s (Miller, 1994). In fact, the western states, in general, were more prominent in attracting internal migrants in the early 1990s (Spiers, 1995).
What is important from these classification schemes is that most of the high-immigration states show net out-movement for internal migrants during both periods, suggesting that employment or amenity attractions for them lie elsewhere—along with the possible "immigration push." (Migration rates for these states are depicted in Figure 10-2.) Favorable economic conditions can also attract internal migrants to these states, which was the case for California in the late 1980s and Texas in the early 1990s. In some respects, these states are mirror images of each other for these two periods. For Texas, hard times in the oil and gas industries during the late 1980s rebounded as the economy diversified in the early 1990s (Jennings, 1994). California's economy stumbled badly during the 1989–1992 recession and the early 1990s defense cutbacks (Bolton, 1993; Gabriel et al., 1995). Yet evidence discussed below suggests that some of this out-migration may also be attributed to immigration.
Metropolitan Areas
As with states, there is a fairly clear distinction between the prime destinations for recent immigrants to the United States, and those that attract internal migrants (see Table 10-2). Furthermore, the high-immigration metros constitute the same set of places for both periods of analysis, whereas the high-internal migration metros—following the patterns for states—change in accordance with geographic fluctuations in the economy.
Another parallel with the state-level analysis is that most of these high-immigration metros sustain negligible or negative net internal migration over both periods. The shift to a metropolitan-level analysis makes plain that Miami should be treated differently from the rest of Florida as its population gains are plainly dominated by immigration. Still, the net domestic migration levels tended to fluctuate across most of these areas between the late 1980s and early 1990s, in part, reflecting changing economic circumstances.
The shifts are again most dramatic for metropolitan areas in California and Texas. Los Angeles was especially hard hit during the early 1990s through a combination of recessions, defense cutbacks, and a variety of natural disasters (Center for the New West, 1996). Already losing net migrants in the late 1980s,
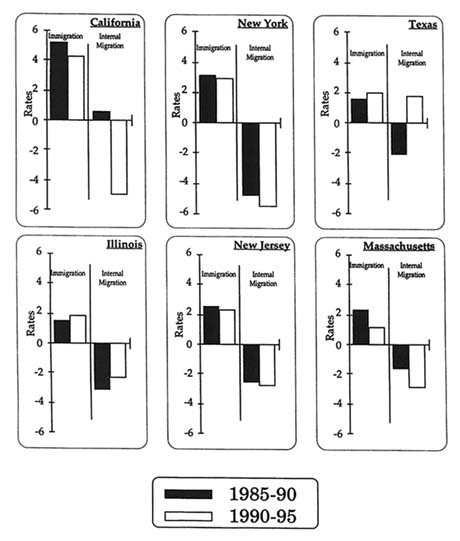
TABLE 10-2 High-Immigration Metros and High Internal Migration Metros for Periods 1990–95 and 1985–90
|
Contribution to 1990–95 Change |
Contribution to 1985–90 Change |
||||
|
Metro Area* |
Immigration |
Net Internal Migration |
Metro Area* |
Net Internal Immigration |
Migration |
|
HIGH IMMIGRATION METROS* —1990–95 |
HIGH MIGRATION METROS* —1985–90 |
||||
|
Los Angeles CMSA |
792,712 |
-1,095,455 |
Los Angeles CMSA |
842,675 |
-174,673 |
|
New York CMSA |
705,939 |
-1,113,924 |
New York CMSA |
714,346 |
-1,058,078 |
|
San Francisco CMSA |
262,519 |
-260,961 |
San Francisco CMSA |
262,185 |
-103,498 |
|
Chicago CMSA |
216,309 |
-279,763 |
Miami CMSA |
194,491 |
45,287 |
|
Miami CMSA |
157,059 |
-4,631 |
Washington DC CMSA |
163,696 |
103,616 |
|
Washington DC CMSA |
125,479 |
-91,643 |
Chicago CMSA |
160,760 |
-285,204 |
|
Houston CMSA |
110,323 |
45,017 |
Boston NECMA |
123,958 |
-75,331 |
|
San Diego CMSA |
85,025 |
-140,591 |
San Diego MSA |
96,350 |
126,855 |
|
Boston CMSA |
74,316 |
-165,822 |
Houston CMSA |
82,964 |
-142,562 |
|
Dallas CMSA |
72,246 |
75,978 |
Dallas CMSA |
63,289 |
37,925 |
|
HIGH INTERNAL MIGRATION METROS**—1990–95 |
HIGH INTERNAL MIGRATION METROS** — 1985–90 |
||||
|
Atlanta MSA |
32,391 |
259,094 |
Atlanta MSA |
31,799 |
205,010 |
|
Las Vegas MSA |
12,501 |
211,536 |
Seattle CMSA |
46,886 |
183,820 |
|
Phoenix MSA |
27,516 |
165,760 |
Tampa MSA |
23,905 |
159,112 |
|
Portland MSA |
22,618 |
128,878 |
Orlando MSA |
27,842 |
154,520 |
|
Denver MSA |
22,360 |
118,696 |
Las Vegas MSA |
14,979 |
152,197 |
|
Seattle MSA |
42,617 |
89,347 |
Phoenix MSA |
33,789 |
145,226 |
|
Austin MSA |
10,253 |
86,696 |
Sacramento CMSA |
28,366 |
117,732 |
|
Raleigh MSA |
6,175 |
86,016 |
West Palm Beach MSA |
17,993 |
107,940 |
|
Orlando MSA |
16,675 |
80,685 |
Portland CMSA |
22,939 |
73,294 |
|
Tampa MSA |
18,297 |
77,650 |
Raleigh MSA |
9,824 |
72,390 |
|
West Palm Beach MSA |
18,899 |
74,903 |
Charlotte MSA |
5,859 |
66,961 |
|
Charlotte MSA |
6,214 |
69,198 |
Daytona Beach MSA |
4,088 |
66,773 |
|
Nashville MSA |
5,096 |
63,592 |
Norfolk MSA |
12,868 |
60,704 |
|
SOURCE: Compiled by the authors from Special 1990 US Census migrationtabulations and US Census postcensusal estimates. * The metropolitan area definitions are consistent with Office of Management and Budget definitions of CMSAs, MSAs and NECMA counterparts of June 30, 1995. Official names are abbreviated. |
|||||
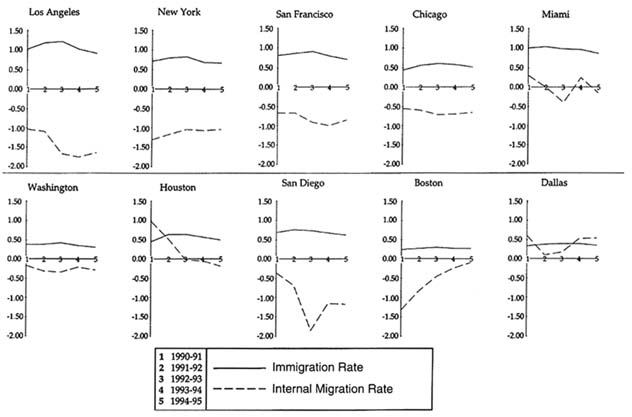
this pattern accelerated during the 1992–1995 period (see Figure 10-3). San Diego, the single high-immigration metro that grew substantially from internal migration over the late 1980s, was affected by substantial employment losses, leading to a sharp reversal in its domestic migration. San Francisco was somewhat less affected than the Southern California metros but still exhibited higher domestic migration losses in the early 1990s.
Of the two Texas high-immigration metros, Houston displayed the greatest domestic migration reversal. Partially affected by the petroleum-related declines of the late 1980s, its economy rebounded in the early 1990s, leading to domestic migration gains over the first three years of the decade (see Figure 10-3). Dallas, which receives the lowest number or immigrants of the high-immigration metros, showed more consistent domestic migration gains over the late 1980s and early 1990s. Its more diversified economic base was able to weather the late 1980s economic downturns which more severely affected Houston.
All of the other high-immigration metros showed a negative domestic net migration over the early 1990s. New York and Chicago, the two largest non-California ports of entry, showed consistently high net out-migration levels over levels over the 1985–1995 period. Miami's modest domestic gains of the late 1980s turned to losses for part of the early 1990s, whereas Washington, D.C. sustained more consistent although modest losses over the 1990–1995 period. Finally, Boston's domestic net out-migration was most pronounced in the first years of the 1990s, reflecting the area's declines in employment opportunities.
Although it is clear that the trends in domestic migration for the high-immigration metros are shaped by changing economic circumstances imposed by recessions and industry-specific growth patterns, the most dominant of these areas (Los Angeles, New York, San Francisco, Chicago) show a consistent net out-migration compared with other parts of the United States over the 1985–1995 period; and the rest (with the exception of San Diego prior to the 1990s defense cutbacks) display fluctuating levels of either declines or modest gains. These patterns suggest the possibility that immigration itself may exert some impact on domestic migration patterns, regardless of the current economic conditions.
Consistent with the late 1980s to early 1990s regional fluctuations discussed above, most of the high internal migration metros differ across each of these periods. (These are defined as metros with greatest numerical net internal migration gains over the period, where internal migration substantially dominates immigration as a component of population growth.)2 The ascendancy of the non-California Pacific and Mountain division metros is apparent from the improved rankings of Las Vegas, Phoenix, and Portland, as well as the new inclusion of
|
2 |
Although there are very few cases in which metro areas are gaining large numbers from both net internal migration and immigration, this is the case for San Diego in 1985–1990 and for Dallas in 1990–1995. They both are classed as high-immigration metros because net internal migration does not substantially dominate the immigration component. |
Denver on the 1990–1995 list (Table 10-2). This, in part, reflects the re-emergence of this region due to the wider dissemination of industries involved with computers, telecommunications, and entertainment/recreation (Labich, 1994). It also explains the inclusion of Austin as the single Texas area classed as a high internal migration metro. Despite the resurgence of these Western and South-western areas, South Atlantic division metros continue to attract internal migrants from other parts of the country. Atlanta continues to gain the largest number of internal migrants of any metro in the United States. Similarly, the metros in North Carolina (Raleigh and Charlotte), Florida (Orlando, Tampa, and West Palm Beach), and Tennessee (Nashville) continue to attract large numbers of domestic migrants. Corporate relocations to more pro-business environments, the growth of new knowledge-based industries around universities, and the attraction of these warmer states for northern retirees are all attributed to the growth of these areas for domestic migrants (Labich, 1994; Longino, 1995).
Regional and Nonmetro Patterns
Another perspective can be gained by focusing on how the two types of migration differ in their broad regional destinations, and across the metropolitan and nonmetropolitan continuum. Historically, immigrants have been prone to focus primarily on large metropolitan areas and, as discussed above, this is the case through the early 1990s. However, since the early 1970s the overall population of the United States has gone through various stages of disbursement—both regionally away from the Northeast and Midwest census regions toward the Sun Belt —and toward smaller-sized and even nonmetropolitan areas (Frey and Speare, 1988; Long and Nucci, 1995). Although over three-fourths of Americans reside in metropolitan areas, and half live in metros with more than one million population (mostly in the suburbs), early 1990s statistics suggest a continuation of population dispersal, first observed in the 1970s (Johnson and Beale, 1995). This dispersal across regions and toward smaller areas is largely a product of internal migration.
Evidence from the early 1990s shows that nonmetropolitan employment growth has gained on that in the metropolitan part of the country (Fuguitt and Beale, 1995), lending support for some dispersal. The migration data shown in Table 10-3 confirm that there is a dispersal toward smaller and nonmetropolitan areas in the first half of the 1990s and that it is dominated by internal migrants. Moreover, those parts of the country that exhibit the highest internal migration gains exhibit some of the lowest gains through immigration. These include nonmetropolitan territory in the West, as well as smaller metropolitan areas and nonmetropolitan territory in the South. Among geographic divisions, the Mountain census division in the West shows the highest rate of growth and counterbalances the sharp decline in the Pacific division. Clearly, there is a redistribution away from the larger metropolitan areas in California that is rippling out into the smaller, nonmetropolitan territory in other parts of the West.
TABLE 10-3 Rates of Immigration and Net Internal Migration for U.S. Geographic Divisions and Metropolitan-Non metropolitan Categories
|
Immigration Rates |
Net Internal Migration Rates |
|||
|
Geographic Category |
1985–90 |
1990–95 |
1985–90 |
1990–95 |
|
Geographic Divisions |
||||
|
NORTHEAST |
||||
|
New Englands |
1.9 |
1.0 |
-0.2 |
-2.9 |
|
Mid-Atlantic |
2.3 |
2.1 |
-3.1 |
-3.4 |
|
MIDWEST |
||||
|
East North Central |
0.8 |
0.8 |
-1.7 |
-0.8 |
|
West North Central |
0.5 |
0.4 |
-1.2 |
0.6 |
|
SOUTH |
||||
|
South Atlantic |
1.6 |
1.1 |
5.3 |
2.9 |
|
East South Central |
0.3 |
0.2 |
0.9 |
2.5 |
|
West South Central |
1.2 |
1.4 |
-2.8 |
1.4 |
|
WEST |
||||
|
Mountain |
1.2 |
1.0 |
1.1 |
7.6 |
|
Pacific |
4.4 |
3.7 |
1.2 |
-2.9 |
|
Metro-Non Metro Categories |
||||
|
NORTHEAST |
||||
|
Large Metro* |
2.8 |
2.4 |
-3.9 |
-4.3 |
|
Other Metro |
0.9 |
0.5 |
1.1 |
-1.3 |
|
Non-Metro |
0.5 |
0.2 |
2.1 |
0.2 |
|
MIDWEST |
||||
|
Large Metro* |
1.1 |
1.2 |
-1.8 |
-1.5 |
|
Other Metro |
0.6 |
0.3 |
-0.5 |
-0.1 |
|
Non-Metro |
0.3 |
0.1 |
-2.0 |
1.4 |
|
SOUTH |
||||
|
Large Metro* |
2.2 |
1.7 |
2.3 |
1.8 |
|
Other Metro* |
0.9 |
0.7 |
2.8 |
2.8 |
|
Non-Metro |
0.3 |
0.3 |
0.1 |
2.6 |
|
WEST |
||||
|
Large Metro* |
4.5 |
3.6 |
1.4 |
-2.1 |
|
Other Metro |
2.3 |
2.0 |
1.9 |
2.0 |
|
Non-Metro |
1.0 |
0.9 |
-1.0 |
6.2 |
|
TOTAL US |
||||
|
Large Metro* |
2.7 |
2.3 |
-0.5 |
-1.6 |
|
Other Metro |
1.1 |
0.8 |
1.6 |
1.4 |
|
Non-Metro |
0.4 |
0.3 |
-0.6 |
2.5 |
|
SOURCE: Compiled by the authors from Special 1990 U.S. Census migrationtabulations and U.S. Census and U.S. Census postcensusal estimates. * Large Metro pertains to areas with 1995 populations greater than 1,000,000 people. |
||||
The above review makes plain that the state, metropolitan area, regional, and nonmetropolitan destinations of internal migrants differ sharply from those of recent immigrants. The identification of different sets of state and metropolitan-area ''magnets" for each group, as well as renewed internal migration dispersal to smaller-sized places and less-developed regions, are further evidence that these two migration processes are somewhat distinct.
SELECTIVE OUT-MIGRATION FROM HIGH-IMMIGRATION AREAS
The different destinations of immigrants and internal migrants may reflect different motivations. The former are influenced by social ties and informal networks, whereas the latter are more responsive to labor market fluctuations (Liaw and Frey, 1996, 1998). Yet a body of research and empirical evidence suggests that immigration may provide the impetus for at least some of the domestic out-movement from high-immigration states and high-immigration metro areas. This possible "immigrant push"3 was suggested in areas that were doing relatively well economically and were attracting domestic migrants among demographic groups that were less negatively affected by immigrants (e.g. college graduates who moved into California during the state's relatively prosperous 1985–1990 period, while less-educated domestic migrants were moving out).
It is, in fact, the uniqueness of the population groups that move away from high-immigration states and metros that suggests that immigration may be exerting a selective impact on domestic out-migration. Unlike more conventional migration that tends to overly select college graduates to areas with the most well-paying or fast-growing employment opportunities (Lansing and Mueller, 1967; Long, 1988; Liaw and Frey, 1996), there was a unique and fairly consistent pattern of out-migration among high school graduates, high school dropouts, and lower-income residents away from most high-immigration metropolitan areas (Frey, 1995b) and high-immigration states (Frey, 1994, 1995a, 1997a) for the 1985 –1990 period. A similar "downwardly selective" out-migration pattern from such areas was evident for the 1975–1980 period as well (Walker et al., 1992; Filer, 1992).
The unique selectivity of domestic out-migration is illustrated for selected high-immigration metros in Table 10-4. Shown are foreign immigration and native-born internal migration rates specific to education attainment for the 25-to 64-year-old age groups over the 1985–1990 period. In almost all cases, rates of internal net out-migration are highest for persons with a high school education or less. Moreover, numerically and in terms of rates, these statistics make plain that
|
3 |
The use of the term "immigrant push" is simply a descriptive device consistent with the convention in migration studies to identify various sets of origin "pushes" and destination "pulls" (Lee, 1996; Long, 1988). |
TABLE 10-4 Foreign Immigration and Native-Born Internal Migration Components, by Education and Selected High-Immigration Metro Areas
|
1985–90 Migration Components (Ages 25–64) |
Rates per 1990 Population* (Ages 25–64) |
Native Born Net Internal Migration Rates per 1990 Population (Ages 25–64) |
|||||
|
Metro Areas |
Foreign Immigration from Abroad |
Native Born Internal Migration |
Foreign Immigration from Abroad |
Native Born Internal Migration |
Total |
Whites |
Blacks |
|
LOS ANGELES |
|||||||
|
Less than High School |
190,460 |
-29,681 |
28.3 |
-4.4 |
-4.7 |
-7.5 |
-3.9 |
|
High School Graduates |
66,193 |
-43,233 |
5.7 |
-3.7 |
-3.3 |
-4.3 |
-2.2 |
|
Some College |
65,595 |
-49,494 |
3.5 |
-2.7 |
-1.6 |
-2.0 |
0.1 |
|
College Graduates |
84,484 |
40,753 |
6.4 |
3.1 |
10.2 |
11.0 |
12.0 |
|
NEW YORK |
|||||||
|
Less than High School |
132,564 |
-60,803 |
14.6 |
-6.7 |
-8.5 |
-9.2 |
-8.2 |
|
High School Graduates |
92,991 |
-132,081 |
4.6 |
-6.5 |
-7.3 |
-7.4 |
-7.1 |
|
Some College |
71,527 |
-127,952 |
4.2 |
-7.5 |
-7.5 |
-7.4 |
-8.0 |
|
College Graduates |
118,599 |
-85,173 |
5.3 |
-3.8 |
-1.2 |
-1.1 |
-1.4 |
|
SAN FRANCISCO |
|||||||
|
Less than High School |
44,989 |
-18,338 |
18.4 |
-7.5 |
-7.9 |
-9.2 |
-6.5 |
|
High School Graduates |
23,891 |
-32,794 |
4.4 |
-6.1 |
-5.7 |
-7.0 |
-1.9 |
there is a demographic displacement of foreign immigrants for native-born migrants that is especially imbalanced toward the former among persons with less than a high school education in Los Angeles, New York, San Francisco, Miami and, to a lesser extent, in Chicago and Houston. The education-selective out-migration is also apparent among populations restricted to young adult movers aged 25–34 and among whites as well as blacks. What is also apparent from this table is the "dual economy" nature of some of these areas, suggested by the net in-migration of college graduates to Los Angeles, San Francisco, Chicago, and Miami. This is consistent with arguments that suggest that high levels of immigration tend to benefit the kinds of professional and advanced service jobs that attract college graduates (Walker et al., 1992; White and Hunter, 1993).
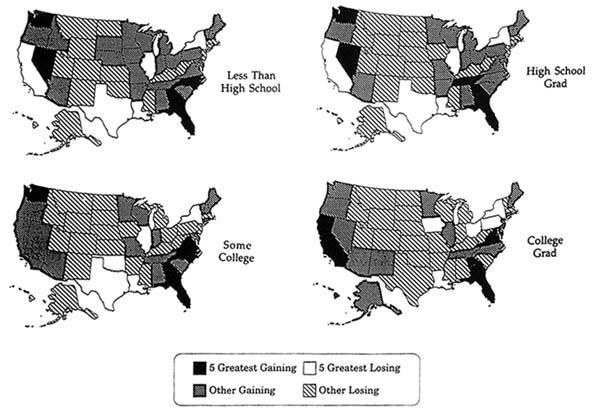
These distinct education-related patterns are also shown in Map 10-1, which depicts education-specific net domestic migration patterns for states in 1985–1990. Among 25–34 year olds, high-immigration states accounted for four of the five greatest losing states for those with at most a high school education. At the other extreme, college graduates were most apt to relocate away from the economically declining Northeast, farm belt, and oil patch states toward coastal areas (including California, Florida, and states surrounding Washington, D.C.) with high levels of immigration.
Explanations
The connection between immigration and the unique out-migration selectivity of the less skilled is consistent with a number of explanations. First, relatively low-skilled immigrants compete with less well-educated, long-term, and native-born residents for jobs and, therefore, they serve to bid down their wages and take away employment opportunities (Borjas, 1994; Borjas et al., 1996). Second, longer-term residents may hold the perception, correctly or not, that the new immigrants contribute to a variety of social costs including higher crime rates, reduced services, or increased taxes which imply greater out-of-pocket expenses for lower- and middle-class residents. Patterns of public support for California's 1994 statewide referendum on Proposition 187, which would restrict illegal immigrants' access to a variety of state services (Martin, 1995), show that the perceived immigrant burden is fairly widespread. Espenshade and Calhoun's (1993) analysis of California's public opinion data show antimigrant sentiment to be strong among residents who view immigrants as such a burden. Third, there is the possible race and ethnic prejudice factor, which has long been known to affect local moves across neighborhoods and between cities and suburbs when earlier immigrant waves entered cities (Lieberson, 1963; White, 1987). It is conceivable that the increased multiethnic presence that now encompasses entire metropolitan areas, and most neighborhoods within them (Denton and Massey, 1991), could precipitate some of the metropolitan-wide out-migration in high-immigration areas.
Previous findings consistent with these explanations include a series of multivariate analyses of 1985–1990 net internal migration for metropolitan areas (Frey, 1995b) and for states (Frey, 1995c). These studies show that, when other relevant economic and amenity variables are added to the analysis, immigration exerts a significant independent effect on net domestic out-migration that is strongest for persons in poverty and for persons with less than a college education (in the metropolitan area analysis). These latter studies were followed up with more rigorous analyses of the migration process that separated the explanation of migration departures from a state from the explanation of migrants' destination choices (Frey et al., 1996; Liaw and Frey, 1996). These studies provide evidence that immigration's impact on the interstate migration process is more pronounced in affecting departure from a state (i.e., the decision to move) than in affecting the migrants' destination selection. It lends support to the view that immigration is more likely to serve as a "push" rather than as a reduced "pull" for domestic migration to high-immigration states.
Studies using similar and other multivariate techniques for migration over the late 1970s (Walker et al., 1992; Filer, 1992; White and Hunter, 1993; White and Imai, 1994) and for the 1980s (White and Liang, 1994) show general but not uniformly consistent support for an immigration effect on the internal out-migration of less-skilled residents. One study, conducted by Barff et al. (1995), shows general support for this effect in the late 1970s but inconsistent results for the late 1980s.
1990s Evidence
We now examine available evidence for the first half of the 1990s to see if the unique selectivity pattern of domestic net out-migration from high-immigration states persists for this period. It is not possible to undertake the detailed analysis of demographic subgroups for areas (states or metropolitan areas) that was conducted for the 1985–1990 (Frey, 1995b, 1995c) with decennial census migration data. However, it is possible to compile reasonably comparable rates over the first four years of the 1990s using the "migration one-year ago" question from the Census Bureau's Annual CPS. The rates for the 1990 –1994 period can be compiled by adding the net migration components for each year and computing a rate based on the average mid-year population over the period. These rates, along with comparable rates for the 1985–1990 period (from the census) appear in Table 10-5.
The unique out-migration patterns shown for high-immigration states are generally apparent for both the late 1980s and early 1990s. In most cases, there is a higher rate of net out-migration for persons with "less select" demographic attributes—those with less than a college education and those with incomes below poverty. Also, consistent with findings from the earlier period, selectivity is more pronounced for the white populations of these states than for the overall
populations. (Sample sizes preclude our conducting analyses specific to blacks or providing overall measures for Hispanics and Asians.)
The rates shown for the state of New Jersey provide an example. Here, persons in poverty are most apt to leave the state. For example, in the early 1990s, New Jersey's poverty population showed a net out-migration of -8.3 percent versus only -2.6 percent for the nonpoverty population. Similar results were obtained when comparing the migration of persons with only high school educations or less than high school educations with those who are college graduates (e.g., white persons with less than high school educations left New Jersey at a rate of -3.3 percent over the early 1990s compared with less than a 1 percent net out-movement among college graduates).
It is useful to compare the selectivity patterns of California with those of Texas because, as mentioned above, these states underwent somewhat divergent economic circumstances between the late 1980s and early 1990s. That is, during the first period, California's economy was still relatively robust, while Texas was undergoing severe employment declines—conditions which reversed for the early 1990s. Nonetheless, over both periods, each state's migrant selectivity patterns displayed an accentuated net out-migration for their poverty populations and either accentuated net out-migration or reduced net in-migration for persons with less education. (A more extensive analysis of this phenomenon for California can be found in Johnson and Lovelady, 1995.) Indeed, during the "good" periods for each state (1985–1990 in California and 1990–1994 in Texas) college graduates and nonpoverty persons were moving in while poverty persons were moving out. This is consistent with the view that the poverty and unskilled segments of the population may be less responsive to the current cyclical conditions of the overall economy than they are to the labor competition and other out-migration-inducing pressures of immigrants to these states (Frey, 1995a).
The general pattern of net out-migration shown in Table 10-5 is unlike the "circulation of elites" characterization that is typically applied to interstate or intermetropolitan migration (Frey, 1979, 1995b). Usually, states that are losing migrants because they are undergoing economic downturns lose them disproportionately among their college graduate or more well-off segments of the younger population. In a like manner, states that are gaining internal migrants gain them disproportionately from these groups. The unique pattern of selective out-migration shown for most of these states during both the late 1980s and early 1990s is consistent with explanations discussed above that link immigration to domestic out-migration.
IMPACT ANALYSIS OF SELECTIVE OUT-MIGRATION
Although the previous descriptive statistics along with earlier analytic studies show a statistical relationship between immigration and the selective net out-migration of less-skilled native-born residents, no previous research has esti-
TABLE 10-5 Net Internal Migration Rates for Selected Social and Demographic Categories, 1985–1990 and 1990–1994 High-Immigration States
|
NET INTERNAL MIGRATION RATES |
||||
|
CALIFORNIA |
NEW YORK |
|||
|
Categories |
1985–90 |
1990–94 |
1985–90 |
1990–94 |
|
RACE |
||||
|
Total |
0.7 |
-2.3 |
-4.8 |
-5.0 |
|
Whites* |
0.7 |
-4.2 |
-4.4 |
-4.1 |
|
Blacks |
1.1 |
4.6 |
-5.7 |
-7.8 |
|
EDUCATION** |
||||
|
Less than HS |
-0.8 |
-2.1 |
-3.7 |
-6.7 |
|
HS Grad |
-1.0 |
-4.5 |
-4.5 |
-3.8 |
|
College Grad |
3.4 |
-2.3 |
-5.9 |
-3.7 |
|
POVERTY STATUS |
||||
|
Poverty |
-1.7 |
-1.5 |
-4.7 |
-6.8 |
|
NonPoverty |
0.8 |
-2.5 |
-4.8 |
-4.7 |
|
WHITES-EDUCATION** |
||||
|
Less than HS |
-1.9 |
-3.9 |
-3.4 |
-5.4 |
|
HS Grad |
-1.4 |
-7.2 |
-4.2 |
-2.9 |
|
College Grad |
3.5 |
-3.0 |
-5.7 |
-3.8 |
|
WHITES-POVERTY STATUS |
||||
|
Poverty |
-4.0 |
-6.0 |
-4.2 |
-8.0 |
|
NonPoverty |
0.8 |
-4.0 |
-4.4 |
-3.7 |
|
SOURCE: Compiled by author from Special 1990 US Census migrationtabulations (1985–90), and from single year migration tabulations(1990–91, 1992–92, 1993–94 US Census Bureau Current Population Surveys. |
||||
mated the impact of immigration in terms of the numbers of domestic migrants that are affected by this relationship. In this section, we present the results of such an impact analysis for states (48 contiguous states and the District of Columbia). Because the most recent detailed data, available for such an analysis, are based on the 1990 Census for migration over the 1985–1990 period (based on the "residence 5-years ago" census question), we focus on this period. Our analysis is restricted to examining the impact of different immigration levels on the domestic migration for persons with a high school education and less and who were aged 25–64 at the end of the migration period (in 1990). The focus on this education attainment group is consistent with earlier research indicating that the unique selective out-migration response to immigration is largely confined to this group. The focus on the age group 25–64 is for persons of labor force age who, for the most part, have completed their formal educations.
In examining the impact of immigration on domestic migration, we focus on the changing levels of immigrants who are also less skilled (high school education or less). This focus is consistent with the thesis that immigrants represent labor substitutes for domestic migrants with similar skill levels—an often-held explanation for the observed negative impact between immigration and domestic migration. As such, our impact analyses will address two questions:
-
How would a 50 percent increase or a 50 percent decrease in current immigration of less-skilled labor-force-aged immigrants affect domestic migration patterns of less-skilled native-born Americans?
-
How would a similar increase or decrease in less-skilled immigrants to California only affect domestic migration patterns between California and other states?
The answer to the first question would indicate the impacts of policies that would change the overall levels of immigration (proportionately across skill levels, or those that would change the preference system in a way that would alter the numbers of less-skilled immigrants). The answers to the second question are relevant to research findings that show that the domestic out-migration from California among less-skilled and poverty residents disproportionately relocates them to the nearby states of Washington, Oregon, Nevada, and Arizona (Frey, 1995a). From the perspective of those states, domestic in-migration from California accounts for a large share of their overall in-migrating populations who have a high school education or less and incomes below poverty. This impact analysis will be able to assess the magnitude of California's domestic migration exchanges with these states which are affected by California's immigration levels.
Methodological Approach
Methodological details for both components of this impact analysis are specified in Appendices A and B, respectively. Our approach can be summarized in terms of two separate components. The first involves estimating the effects of low-skilled immigration on the migration process for native-born interstate migrants using the nested logit model that permits a separate estimation of residents' departures and migrants' destination choices as part of the overall migration stream process. This specific technique is one that has been developed by Liaw and his associates to examine migration processes in a number of contexts (Liaw and Ledent, 1987; Liaw, 1990; Liaw and Otomo, 1991; Liaw and Frey, 1996). This analysis evaluates the effects on a state's domestic migration of low-skilled immigration to the state compared with other well-known migration determinants associated with the state's labor force, social and environmental amenities, and geographical contiguity.
The second component of the impact analysis uses the results of the nested logit model to generate estimated changes in migration rates, associated with assumed alternative low-skilled immigration levels, and applying these rates to appropriate populations at risk to generate various alternative interstate domestic migration outcomes that would be consistent with the assumed alternative immigration levels. Both components of this methodology are first estimated in separate age-disaggregated analyses for the broad age groups 25–29, 30–44, and 45–64 because these different age groups are subject to somewhat different mixes of migration determinants. The results of these age-specific impact analyses are then aggregated to produce results for the entire 25to 64-year-old age group for our population of interest (i.e., native-born residents with a high school education or less).
Because the results of the nested logit model provide the basis for estimating the effect of low-skilled immigration on the domestic migration process, we summarize the results of these models here. (Relevant equations for the depar-
ture rates submodel can be found in appendix tables 10-A1, 10-A2, and 10-A3 for the age groups 25–29, 30–44, and 45–64, respectively. The results for the destination choice submodel appear in appendix tables 10-A4, 10-A5, and 10-A6, for these respective age groups.) We note that our estimate of low-skilled immigration included in these models is based on 1985 –1990 immigrants reported in the 1990 census, and, therefore, is likely to understate, to some degree, the number of illegal immigrants in this group.4 Common state attribute variables that are included in both submodels are the low-skilled immigration rate, labor market variables (per capita income, unemployment rate, civilian employment growth, service employment growth), state AFDC and food stamp benefits, a racial similarity measure (specific to whites, blacks, Asians, American Indians, and Hispanics), measures of extreme hot or cold climate, and the state's violent crime rate. (State variations in the cost of living, incorporating state variations in housing costs, are used to adjust the per capita income measure.) In addition to these, the destination choice model includes measures of distance and contiguity between origin and potential destination states. (Definitions of all variables are listed in Appendix A.)
Within each age-specific (25–29, 30–44, 45–64) analysis, it is possible to interact the above state-level attributes with personal attributes including detailed age (five-year age groups), race (white, black, Asian, American Indian, Hispanic), education attainment (below high school, high school graduate), poverty status (below poverty, above poverty), and gender (male, female). This is because our analysis makes use of a detailed migration matrix that disaggregates 1985–1990 interstate moves by a cross classification of the demographic variables just described. This matrix was drawn from a special tabulation of the full ''long form" 16.7 percent sample of the 1990 U.S. census and weighted up to approximate the total population. In estimating the final departure and destination choice models presented in Appendix A tables, a series of preliminary analyses were conducted to identify statistically significant interactions between state
|
4 |
The measure of immigration used in this analysis identified all 1990 state residents with at most a high school education who reported a residence abroad in 1985. Although it would be preferable to employ a net immigration estimate (comparable to the net internal migration estimate), neither the U.S. Census nor any other U.S. statistical agency collects reliable estimates of emigrants from the United States. This use of the census "residence abroad" question is also consistent with previous research. However, we note that this estimate does not necessarily overstate total net immigration to the United States, despite its omission of the emigration component. This is because migration from abroad, as reported in the census, substantially understates the illegal immigrant population. It is estimated that, during a given year, there is an emigration of between 150,000 and 200,000 residents (of all education levels). However, it is also estimated that there is a net annual immigration of 300,000 illegal immigrants, many of whom are not counted by the census (Martin and Midgley, 1994). Thus, the figures we use tend to overstate legal immigration but understate illegal immigration for the 1985–1990 period. Because the latter is likely to be disproportionately comprised of those with lower education levels, our estimates of low-skilled immigration are understated. |
area attributes and personal characteristics that were consistent with reasonable expectations about migration behavior.
Most of the effects in the final age-disaggregated nested logit models were consistent with expectations and can be found in Appendix A tables. Our main interest is in the impact of the low-skilled immigration rate on the departure rates of residents, destination choices of migrants, and interactions with personal characteristics, when other relevant attributes are controlled. The low-skilled foreign immigration rate is defined on the basis of working-aged (15- to 64-year-old) immigrants with high school educations or less5 divided by the corresponding beginning-of-period state population. Our analysis indicates that the primary impact of low-skilled immigration on native-born migration operates through the departure from high-immigration states, rather than as a reduced tendency to choose such states as destinations. This is because the contribution to total explanation, associated with low-skilled immigration, is much stronger in the departure models than it is in the destination choice models. In fact, low-skilled immigration has an almost similar effect in the departure models as do the combined effects of the labor market variables. Its contribution to explanation is stronger than the combined labor market variables for persons in the 45–64 age group, suggesting that many of these pre-retirees are influenced as much by factors associated with states with high immigration levels as by standard income, unemployment rate, and employment growth attributes.
Equally noteworthy as the strong impact that low-skilled immigration exerts on the departure of low-skilled domestic residents is its interaction with specific subgroups. Strong interactions are shown for whites and especially whites below the poverty line. This is consistent with descriptive analyses that indicate, when controlled for education, that poverty residents are most likely to leave high-immigration states (Frey, 1995c; Frey et al., 1996). Other significant interactions with low-skilled immigration are shown for blacks, poor blacks, and poor Hispanics (see appendix tables 10-A1, 10-A2, and 10-A3).
Although low-skilled immigration is not an important explanatory factor in the destination choices of migrants, it is noteworthy that the racial similarity of a destination state shows as much explanatory power as the conventional labor market variables (see appendix tables 10-A4, 10-A5, and 10-A6). This is especially the case for blacks, Hispanics, and Asians as well as Hispanics with less than a high school education and consistent with earlier observations that longer-term residents and native-born members of the new immigrant minority groups are likely to locate in areas with large numbers of same-nationality residents.
|
5 |
In assessing alternative immigration levels for impact analysis, we have chosen to focus on the age groups 15–64 because alternative immigration policies are likely to affect the entire labor- force-aged population. Hence, although the focus of our domestic migration impact estimations are persons aged 25–64 (for reasons discussed in the text), we assume that their migration patterns will be affected by changes in low-skilled immigrant levels at all labor force ages. |
In sum, the nested logit model analyses confirm the results of earlier research, indicating that states with high levels of immigration of persons who might be labor substitutes for resident workers will show an accentuated out-migration of lower-skilled native residents when other state attributes are controlled. This effect operates more strongly through the departure part of the migration process than through the destination choice. Our results also confirm earlier findings suggesting that the effect is most prominent among lower-income native-born residents of these high-immigration states. The results of these models are incorporated into the impact analysis discussed in Appendix B.
Impact of Nationwide Immigration Changes
Our first set of impact analyses makes two alternative assumptions. The first assumption is that the observed level of immigration for working-aged immigrants with at most a high school education is decreased by 957,000 over the 1985–1990 period. The second assumption is that the current level is increased by a similar amount over the 1985 –1990 period. These numbers approximate 50 percent increases, or 50 percent decreases, of such immigration compared with the observed levels in the census. These increases and decreases occur proportionately to each state with respect to their actual immigration levels. (For convenience, we refer to these assumptions as 50 percent increases in immigration and 50 percent decreases in immigration.) The analyses below present the estimated impacts that these assumptions imply for net domestic migration of states' native-born residents, aged 25–64, with high school educations or less.
The results of these scenarios for each state are shown in Table 10-6. These data make plain that when immigration is decreased, it is the high-immigration states that tend to retain more of their native-born domestic low-skilled migrants who might otherwise have relocated to a low-immigration state. Similarly, when immigration is increased, high-immigration states are the most prone to lose domestic native-born low-skilled migrants to other states. This is depicted in Map 10-2 which shows the estimated change in net domestic migration for states on the assumption that there is a 50 percent increase in U.S. immigration levels. Under this scenario, only ten states (including the District of Columbia) would show increased net domestic out-migration or (in the case of Florida) reduced net domestic in-migration with at most a high school education. These changes would accrue to California (-189,312), New York (-61,671), Florida (-20,313), Texas (-19,702), and Illinois (-15,810). The states gaining most from these net domestic migration shifts would be Arizona (36,863), Georgia (22,950), Pennsylvania (22,768), and Nevada (22,764). Clearly, the states surrounding California, and those in the South Atlantic region—presumably attracting migrants from New York, New Jersey, Massachusetts, Illinois, and Florida— would gain larger numbers of less-skilled domestic migrants under this scenario of higher immigration.
TABLE 10-6 Estimated 1985–1990 Net Domestic Migration Assuming a 50 percent Increase or Decrease in U.S. Immigration Levels, Ages 25–64 with High School or Less Education
|
Scenario I: Assuming Decrease in Immigration |
Scenario II: Assuming Increase in Immigration |
|||||
|
Expected Net Migration |
Expected Net Migration |
|||||
|
State |
Before Change |
After Change |
Impact |
Before Change |
After Change |
Impact |
|
ALABAMA |
27,927 |
17,250 |
-10,677 |
27,927 |
42,510 |
14,583 |
|
ARIZONA |
69,662 |
48,444 |
-21,218 |
69,662 |
106,525 |
36,863 |
|
ARKANSAS |
20,104 |
13,799 |
-6,305 |
20,104 |
28,731 |
8,627 |
|
CALIFORNIA |
-59,914 |
44,654 |
104,568 |
-59,914 |
-249,226 |
-189,312 |
|
COLORADO |
-72,935 |
-69,459 |
3,476 |
-72,935 |
-75,805 |
-2,870 |
|
CONNECTICUT |
7,560 |
5,210 |
-2,350 |
7,560 |
11,598 |
4,038 |
|
DELAWARE |
19,780 |
16,168 |
-3,612 |
19,780 |
24,566 |
4,786 |
|
DC |
8,304 |
-6,100 |
2,204 |
-8,304 |
-10,822 |
-2,518 |
|
FLORIDA |
35,673 |
151,330 |
15,657 |
135,673 |
115,360 |
-20,313 |
|
GEORGIA |
79,338 |
63,248 |
-16,090 |
79,338 |
102,288 |
22,950 |
|
IDAHO |
-14,596 |
-14,421 |
175 |
-14,596 |
-14,140 |
456 |
|
ILLINOIS |
8,465 |
-54,242 |
14,223 |
-68,465 |
-84,275 |
-15,810 |
|
INDIANA |
6,115 |
-1,430 |
-7,545 |
6,115 |
16,411 |
10,296 |
|
IOWA |
1,400 |
7,106 |
4,294 |
11,400 |
17,418 |
6,018 |
|
KANSAS |
-1,444 |
-3,696 |
-2,252 |
-1,444 |
2,330 |
3,774 |
|
KENTUCKY |
6,897 |
9,459 |
-7,438 |
16,897 |
27,028 |
10,131 |
|
LOUISIANA |
-56,689 |
-60,181 |
-3,492 |
-56,689 |
-51,239 |
5,450 |
|
MAINE |
9,816 |
6,785 |
-3,031 |
9,816 |
14,033 |
4,217 |
|
MARYLAND |
21,312 |
18,265 |
-3,047 |
21,312 |
26,544 |
5,232 |
|
MASSACHUSETTS |
-6,745 |
-3,471 |
3,274 |
-6,745 |
-10,019 |
-3,274 |
|
MICHIGAN |
-25,574 |
-29,914 |
-4,340 |
-25,574 |
-18,943 |
6,631 |
|
MINNESOTA |
-18,220 |
-19,333 |
-1,113 |
-18,220 |
-15,969 |
2,251 |
|
MISSISSIPPI |
10,482 |
5,413 |
-5,069 |
10,482 |
17,400 |
6,918 |
|
MISSOURI |
-3,843 |
-10,081 |
-6,238 |
-3,843 |
4,952 |
8,795 |
|
MONTANA |
-16,879 |
-17,110 |
-231 |
-16,879 |
-16,356 |
523 |
|
NEBRASKA |
-5,774 |
-7,362 |
-1,588 |
-5,774 |
-3,359 |
2,415 |
|
NEVADA |
38,133 |
25,486 |
-12,647 |
38,133 |
60,897 |
22,764 |
|
N. HAMPSHIRE |
22,528 |
17,546 |
-4,982 |
22,528 |
29,293 |
6,765 |
|
NEW JERSEY |
-9,977 |
-3,671 |
6,306 |
-9,977 |
-16,746 |
-6,769 |
|
NEW MEXICO |
-14,011 |
-14,542 |
-531 |
-14,011 |
-12,820 |
1,191 |
|
NEW YORK |
-91,374 |
-48,050 |
43,324 |
-91,374 |
-153,045 |
-61,671 |
|
N. CAROLINA |
59,163 |
45,906 |
-13,257 |
59,163 |
77,229 |
18,066 |
|
N. DAKOTA |
-13,791 |
-13,861 |
-70 |
-13,791 |
-13,575 |
216 |
|
OHIO |
-30,077 |
-37,725 |
-7,648 |
-30,077 |
-18,985 |
11,092 |
|
OKLAHOMA |
-52,622 |
-54,210 |
-1,588 |
-52,622 |
-49,620 |
3,002 |
|
OREGON |
22,392 |
13,203 |
-9,189 |
22,392 |
38,013 |
15,621 |
|
PENN |
19,278 |
3,441 |
-15,837 |
19,278 |
42,046 |
22,768 |
|
RHODE ISLAND |
2,605 |
2,903 |
298 |
2,605 |
2,411 |
-194 |
|
S. CAROLINA |
37,368 |
28,100 |
-9,268 |
37,368 |
50,030 |
12,662 |
|
S. DAKOTA |
-8,109 |
-8,623 |
-514 |
-8,109 |
-7,318 |
791 |
|
TENNESSEE |
36,746 |
26,776 |
-9,970 |
36,746 |
50,429 |
13,683 |
|
TEXAS |
-92,168 |
-73,001 |
19,167 |
-92,168 |
-111,870 |
-19,702 |
|
UTAH |
1,544 |
-1,045 |
-2,589 |
1,544 |
5,753 |
4,209 |
|
VERMONT |
7,791 |
5,205 |
-2,586 |
7,791 |
11,348 |
3,557 |
|
VIRGINIA |
11,275 |
9,889 |
-1,386 |
11,275 |
15,373 |
4,098 |
|
WASHINGTON |
6,233 |
3,511 |
-2,722 |
6,233 |
11,983 |
5,750 |
|
W. VIRGINIA |
-4,812 |
-9,072 |
-4,260 |
-4,812 |
829 |
5,641 |
|
WISCONSIN |
-4,038 |
-7,801 |
-3,763 |
-4,038 |
1,469 |
5,507 |
|
WYOMING |
-20,758 |
-20,697 |
61 |
-20,758 |
-20,665 |
93 |
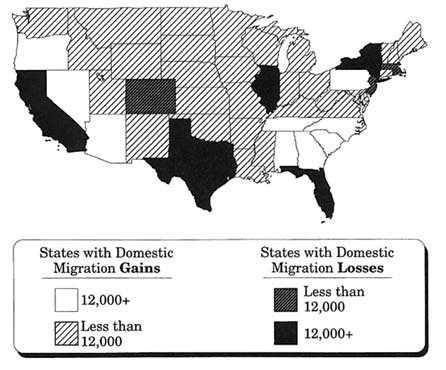
MAP 10-2 Estimated five-year change in net domestic migration for states assuming 50 percent increase in U.S. immigration levels (ages 25–64 with high school or less education).
Figure 10-4 shows how the two different assumptions about immigration would impact the net domestic migration for four high-immigration states: California, New York, Texas, and Illinois. California would show the greatest disparities in the net domestic migration of their less-educated population. Given the observed level of immigration over the 1985 –1990 period, California shows an expected domestic out-migration of 59,914 low-skilled residents. However, if immigration were reduced by 50 percent, the state would show a gain of 44,654 low-skilled persons, while under a 50 percent increase immigration scenario, it would lose 249,226 such persons. The other three states show net domestic out-migration under each scenario with New York showing the widest fluctuation of these three.
Another way to assess the impact of these different immigration scenarios is to examine how many low-skilled domestic migrants a state would gain for every 100 low-skilled immigrants who did not come in (under a reduced immigration scenario); or to estimate how many low-skilled domestic migrants it would lose
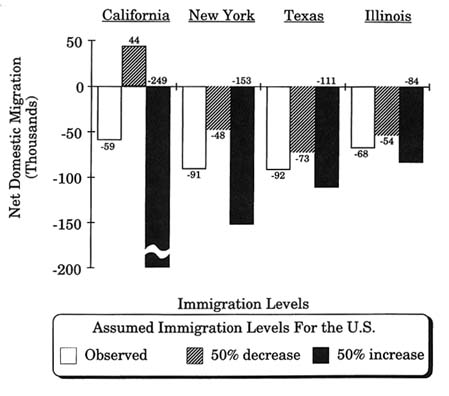
FIGURE 10-4 Estimated 1985–1990 net domestic migration for states assuming a 50 percent decrease/increase in U.S. immigration levels (ages 25–64 with high school or less education).
for every 100 additional low-skilled immigrants arriving (under an increased immigration scenario). These figures are shown for states with greatest immigration in Table 10-7, where the changes are calculated on the basis of immigrants and domestic migrants aged 15–64. Results show that there are not similar levels of exchange under both the decreased immigration and the increased immigration scenarios. For example, under a decreased immigration scenario, California would gain 27 low-skilled domestic migrants for every 100 such immigrants who did not come into the state. Yet under an increased immigration scenario, California would lose 51 low-skilled domestic migrants for every 100 additional such immigrants that came into the state. Migrant exchanges under the increased immigration scenario are the most dramatic: The exchange of low-skilled immigrants for low-skilled domestic migrants is 2 to 1 in California. It is just as strong in New York and Illinois, and about 5 to 2 in Texas.
TABLE 10-7 Estimated 1985–1990 Change in State's Net Domestic Migration per 100 Changes in its Immigration Levels,* Ages 15–64 with High School or Less Education
Because our impact analysis permitted a disaggregation by race-ethnicity, poverty status, and detailed age, it is possible to examine the impact of immigration changes for different demographic groups of a state's population. Figure 10-5 presents an analysis for California, based on our simulation, that shows the domestic net migration rates specific to different groups under the assumptions (a) that actual immigration levels occurred over the 1985–1990 period. and (b) that a 50 percent reduction in immigration took place over the 1985–1990 period. As in the above analysis, these results pertain to persons with a high school or less education and also are restricted to the ages 25–64. The results show that under the conditions of actual immigration levels, rates of net out-migration are somewhat higher for low-skilled whites than for the low-skilled population overall. The out-migration rates are substantially larger among the low-skilled poverty population, and especially the white low-skilled poverty population.
When a 50 percent reduction in national immigration levels is assumed, these patterns change noticeably. Under the latter scenario, the net migration
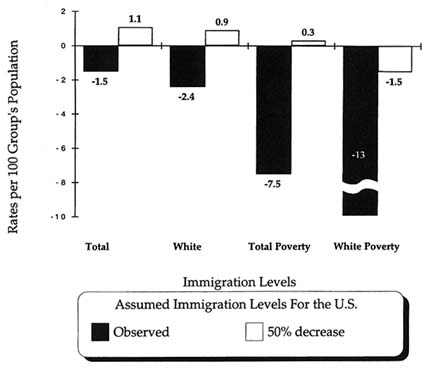
FIGURE 10-5 California, impact on groups, estimated 1985–1990 net domestic migration rates assuming actual/50 percent decrease in U.S. immigration levels (ages 25–64 with high school or less education).
rates for three of the four low-skilled groups shown (total, whites, total poverty) change from negative to positive. However, the most dramatic changes occur with the two poverty groups. The rate for the total low-skilled poverty population changes from -7.5 (when actual immigration is assumed) to 0.3 (when a 50 percent reduction in immigration is assumed). Even more significantly, the rate for the white low-skilled poverty population changes from -13 to -1.5. These results indicate that the impact of immigration on the net domestic out-migration of California's low-skilled population is somewhat more accentuated among whites but that it is especially important in accounting for the net out-migration of the low-skilled poverty population. These results also hold up when the analysis is confined to specific age groups so that they do not reflect patterns of only the younger or older populations within the state. Moreover, similar simulations with other high-immigration states show that, as with California, immigration disproportionately affects their low-skilled white and poverty populations (see Liaw et al., 1996).
These impact analyses have shown that reduced or increased levels of low-skilled immigration show considerable effects on the redistribution of less-skilled domestic migrants for high-immigration states. The fact that, under an increased immigration scenario, 100 new low-skilled immigrants to California will precipitate a net out-migration of 51 low-skilled native migrants from California suggests that there is a substantial demographic displacement occurring in this state. Another important finding of this analysis is the "spillover effects" that changing immigration levels impose indirectly on low-immigration states as a result of increased or decreased domestic migration out of high-immigration states. Under the scenario of a 50 percent increase in immigration nationwide, 39 states would register increased net domestic migration gains on low-skilled native-born residents. Alternatively, most of these states would lose low-skilled domestic migrants to the high-immigration states under a scenario of a 50 percent reduction in immigration to the United States.
Impact of California Immigration Changes
Following this discussion of "spillover effects" of immigration, we now focus on an impact analysis that assumes that only California experiences a 50 percent decrease or 50 percent increase in its low-skilled immigration levels. The purpose of this, as indicated above, is to assess the indirect impacts of these changes on California's domestic migration exchanges with nearby states: Washington, Oregon, Nevada, and Arizona. From a numeric standpoint, we are assuming under a "decreased immigration scenario" that California's 1985–1990 immigration of low-skilled labor-force-aged persons is reduced by 400,000. Similarly, under the "increased immigration" scenario, we assume that an additional 400,000 such immigrants move into the state. The "spillover" impact of these assumed reductions and increases in California's immigration can be seen in Figure 10-6.
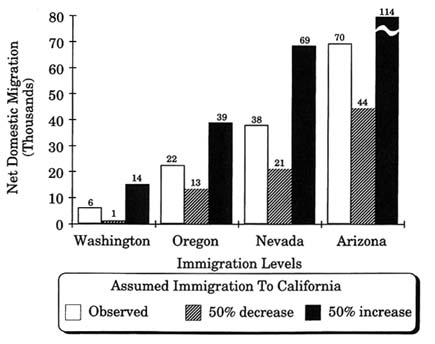
FIGURE 10-6 Estimated 1985–1990 net domestic migration for states assuming a 50 percent decrease/increase in California immigration levels (ages 25–64 with high school or less education).
Shown here are the net domestic gains of low-skilled native-born migrants for the States of Washington, Oregon, Nevada, and Arizona under three different California immigration scenarios. It is clear from these statistics that Arizona and Nevada show the greatest changes as a result of these different scenarios. If immigration to California were reduced by 50 percent. Arizona's net domestic gains of 69,662 low-skilled migrants would become reduced to 44,317. If California's immigration level were to increase by 50 percent, Nevada's net domestic gains of low-skilled migrants would be raised from 38,133 to 68,524. Smaller, but similar, fluctuations are observed for Oregon and Washington.
The ''spillover effects" of immigration to California on surrounding states are selective on different demographic groups within the low-skilled populations just discussed. To illustrate this, we present results from our simulations for Nevada and Arizona that compare their net domestic migration patterns under the conditions in which (a) California received its actual immigration levels over the 1985–1990 period, and (b) California's immigration levels were reduced by 50 percent over the 1985–1990 period. The comparison for Nevada is shown in Figure 10-7 and indicates that when California's immigration levels are not re-
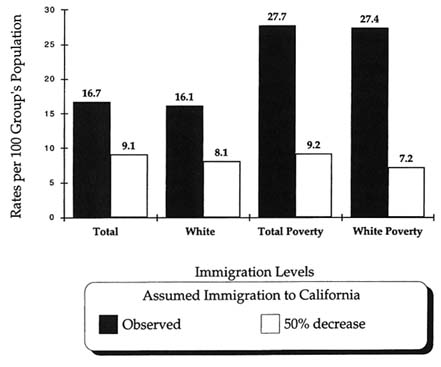
FIGURE 10-7 Nevada, impact on groups, estimated 1985–1990 net domestic migration rates assuming actual/50 percent decrease in California immigration levels (ages 25–64 with high school or less education).
duced, Nevada's net domestic in-migration rates are substantially higher for its low-skilled poverty populations than for its low-skilled nonpoverty populations. However, when California's immigration is reduced, it has the spillover effect of reducing, disproportionately, domestic net migration of the low-skilled poverty population to Nevada. The latter scenario has the effect of reducing Nevada's domestic migration gains for all of the groups shown in Figure 10-7, but the impact is especially large on Nevada's poverty population.
A similar impact is also shown for Arizona in Figure 10-8. Here, a reduction in California's immigration levels has a disproportionate effect on Arizona's net domestic migration levels for both its poverty population and its white poverty population. Under the assumption of actual immigration to California, Arizona' low-skilled domestic migration gains are somewhat higher for whites than overall, but are substantially higher for low-skilled whites in poverty. Under the assumption of reduced immigration to California, Arizona's low-skilled poverty migration rates are dramatically lowered, such that for poor whites, the domestic
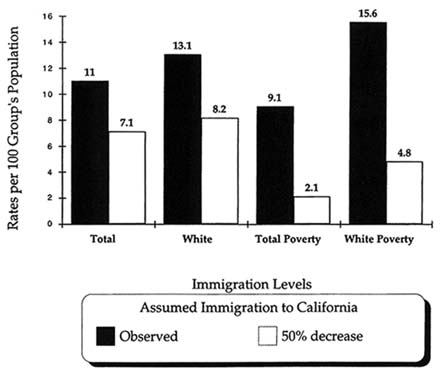
FIGURE 10-8 Arizona, impact on groups, estimated 1985–1990 net domestic migration rates assuming actual/50 percent decrease in California immigration level (ages 25–64 with high school or less education).
migration rate of 15.6 (actual immigration to California) is reduce to 4.8 (assuming the 50 percent reduction of immigration to California). These results for Nevada and Arizona indicate that the spillover effects of immigration to California disproportionately impact on the low-skilled poverty populations in these neighboring states.
IMPLICATIONS
This overview of the impact of recent immigration on population redistribution within the United States has shown that there is a continued concentration of immigrants to selected port-of-entry states and metropolitan areas at the same time the redistribution of internal migrants is more dispersed. Our own studies and those of others suggest that the concentration of immigrants is, in part, a function of their proclivity to locate in areas where there are existing concentrations of persons with like race-ethnic backgrounds and nationalities, and that
these tendencies are most pronounced among immigrants with high school educations or less. In contrast, the internal migration processes, at work over the late 1980s and early 1990s, are more responsive to conventional labor market "pushes" and "pulls" and are drawn to state and metropolitan area destinations that are not the major immigrant port-of-entry areas. However, there is clear evidence of accentuated domestic out-migration from high-immigration states and metropolitan areas for persons with high school educations or less. The multivariate analyses conducted for this study indicate that this is associated with low-skilled immigration, after controlling for relevant labor market and amenity variables that are generally used to explain interlabor market migration. Moreover, our impact analyses suggest that the immigration impacts on this domestic out-migration are considerable and would approach a 2-to-1 relationship in California under a scenario of a 50 percent increase in the state's recent immigration level.
The explanation for this demographic displacement may well lie with arguments that immigrants represent labor substitutes for domestic migrants who can take advantage of opportunities in other areas, However, our results are also consistent with other explanations as well. For example, less well-off, longer-term residents in high-immigration areas may be reacting to perceived increases in social costs that may take the form of higher crime rates, reduced services, or increased local taxes that they may take to be a function of recent immigrant flows. In addition, one cannot ignore the possibility that race and ethnic prejudice may enter into decisions of native residents, especially whites, to relocate away from increasingly multiethnic areas in much the same manner that such prejudice prompted "suburban flight" in many American cities in the 1950s and 1960s.
Moreover, our findings suggest broader implications for changes in the social demography of high-immigration areas if recent immigration and internal migration patterns persist. For example, it has been argued that port-of-entry metro areas are taking on a "dual economy" character where large numbers of immigrants, participating in lower-skilled and informal sectors of the labor force, provide complementary activities for more advanced services and corporate headquarters activities among the mostly white-native professional ranks (Mollenkopf and Castells, 1991; Sassen, 1996; Waldinger, 1996). The demographic implications of this scenario become apparent when examining the foreign-born shares and minority shares of different socioeconomic attributes in high-immigration metros (Table 10-8).
For these metropolitan areas, the 1995 foreign-born population comprises a disproportionate share of persons without high school diplomas, in the lower quartile of family income, and of workers in service and unskilled blue collar occupations. The imbalance is even more pronounced in the Los Angeles metropolitan area where, for example, foreign-born residents comprise three-fifths of all persons whose family incomes fall in the bottom quartile, while representing only 23 percent of those in the upper quartile. Over half of service
and unskilled blue collar jobs in Los Angeles are taken by foreign-born persons, who account for no more than one-fifth of the managerial and professional jobs.
The divergence in the nativity-class structure for the combined high-immigration metro areas and individual areas, such as Los Angeles and New York, contrasts markedly with the rest of the United States—where the foreign born comprise only 6 percent of persons aged 18 and above and disparities by socio-economic measures are not nearly as skewed. More contrasts can be made with respect to the minority composition of high-immigration metros and the rest of the United States (Table 10-8, right panel) and on other demographic attributes typically associated with the foreign-born population. The statistics for 1995 point up already sharp disparities with respect to the class-nativity and class-race-ethnic structures between the metropolitan regions that serve as ports of entry and other parts of the United States.
The findings in this chapter suggest that there is a continued concentration of immigration associated with race-ethnicity, country-of-origin groups, and those with high school educations or less that is occurring at the same time that internal migration is redistributing longer-term, native-born migrants to different metropolitan areas and to smaller communities as well as nonmetropolitan territory. The latter movement is, to a large degree, a function of more traditional labor market pushes and pulls, as well as amenities, that are not centered in the same port-of-entry areas in which immigrants are concentrating. However, a significant part of the native-born movement away from high-immigration metropolitan areas, among residents with a high school education or less, has been shown to be related to the levels of recent immigration in those areas when other factors are controlled. Thus, immigration would appear to exert both direct and indirect impacts on redistribution within the United States as a result of its concentration in selected areas and its secondary impact on net domestic out-migration from those areas. To the extent that it is the lower-skilled immigrants (with at most a high school education) who are most associated with both patterns, our results suggest that immigration policies that would select more highly educated immigrants might serve to alleviate immigrant concentration as well as the selective demographic displacement of the native born by immigrants that has been observed over the 1985–1995 period.
Beyond the immediate implications that these concentration and selective displacement patterns hold for local economies and the employment options for less-skilled native-born workers, our findings also suggest that there are broader implications associated with the changing social demographics of high-immigration areas and with the likely widening demographic disparities between areas of high immigration and other parts of the country. More bifurcated race-class labor force structures, the changing demographic profiles of child poverty populations, and widening race-ethnic disparities across state populations are just a few of the social demographic consequences that can result from a con-
TABLE 10-8 1995 Demographic Profiles by Native-Born and Minority Status: Los Angeles CMSA, New York CMSA, the 10 High-Immigration Metro Areas (combined), and Rest of the U.S. Population
|
PERCENT FOREIGN BORN-1995 |
PERCENT MINORITIES*—1995 |
|||||||
|
LA Metro |
NY Metro |
High Immig. Metros |
Rest of U.S. |
LA Metro |
NY Metro |
High Immig. Metros |
Rest of U.S. |
|
|
Education** |
||||||||
|
College Graduate |
21 |
20 |
20 |
8 |
23 |
17 |
19 |
11 |
|
Some College |
25 |
23 |
21 |
5 |
33 |
26 |
28 |
13 |
|
High School Graduate |
21 |
24 |
18 |
4 |
41 |
36 |
36 |
18 |
|
Less Than High School |
56 |
38 |
38 |
7 |
71 |
49 |
56 |
23 |
|
Family Income# |
||||||||
|
Top 25% |
23 |
15 |
17 |
5 |
34 |
20 |
34 |
10 |
|
Second 25% |
34 |
29 |
25 |
4 |
51 |
35 |
51 |
14 |
|
Third 25% |
47 |
34 |
34 |
6 |
63 |
42 |
63 |
19 |
|
Bottom 25% |
61 |
47 |
45 |
9 |
75 |
56 |
75 |
31 |
|
Age |
||||||||
|
Age 18–24 |
44 |
23 |
27 |
6 |
71 |
44 |
54 |
24 |
|
Age 25–34 |
46 |
29 |
30 |
7 |
63 |
44 |
48 |
22 |
|
Age 35–44 |
38 |
30 |
28 |
6 |
52 |
36 |
40 |
19 |
|
Age 45–64 |
33 |
30 |
26 |
6 |
42 |
33 |
35 |
15 |
|
Age 65+ |
24 |
25 |
22 |
5 |
29 |
18 |
23 |
12 |
|
Occupations-Men# # |
||||||||
|
Mgr & Prof. |
19 |
20 |
17 |
5 |
27 |
18 |
21 |
10 |
|
Clerical & Sales |
31 |
23 |
22 |
4 |
47 |
32 |
36 |
14 |
|
Service |
55 |
36 |
40 |
7 |
72 |
51 |
59 |
27 |
|
Prec. Prod. |
48 |
30 |
30 |
5 |
57 |
30 |
40 |
14 |
|
Blue Collar |
58 |
41 |
40 |
7 |
76 |
52 |
60 |
23 |
|
Occupations-Women# # |
||||||||
|
Mgr & Prof. |
20 |
18 |
16 |
4 |
32 |
24 |
26 |
12 |
|
Clerical & Sales |
22 |
17 |
17 |
3 |
44 |
33 |
36 |
16 |
|
Service |
51 |
41 |
38 |
6 |
74 |
56 |
58 |
26 |
|
Prec. Prod. |
52 |
65 |
41 |
6 |
74 |
43 |
54 |
21 |
|
Blue Collar |
71 |
66 |
53 |
8 |
78 |
62 |
64 |
26 |
|
Total Ages 18+ |
38 |
28 |
27 |
6 |
51 |
35 |
40 |
18 |
|
SOURCE: Compiled by author from US Census Bureau 1995 Current PopulationSurvey data (Note: Area definitions for these metro areas are consistentwith OMB June, 1990 standards) * Population not identified as Non-Latino White ** Ages 25–64 # Persons ages 18 and above # # Ages 16 and above |
||||||||
tinuation of current immigration and internal migration dynamics (Frey, 1997a, 1997b; Frey and Liaw, 1998). The emerging social demographic patterns hold important implications for the nation's social and political geography and deserve further examination and study as consequences of current immigration policies.
APPENDIX A
THE NESTED LOGIT MODEL OF INTERSTATE MIGRATION: METHODOLOGY AND FINDINGS
A two-level nested logit model of interstate migration is applied in this study to the 1985–1990 interstate migration data to assess the effects of low-skilled immigration on U.S.-born Americans with, at most, high school education. The estimated results of this model are an integral part of the impact analysis that is discussed in further detail in Appendix B and in the relevant section of the text. A useful feature of the nested logit model as applied to the current problem is its ability to identify separately the determinants of residents' departure from a state and those of migrants' destination choices. The first section below discusses the general methodology of this model. The second section presents the variables that are used to construct the model. The final section consists of Tables 10-A1 through 10-A6 that present the estimated coefficients for the departure submodel and destination choice submodel, respectively, for the specific age groups 25–29, 30–44, 45–64 as background for the discussion of this model's results in the text. These models are termed the "best models" because, on the basis of extensive preliminary analyses, they represent those in which variables retain sensible and statistically significant coefficients.
Nested Logit Model Methodology
The formulation of the two-level logit model is as follows. For a potential migrant with demographic attributes s and residing in state i, the migration behavior depends on (1) a departure probability p[i,s] at the upper level, and (2) a set of destination choice probabilities, p[j&2223;i,s] for all j not equal to i, at the lower level.6 Based on a set of reasonable assumptions, these probabilities then become functions of observable explanatory variables in the following two submodels (Kanaraglou et al., 1996).
|
6 |
The demographic attributes include detailed age (25–29, 30–34, …, 60–64), race (white, black, Asian, Hispanic, American Indian), educational attainment (below high school, high school graduation), poverty status (below or above the poverty line), and gender. |
Destination Choice Submodel
(A1)
where x[j,i,s] is a column vector of observable explanatory variables and b´ is a row vector of unknown coefficients.
Departure Submodel
p[i,s] = exp(d+c´y[i,s]+u*I[i,s]) / {1 + exp(d+c´y[i,s]+u*I[i,s])} (A2)
where y[i,s] is another column vector of observable explanatory variables; d, c´, and u are unknown coefficients, with u being bounded between 0 and 1; and I[s,i] is the so-called inclusive variable:
(A3)
where 1n is the natural log function.
Assuming that the migration behaviors of all persons in the same cell of the multidimensional migration table depend on the same set of p[i,s] and p[j&2223;i,s], we estimate the unknown coefficients in equations (A1) and (A2) sequentially by the maximum quasi-likelihood method (McCullagh, 1983; Liaw and Ledent, 1987).
Our choice of potentially useful explanatory variables to be considered for inclusion in the model is guided by (1) previous research findings in the literature, (2) the hypotheses we wish to test, and (3) extensive preliminary cross tabulations of the migration data. In constructing a relatively comprehensive model (to be called the best model for simplicity), we include only the explanatory variables that are statistically significant (i.e., those whose t ratios have a magnitude of at least 2.0) and substantively sensible. The data sources for these variables are described in Frey et al. (1996).
The goodness of fit of a given specification of a model is to be measured by
Rho-square = 1 - Lg/Lo, (A4)
where Lg is the maximum quasi-log-likelihood of the given specification and Lo is the maximum quasi-log-likelihood of the corresponding null model (i.e., the destination choice model with c´=0 or the departure model with c´=0). Note that the ceiling of Rho-square is much less than 1.0 so that a value of 0.2 may indicate a very good fit (McFadden, 1974). Another indicator of goodness of fit is
Weighted R-square = 1 - Sg/Sn, (A5)
where Sg is the weighted residual mean square of the given specification, and Sn is the weighted residual mean square of the null model (Liaw and Ledent, 1987). Although the value of weighted R-square tends to be much larger than that of
Rho-square, we choose Rho-square over weighted R-square because we found that the former is more sensitive to changes in the combinations of explanatory variables.
To help evaluate the relative importance of one subset of explanatory variables (say conventional labor market variables) against another subset (say variables representing the effects of foreign immigration), we delete the two subsets of variables in turn from the best model and then compare the resulting decreases in Rho-square: the greater the decrease, the more important the deleted subset of variables.
Definition of the Explanatory Variables used in this Analysis
Explanatory Variables in the Destination Model
Low-skilled Immigration Rate For each potential destination, this variable is obtained by dividing the state-specific number of 1985–1990 foreign-born immigrants with high school education or less, aged 15–64, by the 1985 state population, aged 15–64. The unit is "percent per 5 years."
Income This is the income per capita of a potential destination computed in the following way. First, we adjust the state-specific 1985 and 1989 nominal per capita incomes by the corresponding state-specific cost of living indices of the same years. Second, the 1985 and 1989 adjusted values are then averaged. The unit is $10,000 per person.
Total Employment Growth For each potential destination, this variable is the state-specific 1985–1989 growth of total civilian employment divided by the 1985 total civilian employment. The unit is "proportion per 4 years."
Service Employment Growth For each potential destination, this variable is the state-specific 1985–1989 growth of service employment divided by the 1985 service employment. The unit is "proportion per 4 years."
Unemployment Rate This is the 1985 unemployment rate of a potential destination state. The unit is proportion. Instead of the average value of the 1985 –1989 period, we use the 1985 value for the unemployment rate because we believe that among the three labor market variables, it is more subject to the feedback effect of migration.
AFDC and Food Stamp Benefit For each potential destination, this variable is computed in the following way. First, the state-specific 1985 and 1989 nominal values of the combined AFDC and food stamp benefits per recipient family are adjusted by the corresponding 1985 and 1989 cost of living indices, respectively. Second, the adjusted 1985 and 1989 values are then averaged. The unit is $10,000 per family per year.
Coldness For each potential destination, this variable is defined as a weighted average of the heating degree days of cities with records from 1951 to 1980, using city populations as the weights. The unit is 1,000 degree (F) days.
Hotness For each potential destination, this variable is defined as a weighted average of the cooling degree days of cities with records from 1951 to 1980, using city populations as the weights. The unit is 1,000 degree (F) days.
Violent Crime Rate For each potential destination, this variable is the average of state-specific 1985 and 1989 violent crime rates. The unit is cases per 1,000 residents.
Ln(Distance) This variable is the natural log of the population gravity centers of origin and destination states. The unit is 1n(miles).
Contiguity For each potential destination, this is a dummy variable assuming the value of 1 if it shares a common border with the state of origin.
Racial Similarity For the migrants of a specific race, this is the logit of the specific race's proportional share of the potential destination's population in 1985, computed indirectly from the data of the 1990 Census.
Ln(Population Size) For each potential destination, this variable is the natural log of the state-specific 1985 population computed indirectly from the data of the 1990 Census. The unit is Ln(1,000,000 persons).
Explanatory Variables in the Departure Choice Model
All the explanatory variables in the departure choice model that have the same names as those in the destination model are defined in the same way, except that the state in question is the origin rather than a potential destination.
Returning Immigration Rate of U.S.-Born Persons For each origin, this variable is obtained by dividing the state-specific number of 1985–1990 U.S.-born immigrants by the 1985 state population. Because the data come from the 1990 census, individuals less than five years old in 1990 are excluded from both numerator and denominator. The unit is ''percent per 5 years."
Non-Native's Share of State Population For each origin, this variable is computed from the data of the 1980 and 1990 censuses in the following way. First, the 1980 and 1990 state-specific numbers of non-natives (i.e., those who were born in other states in the United States) were divided by the corresponding total populations of the state. Second, the two resulting figures are then averaged and transformed into
a logit. The reasons for using this variable are (1) that it is well known that non-natives are more migratory than natives (Long, 1988), and (2) that our multidimensional migration table does not have the non-native/native distinction.
Armed Forces' Share of State Employment For each origin, this variable is computed from the data of the 1980 and 1990 censuses in the following way. First, the 1980 and 1990 gender- and state-specific employments in the armed forces were divided by the corresponding total employment. Second, the two resulting figures are then averaged and transformed into a logit. The reasons for using this variable are (1) that members of the armed forces are expected to be more migratory than their civilian counterparts, and (2) that our multidimensional migration table does not have a military/civilian distinction.
Inclusive Variable For each origin, this variable represents the attractiveness of the rest of the United States. Its values are computed according to equation (A3), using the estimated coefficients of the best destination choice model.
TABLE 10-A1 Estimation Result of the Departure Model for U.S.-born Interstate Migrants of the 25–29 Age Group with at most High School Education: 1985–1990
|
Best Specification |
Marginal Contribution to the Rho-square |
||
|
Explanatory Variable |
Coefficient |
T-ratio |
|
|
Constant Term |
-1.74 |
-14.5 |
|
|
1. PUSH EFFECTS OF FOREIGN-BORN IMMIGRANTS |
0.0056 |
||
|
Low-skilled Immigration Rate* White |
0.30 |
20.3 |
|
|
Low-skilled Immigration Rate* Black |
0.16 |
6.2 |
|
|
Low-skilled Immigration Rate* Indian |
0.18 |
2.9 |
|
|
Low-skilled Immigration Rate* Poor White |
0.15 |
9.3 |
|
|
Low-skilled Immigration Rate* Poor Black |
0.08 |
2.1 |
|
|
Low-skilled Immigration Rate* Poor Hispanic |
0.15 |
2.7 |
|
|
2. PUSH EFFECTS OF US-BORN IMMIGRANTS |
|||
|
Returning Immigration Rate of US-Born Persons |
0.67 |
11.2 |
|
|
3. RETAINING EFFECTS OF WELFARE |
0.0018 |
||
|
AFDC&Foodstamp*Poor Black Females |
-1.37 |
-12.5 |
|
|
AFDC&Foodstamp*Poor Hispanic Females |
-0.49 |
-2.9 |
|
|
AFDC&Foodstamp*Poor Indian Females |
-1.52 |
-6.4 |
|
|
4. EFFECTS OF LABOR MARKET VARIABLES |
0.0060 |
||
|
Income |
-1.20 |
-10.3 |
|
|
Income* High School Graduate |
-0.41 |
-9.4 |
|
|
Civilian Employment Growth |
-1.46 |
-4.3 |
|
|
Service Employment Growth |
-2.40 |
-7.3 |
|
|
Service Employment Growth * Below High School |
-1.55 |
-4.8 |
|
|
5. RETENTION EFFECTS OF RACIAL SIMILARITY |
0.0026 |
||
|
Racial Similarity*Black |
-0.23 |
-10.7 |
|
|
Racial Similarity*Asian |
-0.44 |
-9.3 |
|
|
Racial Similarity*Hispanic |
-0.33 |
-15.1 |
|
|
Racial Similarity*Am. Indian |
-0.30 |
-10.4 |
|
|
6. EFFECTS OF PHYSICAL ENVIRONMENT |
0.0007 |
||
|
Coldness of Winter |
0.10 |
7.0 |
|
|
Hotness of Summer |
0.19 |
8.5 |
|
|
7. RETENTION EFFECT OF SIZE OF ECUMENE |
|||
|
Ln (Population Size) |
-0.08 |
-4.0 |
|
|
8. EFFECTS OF EDUCATION SELECTIVITY |
|||
|
High School Graduate |
— |
— |
|
|
9. EFFECTS OF POPULATION COMPOSITIONS |
|||
|
Non-Native's Share of State Population |
2.45 |
17.5 |
|
|
Armed Forces' Share of State Employment |
2.12 |
7.1 |
|
|
10. DRAWING POWER OF THE REST OF SYSTEM |
0.0020 |
||
|
Inclusive Variable |
0.36 |
14.2 |
|
|
Rho-Square |
0.0275 |
||
TABLE 10-A2 Estimation Result of the Departure Model for U.S.-born Interstate Migrants of the 30–44 Age Group with At Most High School Education: 1985–1990
|
Best Specification |
Marginal Contribution to the Rho-square |
||
|
Explanatory Variable |
Coefficient |
T-ratio |
|
|
Constant Term |
-3.04 |
-21.3 |
|
|
1. PUSH EFFECTS OF FOREIGN-BORN IMMIGRANTS |
0.0058 |
||
|
Low-skilled Immigration Rate* White |
0.31 |
30.2 |
|
|
Low-skilled Immigration Rate* Black |
0.24 |
14.2 |
|
|
Low-skilled Immigration Rate* Asian |
0.16 |
2.9 |
|
|
Low-skilled Immigration Rate* Hispanic |
0.07 |
3.3 |
|
|
Low-skilled Immigration Rate* Indian |
0.15 |
3.7 |
|
|
Low-skilled Immigration Rate* Poor White |
0.23 |
24.1 |
|
|
Low-skilled Immigration Rate* Poor Black |
0.16 |
7.1 |
|
|
Low-skilled Immigration Rate* Poor Hispanic |
0.23 |
6.7 |
|
|
Low-skilled Immigration Rate* Poor Indian |
0.25 |
4.0 |
|
|
2. PUSH EFFECTS OF US-BORN IMMIGRANTS |
|||
|
Returning Immigration Rate of US-Born Persons |
0.61 |
16.0 |
|
|
3. RETAINING EFFECTS OF WELFARE |
0.0012 |
||
|
AFDC&Foodstamp*Poor Black Females |
-1.14 |
-18.1 |
|
|
AFDC&Foodstamp*Poor Hispanic Females |
-0.30 |
-2.7 |
|
|
AFDC&Foodstamp*Poor Indian Females |
-1.57 |
-9.7 |
|
|
4. EFFECTS OF LABOR MARKET VARIABLES |
0.0063 |
||
|
Income |
-0.79 |
-7.9 |
|
|
Income*High School Graduate |
-0.39 |
-4.8 |
|
|
Civilian Employment Growth |
-1.63 |
-7.6 |
|
|
Service Employment Growth |
-3.22 |
-14.7 |
|
|
Service Employment Growth * Below High School |
-0.77 |
4.2 |
|
|
Unemployment |
1.48 |
3.2 |
|
|
Best Specification |
Marginal Contribution to the Rho-square |
||
|
Explanatory Variable |
Coefficient |
T-ratio |
|
|
5. RETENTION EFFECTS OF RACIAL SIMILARITY |
0.0020 |
||
|
Racial Similarity*Black |
-0.21 |
-15.1 |
|
|
Racial Similarity*Asian |
-0.41 |
-11.9 |
|
|
Racial Similarity*Hispanic |
-0.34 |
-23.6 |
|
|
Racial Similarity*Am. Indian |
-0.37 |
-20.6 |
|
|
6. EFFECTS OF PHYSICAL ENVIRONMENT |
0.0009 |
||
|
Coldness of Winter |
0.11 |
12.9 |
|
|
Coldness of Winter*Aged 40–44 |
0.02 |
3.5 |
|
|
Hotness of Summer |
0.25 |
17.2 |
|
|
7. RETENTION EFFECT OF SIZE OF ECUMENE |
|||
|
Ln (Population Size) |
-0.08 |
-6.9 |
|
|
8. EFFECTS OF AGE & EDUCATION SELECTIVITY |
|||
|
Aged 35–39 |
-0.14 |
-11.6 |
|
|
Aged 40–44 |
-0.34 |
-12.6 |
|
|
High School Graduation |
0.36 |
3.0 |
|
|
9. EFFECTS OF POPULATION COMPOSITIONS |
|||
|
Non-Native's Share of State Population |
2.61 |
31.3 |
|
|
Armed Forces' Share of State Em.* Aged 30–34 |
0.61 |
3.3 |
|
|
10. DRAWING POWER OF THE REST OF SYSTEM |
0.0015 |
||
|
Inclusive Variable |
0.43 |
22.5 |
|
|
Rho-Square |
0.0278 |
||
TABLE 10-A3 Estimation Result of the Departure Model for U.S.-born Interstate Migrants of the 45–64 Age Group with At Most High School Education: 1985–1990
|
Best Specification |
Marginal Contribution to the Rho-square |
||
|
Explanatory Variable |
Coefficient |
T-ratio |
|
|
Constant Term |
-4.82 |
-47.2 |
|
|
1. PUSH EFFECTS OF FOREIGN-BORN IMMIGRANTS |
0.0059 |
||
|
Low-skilled Immigration Rate* White |
0.32 |
30.3 |
|
|
Low-skilled Immigration Rate* Black |
0.24 |
12.9 |
|
|
Low-skilled Immigration Rate *Hispanic |
0.08 |
3.3 |
|
|
Low-skilled Immigration Rate* Indian |
0.10 |
2.0 |
|
|
Low-skilled Immigration Rate* Poor White |
0.27 |
25.5 |
|
|
Low-skilled Immigration Rate* Poor Black |
0.26 |
9.4 |
|
|
Low-skilled Immigration Rate* Poor Hispanic |
0.35 |
7.5 |
|
|
Low-skilled Immigration Rate*Poor Indian |
0.37 |
4.8 |
|
|
2. PUSH EFFECTS OF US-BORN IMMIGRANTS |
|||
|
Returning Immigration Rate of US-Born Persons |
0.12 |
2.8 |
|
|
3. RETAINING EFFECTS OF WELFARE |
0.0010 |
||
|
AFDC&Foodstamp*Poor Black Females |
-1.06 |
-13.0 |
|
|
AFDC&Foodstamp*Poor Asian Females |
-2.54 |
-4.1 |
|
|
AFDC&Foodstamp*Poor Hispanic Females |
-1.96 |
-10.8 |
|
|
AFDC&Foodstamp*Poor Indian Females |
-2.65 |
-11.4 |
|
|
4. EFFECTS OF LABOR MARKET VARIABLES |
0.0029 |
||
|
Income*High School Graduate |
-0.35 |
-5.2 |
|
|
Civilian Employment Growth |
-1.90 |
-8.3 |
|
|
Service Employment Growth |
-2.09 |
-9.3 |
|
|
Unemployment |
3.08 |
8.0 |
|
|
Best Specification |
Marginal Contribution to the Rho-square |
||
|
Explanatory Variable |
Coefficient |
T-ratio |
|
|
5. RETENTION EFFECTS OF RACIAL SIMILARITY |
0.0013 |
||
|
Racial Similarity*White |
-0.05 |
-4.4 |
|
|
Racial Similarity*Black |
-0.10 |
-4.9 |
|
|
Racial Similarity*Asian |
-0.38 |
-10.1 |
|
|
Racial Similarity*Hispanic |
-0.28 |
-13.4 |
|
|
Racial Similarity*Am. Indian |
-0.36 |
-17.2 |
|
|
6. EFFECTS OF PHYSICAL ENVIRONMENT |
0.0016 |
||
|
Coldness of Winter |
0.12 |
13.3 |
|
|
Coldness of Winter*Aged 50–54 |
0.02 |
2.2 |
|
|
Coldness of Winter*Aged 55–59 |
0.05 |
6.4 |
|
|
Coldness of Winter*Aged 60–64 |
0.08 |
11.9 |
|
|
Hotness of Summer |
0.21 |
14.3 |
|
|
7. RETENTION EFFECT OF SIZE OF ECUMENE |
|||
|
Ln (Population Size) |
-0.06 |
-5.5 |
|
|
8. EFFECTS OF AGE & EDUCATION SELECTIVITY |
|||
|
Aged 50–54 |
-0.20 |
-6.1 |
|
|
Aged 55–59 |
-0.47 |
-13.7 |
|
|
Aged 60–64 |
-0.71 |
-20.2 |
|
|
High School Graduation |
0.32 |
3.1 |
|
|
9. EFFECTS OF POPULATION COMPOSITIONS |
|||
|
Non-Native's Share of State Population |
2.46 |
30.5 |
|
|
10. DRAWING POWER OF THE REST OF SYSTEM |
0.0012 |
||
|
Inclusive Variable |
0.41 |
19.8 |
|
|
Rho-Square |
0.0188 |
||
TABLE 10-A4 Estimation Result of Destination Choice Model for U.S.-born Interstate Migrants in the 25–29 Age Group with At Most High School Education: 1985–1990
|
Best Specification |
Marginal Contribution to the Rho-square |
||
|
Explanatory Variable |
Coefficient |
T-ratio |
|
|
1. EFFECTS OF FOREIGN-BORN IMMIGRANTS |
0.0010 |
||
|
Low-skilled Immigration Rate* |
0.09 |
14.5 |
|
|
Low-skilled Immigration Rate* Poor White |
-0.19 |
-14.8 |
|
|
Low-skilled Immigration Rate* Poor Black |
-0.21 |
-8.9 |
|
|
Low-skilled Immigration Rate* Poor Hispanic |
-0.25 |
-7.4 |
|
|
Low-skilled Immigration Rate* Poor Indian |
-0.43 |
-7.1 |
|
|
2. EFFECTS OF AFDC & FOODSTAMP BENEFITS |
0.003 |
||
|
AFDC Benefit* Poor Female |
0.82 |
5.7 |
|
|
AFDC Benefit* Poor Black Female |
1.77 |
5.6 |
|
|
AFDC Benefit* Poor Indian Female |
3.15 |
4.0 |
|
|
3. EFFECTS OF LABOR MARKET VARIABLES |
0.0072 |
||
|
Income |
0.13 |
2.1 |
|
|
Income*High School Education |
0.47 |
6.9 |
|
|
Civilian Employment Growth |
1.76 |
11.6 |
|
|
Service Employment Growth |
3.18 |
21.9 |
|
|
Service Employment Growth* Less Than High School Ed. |
0.36 |
2.1 |
|
|
4. EFFECTS OF RACIAL ATTRACTIONS |
0.0072 |
||
|
Racial Similarity* |
0.27 |
29.5 |
|
|
Racial Similarity*Black |
0.11 |
6.5 |
|
|
Racial Similarity*Asian |
0.41 |
4.9 |
|
|
Racial Similarity*Hispanic |
0.12 |
5.8 |
|
|
Racial Similarity*Indian |
0.29 |
10.0 |
|
|
Racial Similarity* Less Than High School Education |
-0.06 |
-5.6 |
|
|
Racial Similarity*Hispanic*Less Than High School Ed. |
0.17 |
5.7 |
|
|
5. EFFECTS OF DISTANCE AND CONTIGUITY |
|||
|
Ln (Distance) |
-0.6 |
-74.0 |
|
|
Ln (Distance)* Less Than High School Education Contiguity |
0.67 |
49.2 |
|
|
6. EFFECTS OF SOCIAL & PHYSICAL ENVIRONMENT |
0.0020 |
||
|
Violent Crime Rate |
-2.87 |
-10.8 |
|
|
Coldness of Winter |
-0.17 |
-46.7 |
|
|
7. EFFECT OF ECUMENE SIZE |
|||
|
Ln (Population Size) |
0.76 |
122.3 |
|
|
Rho-Square |
0.1545 |
||
TABLE 10-A5 Estimation Result of Destination Choice Model for U.S.-born Interstate Migrants in the 30–44 Age Group with At Most High School Education: 1985–1990
|
Best Specification |
Marginal Contribution to the Rho-square |
||
|
Explanatory Variable |
Coefficient |
T-ratio |
|
|
1. EFFECTS OF FOREIGN-BORN IMMIGRANTS |
0.0006 |
||
|
Low-skilled Immigration Rate* |
0.05 |
10.1 |
|
|
Low-skilled Immigration Rate* Poor White |
-0.16 |
-16.8 |
|
|
Low-skilled Immigration Rate* Poor Black |
-0.16 |
-9.3 |
|
|
Low-skilled Immigration Rate* Poor Hispanic |
-0.25 |
-9.4 |
|
|
Low-skilled Immigration Rate* Poor Indian |
-0.51 |
-10.6 |
|
|
2. EFFECTS OF AFDC & FOODSTAMP BENEFITS |
0.0001 |
||
|
AFDC Benefit* Poor Female |
0.31 |
2.8 |
|
|
AFDC Benefit* Poor Black Female |
1.53 |
6.1 |
|
|
AFDC Benefit* Poor Indian Female |
3.35 |
5.9 |
|
|
3. EFFECTS OF LABOR MARKET VARIABLES |
0.0075 |
||
|
Income |
0.47 |
14.8 |
|
|
Civilian Employment Growth |
2.18 |
19.2 |
|
|
Service Employment Growth |
3.00 |
29.6 |
|
|
4. EFFECTS OF RACIAL ATTRACTIONS |
0.0071 |
||
|
Racial Similarity* |
0.30 |
46.6 |
|
|
Racial Similarity* Black |
0.06 |
4.3 |
|
|
Racial Similarity* Asian |
0.27 |
3.9 |
|
|
Racial Similarity* Hispanic |
0.12 |
6.8 |
|
|
Racial Similarity* American Indian |
0.24 |
11.2 |
|
|
Racial Similarity* Less Than High School Education |
0.05 |
2.2 |
|
|
5. EFFECTS OF DISTANCE AND CONTIGUITY |
|||
|
Ln (Distance) |
-0.72 |
-109.6 |
|
|
Ln (Distance)* Less Than High School Education |
-0.07 |
-8.5 |
|
|
Contiguity |
0.73 |
73.2 |
|
|
6. EFFECTS OF SOCIAL & PHYSICAL ENVIRONMENT |
0.0071 |
||
|
Violent Crime Rate |
-1.22 |
-6.2 |
|
|
Coldness of Winter |
-0.20 |
-61.9 |
|
|
Coldness of Winter* Aged 35–39 |
-0.02 |
-6.9 |
|
|
Coldness of Winter* Aged 40–44 |
-0.07 |
-16.9 |
|
|
7. EFFECT OF ECUMENE SIZE |
|||
|
Ln (Population Size) |
0.71 |
157.5 |
|
|
Rho-Square |
0.1655 |
||
TABLE 10-A6 Estimation Result of Destination Choice Model for U.S.-born Interstate Migrants in the 45–64 Age Group with At Most High School Education: 1985–1990
|
Best Specification |
Marginal Contribution to the Rho-square |
||
|
Explanatory Variable |
Coefficient |
T-ratio |
|
|
1. EFFECTS OF FOREIGN-BORN IMMIGRANTS |
0.0010 |
||
|
Low-skilled Immigration Rate* Poor White |
-0.20 |
-14.2 |
|
|
Low-skilled Immigration Rate* Poor Black |
-0.35 |
-11.4 |
|
|
Low-skilled Immigration Rate* Poor Asian |
-0.43 |
-1.8 |
|
|
Low-skilled Immigration Rate* Poor Hispanic |
-0.58 |
-10.2 |
|
|
Low-skilled Immigration Rate* Poor Indian |
-0.72 |
-8.2 |
|
|
2. EFFECTS OF AFDC & FOODSTAMP BENEFITS |
0.0002 |
||
|
AFDC Benefit* Poor Female |
0.31 |
1.7 |
|
|
AFDC Benefit* Poor Black Female |
1.90 |
4.3 |
|
|
AFDC Benefit* Poor Asian Female |
8.15 |
2.4 |
|
|
AFDC Benefit* Poor Hispanic Female |
4.05 |
4.7 |
|
|
AFDC Benefit* Poor Indian Female |
6.12 |
6.1 |
|
|
3. EFFECTS OF LABOR MARKET VARIABLES |
0.0156 |
||
|
Income |
0.78 |
22.3 |
|
|
Civilian Employment Growth |
3.05 |
19.3 |
|
|
Service Employment Growth |
2.24 |
12.5 |
|
|
Service Employment Growth* Aged 50–54 |
0.46 |
2.2 |
|
|
Service Employment Growth* Aged 55–59 |
1.40 |
6.6 |
|
|
Service Employment Growth* Aged 60–64 |
2.39 |
11.5 |
|
|
4. EFFECTS OF RACIAL ATTRACTIONS |
0.0101 |
||
|
Racial Similarity* |
0.50 |
66.1 |
|
|
Racial Similarity* Black |
-0.12 |
-6.0 |
|
|
5. EFFECTS OF DISTANCE AND CONTIGUITY |
|||
|
Ln (Distance) |
-0.68 |
-65.7 |
|
|
Ln (Distance) * Less Than High School Education |
-0.12 |
-11.8 |
|
|
Ln (Distance)* Aged 55–59 |
-0.03 |
2.4 |
|
|
Ln (Distance)* Aged 60–64 |
0.09 |
6.8 |
|
|
Contiguity |
0.78 |
55.6 |
|
|
6. EFFECTS OF PHYSICAL ENVIRONMENT |
0.0298 |
||
|
Coldness of Winter |
-0.36 |
-73.6 |
|
|
Coldness of Winter* Aged 50–54 |
-0.03 |
-5.5 |
|
|
Coldness of Winter* Aged 55–59 |
-0.09 |
-13.5 |
|
|
Coldness of Winter* Aged 60–64 |
-0.14 |
-22.6 |
|
|
7. EFFECTS OF ECUMENE SIZE |
|||
|
Ln (Population Size) |
0.64 |
107.4 |
|
|
Rho-Square |
0.1961 |
||
APPENDIX B
METHODOLOGY FOR IMMIGRATION IMPACT ANALYSIS
Our objective with this impact analysis is to evaluate the impacts of changes in the number of working-aged foreign-born immigrants with, at most, a high school education on the interstate migrations of U.S.-born Americans with, at most, a high school education. These impacts are determined on the basis of the best nested logit models (discussed in Appendix A) that have been constructed from the interstate migration data of the 1985–1990 period. Using the best nested logit models for the age groups 25–29, 30–44, and 45–64, respectively, as inputs, the immigration impact analyses will also be initially disaggregated for these same three age groups. They are later summed to assess the aggregate impact on the U.S.-born persons aged 25–64 with, at most, a high school education. The general methodology for this impact analysis is as follows.
For each of the 25–29, 30–44, and 45–64 age groups, let the estimated destination choice submodel of the best nested logit model be

(B1)
where p[j&2223;i,s] is the predicted proportion of the out-migrants of state i with the demographic attributes s who select state j as the destination; x[j,i,s] is a column vector of explanatory variables (e.g., the distance between i and j, or the racial similarity between the out-migrants from i and the population of the potential destination j); and b´ is a row vector of estimated parameters. Also let the estimated departure submodel be
p[i,s] = exp(d+c´y[i,s]+u*I[i,s]) / {1 + exp(d+c´y[i,s]+u*I[i,s])}, (B2)
where p[i,s] is the predicted proportion of the at-risk population of state I with the demographic attributes s who migrate to the rest of the United States; y[i,s] is another column vector of explanatory variables; d, c´, and u are estimated parameters; and I[i,s] is the estimated inclusive variable defined as
(B3)
where 1n is the natural log function.
In both submodels, the variable that allows immigration to impact on the interstate migration of the U.S.-born population is the ''low-skilled immigration rate." In the destination choice submodel, this variable is used not only by itself but also as interaction terms with the dummy variables representing the poor U.S.-born Americans with different racial backgrounds. In the departure
submodel, it is only used to form interaction terms involving the poverty status and racial backgrounds of the U.S.-born Americans.
To find the "expected net migration" before the number of immigrants is changed, we do the following. We first multiply (1) the at-risk population of each state that has been properly disaggregated according to the attribute vector s (age, race, education, poverty status, and gender) by (2) the product of p[i,s] and p[j&2223;i,s] to generate the origin-by-destination tables of predicted interstate migrants. The formula used is
M[i,j,s] = P[i,s] *p[i,s] *p[j&2223;i,s], j&2260;i, (B4)
where M[i,j,s] is the expected number of migrants with attributes s who move from state I to state j, and P[i,s] is the size of the population with attributes s whose initial state of residence is i. The expected number of in-migrants of each state is obtained from the formula
(B5)
Similarly, the expected number of out-migrants from each state is computed from the formula

(B6)
The expected net migration of each state is obtained from the formula
N[i] = M[.,I] - M[i,.]. (B7)
To study the impact of a change in the national immigration level on interstate migrations, we change each state's assumed value for the variable's "low-skilled immigration rate" to estimate new values for the destination choice and departure submodels in equations (B1), (B2), and (B3) by the scaling factor (F):
F = {(IM[o] + IM[h]) / P[o]} / (IM[o]/P[o]), (B8)
where IM[o] is the original number of immigrants; IM[h] is the change in the number of immigrants; and P[o] is the size of the original at-risk population. The resulting values in equations (B1), (B2), and (B3) are then used in equations (B4) through (B7) to compute the new expected net migration due to the change in immigration.
The impact is then computed as (1) the expected net migration after the change in immigration minus (2) the expected net migration before the change. These computations are done separately for the 25–29, 30–44, and 45–64 age groups. The results are then aggregated to obtain the impacts on the 25– 64 age interval. Implicit in this method is the assumption that the change in immigra-
tion is achieved by the same proportional change in all states' immigration rates.
To study the impact of a change in only California's immigration, we apply the scaling factor from equation (B8) only to California's value of the immigration variable, keeping the values of the variable for all other states unchanged.
The changes in immigration in our simulations involve the following four scenarios.
Scenario I-A. Reduction of the National Number of Immigrants by Approximately One-half
We reduce the national level of immigration by approximately 50 percent (actually 48.85%), which is equivalent to reducing the number of working-aged (age 15–64) immigrants by 1,600,000 and the number of working-aged low-skilled immigrants by 957,000. This translates into scaling the "low-skilled immigration rate" (B8) by a factor of 0.511534.
Scenario II-A. Increase of the National Number of Immigrants by Approximately One-half
We increase the national level of immigration by approximately 50 percent (actually 51.15%), which is equivalent to increasing the number of working-aged (age 15–64) immigrants by 1,600,000 and the number of working-aged low-skilled immigrants by 957,000. This translates into scaling the "low-skilled immigration rate" (B8) by a factor of 1,488466.
Scenario I-B. Reduction of California's Immigrants by Approximately One-half
We reduce California's immigration by approximately 50 percent (actually 52.28%), which is equivalent to reducing the number of California's working-aged (age 15–64) immigrants by 400,000 and the number of California's working-aged low-skilled immigrants by 194,902. This translates into scaling only California's "low-skilled immigration rate" by a factor of 0.47176 (B8).
Scenario II-B. Increase of California's Immigrants by Approximately One-half
We increase California's immigration by approximately 50 percent (actually 47.17%), which is equivalent to increasing the number of California's work-
ing-aged low-skilled immigrants by 194,902. This translates into scaling only California's "low-skilled immigration rate" by a factor of 1.52824 (B8).
ACKNOWLEDGMENTS
This research is funded by the National Institute of Child Health and Human Development project, "The Changing Structure of US Metropolitan Migration" (No. R01-HD297525). We are grateful to Yu Xie, collaborator on this project, for his advice and contributions. We also appreciate the collaboration of Ji-Ping Lin in carrying out the impact analysis. Cathy Sun performed computer programming and Ron Lue Sang prepared maps and graphics.
REFERENCES
Barff, Richard, Mark Ellis, and Michael Reibel 1995. "The Links between Immigration and Internal Migration in the United States: A Comparison of the 1970s and 1980s." Working Paper Series No. 1 Dartmouth College, Hanoover, N.H.: Nelson A. Rockefeller Center for the Social Sciences.
Bartel, Ann P. 1989. "Where Do the New Immigrants Live?" Journal of Labor Economics 7(4):371–391.
Bartel, Ann P., and Marianne J. Koch 1991. "Internal Migration of U.S. Immigrants." Pp. 121–134 in Immigration Trade and the Labor Market, J.M. Abowd and R.B. Freeman eds. Chicago: University of Chicago Press.
Bean, Frank D., and Marta Tienda 1987. The Hispanic Population of the United States. New York: Russell Sage Foundation.
Bolton, Nancy 1993. "Immigration, Migration and the Labor Force of California." UCLA Business Forecast (March).
Borjas, George J. 1994. "The Economics of Immigration." Journal of Economic Literature, 32:1667–1717.
Borjas, George J., Richard B. Freeman, and Lawrence F. Katz 1996. "Searching for the Effect of Immigration on the Labor Market." NBER Working Paper 5454. Cambridge, Mass.: National Bureau of Economic Research.
Bureau of the Census 1994. Population Projections for States by Age, Race and Sex, 1993 to 2020. Current Population Reports P25-1111. Washington, D.C.: U.S. Government Printing Office.
Center for the New West 1996. California: A Twenty-first Century Prospectus. Ontario, Calif.: Center for the New West.
Denton, Nancy, and Douglas S. Massey 1991. "Patterns of Neighborhood Transition in a Multi-ethnic World: US Metropolitan Areas, 1970–80." Demography 28:(1):41–63.
Espenshade, Thomas J., and Charles A. Calhoun 1993. "An Analysis of Public Opinion toward Undocumented Immigration." Population Research and Policy Review 12:189–224.
Filer, Randall K. 1992. "The Effect of Immigrant Arrivals on Migratory Patterns of Native Workers." Pp.245–270 in Immigration and the Work Force, George J. Borjas and Richard B. Freeman, eds. Chicago: University of Chicago Press.
Frey, William H. 1979. "The Changing Impact of White Migration on the Population Compositions of Origin and Destination Metropolitan Areas." Demography 16:(2):219–238.
Frey, William H. 1994. "The New White Flight." American Demographics April:40–48.
Frey, William H. 1995a. "Immigration and Internal Migration 'Flight': A California Case Study." Population and Environment 16(4):353–375.
Frey, William H. 1995b. "Immigration and Internal Migration 'Flight' from US Metropolitan Areas: Toward a New Demographic Balkanization." Urban Studies 32(4–5):733–757.
Frey, William H. 1995c. "Immigration Impacts on Internal Migration of the Poor: 1990 Census Evidence for US States." International Journal of Population Geography 1:5–67.
Frey, William H. 1996. "Immigration, Domestic Migration and Demographic Balkanization in America: New Evidence for the 1990s." Population and Development Review 22(4):741–763.
Frey, William H. 1997a. "Immigration, Welfare Magnets and the Geography of Child Poverty in the United States." Population and Environment 19(1):53–86.
Frey, William H. 1997b. "Emerging Demographic Balkanization: Toward One America or Two?" Research Report No. 97–410. Ann Arbor: University of Michigan, Population Studies Center.
Frey, William H., and Kao-Lee Liaw 1998. "Immigrant Concentration and Domestic Migrant Dispersal: Is Movement to Non-Metro Areas 'White Flight'?" The Professional Geographer 50(2).
Frey, William H., and Alden Speare 1988. Regional and Metropolitan Growth and Decline in the U.S. New York: Russell Sage.
Frey, William H., Kao-Lee Liaw, Yu Xie, and Marcia J. Carlson 1996. "Interstate Migration of the US Poverty Population: Immigration 'Pushes' and Welfare Magnet 'Pulls'." Population and Environment 17(6):491–538.
Fuguitt, Glenn V., and Calvin L. Beale 1995. "Recent Trends in Nonmetropolitan Migration: Toward a New Turnaround?" CDE Working Paper 95-07. Madison: University of Wisconsin, Center for Demography and Ecology.
Gabriel, Stuart A., Joe P. Mattey, and William L. Wascher 1995. "The Demise of California Reconsidered: Interstate Migration over the Economic Cycle." Economic Review, Federal Reserve Bank of California, 2:30–45.
Gober, Patricia 1993. "Americans on the Move." Population Bulletin. Washington, D.C: Population Reference Bureau.
Immigration and Naturalization Service 1996. 1994–5 Statistical Yearbook of the Immigration and Naturalization Service. Washington, D.C.: U.S. Government Printing Office.
Jennings, Diane 1994. "Job Seekers Making Tracks to Texas Again." The Dallas Morning News, September 5, p. 1.
Johnson, Hans, and Richard Lovelady 1995. Migration between California and Other States: 1985–1994. Sacramento: Demographic Research Unit, California Department of Finance.
Johnson, Kenneth M., and Calvin L. Beale 1995. "The Rural Rebound Revisited." American Demographics July:46–54.
Kanaraglou, P.K., L. Liaw, and Y.Y. Papageorgiou 1996. "An Analysis of Migrating Systems 2. Operational Framework." Environment and Planning 18:1039–1060.
Labich, Kenneth 1994. "The Geography of an Emerging America." The Survey of Regional Literature 28:23–28.
Lansing, John B., and Eva Mueller 1967. The Geographic Mobility of Labor. Ann Arbor, Mich.: Survey Research Center, Institute for Social Research.
Lee, Everett S. 1966. "A Theory of Migration." Demography 3:47–57.
Liaw, Kao-Lee 1990. "Joint Effects of Personal Factors and Ecological Variables on the Interprovincial Migration Pattern of Young Adults in Canada: A Nested Logit Analysis." Geographical Analysis 22(3):189–208.
Liaw, Kao-Lee, and Jacques Ledent 1987. "Nested Logit Model and Maximum Quasi Likelihood Method: A Flexible Methodology for Analyzing Interregional Migration Patterns." Regional Science and Urban Economics 17:67–88.
Liaw, Kao-Lee, and William H. Frey 1996. "Interstate Migration of American Young Adults in 1985–90: An Explanation Using the Nested Logit Model." Geographical Systems 3:301–334.
Liaw, Kao-Lee, and William H. Frey 1998. "Destination Choices of 1985–90 Young Adult Immigrants in the United States: Importance of Race, Education Attainment and Labor Market Forces." International Journal of Population Geography 4(1).
Liaw, Kao-Lee, and Atsushi Otomo 1991. "Inter-prefectoral Migration Patterns of Young Adults in Japan: An Explanation Using a Nested Log and Model." Journal of Population Studies (Japan) (14):1–20.
Liaw, Kao-Lee, Ji-Ping Lin, and William H. Frey 1996. "Impacts of Low-skilled Immigration on the Internal Migration of Low-skilled Persons in the United States: An Assessment in a Multivariate Context." Hamilton, Ontario: McMaster University, Department of Geography.
Lieberson, Stanley 1963. Ethnic Patterns in American Cities. New York: The Free Press.
Long, Larry 1988. Migration and Residential Mobility in the United States. New York: Russell Sage.
Long, Larry H., and Alfred Nucci 1995. "Spatial and Demographic Dynamics of Metropolitan and Nonmetropolitan Territory in the United States." The International Journal of Population Geography 1(2):165–182.
Longino, Charles F., Jr. 1995. Retirement Migration in America. Houston: Vacation Publications.
Manson, Donald M., Thomas J. Espenshade, and Thomas Muller 1985. "Mexican Immigration to Southern California: Issues of Job Competition and Worker Mobility." The Review of Regional Studies 15 (Spring):21–33.
Martin, Philip 1995. "Proposition 187 in California." International Migration Review 29:255–263.
Martin, Philip, and Elizabeth Midgley 1994. "Immigration to the United States: Journey to an Uncertain Destination . Population Bulletin, Vol. 49, No. 2. Washington, D.C.: Population Reference Bureau.
Martin, Susan Forbes 1993. "The Commission on Immigration Reform." Migration World XXI(2):43–44.
Massey, Douglas S., and Nancy Denton 1993. American Apartheid. Cambridge, Mass.: Harvard University Press.
Massey, Douglas S., Joaquin Arango, Graeme Hugo, Ali Kouaouci, Adela Pellegrino, and J. Edward Taylor 1994. "An Evaluation of International Migration Theory: The North American Case." Population and Development Review 20(4):699–751.
McCullagh, P. 1983. "Quasi-Likelihood Functions. The Annals of Statistics 11:59–67.
McFadden, D. 1974. "Conditional Logit Analysis of Qualitative Choice Behavior." In Frontiers in Econometrics, P. Zarembka, ed. New York: Academic Press.
McHugh, Kevin E. 1989. "Hispanic Migration and Population Redistribution in the United States." Professional Geographer 41(4):429–439.
Miller, Glenn H., Jr. 1994. "People on the Move: Trends and Prospects in District Migration Flows." Economic Review, Federal Reserve Bank of Kansas City, Third Quarter, pp. 39–54.
Mollenkopf, John H., and Manuel Castells, eds. 1991. Dual City: Restructuring New York. New York: Russell Sage.
Newbold, K. Bruce, and Kao-Lee Liaw 1994. "Return and Onward Interprovincial Migration through Economic Boom and Bust in Canada: from 1976–1981 to 1981–1986." Geographical Analysis 26:228–245.
Newman, Kristen E., and Marta Tienda 1994. "The Settlement and Secondary Migration Patterns of Legalized Immigrants: Insights from Administrative Records. Pp. 157–226 in Immigration and Ethnicity, B. Edmonston and J.S. Passel, eds. Washington, D.C.: The Urban Institute Press.
Nogle, June Marie 1996. "Immigrants on the Move: How Internal Migration Increases the Concentration of the Foreign Born." Backgrounder. Washington, D.C.: Center for Immigration Studies.
Pedraza, Silvia, and Ruben G. Rumbaut 1996. Origins and Destinites: Immigration, Race and Ethnicity in America. Belmont, Calif.: Wadsworth.
Sassen, Saskia 1996. "Immigration in Global Cities." Pp. 3–9 in Proceedings of the International Symposium on Immigration and World Cities. New York: American Planning Association.
Simon, Julian 1996. "Public Expenditures on Immigrants to the United States, Past and Present." Population and Development Review 22(1):99–109.
Spiers, Joseph 1995. "The Economy: Regional Winners and Losers." Fortune. August 7, pp. 67–69.
Waldinger, Roger 1996. "Conclusion: Ethnicity and Opportunity in the Plural City." Chap. 15 in Ethnic Los Angeles, Roger Waldinger and Mehdi Bozorgmehr, eds. New York: Russell Sage.
Walker, Robert, Mark Ellis, and Richard Barff 1992. "Linked Migration Systems: Immigration and Internal Labor Flows in the United States." Economic Geography 68:234–248.
White, Michael J. 1987. American Neighborhoods and Residential Differentiation. New York: Russell Sage.
White, Michael J., and Lori Hunter 1993. "The Migratory Response of Native-born Workers to the Presence of Immigrants in the Labor Market." Paper presented at the 1993 meeting of the Population Association of America, Cincinnati, April.
White, Michael J., and Yoshie Imai 1994. "The Impact of Immigration upon Internal Migration." Population and Environment 15(3):189–209.
White, Michael J., and Zai Liang 1994. "The Effect of Immigration on the Internal Migration of the Native-Born Population, 1981–90." Working Paper, Brown University, Population Studies and Training Center, Providence, R.I.


