
5
Riboflavin
SUMMARY
Riboflavin functions as a coenzyme in numerous redox reactions. A combination of criteria is used to estimate the Recommended Dietary Allowance (RDA) for riboflavin, including the erythrocyte glutathione reductase activity coefficient and urinary riboflavin excretion. The RDA for riboflavin for adults is 1.3 mg/day for men and 1.1 mg/day for women. Recently, the median intake of riboflavin from food in the United States and two Canadian populations was estimated to be approximately 2 mg/day for men and 1.5 mg/day for women. The ninety-fifth percentile of U.S. intake from both food and supplements ranged from 4 to 10 mg/day. The evidence on adverse effects is not sufficient to set a Tolerable Upper Intake Level (UL) for riboflavin.
BACKGROUND INFORMATION
Subsequent to the discovery of thiamin was the discovery of a more heat-stable factor that was named vitamin B2, or riboflavin. Riboflavin is a water-soluble, yellow, fluorescent compound. The primary form of the vitamin is as an integral component of the coenzymes flavin mononucleotide (FMN) and flavin-adenine dinucleotide (FAD) (McCormick, 1994; McCormick and Greene, 1994; Merrill et al., 1981). It is in these bound coenzyme forms that riboflavin functions as a catalyst for redox reactions in numerous
metabolic pathways and in energy production (McCormick and Greene, 1994).
Function
The redox reactions in which flavocoenzymes participate include flavoprotein-catalyzed dehydrogenations that are both pyridine nucleotide (niacin) dependent and independent, reactions with sulfur-containing compounds, hydroxylations, oxidative decarboxylations (involving thiamin as its pyrophosphate), dioxygenations, and reduction of oxygen to hydrogen peroxide (McCormick and Greene, 1994). There are obligatory roles of flavocoenzymes in the formation of some vitamins and their coenzymes. For example, the biosynthesis of two niacin-containing coenzymes from tryptophan occurs via FAD-dependent kynurenine hydroxylase, an FMN-dependent oxidase catalyzes the conversion of the 5'-phosphates of vitamin B6 to coenzymic pyridoxal 5'-phosphate, and an FAD-dependent dehydrogenase reduces 5,10-methylene-tetrahydrofolate to the 5'-methyl product that interfaces with the B12-dependent formation of methionine from homocysteine and thus with sulfur amino acid metabolism.
Physiology of Absorption, Metabolism, and Excretion
Absorption
Most dietary riboflavin is consumed as a complex of food protein with FMN and FAD (Merrill et al., 1981; Nichoalds, 1981). In the stomach, gastric acidification releases most of the coenzyme forms of riboflavin (FAD and FMN) from the protein. The noncovalently bound coenzymes are then hydrolyzed to riboflavin by nonspecific pyrophosphatases and phosphatases in the upper gut (McCormick, 1994; Merrill et al., 1981). Primary absorption of riboflavin occurs in the proximal small intestine via a rapid, saturable transport system (McCormick, 1994; Merrill et al., 1981). The rate of absorption is proportional to intake, and it increases when riboflavin is ingested along with other foods (Jusko and Levy, 1967, 1975) and in the presence of bile salts (Jusko and Levy, 1975; Mayersohn et al., 1969). A small amount of riboflavin circulates via the enterohepatic system (McCormick, 1994).
At low intake levels most absorption of riboflavin is via an active or facilitated transport system. Although older studies in animals (Daniel et al., 1983; Meinen et al., 1977; Rivier, 1973) suggested
that this transport may depend on sodium ions, more recent work in humans (Said and Ma, 1994) indicates that uptake is independent of sodium ions. A small amount of riboflavin is absorbed in the large intestine (Sorrell et al., 1971).
In plasma some riboflavin is complexed with albumin; however, a large portion of riboflavin associates with other proteins, mainly immunoglobulins, for transport (Innis et al., 1985). Pregnancy increases the level of carrier proteins available for riboflavin (Natraj et al., 1988). This results in a higher rate of riboflavin uptake at the maternal surface of the placenta (Dancis et al., 1988).
At physiological concentrations the uptake of riboflavin into the cells of organs such as the liver is facilitated and may require specific carriers. At higher levels of intake, riboflavin can be absorbed by diffusion (Bowman et al., 1989; McCormick, 1989).
Metabolism
The metabolism of riboflavin is a tightly controlled process that depends on the riboflavin status of the individual (Lee and McCormick, 1983). Riboflavin is converted to coenzymes within the cellular cytoplasm of most tissues but mainly in the small intestine, liver, heart, and kidney (Brown, 1990; Darby, 1981). The metabolism of riboflavin begins with the adenosine triphosphate (ATP)-dependent phosphorylation of the vitamin to FMN. Flavokinase, the catalyst for this conversion, is under hormonal control. FMN can then be complexed with specific apoenzymes to form a variety of flavoproteins; however, most is converted to FAD by FAD synthetase. As a result, FAD is the predominant flavocoenzyme in body tissues (McCormick and Greene, 1994). Production of FAD is controlled by product inhibition such that an excess of FAD inhibits its further production (Yamada et al., 1990).
Excretion
When riboflavin is absorbed in excess, very little is stored in the body tissues. The excess is excreted, primarily in the urine. A wide variety of flavin-related products have been identified in the urine of humans. In healthy adults consuming well-balanced diets, riboflavin accounts for 60 to 70 percent of the excreted urinary flavins (McCormick, 1989). Urinary excretion of riboflavin varies with intake, metabolic events, and age (McCormick, 1994). In newborns, urinary excretion is slow (Jusko and Levy, 1975; Jusko et al., 1970);
however, the cumulative amount excreted is similar to the amount excreted by older infants.
Clinical Effects of Inadequate Intake
Clinical Signs of Deficiency
The signs of riboflavin deficiency (ariboflavinosis) in humans are sore throat; hyperemia and edema of the pharyngeal and oral mucous membranes; cheilosis; angular stomatitis; glossitis (magenta tongue); seborrheic dermatitis; and normochromic, normocytic anemia associated with pure erythrocyte cytoplasia of the bone marrow (Wilson, 1983). Riboflavin deficiency is most often accompanied by other nutrient deficiencies. Severe riboflavin deficiency may impair the metabolism of vitamin B6 by limiting the amount of FMN required by pyridoxine (pyridoxamine) 5-phosphate oxidase and the conversion of tryptophan to functional forms of niacin (McCormick, 1989).
Prevalence of Deficiency
Riboflavin deficiency has been documented in industrialized and developing nations and across various demographic groups (Komindr and Nichoalds, 1980; Nichoalds, 1981). Diseases such as cancer (Rivlin, 1975), cardiac disease (Steier et al., 1976), and diabetes mellitus (Cole et al., 1976; Prager et al., 1958) are known to precipitate or exacerbate riboflavin deficiency.
SELECTION OF INDICATORS FOR ESTIMATING THE REQUIREMENT FOR RIBOFLAVIN
Several indicators have been used to estimate the adequacy of riboflavin status in humans (McCormick, 1994; McCormick and Greene, 1994). Principal among them are erythrocyte glutathione reductase; erythrocyte flavin concentration; and urinary excretion of the vitamin in fasting, random, or 24-hour specimens or by load tests.
Erythrocyte Glutathione Reductase
Currently, one of the most commonly used methods for assessing riboflavin status involves the determination of erythrocyte glutathione reductase (EGR) activity, as described by Sauberlich and coworkers
(1972). The EGR value is an enzymatic and hence functional indicator that is conventionally determined with and without the addition of flavin-adenine dinucleotide (FAD) —the coenzyme required for the activity of EGR. Results are expressed as an activity coefficient (EGRAC), which is the ratio of activities in the presence of added FAD and without its addition. An EGRAC ratio of 1.0 indicates no stimulation by FAD and the presence of holoenzyme only, which means that more than adequate amounts of FAD (and riboflavin) were present in the original erythrocytes. Suggested guidelines for interpreting such coefficients are as follows: less than 1.2, acceptable; 1.2 to 1.4, low; and greater than 1.4, deficient (McCormick and Greene, 1994). However, many different cutoff values have been used by investigators. An upper limit of normality has been set at 1.34 based on the mean plus 2 standard deviations of the EGRAC value of several hundred apparently healthy elderly individuals aged 60 years and older (Sadowski, 1992).
Because FAD is a labile compound, the EGRAC must be obtained by using fresh erythrocytes that are washed, lysed, and measured promptly for enzymatic activity (McCormick and Greene, 1994). Because the glutathione reductase in the erythrocytes of individuals with glucose 6-phosphate dehydrogenase deficiency has an increased avidity for FAD (Nichoalds, 1981), this test is not valid in individuals with that condition. The dehydrogenase deficiency has been estimated to occur in 10 percent of black Americans (Frischer et al., 1973).
Erythrocyte Flavin
Erythrocyte flavin has been used as an indicator of the cellular concentration of the vitamin in its coenzyme forms because these coenzymes comprise over 90 percent of flavin (Burch et al., 1948). Because of the instability of the predominant FAD, which is rapidly hydrolyzed enzymatically when cells rupture, erythrocyte flavins are deliberately hydrolyzed and measured either microbiologically or fluorometrically as riboflavin. Values greater than 400 nmol/L (15 µg/100 mL) of cells are considered adequate (based on other observations and measurements) and values below 270 nmol/L (10 µg/100 mL) reflect deficiency (e.g., see the study by Ramsay et al. [1983] on the correlation between cord blood and maternal erythrocyte riboflavin deficiencies). Because the margin of difference between adequacy and inadequacy is rather small, there is some concern about the sensitivity and interpretation of results. After mild hydrolysis to convert FAD to the more stable flavin mono-
nucleotide (FMN), high-performance liquid chromatography (HPLC) separation leads to a more exact determination of FMN plus traces of riboflavin. This is a useful indicator that reflects the functional, cellularly trapped forms of riboflavin.
Urinary Flavin
Urinary riboflavin has often been used in metabolic studies to estimate the riboflavin requirement. It can be measured by fluorometric HPLC methods (Chastain and McCormick, 1987; Rough-head and McCormick, 1991) as well as by microbiological procedures. Without Chromatographic separation by HPLC or other means, the fluorometric assessment of the vitamin may lead to incorrectly high values, as was the case in early studies. In some cases, flavin catabolites found in food (such as the 10-formylmethyl- and 2'-hydroxyethyl-flavins found in milk) are a significant fraction of flavin catabolites that comprise as much as one-third of the total assay of urinary flavin. Such dietary flavin catabolites can also interfere with the response of bacteria or even rats used for assay of riboflavin. Additionally, in some cases flavin catabolites such as these can depress the cellular uptake of riboflavin (Aw et al., 1983) or its conversion to coenzymes (McCormick, 1962).
As HPLC techniques evolved to allow easier separation of riboflavin from other fluorescent flavin catabolites (such as 7- and 8-hydroxymethylriboflavins [McCormick, 1994]), specific quantitations of the vitamin (which contributes more than two-thirds of the total flavin) were found generally useful to relate the recent dietary intake to urinary output. Under conditions of sufficiency (that is, an average riboflavin intake of approximately 1.5 mg/day), the amount of riboflavin excreted per day exceeded 319 nmol (120 µg) riboflavin (Roughead and McCormick, 1991). The amount of riboflavin excreted per gram of creatinine was greater for children than adults.
For adults, a low urinary concentration of riboflavin is considered to be 50 to 72 nmol/g (19 to 27 µg/g) creatinine and a deficient concentration to be below 50 nmol/g (19 µg/g) creatinine. Sauberlich and colleagues (1974), reviewing the literature based on fluorometric methods without HPLC, suggested that riboflavin values less than 72 nmol/g (27 µg/g) creatinine be considered deficient, 72 to 210 nmol/g (27 to 79 µg/g) creatinine be considered low, and greater than 213 nmol/g (80 µg/g) creatinine be considered acceptable. Compared with the fluorometric method alone, the HPLC method with fluorometry tends to give lower values because riboflavin is separated from other flavins (Smith, 1980).
Load tests may be used to gauge the degree to which the body is saturated with riboflavin; the result generally agrees with tests using other indicators. Subcutaneous administration of 1 mg of riboflavin followed by assessment of urinary flavin output for a 4-hour period was found by Horwitt et al. (1950) to correspond well to riboflavin excretion over 24 hours. A break point for increased urinary excretion of riboflavin occurred with or without the load when adult men received more than 1.1 mg/day of dietary riboflavin (see Figure 5-1). Above this level, there is a sharp linear increase in the slope of urinary excretion for riboflavin intakes up to 2.5 mg/day (Sauberlich
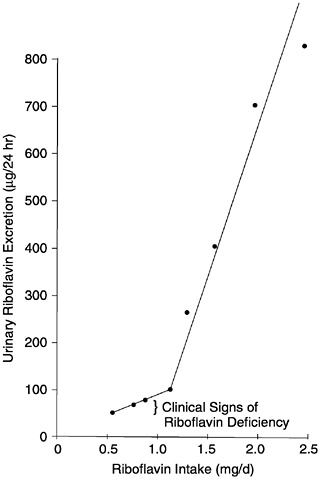
FIGURE 5-1 Relationship of riboflavin intake to urinary excretion of riboflavin as observed in the studies of Horwitt (1972) and Horwitt et al. (1950). Reprinted with permission, from Sauberlich et al. (1974). Copyright 1994 by CRC Press.
et al., 1974). Adapting the work of Lossy et al. (1951), Sauberlich and colleagues (1974) suggested a reference value of 1.4 mg or more for the normal 4-hour urinary excretion of riboflavin after a 5-mg load.
The change in slope of urinary excretion of riboflavin after a load test is an especially useful status assessment. Caution in interpretation is needed because the size of the test dose, method of administration, and method of calculating amount recovered have varied among studies. Moreover, the break point may reflect not only tissue saturation but also renal threshold and solubility (compartment) effects (Sauberlich et al., 1974). Urinary riboflavin has been shown to increase under conditions causing negative nitrogen balance and with the administration of antibiotics and certain psychotropic drugs (e.g., phenothiazine) (McCormick, 1994).
Indicators of Carbohydrate Metabolism
In an early study (Horwitt et al., 1949), indices of carbohydrate metabolism (lactic and pyruvic acid concentrations) were measured in riboflavin-depleted subjects after a short period of exercise. Because no changes were observed, these do not appear to be promising indicators of riboflavin status.
Possible Reduction of Chronic Disease Risk
Riboflavin status (low as assessed by EGRAC) has been related to certain site-specific cancers (e.g., esophageal) in areas of China (Merrill et al., 1991). However, randomized nutrition intervention trials in Linxian, China, indicated that a riboflavin and niacin combination, given for about 5 years, did not reduce total or cancer mortality (Blot et al., 1995).
Although lens opacities in humans have been associated with high glutathione reductase activity (with FAD) (Leske et al., 1995), evidence is insufficient for considering the use of risk of cataract as the basis for setting the Estimated Average Requirement (EAR).
Concurrent Analyses
Overall, greatest credence is given to status assessments that use more than one indicator, because the response variables indicate somewhat different aspects of riboflavin status. Many investigators have obtained data concurrently on several indicators of riboflavin status. Sauberlich and colleagues (1972) noted that, for the most
part, “subjects with elevated EGR activity coefficients…had urinary excretion levels considered low or deficient.” Boisvert and colleagues (1993) indicated that the EGRAC method is preferred for the assessment of riboflavin status whereas the urinary excretion method is better for determining riboflavin requirements. Both EGRAC and urinary riboflavin respond more rapidly to dietary riboflavin intake than does erythrocyte riboflavin (Bamji, 1969), but Bates (1987) showed a good relationship between EGRAC and erythrocyte riboflavin expressed as micrograms of riboflavin per gram of hemoglobin.
FACTORS AFFECTING THE RIBOFLAVIN REQUIREMENT
Bioavailability
Overall, a reasonable estimation of bioavailability is approximately 95 percent of food flavin, up to a maximum of about 27 mg absorbed per single meal or dose (Zempleni et al., 1996).
There is considerable diversity of flavins in foods, but over 90 percent of riboflavin is estimated to be in readily digested flavocoenzymes (mainly flavin-adenine dinucleotide [FAD] and to a lesser degree flavin mononucleotide [FMN]), with lesser amounts of the free vitamin and traces of glycosides and esters that are also hydrolyzed during absorption from the gut (McCormick, 1994; Merrill et al., 1981). Perhaps no more than 7 percent of food flavin is found as covalently attached 8α-FAD. In these substituted flavins, the methylene carbon at position 8 of the isoalloxazine ring is bound to heterocyclic atoms (N, S, and O) of proteins that function catalytically (e.g., mitochondrial succinate dehydrogenase and monoamine oxidase). Although some portion of the 8α-(amino acid) riboflavins are released by proteolysis of such flavoproteins, they do not have vitaminic activity (Chia et al., 1978).
Nutrient-Nutrient Interactions
Composition of the Diet
The proportions of fat and carbohydrate in the diet appear to influence the riboflavin requirements of the elderly (Boisvert et al., 1993); when fat was decreased from 31.4 to 20.0 percent of calories and carbohydrate was increased from 57.5 to 68.2 percent of calories, the riboflavin requirement was lower. Thus, a lower ratio of fat
to carbohydrate decreased the requirement. This relationship has not been examined in other age groups.
Other B Vitamins
Riboflavin interrelates with other B vitamins, notably niacin, which requires FAD for its formation from tryptophan, and vitamin B6, which requires FMN for conversion to the coenzyme pyridoxal 5'-phosphate (McCormick, 1989). These interrelationships are not known to affect the requirement for riboflavin.
Energy Intake
No studies were found that examined the effect of energy intake on the riboflavin requirement. Some studies provided riboflavin in graded doses that kept the ratio of riboflavin-to-energy constant for subjects with different energy requirements. Others provided total amounts of riboflavin (and sometimes energy) that were the same for all individuals. Five studies using 2- to 3-day complete urine collection (Belko et al., 1983, 1984, 1985; Soares et al., 1993; Winters et al., 1992) reported that the urinary excretion of riboflavin is decreased when physical activity is increased, suggesting higher utilization of riboflavin with increased energy expenditure.
Despite the lack of experimental data, the known biochemical function of riboflavin in the utilization of energy suggests at least a small (10 percent) adjustment to reflect differences in the average energy utilization and size of men and women, a small increase in the requirement to cover increased energy use during pregnancy, and a small increase to cover the inefficiencies of milk production.
Physical Activity
Riboflavin status measurements seem to be affected by physical activity. Some studies have demonstrated a moderate rise in the erythrocyte glutathione reductase activity coefficient (EGRAC) as well as a decrease in urinary riboflavin excretion with an increase in physical activity (Belko et al., 1983, 1984, 1985; Soares et al., 1993; Winters et al., 1992). For example, approximately 20 percent additional riboflavin was required to normalize EGRAC and urinary flavin values of exercising, weight-reducing women (Belko et al., 1985) and older women undergoing exercise training (Winters et al., 1992). Tucker and colleagues (1960) suggest that the decrease in riboflavin after exercise may be related to reduced renal blood
flow, but in the studies cited above, all urine was collected over a period of 48 to 72 hours.
In a group of East Indian men aged 27 to 47 years with a mean EGRAC of 1.53, short periods of increased physical activity while on a diet providing riboflavin at 0.42 mg/1,000 kcal for 16 days led to an increase in EGRAC. When riboflavin status is marginal, increased physical activity may be more likely to lead to further deterioration as assessed by EGRAC, and values may not return to baseline after the extra exercise segment of the study is completed (Soares et al., 1993). However, the energy cost of the exercise and a measure of mechanical efficiency remained stable throughout.
A number of studies have failed to show an improvement in work performance (Powers et al., 1987; Prasad et al., 1990; Tremblay et al., 1984; Weight et al., 1988) and endurance (elderly subjects) (Winters et al., 1992) with riboflavin supplementation even when subjects were described as subclinically deficient (having lower-than-normal ranges of biochemical indices but no clinically observable signs of deficiency).
It is possible that the riboflavin requirement is increased for those who are ordinarily very active physically (e.g., athletes or those who carry heavy packs much of the day), but data are not available on which to quantify the adjustment that should be made.
Other Factors
Although a number of reports indicate that women taking high-dose oral contraceptives have impaired riboflavin status, no difference was seen when dietary riboflavin intake was controlled (Roe et al., 1982).
APPROACHES FOR DERIVING THE ESTIMATED AVERAGE REQUIREMENT
Primary: Maintenance or Restoration of Riboflavin Status by Using Biochemical Indicators
To derive the Estimated Average Requirement (EAR) for adults, more weight was given to experimental studies that included information on response to diets in which the source of riboflavin was food or food plus supplemental riboflavin (Table 5-1). Studies that used more than one indicator were considered most useful, especially if a functional assay (e.g., EGRAC) was conducted along with measurement of erythrocyte or urinary riboflavin. However, the
TABLE 5-1 Metabolic Studies Providing Evidence Used to Derive the Estimated Average Requirement (EAR) for Riboflavin for Adults
|
Reference |
Duration of Study |
Baseline Riboflavin Intake |
Number of Subjects |
Riboflavin Intake During Repletion or Maintenance (mg/d) |
|
Women |
||||
|
Sebrell et al., 1941 |
19–36 wk depletion 7–24 wk repletionb |
0.5 mg/d |
10 (institutionalized) |
0.5 1.56–2.05 2.54–3.68 |
|
Williams et al., 1943 |
246 d 288 d 288 d 288 d 288 d 264 d |
≥ 2 mg/d |
2 4 1 3 1 2 |
0.6 0.76 1.0 1.05 1.2 1.76–3.76 |
|
Brewer et al., 1946 |
12 d at each intake level |
NA |
14 |
0.79 1.04 1.26 1.62 2.23 2.73 |
|
Davis et al., 1946 |
8 mo |
NA |
12 |
0.29 mg/1,000 kcalg 0.49 mg/1,000 kcal 0.66 mg/1,000 kcal 4.10 mg/1,000 kcal |
|
Roe et al., 1982 |
10 wk (includes 2-wk acclimation) |
1.69 ± 0.5 mg/d (based on 7-d diet records and diet history) |
10 |
0.6 mg/1,000 kcalg 0.8 mg/1,000 kcal 1.0 mg/1,000 kcal |
|
Belko et al., 1983 |
12 wk |
1.45 ± 0.4 mg/d (based on 7-d diet records) |
12 2 3 10 11 2 8 |
0.6 mg/1,000 kcalg 0.8 mg/1,000 kcal 0.8 mg/1,000 kcali 1.0 mg/1,000 kcal 1.0 mg/1,000 kcali 1.2 mg/1,000 kcali 1.4 mg/1,000 kcali |
|
EGRACa |
Urinary Excretion of Riboflavin |
Erythrocyte Riboflavin |
Other |
|
NAc |
Abnormald Normal Normal |
NA |
60% abnormale Normal Normal |
|
NA |
Abnormald 75% abnormal Abnormal 33% abnormal Normal Normal |
NA |
Normalf Normal Normal Normal Normal Normal |
|
NA |
Abnormald Normal Normal Normal Normal Normal |
NA |
NA |
|
NA |
45% abnormald 17% abnormal Normal Normal |
NA |
NA |
|
50% abnormalh 20% abnormal 10% abnormal |
NA |
NA |
NA |
|
92% abnormalj 100% normal 100% normal 60% abnormal 73% abnormal 100% normal 100% normal |
NA |
NA |
NA |
|
Reference |
Duration of Study |
Baseline Riboflavin Intake |
Number of Subjects |
Riboflavin Intake During Repletion or Maintenance (mg/d) |
|
Kuizon et al., 1992 |
40 d |
Measured but not reported |
7 (non-pregnant Filipino population) |
0.25 mg/1,000 kcalg 0.4 mg/1,000 kcal 0.5 mg/1,000 kcal 0.6 mg/1,000 kcal |
|
Women and Men |
||||
|
Boisvert et al., 1993 |
16 wk |
NA |
14 (healthy, elderly Guatemalan population) |
0.65 0.7 0.9 1.1 1.3 1.5 |
|
Men |
||||
|
Keys et al., 1944 |
5 mo |
6 |
0.99 |
|
|
Horwitt et al., 1949 |
9–10 mo 3 mo |
1.6 mg/d |
39 (mental patients) |
0.55 1.1 |
|
Horwitt et al., 1950 |
15 wk 12 wk 15 wk 13 wk 100 wk 10–78 wk 2–44 wk 1.5wk |
1.1 mg/d (3 mo prelim. period) |
15 11 12 28 39 12 13 13 |
0.55 0.75 0.85 1.1 1.6 2.15 2.55 3.55 |
|
Bessey et al., 1956 |
247 d 16 mo 247 d 247 d 16 mo |
NA |
8 10 10 23 6 |
0.5 0.55 1.6 2.4 2.55–3.55 |
|
NOTE: Maintenance of body weight was not indicated in Davis et al. (1946), Kuizon et al. (1992), Horwitt et al. (1950), Bessey et al. (1956); body weight was maintained in the other studies. Riboflavin intake was measured analytically except as noted. Intakes given in bold supported normal results for all indicators. a EGRAC = Erythrocyte glutathione reductase activity coefficient. b During repletion, various amounts of supplements (1–15 mg/d orally) were given in addition to the basal diet. Two sample intakes for this period are given here. |
||||
|
EGRACa |
Urinary Excretion of Riboflavin |
Erythrocyte Riboflavin |
Other |
|
43% abnormalk 43% abnormal 100% normal 100% normal |
NA |
NA |
NA |
|
Abnormall Abnormal Abnormal Abnormal Normal Normal |
Abnormalm Abnormal Abnormal Normal Normal Normal |
NA |
Normaln Normal Normal Normal Normal Normal |
|
NA |
Normald |
NA |
Normalo |
|
NA |
Abnormald Normal |
NA |
Abnormalp Normal |
|
NA |
Abnormald Abnormal Abnormal Abnormal Normal Normal Normal Normal |
NA |
Abnormalq Normal Normal Normal Normal Normal Normal Normal |
|
NA |
NA |
Abnormalr Abnormal 63% abnormal Normals Normal |
50% abnormalt 30% abnormal Normal Normal Normal |
|
cNA = not applicable. d Abnormal urinary excretion = < 266 nmol (100 µg)/d of riboflavin (based on Sauberlich et al., 1974). e Abnormal = symptoms of cheilosis. f Normal = no signs or symptoms of deficiency (i.e., no ulcers around the mouth, no changes in the eyes, normal pyruvic and lactic acid levels, no anemia). |
|||
latter occurred in only one study on elderly Guatemalans (Boisvert et al., 1993). The value selected for the EAR for riboflavin was the intake that was sufficient to maintain or restore adequate status in half the individuals in the groups studied.
Ancillary: Kinetic, Catabolic, and Clinical Reflections of Riboflavin Status
Whole-body dynamics based on pharmacokinetic analysis were used to set limits for rates and amounts of riboflavin absorption and excretion and appeared to reflect the flux of major metabolites (Zempleni et al., 1996). Such analysis assumes that the upper limits for utilization and storage have been reached if there is a rapid increase in the excretion of vitamin in the urine. The suppression or regression of clinical signs, largely dermatological, provide guide-posts for lowest limits.
FINDINGS BY LIFE STAGE AND GENDER GROUP
Infants Ages 0 through 12 Months
Method Used to Set the Adequate Intake
Because there are not sufficient data that reliably reflect response to dietary riboflavin intake in infants, an Adequate Intake (AI) is used as the goal for intake by infants. In this case, the AI reflects the observed mean riboflavin intake of infants fed principally with human milk.
The riboflavin content of human milk used for calculations in this report is based on milk from healthy, well-nourished mothers who are not taking supplements. In the first few weeks postpartum, the riboflavin content of milk tends to increase with the use of riboflavin supplements (Nail et al., 1980). However, no difference in riboflavin content of human milk was found between supplemented and unsupplemented well-nourished mothers at 6 months postpartum (Thomas et al., 1980). Previously, estimates of the riboflavin content of human milk from well-nourished, unsupplemented mothers included 0.37 ± 0.13 (standard deviation) mg/L at 5 to 7 days postpartum, 0.49 ± 0.12 mg/L at 43 to 45 days postpartum, 0.24 ± 0.35 mg/L at 6 months postpartum (Thomas et al., 1980), and 0.35 ± 0.02 mg/L after 3 weeks postpartum (Committee on Nutrition, 1985).
More recent studies (Roughead and McCormick, 1990a, b) in five subjects showed that riboflavin in milk may have been previously underestimated as a result of a lack of detection of flavin-adenine dinucleotide (FAD), which by weight is 48 percent riboflavin (and accounts for 41 percent of total flavin in milk), by fluorescent measurement techniques. However, the antivitaminic potential of certain metabolites in milk, such as the 2'-hydroxyethylflavin, could suppress riboflavin efficiency by competition for cellular uptake (Aw et al., 1983) and utilization (McCormick, 1962). The net consequence is that the riboflavin equivalence of milk, either from humans or cows, may be somewhat higher than earlier estimates based on uncorrected fluorescence measurements. On the basis of this and studies of microbiologically determined riboflavin in human milk (WHO, 1965), a riboflavin concentration of 0.35 mg/L will be used for human milk consumed by infants younger than 6 months (see Box 5-1).
|
BOX 5-1 Riboflavin Concentration in Human Milk
|
Ages 0 through 6 Months. The AI for riboflavin for infants ages 0 through 6 months is based on the reported mean volume of milk consumed by this age group (0.78 L/day; see Chapter 2) and the estimate of the riboflavin concentration in human milk of 0.35 mg/ L (0.78 L × 0.35 mg/L = 0.27 mg). Thus, the AI for riboflavin when rounded is 0.3 mg/day for infants ages 0 through 6 months.
In a study of 55 low-income, East Indian infants aged 0 through 6 months who were exclusively fed human milk, the mothers’ EGRAC value was 1.80 ± 0.06 (standard error), whereas the infants’ EGRAC value was 1.36 ± 0.04 (Bamji et al., 1991). Only 9 percent of the mothers and 36 percent of the infants had EGRAC values lower than 1.2, the standard for adequacy used in the study. The mean riboflavin concentration of the human milk the infants were consuming was 0.22 ± 0.01 (standard error) mg/L. This study suggests that when there was deficiency in the mothers, the riboflavin concentration of milk was approximately one-third lower than values reported for Western women.
Ages 7 through 12 Months. If the reference body weight ratio method described in Chapter 2 to extrapolate from the AI for riboflavin for infants ages 0 through 6 months is used, the AI for riboflavin for
the older infants would be 0.35 mg/day. The second method (see Chapter 2), extrapolating from the Estimated Average Requirement (EAR) for adults and adjusting for the expected variance to estimate a recommended intake, also gives an AI of 0.35 mg of riboflavin.
Alternatively, the AI for riboflavin for infants ages 7 through 12 months could be calculated by using the estimated riboflavin content of 0.6 L of human milk, the average volume consumed by this age group (riboflavin content equals 0.21 mg), and adding the amount of riboflavin provided by solid foods (0.6 mg) as estimated by Montalto et al. (1985) (see Chapter 2). The result equals approximately 0.8 mg/day. This value was judged to be unreasonably high because it is more than twice the extrapolated value given above. Thus the AI for riboflavin after rounding is 0.4 mg/day for infants ages 7 through 12 months—the value extrapolated from younger infants and from estimates of adult requirements.
Riboflavin AI Summary, Ages 0 through 12 Months
With use of the mean value for intake of human milk of 0.78 L/ day and the average riboflavin content of 0.35 mg/L, the AI for riboflavin is 0.27 mg/day for infants ages 0 through 6 months, which is rounded to 0.3 mg; the AI for riboflavin is 0.35 for infants ages 7 through 12 months, which is rounded to 0.4 mg/day.
|
AI for Infants |
||
|
0–6 months |
0.3 mg/day of riboflavin |
≈0.04 mg/kg |
|
7–12 months |
0.4 mg/day of riboflavin |
≈0.04 mg/kg |
Children and Adolescents Ages 1 through 18 Years
Method Used to Estimate the Average Requirement
Very limited data were found concerning the riboflavin requirements of children or adolescents. An older study of two normal 5-year-old boys given different levels of intake and with urinary output measured microbiologically revealed that riboflavin at 0.53 mg/ 1,000 kcal was ample (Oldham et al., 1944). Riboflavin requirement was judged to be the lowest level at which daily excretions did not change. This level of riboflavin intake was comparable with the 0.5 mg/1,000 kcal found close to the “daily requirement necessary for maintenance of satisfactory tissue stores of riboflavin” in adults in whom urinary flavin was measured fluorometrically at about the
same time (Williams et al., 1943). Sauberlich and coworkers (1972) reported EGRAC values for a group of 431 students aged 14 to 17 years. For an EGRAC cutoff value of 1.20, 4 percent of the white males exceeded the cutoff compared with 20 percent of the black males, 11 percent of the white females, and 38 percent of the black females. This result suggests that black adolescents had a modest insufficiency of riboflavin intake compared with whites.
In the absence of additional information, EARs and RDAs for riboflavin for children ages 1 through 18 years have been extrapolated from adult values by using the method described in Chapter 2 using a metabolic body weight ratio multiplied by a growth factor. Calculated values have been rounded where appropriate.
Riboflavin EAR and RDA Summary, Ages 1 through 18 Years
|
EAR for Children |
1–3 years |
0.4 mg/day of riboflavin |
|
|
4–8 years |
0.5 mg/day of riboflavin |
|
EAR for Boys |
9–13 years |
0.8 mg/day of riboflavin |
|
|
14–18 years |
1.1 mg/day of riboflavin |
|
EAR for Girls |
9–13 years |
0.8 mg/day of riboflavin |
|
|
14–18 years |
0.9 mg/day of riboflavin |
The RDA for riboflavin is set by assuming a coefficient of variation (CV) of 10 percent (see Chapter 1) because information is not available on the standard deviation of the requirement for riboflavin; the RDA is defined as equal to the EAR plus twice the CV to cover the needs of 97 to 98 percent of the individuals in the group (therefore, for riboflavin the RDA is approximately 120 percent of the EAR).
|
RDA for Children |
1–3 years |
0.5 mg/day of riboflavin |
|
|
4–8 years |
0.6 mg/day of riboflavin |
|
RDA for Boys |
9–13 years |
0.9 mg/day of riboflavin |
|
|
14–18 years |
1.3 mg/day of riboflavin |
|
RDA for Girls |
9–13 years |
0.9 mg/day of riboflavin |
|
|
14–18 years |
1.0 mg/day of riboflavin |
Adults Ages 19 through 70 Years
Evidence Considered in Estimating the Average Requirement
Studies of the riboflavin requirements of adults have focused primarily on the occurrence of signs of clinical deficiency and on urinary excretion of riboflavin (Table 5-1). Thus, the EAR is derived from the findings of a number of studies that addressed clinical deficiency signs and biochemical values, including EGRAC, in relation to measured dietary intake of riboflavin. Biochemical changes in riboflavin status occur well before the appearance of overt signs of deficiency. Such studies help to bracket the riboflavin requirement.
Early studies of women by Sebrell et al. (1941) and of men by Horwitt et al. (1950) helped establish that riboflavin intakes of less than 0.5 to 0.6 mg/day led to clinical signs of deficiency. The use of microbiological assays in a study of riboflavin balance in women under institutional care led to a suggestion that 3 mg/day was sufficient (Sebrell et al., 1941). However, this level was soon deemed too high by others (Davis et al., 1946; Williams et al., 1943).
The work of Horwitt et al. (1950), Keys et al. (1944), and Williams et al. (1943) indicated that riboflavin intakes of approximately 0.8 mg/day for men or women were minimally sufficient to avoid signs of clinical deficiency. For example, when young men were given 0.31 mg/1,000 kcal (equivalent to 0.77 mg/day at 2,500 kcal) for at least 5 months, urinary riboflavin excretion decreased for approximately 45 days and then stabilized at 10 to 14 percent of intake. No changes related to riboflavin intake were observed in the structure of the eyes, work performance, or psychomotor test results (Keys et al., 1944).
On the basis of estimates of urinary riboflavin, it was determined that a reserve was not maintained at riboflavin intakes below 1.1 mg/day (Horwitt et al., 1949, 1950). Nearly three times as much riboflavin was excreted by subjects on diets providing riboflavin at 1.6 mg/day compared with those providing 1.1 mg/day (see Figure 5-1) (Horwitt et al., 1950). Also, symptoms of deficiency seen with 0.55 mg/day given for 4 months could be corrected in 15 days when 6 mg/day was given, although lower repetitive doses of 2 or 4 mg/ day were also effective (Horwitt et al., 1950). Bessey and colleagues (1956) showed that men required from 0.6 to 1.6 mg/day of riboflavin for maintenance of erythrocyte riboflavin. This level of intake agrees with intake to achieve satisfactory urinary flavin excretion determined by Horwitt (1972) and Horwitt and coworkers (1950).
Moreover, it adds another point between 1.1 and 1.6 mg of riboflavin intake to Figure 5-1, which indicates that a markedly increased excretion of riboflavin has been noted at intakes exceeding 0.8 to 0.9 mg/day for women and 1.0 to 1.1 mg/day for men. A similar break in the riboflavin excretion curve for young women had also been observed earlier (Brewer et al., 1946; Davis et al., 1946). The more recent work of Boisvert and coworkers (1993), studying an elderly population, pointed to approximately 1.0 mg/day as the intake at which the excretion of excess vitamin became apparent. Although some earlier fluorescence-based assays of extracts of urine gave higher values than attributable to the vitamin alone because riboflavin was not separated from other flavins, break points in urinary excretion would not have been affected.
In the Philippines, Kuizon and colleagues (1992) found that riboflavin intake at 0.4 mg/1,000 kcal would lower the activity coefficient to less than 1.3 within 20 days for five of seven nonpregnant women.
Roughead and McCormick (1991) determined the urinary riboflavin and flavin metabolite contents before and after the ingestion of a 1.7-mg riboflavin supplement. Mean dietary intake of the group, obtained from three 1-day dietary records for each subject, was at least 1.7 mg in addition to the supplement. These investigators found that most of the 1.7 mg of the supplemental riboflavin appeared in the urine without being metabolized.
Intakes of 1.8 mg/day or more were required in a group of Gambian subjects to lower the mean EGRAC to a level of 1.3 to 1.4 (Bates et al., 1989); however, this study in The Gambia was judged not relevant for estimating requirements of the U.S. and Canadian populations. The subjects were severely deficient as judged by very high initial EGRAC values, making it difficult to know what length of time and what doses would be required to achieve EGRAC values that were below 1.4. Moreover, glucose 6-dehydrogenase status was not determined even though deficiency of this enzyme may be even greater in this population than the 10 percent estimated for blacks in the U.S. population.
Finally, two studies by Belko and colleagues (1984, 1985) are not included because they were conducted with moderately obese young women on low-calorie (1,200 to 1,250 kcal) diets.
Study results suggest that no distinctions in the riboflavin requirements of men and women other than those based on general size and energy expenditure can be made, nor is there any data to indicate that requirements for younger adults differ from those of older (over 70 years) adults.
Riboflavin EAR and RDA Summary, Ages 19 through 70 Years
Because clinical signs of deficiency appear at intakes of less than 0.5 to 0.6 mg/day whereas most studies report normal EGRAC values at intakes of less than 1.3 mg/day, and because there is an expected curvilinear biological increase of values from deficient to minimally adequate, it is estimated that the EAR for riboflavin for men is 1.1 mg/day and for women is 0.9 mg/day.
|
EAR for Men |
19–30 years |
1.1 mg/day of riboflavin |
|
|
31–50 years |
1.1 mg/day of riboflavin |
|
51–70 years |
1.1 mg/day of riboflavin |
|
|
EAR for Women |
19–30 years |
0.9 mg/day of riboflavin |
|
|
31–50 years |
0.9 mg/day of riboflavin |
|
51–70 years |
0.9 mg/day of riboflavin |
The RDA for riboflavin is set by assuming a coefficient of variation (CV) of 10 percent (see Chapter 1) because information is not available on the standard deviation of the requirement for riboflavin; the RDA is defined as equal to the EAR plus twice the CV to cover the needs of 97 to 98 percent of the individuals in the group (therefore, for riboflavin the RDA is 120 percent of the EAR).
|
RDA for Men |
19–30 years |
1.3 mg/day of riboflavin |
|
|
31–50 years |
1.3 mg/day of riboflavin |
|
51–70 years |
1.3 mg/day of riboflavin |
|
|
RDA for Women |
19–30 years |
1.1 mg/day of riboflavin |
|
|
31–50 years |
1.1 mg/day of riboflavin |
|
51–70 years |
1.1 mg/day of riboflavin |
Adults Ages Older Than 70 Years
Evidence Considered in Estimating the Average Requirement
Few additional studies estimating the riboflavin requirements have been conducted in the elderly. In healthy elderly women aged 70 years or older, doubling the estimated riboflavin intake by means of a supplement containing 1.7 mg of riboflavin doubled the urinary riboflavin excretion in the supplemented group compared to the unsupplemented group, from 4.36 to 9.06 µmol/g (1.64 to 3.41 mg/g) creatinine (Alexander et al., 1984). Initially all the women
had EGRAC values lower than 1.25 on a mean baseline riboflavin intake of 1.8 ± 0.1 (standard error) mg/day, and urinary excretion values in both groups were substantially above levels indicating possible risk of deficiency.
In elderly Guatemalans, normalization of EGRAC to less than 1.34 was achieved with approximately 1.3 mg/day of riboflavin (0.7 mg/ day from the diet plus 0.6 mg/day from a supplement), and a sharp increase in urinary riboflavin occurred at intakes above 1.0 to 1.1 mg/day. Requirements of the elderly did not differ from those of young adults (Boisvert et al., 1993).
Riboflavin EAR and RDA Summary, Ages Older Than 70 Years
Although there is a decrease in energy expenditure with aging and the EAR for older adults would be expected to decrease, the study by Boisvert and colleagues (1993) supports the use of the same EAR for the elderly as for younger adults.
|
EAR for Men |
> 70 years |
1.1 mg/day of riboflavin |
|
EAR for Women |
> 70 years |
0.9 mg/day of riboflavin |
The RDA for riboflavin is set by assuming a coefficient of variation (CV) of 10 percent (see Chapter 1) because information is not available on the standard deviation of the requirement for riboflavin; the RDA is defined as equal to the EAR plus twice the CV to cover the needs of 97 to 98 percent of the individuals in the group (therefore, for riboflavin the RDA is 120 percent of the EAR).
|
RDA for Men |
> 70 years |
1.3 mg/day of riboflavin |
|
RDA for Women |
> 70 years |
1.1 mg/day of riboflavin |
Pregnancy
Evidence Considered in Estimating the Average Requirement
Few studies provide information about the riboflavin requirements of pregnant women. Bamji (1976) reported that infants born to women with high erythrocyte glutathione reductase (EGR) activity may also have a high EGRAC but to a lesser degree than their mothers. Bates and colleagues (1981) reported that a sample of 59 pregnant women in the United Kingdom had a mean riboflavin intake of 2.2 mg/day and a mean EGRAC of 1.19 ± 0.08 (standard deviation). Maternal riboflavin intake (estimated from a crosscheck
dietary history) was positively associated with fetal growth in a study of 372 pregnant women (Badart-Smook et al., 1997), but the data are insufficient to warrant use of fetal growth as an indicator for setting the riboflavin requirement for pregnant women.
For pregnancy an additional riboflavin requirement of 0.3 mg/ day is estimated based on increased growth in maternal and fetal compartments and a small increase in energy utilization. This increased need is supported by the urinary excretion of less riboflavin during the progression of pregnancy and the more frequent appearance of clinical signs of ariboflavinosis in pregnant women on low intakes (less than 0.8 mg/day) than in their nonpregnant counterparts (Brzezinski et al., 1952; Jansen and Jansen, 1954). Also, EGRAC tends to increase during pregnancy (Bates et al., 1981; Heller et al., 1974; Vir et al., 1981). In the Philippines, Kuizon and colleagues (1992) found that riboflavin intake at 0.7 mg/1,000 kcal was required to lower the activity coefficient within 20 days to less than 1.3 for four of eight pregnant women compared with only 0.41 mg/1,000 kcal for five of seven nonpregnant women.
Riboflavin EAR and RDA Summary, Pregnancy
Adding 0.3 mg/day to the EAR of 0.9 mg/day of riboflavin for the nonpregnant woman gives an EAR of 1.2 mg/day. No adjustment is made for age or stage of pregnancy.
|
EAR for Pregnancy |
14–18 years |
1.2 mg/day of riboflavin |
|
|
19–30 years |
1.2 mg/day of riboflavin |
|
31–50 years |
1.2 mg/day of riboflavin |
The RDA for riboflavin is set by assuming a coefficient of variation (CV) of 10 percent (see Chapter 1) because information is not available on the standard deviation of the requirement for riboflavin; the RDA is defined as equal to the EAR plus twice the CV to cover the needs of 97 to 98 percent of the individuals in the group (therefore, for riboflavin the RDA is 120 percent of the EAR). The results have been rounded up.
|
RDA for Pregnancy |
14–18 years |
1.4 mg/day of riboflavin |
|
|
19–30 years |
1.4 mg/day of riboflavin |
|
31–50 years |
1.4 mg/day of riboflavin |
Lactation
Method Used to Estimate the Average Requirement
For lactating women, it is assumed that 0.3 mg of riboflavin is transferred in their milk each day when their daily milk production is 0.78 L (during the first 6 months of lactation; see “Infants Ages 0 through 12 Months”). If the use of riboflavin for milk production by the mother is assumed to be 70 percent efficient (WHO, 1965), values are adjusted upward to 0.4 mg/day for the amount of the vitamin that should be replaced. Women who are breastfeeding older infants who are eating solid foods need slightly less, in proportion to lower volume of milk production.
Riboflavin EAR and RDA Summary, Lactation
To the EAR of 0.9 mg/day of riboflavin for the nonpregnant and nonlactating woman, 0.4 mg/day is added, giving an EAR of 1.3 mg/day.
|
EAR for Lactation |
14–18 years |
1.3 mg/day of riboflavin |
|
|
19–30 years |
1.3 mg/day of riboflavin |
|
31–50 years |
1.3 mg/day of riboflavin |
The RDA for riboflavin is set by assuming a coefficient of variation (CV) of 10 percent (see Chapter 1) because information is not available on the standard deviation of the requirement for riboflavin; the RDA is defined as equal to the EAR plus twice the CV to cover the needs of 97 to 98 percent of the individuals in the group (therefore, for riboflavin the RDA is 120 percent of the EAR).
|
RDA for Lactation |
14–18 years |
1.6 mg/day of riboflavin |
|
|
19–30 years |
1.6 mg/day of riboflavin |
|
31–50 years |
1.6 mg/day of riboflavin |
Special Considerations
As with other B vitamins, persons undergoing hemodialysis or peritoneal dialysis and those with severe malabsorption are likely to require extra riboflavin. Women pregnant with more than one fetus and those breastfeeding more than one infant are also likely to require more riboflavin.
INTAKE OF RIBOFLAVIN
Food Sources
Most plant and animal tissues contain at least small amounts of riboflavin. Data obtained from the 1995 Continuing Survey of Food Intakes by Individuals (CSFII) indicate that the greatest contribution to the riboflavin intake of the U.S. adult population comes from milk and milk drinks followed by bread products and fortified cereals (Table 5-2). Other sources of riboflavin are organ meats. Milk is both a rich source of riboflavin and a commonly consumed food. Riboflavin loss occurs if it is exposed to the light, for example, if milk is stored in clear glass under light.
Dietary Intake
Based on data from CSFII (Appendix G) and the Third National Health and Nutrition Examination Survey (Appendix H), the median intake of riboflavin from food in the United States is approximately 2 mg/day for men and 1.5 mg/day for women. Similarly, a group of healthy residents of rural Georgia was found to have a mean daily intake of riboflavin of 2.1 mg (Roughead and McCormick, 1991). For all life stage and gender groups, fewer than 5 percent of individuals have estimated intakes that are less than the Estimated Average Requirement (EAR) for riboflavin. Dietary riboflavin intake in two Canadian provinces was reported to be similar to U.S. intake (Appendix I).
The Boston Nutritional Status Survey (Appendix F) indicates that this relatively advantaged group of people over age 60 had an estimated median riboflavin intake of 1.9 mg/day for men and 1.5 mg/ day for women.
Intake from Supplements
Information from the Boston Nutritional Status Survey on the use of riboflavin supplements by a free-living elderly population is given in Appendix F. For those taking supplements, the fiftieth percentile of supplemental riboflavin intake was estimated to be 1.9 mg for men and 2.9 mg for women. Approximately 26 percent of all adults took a riboflavin-containing supplement in 1986 (Moss et al., 1989).
TABLE 5-2 Food Groups Providing Riboflavin in the Diets of U.S. Men and Women Aged 19 Years and Older, CSFII, 1995a
|
|
Contribution to Total Riboflavin Intakeb (%) |
Foods Within the Group that Provide at Least 0.3 mg of Riboflavinc per Serving |
||
|
Food Group |
Men |
Women |
0.3–0.7 mg |
> 0.7 mg |
|
Food groups providing at least 5% of total riboflavin intake |
||||
|
Milk and milk drinksd |
14.5 |
16.0 |
Milk and milk products |
Fortified milk drinks |
|
Bread and bread products |
10.8 |
11.2 |
— |
— |
|
Mixed foodse |
9.1 |
6.7 |
NAf |
NA |
|
Ready-to-eat cereals |
8.7 |
10.9 |
Moderately fortified |
Highly fortified |
|
Mixed foods, main ingredient is grain |
7.9 |
6.6 |
NA |
NA |
|
Riboflavin from other food groups |
||||
|
Pasta, rice, and cooked cereals |
2.1 |
2.4 |
Instant oatmeal |
— |
|
Pork |
2.0 |
1.7 |
Pork cutlet and spareribs |
— |
|
Finfish |
0.7 |
0.9 |
Trout |
— |
|
Organ meats |
0.7 |
0.8 |
— |
Liver, kidney, and heart |
|
Soy-based supplements and meal replacements |
0.6 |
0.2 |
Soy-based meat replacements |
— |
|
Lamb, veal, game, and other carcass meat |
0.3 |
0.2 |
Veal chop and venison |
— |
|
a CSFII = Continuing Survey of Food Intakes by Individuals. b Contribution to total intake reflects both the concentration of the nutrient in the food and the amount of the food consumed. It refers to the percentage contribution to the American diet for both men and women based on 1995 CSFII data. c 0.3 mg represents 20% of the Recommended Daily Intake (1.7 mg) of riboflavin—a value set by the Food and Drug Administration. d Includes yogurt. e Includes sandwiches and other foods with meat, poultry, or fish as the main ingredient. f NA = not applicable. Mixed foods were not considered for this table. SOURCE: Unpublished data from the Food Surveys Research Group, Agricultural Research Service, U.S. Department of Agriculture, 1997. |
||||
TOLERABLE UPPER INTAKE LEVELS
Hazard Identification
No adverse effects associated with riboflavin consumption from food or supplements have been reported. However, studies involving large doses of riboflavin (Schoenen et al., 1994; Stripp, 1965; Zempleni et al., 1996) have not been designed to systematically evaluate adverse effects. The limited evidence from studies involving large intakes of riboflavin is summarized here.
No adverse effects were reported in humans after single oral doses of up to 60 mg of supplemental riboflavin and 11.6 mg of riboflavin given intravenously as a single bolus dose (Zempleni et al., 1996). This study is of limited use in setting a Tolerable Upper Intake Level (UL) because it was not designed to assess adverse effects. It is possible that chronic administration of these doses would pose some risk.
A study by Schoenen and coworkers (1994) reported no short-term side effects in 49 patients treated with 400 mg/day of riboflavin taken with meals for at least 3 months. Schoenen and coworkers (1994) reported that one patient receiving riboflavin and aspirin withdrew from the study because of gastric upset. This isolated finding may be an anomaly because no side effects were reported in other patients.
The apparent lack of harm resulting from high oral doses of riboflavin may be due to its limited solubility and limited capacity for absorption in the human gastrointestinal tract (Levy and Jusko, 1966; Stripp, 1965; Zempleni et al., 1996); its rapid excretion in the urine (McCormick, 1994). Zempleni et al. (1996) showed that the maximal amount of riboflavin that was absorbed from a single oral dose was 27 mg. A study by Stripp (1965) found limited absorption of 50 to 500 mg of riboflavin with no adverse effects. The poor intestinal absorption of riboflavin is well recognized: riboflavin taken by mouth is sometimes used to mark the stool in experimental studies. There are no data from animal studies suggesting that uptake of riboflavin during pregnancy presents a potential hazard for the fetus or newborn.
The only evidence of adverse effects associated with riboflavin comes from in vitro studies showing the formation of active oxygen species on intense exposure to visible or ultraviolet light (Ali et al., 1991; Floersheim, 1994; Spector et al., 1995). However, because there are no demonstrated functional or structural adverse effects in humans or animals after excess riboflavin intake, the relevance
of this evidence to human health effects in vivo is highly questionable. Nevertheless, it is theoretically plausible that riboflavin increases photosensitivity to ultraviolet irradiation. Additionally, there is a theoretical risk that excess riboflavin will increase the photosensitized oxidations of cellular compounds, such as amino acids and proteins (McCormick, 1977) in infants treated for hyperbilirubinemia, with possible undesirable consequences.
Dose-Response Assessment
The data on adverse effects from high riboflavin intake are not sufficient for a quantitative risk assessment, and a UL cannot be derived.
Special Considerations
There is some in vitro evidence that riboflavin may interfere with detoxification of chrome VI by reduction to chrome III (Sugiyama et al., 1992). This may be of concern in people who may be exposed to chrome VI, for example, workers in chrome plating. Infants treated for hyperbilirubinemia may also be sensitive to excess riboflavin, as previously mentioned.
Intake Assessment
Although no UL can be set for riboflavin, an intake assessment is provided here for possible future use. Data from the Third National Health and Nutrition Examination Survey (see Appendix H) showed that the highest mean intake of riboflavin from diet and supplements for any life stage and gender group reported was for males aged 31 through 50 years: 6.9 mg/day. The highest reported intake at the ninety-fifth percentile was 11 mg/day in females over age 70 years.
Risk Characterization
No adverse effects have been associated with excess intake of riboflavin from food or supplements. This does not mean that there is no potential for adverse effects resulting from high intakes. Because data on the adverse effects of riboflavin intake are limited, caution may be warranted.
RESEARCH RECOMMENDATIONS FOR RIBOFLAVIN
Priority should be given to studies useful for setting Estimated Average Requirements (EARs) for riboflavin for children, adolescents, pregnant and lactating women, and the elderly. Future studies should be designed specifically around the EAR paradigm, use graded levels of riboflavin intake and clearly defined cutoff values for clinical adequacy and inadequacy, and be conducted for a sufficient duration. Two specific research areas may be productive:
-
development of another functional test for riboflavin status to corroborate and augment the presently used flavin-adenine dinucleotide-dependent erythrocyte glutathione reductase (e.g., a test using a flavin mononucleotide-dependent erythrocyte enzyme such as the pyridoxine [pyridoxamine] 5′-phosphate oxidase) and
-
examination of the effects of physical activity on the requirement for riboflavin.
REFERENCES
Alexander M, Emanuel G, Golin T, Pinto JT, Rivlin RS. 1984. Relation of riboflavin nutriture in healthy elderly to intake of calcium and vitamin supplements: Evidence against riboflavin supplementation. Am J Clin Nutr 39:540–546.
Ali N, Upreti RK, Srivastava LP, Misra RB, Joshi PC, Kidwai AM. 1991. Membrane damaging potential of photosensitized riboflavin. Indian J Exp Biol 29:818–822.
Aw TY, Jones DP, McCormick DB. 1983. Uptake of riboflavin by isolated rat liver cells. J Nutr 113:1249–1254.
Badart-Smook A, van Houwelingen AC, Al MD, Kester AD, Hornstra G. 1997. Fetal growth is associated positively with maternal intake of riboflavin and negatively with maternal intake of linoleic acid. J Am Diet Assoc 97:867–870.
Bamji MS. 1969. Glutathione reductase activity in red blood cells and riboflavin nutritional status in humans. Clin Chim Acta 26:263–269.
Bamji MS. 1976. Enzymic evaluation of thiamin, riboflavin and pyridoxine status of parturient women and their newborn infants . Br J Nutr 35:259–265.
Bamji MS, Chowdhury N, Ramalakshmi BA, Jacob CM. 1991. Enzymatic evaluation of riboflavin status of infants. Eur J Clin Nutr 45:309–313.
Bates CJ. 1987. Human requirements for riboflavin. Am J Clin Nutr 47:122–123.
Bates CJ, Prentice AM, Paul AA, Sutcliffe BA, Watkinson M, Whitehead RG. 1981. Riboflavin status in Gambian pregnant and lactating women and its implications for Recommended Dietary Allowances. Am J Clin Nutr 34:928–935.
Bates CJ, Powers HJ, Downes R, Brubacher D, Sutcliffe V, Thurnhill A. 1989. Riboflavin status of adolescent vs elderly Gambian subjects before and during supplementation. Am J Clin Nutr 50:825–829.
Belko AZ, Obarzanek E, Kalkwarf HJ, Rotter MA, Bogusz S, Miller D, Haas JD, Roe DA. 1983. Effects of exercise on riboflavin requirements of young women. Am J Clin Nutr 37:509–517.
Belko AZ, Obarzanek E, Roach R, Rotter M, Urban G, Weinberg S, Roe DA. 1984. Effects of aerobic exercise and weight loss on riboflavin requirements of moderately obese, marginally deficient young women. Am J Clin Nutr 40:553–561.
Belko AZ, Meredith MP, Kalkwarf HJ, Obarzanek E, Weinberg S, Roach R, McKeon G, Roe DA. 1985. Effects of exercise on riboflavin requirements: Biological validation in weight reducing women. Am J Clin Nutr 41:270–277.
Bessey OA, Horwitt MK, Love RH. 1956. Dietary deprivation of riboflavin and blood riboflavin levels in man. J Nutr 58:367–383.
Blot WJ, Li JY, Taylor PR, Guo W, Dawsey SM, Li B. 1995. The Linxian trials: Mortality rates by vitamin-mineral intervention group. Am J Clin Nutr 62:1424S– 1426S.
Boisvert WA, Mendoza I, Castañeda C, De Portocarrero L, Solomons NW, Gershoff SN, Russell RM. 1993. Riboflavin requirement of healthy elderly humans and its relationship to macronutrient composition of the diet. J Nutr 123:915–925.
Bowman BB, McCormick DB, Rosenberg IH. 1989. Epithelial transport of watersoluble vitamins. Ann Rev Nutr 9:187–199.
Brewer W, Porter T, Ingalls R, Ohlson MA. 1946. The urinary excretion of riboflavin by college women. J Nutr 32:583–596.
Brown ML. 1990. Present Knowledge in Nutrition, 6th ed. Washington, DC: International Life Sciences Institute-Nutrition Foundation.
Brzezinski A, Bromberg YM, Braun K. 1952. Riboflavin excretion during pregnancy and early lactation. J Lab Clin Med 39:84–90.
Burch HB, Bessey OA, Lowry OH. 1948. Fluorometric measurements of riboflavin and its natural derivatives in small quantities of blood serum and cells. J Biol Chem 175:457–470.
Chastain JL, McCormick DB. 1987. Flavin catabolites: Identification and quantitation in human urine. Am J Clin Nutr 46:830–834.
Chia CP, Addison R, McCormick DB. 1978. Absorption, metabolism, and excretion of 8α-(amino acid) riboflavins in the rat. J Nutr 108:373–381.
Cole HS, Lopez R, Cooperman JM. 1976. Riboflavin deficiency in children with diabetes mellitus. Acta Diabetol Lat 13:25–29.
Committee on Nutrition. 1985. Composition of human milk: Normative data. In: Pediatric Nutrition Handbook, 2nd ed. Elk Grove Village, IL: American Academy of Pediatrics. Pp. 363–368.
Dancis J, Lehanka J, Levitz M. 1988. Placental transport of riboflavin: Differential rates of uptake at the maternal and fetal surfaces of the perfused human placenta. Am J Obstet Gynecol 158:204–210.
Daniel H, Wille U, Rehner G. 1983. In vitro kinetics of the intestinal transport of riboflavin in rats. J Nutr 113:636–643.
Darby WJ. 1981. Annual Review of Nutrition, Vol. 1. Palo Alto, CA: Annual Reviews.
Davis MV, Oldham HG, Roberts LJ. 1946. Riboflavin excretions of young women on diets containing varying levels of the B vitamins. J Nutr 32:143–161.
Floersheim GL. 1994. Allopurinol, indomethacin and riboflavin enhance radiation lethality in mice. Radiat Res 139:240–247.
Frischer H, Bowman JE, Carson PE, Reickmann KH, Willerson D Jr, Colwell EJ. 1973. Erythrocyte glutathione reductase, glucose-6-phosphate dehydrogenase, and 6-phosphogluconic dehydrogenase deficiencies in populations of the United States, South Vietnam, Iran, and Ethiopia. J Lab Clin Med 81:603–612.
Heller S, Salkeld RM, Korner WF. 1974. Riboflavin status in pregnancy. Am J Clin Nutr 27:1225–1230.
Horwitt MK. 1972. Riboflavin. Requirements and factors influencing them. In: Sebrell WH Jr, Harris RS, eds. The Vitamins, 2nd ed., Vol. 5. New York: Academic Press.
Horwitt MK, Hills OW, Harvey CC, Liebert E, Steinberg DL. 1949. Effects of dietary depletion of riboflavin. J Nutr 39:357–373.
Horwitt MK, Harvey CC, Hills OW, Liebert E. 1950. Correlation of urinary excretion of riboflavin with dietary intake and symptoms of ariboflavinosis. J Nutr 41:247–264.
Innis WS, McCormick DB, Merrill AH Jr. 1985. Variations in riboflavin binding by human plasma: Identification of immunoglobulins as the major proteins responsible. Biochem Med 34:151–165.
Jansen AP, Jansen BC. 1954. Riboflavin-excretion with urine in pregnancy. Int Z Vitaminforsch 25:193–199.
Jusko WJ, Levy G. 1967. Absorption, metabolism, and excretion of riboflavin 5′-phosphate in man. J Pharmacol Sci 156:58–62.
Jusko WJ, Levy G. 1975. Absorption, protein binding and elimination of riboflavin. In: Rivlin RS, ed. Riboflavin. New York: Plenum Press. Pp. 99–152.
Jusko WJ, Khanna N, Levy G, Stern L, Yaffe SJ. 1970. Riboflavin absorption and excretion in the neonate. Pediatrics 45:945–949.
Keys A, Henschel AF, Mickelsen O, Brozek JM, Crawford JH. 1944. Physiological and biochemical functions in normal young men on a diet restricted in riboflavin. J Nutr 27:165–178.
Komindr S, Nichoalds GE. 1980. Clinical significance of riboflavin deficiency. In: Brewster MA, Naito HK, eds. Nutritional Elements in Clinical Biochemistry. New York: Plenum Press. Pp. 15–68.
Kuizon MD, Natera MG, Alberto SP, Perlas LA, Desnacido JA, Avena EM, Tajaon RT, Macapinlac MP. 1992. Riboflavin requirement of Filipino women. Eur J Clin Nutr 46:257–264.
Lee SS, McCormick DB. 1983. Effect of riboflavin status on hepatic activities of flavin-metabolizing enzymes in rats. J Nutr 113:2274–2279.
Leske MC, Wu SY, Hyman L, Sperduto R, Underwood B, Chylack LT, Milton RC, Srivastava S, Ansari N. 1995. Biochemical factors in the lens opacities. Case-control study. The Lens Opacities Case-Control Study Group. Arch Ophthalmol 113:1113–1119.
Levy G, Jusko WJ. 1966. Factors affecting the absorption of riboflavin in man. J Pharm Sci 55:285–289.
Lossy FT, Goldsmith GA, Sarett HP. 1951. A study of test dose excretion of five B complex vitamins in man. J Nutr 45:213.
Mayersohn M, Feldman S, Gribaldi M. 1969. Bile salt enhancement of riboflavin and flavin mononucleotide absorption in man. J Nutr 98:288–296.
McCormick DB. 1962. The intracellular localization, partial purification, and properties of flavokinase from rat liver. J Biol Chem 237:959–962.
McCormick DB. 1977. Interactions of flavins with amino acid residues: Assessments from spectral and photochemical studies. Photochem Photobiol 26:169–182.
McCormick DB. 1989. Two interconnected B vitamins: Riboflavin and pyridoxine. Physiol Rev 69:1170–1198.
McCormick DB. 1994. Riboflavin. In: Shils ME, Olson JE, Shike M, eds. Modern Nutrition in Health and Disease. Philadelphia: Lea & Febiger. Pp. 366–375.
McCormick DB, Greene HL. 1994. Vitamins. In: Burtis CA, Ashwood ER, eds. Tietz Textbook of Clinical Chemistry. Philadelphia: Saunders.
Meinen M, Aeppli R, Rehner G. 1977. Studies on the absorption of thiamine, riboflavin and pyridoxine in vitro. Nutr Metab 21:264–266.
Merrill AH Jr, Lambeth JD, Edmondson DE, McCormick DB. 1981. Formation and mode of action of flavoproteins. Annu Rev Nutr 1:281–317.
Merrill AH Jr, Foltz AT, McCormick DB. 1991. Vitamins and cancer. In: Alfin-Slater RB, Kritchevsky D, eds. Cancer and Nutrition. New York: Plenum. Pp. 261–320.
Montalto MB, Benson JD, Martinez GA. 1985. Nutrient intake of formula-fed infants and infants fed cow’s milk. Pediatrics 75:343–351.
Moss AJ, Levy AS, Kim I, Park YK. 1989. Use of Vitamin and Mineral Supplements in the United States: Current Users, Types of Products, and Nutrients. Advance Data, Vital and Health Statistics of the National Center for Health Statistics, No. 174. Hyattsville, MD: National Center for Health Statistics.
Nail PA, Thomas MR, Eakin R. 1980. The effect of thiamin and riboflavin supplementation on the level of those vitamins in human breast milk and urine. Am J Clin Nutr 33:198–204.
Natraj U, George S, Kadam P. 1988. Isolation and partial characterisation of human riboflavin carrier protein and the estimation of its levels during human pregnancy. J Reprod Immunol 13:1–16.
Nichoalds GE. 1981. Riboflavin. Symposium in Laboratory Medicine. In: Labbae RF, ed. Symposium on Laboratory Assessment of Nutritional Status. Clinics in Laboratory Medicine Series, Vol. 1. Philadelphia: WB Saunders. Pp. 685–698.
Oldham H, Johnston F, Kleiger S, Hedderich-Arismendi H. 1944. A study of the riboflavin and thiamine requirements of children of preschool age. J Nutr 27:435–446.
Powers HJ, Bates CJ, Eccles M, Brown H, George E. 1987. Bicycling performance in Gambian children: Effects of supplements of riboflavin or ascorbic acid. Hum Nutr Clin Nutr 41:59–69.
Prager MD, Hill JM, Speer RJ. 1958. Whole blood riboflavin levels in healthy individuals and in patients manifesting various blood dyscrasias. J Lab Clin Med 52:206.
Prasad PA, Bamji MS, Lakshmi AV, Satyanarayana K. 1990. Functional impact of riboflavin supplementation in urban school children. Nutr Res 10:275–281.
Ramsay VP, Neumann C, Clark V, Swendseid ME. 1983. Vitamin cofactor saturation indices for riboflavin, thiamine, and pyridoxine in placental tissue of Kenyan women. Am J Clin Nutr 37:969–973.
Rivier DA. 1973. Kinetics and Na-dependence of riboflavin absorption by intestine in vivo. Experientia 29:1443–1446.
Rivlin RS. 1975. Riboflavin and cancer. In: Rivlin RS, ed. Riboflavin. New York: Plenum Press. Pp. 369–391.
Roe DA, Bogusz S, Sheu J, McCormick DB. 1982. Factors affecting riboflavin requirements of oral contraceptive users and nonusers. Am J Clin Nutr 35:495– 501.
Roughead ZK, McCormick DB. 1990a. Flavin composition of human milk. Am J Clin Nutr 52:854–857.
Roughead ZK, McCormick DB. 1990b. Qualitative and quantitative assessment of flavins in cow’s milk. J Nutr 120:382–388.
Roughead ZK, McCormick DB. 1991. Urinary riboflavin and its metabolites: Effects of riboflavin supplementation in healthy residents of rural Georgia (USA). Eur J Clin Nutr 45:299–307.
Sadowski JA. 1992. Riboflavin. In: Hartz SC, Russell RM, Rosenberg IH, eds. Nutrition in the Elderly. The Boston Nutritional Status Survey. London: Smith-Gordon. Pp. 119–125.
Said HM, Ma TY. 1994. Mechanism of riboflavine uptake by Caco-2 human intestinal epithelial cells. Am J Physiol 266:G15–G21.
Sauberlich HE, Judd JH Jr, Nichoalds GE, Broquist HP, Darby WJ. 1972. Application of the erythrocyte glutathione reductase assay in evaluating riboflavin nutritional status in a high school student population. Am J Clin Nutr 25:756– 762 .
Sauberlich HE, Skala JH, Dowdy RP. 1974. Laboratory Tests for the Assessment of Nutritional Status. Boca Raton, FL: CRC Press.
Schoenen J, Lenaerts M, Bastings E. 1994. Rapid communication: High-dose riboflavin as a prophylactic treatment of migraine: Results of an open pilot study. Cephalalgia 14:328–329.
Sebrell WH Jr, Butler RE, Wooley JG, Isbell H. 1941. Human riboflavin requirement estimated by urinary excretion of subjects on controlled intake. Public Health Rep 56:510–519.
Smith MD. 1980. Rapid method for determination of riboflavin in urine by highperformance liquid chromatography. J Chromatogr 182:285–291.
Soares MJ, Satyanarayana K, Bamji MS, Jacob CM, Ramana YV, Rao SS. 1993. The effect of exercise on the riboflavin status of adult men. Br J Nutr 69:541–551.
Sorrell MF, Frank O, Thompson AD, Aquino H, Baker H. 1971. Absorption of vitamins from the large intestine in vivo. Nutr Rep Int 3:143–148.
Spector A, Wang GM, Wang RR, Li WC, Kleiman NJ. 1995. A brief photochemically induced oxidative insult causes irreversible lens damage and cataracts. 2. Mechanism of action. Exp Eye Res 60:483–493.
Steier M, Lopez R, Cooperman JM. 1976. Riboflavin deficiency in infants and children with heart disease. Am Heart J 92:139–143.
Stripp B. 1965. Intestinal absorption of riboflavin by man. Acta Pharmacol Toxicol 22:353–362.
Sugiyama M, Tsuzuki K, Lin X, Costa M. 1992. Potentiation of sodium chromate (VI)-induced chromosomal aberrations and mutation by vitamin B2 in Chinese hamster V79 cells. Mutat Res 283:211–214.
Thomas MR, Sneed SM, Wei C, Nail PA, Wilson M, Sprinkle EE 3rd. 1980. The effects of vitamin C, vitamin B6, vitamin B12, folic acid, riboflavin, and thiamin on the breast milk and maternal status of well-nourished women at 6 months postpartum . Am J Clin Nutr 33:2151–2156.
Tremblay A, Boilard M, Bratton MF, Bessette H, Roberge AB. 1984. The effects of a riboflavin supplementation on the nutritional status and performance of elite swimmers. Nutr Res 4:201–208.
Tucker RG, Mickelsen O, Keys A. 1960. The influence of sleep, work, diuresis, heat, acute starvation, thiamine intake and bed rest on human riboflavin excretion. J Nutr 72:251–261.
Vir SC, Love AH, Thompson W. 1981. Riboflavin status during pregnancy. Am J Clin Nutr 34:2699–2705.
Weight LM, Noakes TD, Labadarios D, Graves J, Jacobs P, Berman PA. 1988. Vitamin and mineral status of trained athletes including the effects of supplementation. Am J Clin Nutr 47:186–191.
WHO (World Health Organization). 1965. Nutrition in Pregnancy and Lactation. Report of a WHO Expert Committee. Technical Report Series No. 302. Geneva: World Health Organization.
Williams RD, Mason HL, Cusick PL, Wilder RM. 1943. Observations on induced riboflavin deficiency and the riboflavin requirement of man. J Nutr 25:361– 377.
Wilson JA. 1983. Disorders of vitamins: Deficiency, excess and errors of metabolism. In: Petersdorf RG, Harrison TR, eds. Harrison’s Principles of Internal Medicine, 10th ed. New York: McGraw-Hill. Pp. 461–470.
Winters LR, Yoon JS, Kalkwarf HJ, Davies JC, Berkowitz MG, Haas J, Roe DA. 1992. Riboflavin requirements and exercise adaptation in older women. Am J Clin Nutr 56:526–532.
Yamada Y, Merrill AH Jr, McCormick DB. 1990. Probable reaction mechanisms of flavokinase and FAD synthetase from rat liver. Arch Biochem Biophys 278:125– 130.
Zempleni J, Galloway JR, McCormick DB. 1996. Pharmacokinetics of orally and intravenously administered riboflavin in healthy humans. Am J Clin Nutr 63:54– 66.


