
8
Folate
SUMMARY
Folate functions as a coenzyme in single-carbon transfers in the metabolism of nucleic and amino acids. The primary indicator used to estimate the Recommended Dietary Allowance (RDA) for folate is erythrocyte folate in conjunction with plasma homocysteine and folate concentrations. The RDA for both men and women is 400 µg/day of dietary folate equivalents (DFEs). DFEs adjust for the nearly 50 percent lower bioavailability of food folate compared with that of folic acid: 1 µg of dietary folate equivalent = 0.6 µg of folic acid from fortified food or as a supplement taken with meals = 1 µg of food folate = 0.5 µg of a supplement taken on an empty stomach. To reduce the risk of neural tube defects for women capable of becoming pregnant, the recommendation is to take 400 µg of folic acid daily from fortified foods, supplements, or both in addition to consuming food folate from a varied diet. The evidence available on the role of folate in reducing the risk of vascular disease, cancer, and psychiatric and mental disorders is not sufficiently conclusive to use risk reduction of these conditions as a basis for setting the Estimated Average Requirement (EAR) and the RDA.
In the U.S. adult population from 1988 to 1994, which was before cereal grains were fortified with folate, the reported median intake of folate from food was approximately 250 µg/day, but this value underestimates current intake. The ninety-fifth percentile of intake from food and supplements was close to 900 µg/day overall
and nearly 1,700 µg/day for pregnant women. After the fortification of cereal grains with folate—which became mandatory for enriched grains in the United States as of January 1, 1998, and is now authorized in Canada—average intake of folate is expected to increase by about 80 to 100 µg/day for women and by more for men. The Tolerable Upper Intake Level (UL) for adults is set at 1,000 µg/day of folate from fortified food or as a supplement, exclusive of food folate.
BACKGROUND INFORMATION
Folate is a generic term for this water-soluble B-complex vitamin, which functions in single-carbon transfer reactions and exists in many chemical forms (Wagner, 1996). Folic acid (pteroylmonoglutamic acid), which is the most oxidized and stable form of folate, occurs rarely in food but is the form used in vitamin supplements and in fortified food products. Folic acid consists of a p-aminobenzoic acid molecule linked at one end to a pteridine ring and at the other end to one glutamic acid molecule. Most naturally occurring folates, called food folate in this report, are pteroylpolyglutamates, which contain one to six additional glutamate molecules joined in a peptide linkage to the γ-carboxyl of glutamate.
Function
The folate coenzymes are involved in numerous reactions that involve (1) deoxyribonucleic acid (DNA) synthesis, which depends on a folate coenzyme for pyrimidine nucleotide biosynthesis (methylation of deoxyuridylic acid to thymidylic acid) and thus is required for normal cell division; (2) purine synthesis (formation of glycinamide ribonucleotide and 5-amino-4-imidazole carboxamide ribonucleotide); (3) generation of formate into the formate pool (and utilization of formate); and (4) amino acid interconversions, including the catabolism of histidine to glutamic acid, interconversion of serine and glycine, and conversion of homocysteine to methionine. Folate-mediated transfer of single-carbon units from serine provides a major source of substrate in single-carbon metabolism. The conversion of homocysteine to methionine serves as a major source of methionine for the synthesis of S-adenosyl-methionine, an important in vivo methylating agent (Wagner, 1996).
Physiology of Absorption, Metabolism, and Excretion
Absorption, Transport, and Storage
Food folates (polyglutamate derivatives) are hydrolyzed to monoglutamate forms in the gut before absorption across the intestinal mucosa. This cleavage is accomplished by a γ-glutamylhydrolase, more commonly called folate conjugase. The monoglutamate form of folate is actively transported across the proximal small intestine by a saturable pH-dependent process. When pharmacological doses of the monoglutamate form of folate are consumed, it is also absorbed by a nonsaturable mechanism involving passive diffusion.
Monoglutamates, mainly 5-methyl-tetrahydrofolate, are present in the portal circulation. Much of this folate can be taken up by the liver, where it is metabolized to polyglutamate derivatives and retained or released into the blood or bile. Approximately two-thirds of the folate in plasma is protein bound. A variable proportion of plasma folate is bound to low-affinity protein binders, primarily albumin, which accounts for about 50 percent of bound folate. Low levels of high-affinity folate binders are also present in plasma.
Cellular transport of folate is mediated by a number of different folate transport systems, which can be characterized as either membrane carriers or folate-binding protein-mediated systems. These transport systems are not saturated by folate under physiological conditions, and folate influx into tissues would be expected after any elevation in plasma folate after supplementation.
Folate concentrations in liver of 4.5 to 10 µg/g were reported after liver biopsies (Whitehead, 1973). Because the adult male liver weighs approximately 1,400 g, the total quantity of folate in the liver would be approximately 6 to 14 mg. If the liver is assumed to contain 50 percent of the body stores of folate, the estimated total body folate store would be 12 to 28 mg. Using the same assumption, Hoppner and Lampi (1980) determined average liver folate concentrations to be approximately 8 µg/g (range 3.6 to 14.8 µg/g) after autopsy; the liver folate content would be approximately 11 mg and total body folate 22 mg.
Metabolism and Excretion
Before being stored in tissue or used as a coenzyme, folate monoglutamate is converted to the polyglutamate form by the enzyme folylpolyglutamate synthetase. When released from tissues into circulation, folate polyglutamates are reconverted to the mono-
glutamate form by γ-glutamylhydrolase. Folates must be reduced enzymatically and resynthesized to the polyglutamate form to function in single-carbon transfer reactions.
The metabolic interrelationship between folate and vitamin B12 may explain why a single deficiency of either vitamin leads to the same hematological changes. Both folate and vitamin B12 are required for the formation of 5,10-methylenetetrahydrofolate and involved in thymidylate synthesis by way of a vitamin B12-containing enzyme. The formation of 5,10-methylene tetrahydrofolate depends on the regeneration of the parent compound (tetrahydrofolate) in the homocysteine-to-methionine conversion. This reaction involves the removal of a methyl group from methyl folate and the delivery of this group to homocysteine for the synthesis of methionine. Folate is involved as a substrate (5-methyl-tetrahydrofolate) and vitamin B12 as a coenzyme. The 5,10-methylenetetrahydrofolate delivers its methyl group to deoxyuridylate to convert it to thymidylate for incorporation into DNA. In either a folate or vitamin B12 deficiency, the megaloblastic changes occurring in the bone marrow and other replicating cells result from lack of adequate 5,10-methylene-tetrahydrofolate.
The major route of whole-body folate turnover appears to be via catabolism to cleavage products. The initial step in folate catabolism involves the cleavage of intracellular folylpolyglutmate at the C9-N10 bond, and the resulting p-aminobenzoylpolyglutamates are hydrolyzed to the monoglutamate, which is N-acetylated before excretion.
Folate freely enters the glomerulus and is reabsorbed in the proximal renal tubule. The net effect is that most of the secreted folate is reabsorbed. The bulk of the excretion products in humans are folate cleavage products. Intact urinary folate represents only a very small percentage of dietary folate. Biliary excretion of folate has been estimated to be as high as 100 µg/day (Herbert and Das, 1993; Whitehead, 1986); however, much of this is reabsorbed by the small intestine (Weir et al., 1985). Fecal folate losses occur, but it is difficult to distinguish actual losses from losses of folate synthesized by the intestinal microflora (Krumdieck et al., 1978).
Clinical Effects of Inadequate Intake
Inadequate folate intake first leads to a decrease in serum folate concentration, then to a decrease in erythrocyte folate concentration, a rise in homocysteine concentration, and megaloblastic changes in the bone marrow and other tissues with rapidly dividing cells.
Within weeks of the development of early morphological abnormalities in the marrow, subtle changes appear in the peripheral blood (Eichner et al., 1971) when hypersegmentation of the neutrophils becomes apparent. The peripheral blood picture is variable before the development of a clearly increased mean cell volume or anemia (Lindenbaum et al., 1988). In some deficient individuals, macrocytes and macroovalocytes are seen on blood smears, but in others the erythrocytes may show only minimal anisocytosis or no abnormalities. When folate supply to the bone marrow becomes rate limiting for erythropoiesis, macrocytic cells are produced. However, because of the 120-day lifespan of normal erythrocytes, macrocytosis is not evident in the early stages of folate-deficient megaloblastosis.
As folate depletion progresses further, the mean cell volume increases above normal. Neutrophil hypersegmentation (defined as more than 5 percent five-lobed or any six-lobed cells per 100 granulocytes) is typically present in the peripheral blood at this stage of macrocytosis and the neutrophil lobe average is elevated.
Macrocytic anemia then develops, as first evidenced by a depression of the erythrocyte count. Eventually, all three measures of anemia (hematocrit, hemoglobin concentration, and erythrocyte concentration) are depressed. At this point, macroovalocytes and macrocytes are usually detectable in the peripheral blood, and hypersegmentation is more impressive (Lindenbaum et al., 1988).
Because the onset of anemia is usually gradual, compensating cardiopulmonary and biochemical mechanisms provide adaptive adjustments to the diminished oxygen-carrying capacity of the blood until anemia is moderate to severe. Symptoms of weakness, fatigue, difficulty concentrating, irritability, headache, palpitations, and shortness of breath therefore typically appear at an advanced stage of anemia. They may be seen at milder degrees of anemia in some patients, especially the elderly (Lindenbaum et al., 1988). Atrophic glossitis may also occur (Savage et al., 1994).
SELECTION OF INDICATORS FOR ESTIMATING THE REQUIREMENT FOR FOLATE
The primary indicator selected to determine folate adequacy is erythrocyte folate, which reflects tissue folate stores, as described in detail below. For some life stage or gender groups, this is used in conjunction with plasma homocysteine (which reflects the extent of the conversion of homocysteine to methionine) and plasma or serum folate. Other indicators are discussed briefly below; risk reduc-
tion of chronic disease or developmental abnormalities is covered in detail in a later section.
Erythrocyte Folate
Because folate is taken up only by the developing erythrocyte in the bone marrow and not by the circulating mature erythrocyte during its 120-day lifespan, erythrocyte folate concentration is an indicator of long-term status. Erythrocyte folate concentration was shown to be related to tissue stores by its correlation, although weak, with liver folate concentration determined by biopsy in the same individual in a study of 45 subjects (Wu et al., 1975).
Erythrocyte folate concentration does not reflect recent or transient changes in dietary folate intake. A value of 305 nmol/L (140 ng/mL) of folate was chosen as the cutoff point for adequate folate status on the basis of the following experiments: On a diet containing only 5 µg/day of folate, the appearance of hypersegmented neutrophils in the peripheral blood of one subject coincided with the approximate time when the erythrocyte folate concentration decreased to less than 305 nmol/L (140 ng/mL) (Herbert, 1962a). On a diet containing less than 20 µg/day of folate, the appearance of hypersegmented neutrophils in two subjects preceded the reduction in erythrocyte folate to concentrations below 305 nmol/L (140 ng/mL) by about 2 weeks (Eichner et al., 1971). In a group of 40 patients with megaloblastic anemia caused by folate deficiency, 100 percent had erythrocyte folate values less than 305 nmol/L (140 ng/mL); values were the lowest in the most anemic subjects and the highest mean lobe counts occurred in the subjects with the lowest erythrocyte folate concentrations (Hoffbrand et al., 1966). All 238 pregnant women with erythrocyte folate concentrations below 327 nmol/L (150 ng/mL) were found to have megaloblastic marrow (Varadi et al., 1966). Eight subjects with erythrocyte folate of less than 305 nmol/L (140 ng/mL) had eight- to ninefold greater incorporation of uracil into DNA than did 14 control subjects and had a threefold increase in frequency of cellular micronuclei (a measure of DNA and chromosome damage); folate supplementation reduced the abnormalities (Blount et al., 1997).
Plasma Homocysteine
In this report, plasma homocysteine concentration refers to total homocysteine concentration. Plasma homocysteine concentration increases when inadequate quantities of folate are available to do-
nate the methyl group that is required to convert homocysteine to methionine. Controlled metabolic and epidemiological studies provide evidence that plasma homocysteine rises with reductions in blood folate indices. Different cutoff values have been used by various investigators to define elevated homocysteine concentrations. The cutoff value for plasma homocysteine cited most often is greater than 16 µmol/L, but 14 µmol/L (Selhub et al., 1993) and 12 µmol/L (Rasmussen et al., 1996) have also been used. Ubbink and coworkers (1995a) used a prediction model to define a reference range as 4.9 to 11.7 µmol/L. Other investigators have proposed age-and gender-specific reference intervals (Rasmussen et al., 1996).
Many investigators have reported that plasma homocysteine is significantly elevated in individuals who have been diagnosed as folate deficient on the basis of established serum folate, plasma folate, or erythrocyte folate norms (Allen et al., 1993; Chadefaux et al., 1994; Curtis et al., 1994; Kang et al., 1987; Savage et al., 1994; Stabler et al., 1988; Ubbink et al., 1993).
The evidence supporting the use of homocysteine as an ancillary indicator of folate status is summarized as follows:
-
In 10 young men, folate depletion led to a rise in plasma homocysteine and a decrease in plasma folate (Jacob et al., 1994).
-
In young women, a folate intake equivalent to 320 µg/day of dietary folate equivalents was associated with elevated plasma homocysteine (greater than 14 µmol/L); at this level of intake plasma homocysteine concentrations were inversely associated with erythrocyte and serum folate concentrations (O’Keefe et al., 1995).
-
In a cross-sectional analysis involving elderly individuals, plasma homocysteine exhibited a strong inverse association with plasma folate after age, gender, and intakes of other vitamins were controlled for (Selhub et al., 1993); homocysteine values appeared to plateau at folate intakes greater than approximately 350 to 400 µg/ day. A meta-analysis by Boushey and colleagues (1995) supports the existence of a plateau when adequate folate is consumed.
Thus, in studies of different types, a similar inverse relationship between folate intake and plasma homocysteine values is seen for pre- and postmenopausal women, adult men, and the elderly.
Ward and colleagues (1997) supplemented each of 30 male subjects with 100, 200, or 400 µg of folate. The men were consuming a regular diet that averaged 281 µg/day of folate. Plasma homocysteine, serum folate, and erythrocyte folate were assessed before, during, and 10 weeks after intervention. Results, expressed as tertiles of
baseline plasma homocysteine, showed significant homocysteine lowering in the top (mean 11 µmol/L) and middle (mean 9 µmol/ L) homocysteine tertiles but not in the bottom tertile (mean 7 µmol/L). All baseline homocysteine values were within the normal range; the highest was 12.3 µmol/L. Of the three folate doses, 200 µg appeared to be as effective as 400 µg whereas 100 µg was less effective at lowering homocysteine. These data suggest that there is a concentration of plasma homocysteine below which folate has no further lowering effect.
Maternal hyperhomocysteinemia has been implicated as a risk factor for complications during pregnancy (Burke et al., 1992; Goddijn-Wessel et al., 1996; Rajkovic et al., 1997; Steegers-Theunissen et al., 1992, 1994; Wouters et al., 1993), but the relationship between folate intake and the complications has not been established.
Although plasma homocysteine is a sensitive indicator of folate status, it is not a highly specific one: it can be influenced by vitamin B12 status (Stabler et al., 1996), vitamin B6 status (Ubbink et al., 1995a), age (Selhub et al., 1993), gender (Selhub et al., 1993), race (Ubbink et al., 1995b), some genetic abnormalities (e.g., methyltetrahydrofolate reductase deficiency) (Jacques et al., 1996; Malinow et al., 1997), and renal insufficiency (Hultberg et al., 1993). Thus, plasma homocysteine alone is not an acceptable indicator on which to base the folate requirement.
Knowledge of the relationships of folate, homocysteine, and risk of vascular disease was judged too weak to use as the basis for deriving the Estimated Average Requirement (EAR) for folate. This topic is described in more detail in “Reducing Risk of Developmental Disorders and Chronic Degenerative Disease.”
Serum Folate
A serum folate concentration of less than 7 nmol/L (3 ng/mL) indicates negative folate balance at the time the blood sample was drawn (Herbert, 1987). In all the experimental studies of human volunteers subjected to folate deprivation, a decrease in the serum folate concentration, usually occurring within 1 to 3 weeks, was the first event (Eichner and Hillman, 1971; Eichner et al., 1971; Halsted et al., 1973; Herbert 1962a; Sauberlich et al., 1987). This initial period of folate deprivation is followed by weeks or months when the serum folate concentration is low but there is no other evidence of deficiency. The circulating folate concentration may also be depressed in situations in which there is no detectable alteration in
total body folate, such as acute alcohol ingestion (Eichner and Hillman, 1973).
In population surveys it is generally assumed that measuring serum folate alone does not differentiate between what may be a transitory reduction in folate intake or chronic folate deficiency accompanied by depleted folate stores and functional changes. Serum or plasma folate is, however, considered a sensitive indicator of dietary folate intake, as illustrated by the report of Jacques and colleagues (1993) in which plasma folate doubled across quartiles of folate intake assessed in a study of 140 people. In a controlled metabolic study, repeated measures over time in the same individual do reflect changes in status. Serum folate concentration may be a worthwhile diagnostic test if used and interpreted correctly in conjunction with other folate status indices (Lindenbaum et al., 1988).
Urinary Folate
Data from a metabolic study in which graded doses of folate were fed showed that urinary folate is not a sensitive indicator of folate status (Sauberlich et al., 1987). In that study, approximately 1 to 2 percent of dietary folate was excreted intact in the urine; excretion continued even in the face of advanced folate depletion. Other reports indicate that daily folate excretion on a normal diet ranges from 5 to 40 µg/day (Cooperman et al., 1970; Retief, 1969; Tamura and Stokstad, 1973).
The major route of whole-body folate turnover is by catabolism and cleavage of the C9-N10 bond producing pteridines and p-amino-benzoylglutamate (pABG) (Krumdieck et al. 1978; Saleh et al., 1982). Before excretion from the body, most pABG is N-acetylated to acetamidobenzoylglutamate (apABG). It is not known whether folate coenzymes are catabolized and excreted or whether they are recycled after metabolic utilization. In a study designed to estimate the folate requirements of pregnant and nonpregnant women, McPartlin and coworkers (1993) quantified the urinary excretion of pABG and apABG as a measure of daily folate utilization. This approach does not take into account endogenous fecal folate loss, which may be substantial (Krumdieck et al., 1978); thus, quantitation of urinary catabolites alone may result in an underestimation of the requirement.
Indicators of Hematological Status
The appearance of hypersegmented neutrophils, macrocytosis,
and other abnormal hematological findings occurs late in the development of deficiency (see “Clinical Effects of Inadequate Intake”). Thus, hematological findings were not used to derive the EAR.
Risk of Neural Tube Defects and of Chronic Degenerative Diseases
The role of folate in the prevention of neural tube defects (NTDs) was very carefully considered, but not in the context of setting an EAR. Although the evidence is strong that the risk of having a fetus with an NTD decreases with increasing intake of folate during the periconceptional period (about 1 month before to 1 month after conception), this type of risk reduction was judged inappropriate for use as an indicator for setting the EAR for folate for women of childbearing age. There are several reasons for this. The population at risk is all women capable of becoming pregnant, but only those women who become pregnant would benefit from an intervention aimed at reducing NTD risk. The risk of NTD in the U.S. population is about 1 per 1,000 pregnancies, but the critical period for prevention—the periconceptional period—is very short. The definition of EAR, which indicates that half of the individuals in the population have intakes sufficient to meet a particular criterion, does not accommodate NTD prevention as an appropriate criterion. Because of the importance of this topic, it is covered separately in the later section “Reducing Risk of Developmental Disorders and Chronic Degenerative Disease.”
The possible use of criteria involving reduction of risk of vascular disease, certain types of cancer, and psychiatric and mental disorders was also carefully considered. The evidence was not judged sufficient to use prevention of any chronic disease or condition as a criterion for setting the EAR; this evidence is also presented in the section “Reducing Risk of Developmental Disorders and Chronic Degenerative Disease.”
METHODOLOGICAL ISSUES
Measurement of Blood Folate Values
Substantial variation within and across methods was evident from the results of an international comparative study of the analysis of serum and whole-blood folate (Gunter et al., 1996). Results for whole-blood pools were more variable than for serum pools. The authors concluded that folate concentrations measured in one lab-
oratory cannot be compared reliably with those measured in another laboratory without considering interlaboratory differences and that comparing data for different study populations measured by different methods is difficult.
The Bio-Rad Quantaphase Radioassay was used for the first 4 years of the Third National Health and Nutrition Examination Survey (NHANES III) (1988–1991). In 1991 it was determined that the Bio-Rad radioassay gave results that were 30 percent too high when external, purified pteroylglutamic acid (PGA) standard solutions were measured. The Bio-Rad assay was then recalibrated by using calibrator solutions of PGA concentrations of 2.3, 5.7, 11, 22.6, and 45 nmol/L (1.0, 2.5, 5.0, 10.0, and 20.0 ng/mL). The net effect of this recalibration was the expected 30 percent reduction in the measured folate concentrations of a sample. An analysis by another expert panel (LSRO/FASEB, 1994) provides further information. The NHANES III laboratory conducted a 19-day comparison study of NHANES III serum and erythrocyte specimens using the original and recalibrated Bio-Rad kits and confirmed the 30 percent reduction. Through the use of a regression equation developed from the comparison study, the correction was applied to the NHANES III data generated with the original assay (LSRO/FASEB, 1994).
The NHANES III data (Appendix K) have been corrected for this method problem associated with inappropriate calibration. Data from NHANES III are believed to “provide as accurate and precise an estimation of serum and RBC [red blood cell] folate levels in the United States population as is possible until a definitive method has been developed and [this should be considered] as a stand-alone data set, without applying cutoffs established using other laboratory methods” (E.W.Gunter, Division of Environmental Health Laboratory Sciences, National Center for Environmental Health, Centers for Disease Control and Prevention, personal communication, 1997).
Earlier, after NHANES II, similar issues were addressed by a Life Sciences Research Office expert panel (LSRO/FASEB, 1984). Such an effort is even more warranted related to NHANES III because this survey (unlike NHANES II) had been designed to provide an assessment of folate status of the entire U.S. population.
Measurement and Reporting of Food Folate
It is recognized that food folate composition data contained in currently used databases provide inaccurate estimations of folate intake of the U.S. population. Because of the limitations of tradi-
tional analytical methods used in generating the food composition data for folate, the database values underestimate actual folate content. Problems with the traditional methods include incomplete release of folate from the food matrix and possibly incomplete hydrolysis of polyglutamyl folates before quantitation. For example, buffer solutions widely used for sample homogenization in food analysis have been shown to yield incomplete recovery relative to a more effective extraction buffer (Gregory et al., 1990). As much as a twofold greater folate concentration is obtained when an improved extraction procedure rather than an older procedure is used in the analysis of foods such as green peas and liver (Tamura et al., 1997).
The use of a trienzyme approach (amylase and protease treatments in addition to folate conjugase) enhances folate yield in food analysis (Martin et al., 1990; Tamura et al., 1997). Pfeiffer and colleagues (1997b) confirmed the effectiveness of the trienzyme approach for the analysis of cereal-grain foods with or without folate fortification. The extent of differences among approaches varies from food to food, and there is no current means of predicting actual folate content from the existing database values. Analytical methods used to obtain food folate data for databases have used extraction procedures (Gregory et al., 1990) and enzyme digestion treatments that are not optimal for the specific food, resulting in a significant underestimation of food folate (DeSouza and Eitenmiller, 1990; Martin et al., 1990; Pfeiffer et al., 1997b; Tamura et al., 1997).
Many studies of population groups have used food composition databases and measures of food intake to estimate folate intake. The mean estimates in these studies are based on data largely or entirely from the U.S. Department of Agriculture nutrient database. For the analytical reasons indicated above, it is likely that all these estimates of dietary folate intake are underestimates of actual intake. Therefore, conclusions regarding the EAR for folate should not be based on estimates of folate intake from current food composition databases.
FACTORS AFFECTING THE FOLATE REQUIREMENT
Factors considered when estimating the folate requirement include the bioavailability of folic acid and food folate, nutrient-nutrient interactions, interactions with other food components, smoking, folate-drug interactions, and genetic variations.
Bioavailability
As explained below, the bioavailability of folate ranges from about 100 percent for folic acid supplements taken on an empty stomach to about 50 percent for food folate.
Bioavailability of Folic Acid
When consumed under fasting conditions, supplements of folic acid are nearly 100 percent bioavailable (Gregory, 1997). Daly and coworkers (1997) reported incremental increases in erythrocyte folate in response to graded doses of folic acid, which provides evidence for the high bioavailability of supplemental folate. Additional work may be necessary to improve the precision of the estimate of bioavailability (Pfeiffer et al., 1997a).
No published information was found regarding the effect of food on the bioavailability of folate supplements. Pfeiffer and coworkers (1997a) recently examined the bioavailability of C13-labeled folic acid (administered in apple juice) when given with or without a serving of food; they found a slight (about 15 percent) but insignificant reduction when folic acid was consumed with a portion of food. From these experimental data the bioavailability of folic acid consumed with food is estimated to be 85 percent. Studies have not been conducted to define the bioavailability of folic acid consumed with entire meals. It is assumed that the bioavailability would be somewhat lower than that observed with folic acid alone or with a small portion of food.
Bioavailability of Folate Added to Foods
The recently approved U.S. fortification of breads and grains with folate has raised interest in the bioavailability of folate provided in the form of folic acid. On the basis of erythrocyte folate response over a 3-month study, it was concluded that the folate in a supplement and in fortified bread and breakfast cereal consumed in the context of normal diet was equally bioavailable (Cuskelly et al., 1996). Pfeiffer and colleagues (1997a) evaluated the bioavailability of folate from cereal-grain foods fortified experimentally with C13-labeled folic acid. In a series of single-dose trials with human subjects, there was a slight but insignificant difference between the control (water with folic acid) and any of the tested foods (white and whole-wheat bread, pasta, and rice). This finding indicates high bioavailability of the folate in the form of added folic acid.
Overall, the very different studies of Cuskelly et al. (1996) and Pfeiffer et al. (1997a) complement each other and strongly indicate that folate added to cereal-grain foods is highly available and efficacious. These two studies contradict previous reports of low (30 to 60 percent) bioavailability of folate in experimentally fortified cereal-grain foods in South Africa (summarized by Colman [1982]). In the South African studies of folate-deficient pregnant women, the response criterion used to estimate bioavailability was either 2-hour changes in serum folate or changes in erythrocyte folate over time. The quantity of folate consumed in the fortified foods was not directly measured in these studies. If the amount was overestimated, that would explain the lower reported bioavailability (33 to 60 percent) compared with the recent estimates (85 to 100 percent) by Pfeiffer et al. (1997a) and Cuskelly et al. (1996). The experimental fortification of these South African foods in the 1970s may have little relevance to the current fortification process in the United States and Canada.
The value used in this report—85 percent bioavailability of folic acid consumed with a meal—is probably an underestimate, the effect of which may be an underestimation of the folate requirement.
Bioavailability of Food Folate
Perhaps the best data on which to base an estimate of the bioavailability of food folate are provided by Sauberlich and coworkers (1987). On the basis of changes in blood folate values, the authors concluded that the bioavailability of food folate was no more than 50 percent that of folic acid. Although this study was not designed as a quantitative study of food folate bioavailability, the results provide strong evidence in that regard. Similarly, the data of Cuskelly and colleagues (1996) suggest that food folate is less bioavailable than the synthetic form, as evidenced by a smaller increase in erythrocyte folate in the group that received an increased level of folate from food rather than from the synthetic form. The percentage bioavailability of folate could not be determined from this study because food consumption was not controlled.
A stable isotope investigation of the relative bioavailability of monoglutamyl and polyglutamyl folates consumed in water (control) or added to lima beans or tomatoes found that the relative bioavailability of deuterated polyglutamyl folates was equivalent to that of the monoglutamyl tracer (Wei et al., 1996). However, the bioavailability of polyglutamyl folate added to orange juice was approximately 33 percent lower (p < 0.05) than that of the mono-
glutamyl folate tracer. The authors concluded that naturally occurring polyglutamyl folates in orange juice are approximately 67 percent available—slightly more available than the food folate bioavailability estimate of Sauberlich. Related issues have been discussed in several reviews on this subject (Gregory, 1989, 1995, 1997).
Bioavailability Estimates and Assumptions
Many controlled studies on folate requirements have used a defined diet (food folate) supplemented with folic acid. Because folic acid taken with food is 85 percent bioavailable but food folate is only about 50 percent bioavailable, folic acid taken with food is 85/ 50 (i.e., 1.7) times more available. Thus, if a mixture of folic acid plus food folate has been fed, dietary folate equivalents (DFEs) are calculated as follows to determine the Estimated Average Requirement (EAR):
µg of DFEs provided = µg of food folate + (1.7 × µg of folic acid)
Expressed differently, to be comparable with food folate, only half as much folic acid is needed if taken on an empty stomach, or
1 µg of DFEs = 1 µg of food folate = 0.5 µg of folic acid taken on an empty stomach = 0.6 µg of folic acid with meals.
When food folate was the sole source of folate in studies used to determine requirements, no corrections were applied to convert to DFEs. Adjustments made for DFEs are indicated, if applicable, where folic acid was a source of folate. Adjustments cannot be made for epidemiological studies if data are lacking on the folate sources. If future research indicates that food folate is more than 50 percent bioavailable, this could lower the estimated requirements that appear later in the chapter.
Nutrient-Nutrient Interactions
No reports were found that demonstrate that the intake of other nutrients increases or decreases the requirement for folate. However, coexisting iron or vitamin B12 deficiency may interfere with the diagnosis of folate deficiency. In contrast to folate deficiency, iron deficiency leads to a decrease in mean cell volume. In the combined deficiency, interpretation of hematological changes may be unclear (Herbert, 1962a). A vitamin B12 deficiency results in the
same hematological changes that occur with folate deficiency because the vitamin B12 deficiency results in a secondary folate deficiency (Selhub and Rosenberg, 1996).
Interactions with Other Food Components
Fiber
Experimental data do not support the hypothesis that dietary fiber per se reduces folate bioavailability (Bailey, 1988; Gregory, 1989). Human studies (Russell et al., 1976) confirmed the negative findings of both rat and chick bioassays regarding the identification of an inhibitory action of various dietary fiber sources. Certain forms of fiber (e.g., wheat bran) may decrease the bioavailability of certain forms of folate under some conditions (Bailey et al., 1988; Keagy et al., 1988), but many forms of fiber appear to have no adverse effects (Gregory, 1997).
Experimental evidence in rats indicates that synthesis of folate by intestinal bacteria influences folate status (Keagy and Oace, 1989; Krause et al., 1996). Rong and colleagues (1991) reported that bacterially synthesized folate in the rat large intestine is incorporated into host tissue polyglutamates. The applicability of these data to humans is unknown. Suggestive evidence of a positive association between dietary fiber intake and folate status in humans was reported by Houghton and coworkers (1997). Zimmerman (1990) provided evidence that the monoglutamate form can be transported into the mucosa of the human colon by facilitated diffusion, allowing for the possibility of subsequent absorption of folate synthesized in the large intestine.
Alcohol
Data from surveys of chronic alcoholics suggest that inadequate intake is a major cause of the folate deficiency that has often been observed in chronic alcohol users (Eichner and Hillman, 1971; Herbert et al., 1963). Ethanol intake may aggravate folate deficiency by impairing intestinal folate absorption and hepatobiliary metabolism (Halsted et al., 1967, 1971, 1973) and by increasing renal folate excretion (McMartin et al., 1986; Russell et al., 1983).
Cigarette Smoking
Although blood folate concentrations have been reported to be
lower in smokers than in nonsmokers (Nakazawa et al., 1983; Ortega et al., 1994; Piyathilake et al., 1994; Senti and Pilch, 1985; Subar et al., 1990; Witter et al., 1982), data suggest that low intake (Subar et al., 1990) rather than an increased requirement may account for the poorer folate status of smokers.
Folate-Drug Interactions
The effects of drug use on folate status reviewed in this section are limited to effects seen in drugs used in chronic drug therapy of nonneoplastic diseases that affect a large percentage of the population and to oral contraceptive drugs. No information is available on the effects of these drugs on homocysteine values.
Nonsteroidal Anti-inflammatory Drugs
When taken in very large therapeutic doses (e.g., 3,900 mg/day), nonsteroidal anti-inflammatory drugs, including aspirin, ibuprofen, and acetaminophen, may exert antifolate activity (Baggott et al., 1992; Eichner et al., 1979; Lawrence et al., 1984; Willard et al., 1992). However, routine use of low doses of these drugs has not been reported to impair folate status.
Anticonvulsants
Numerous studies have cited evidence of impaired folate status associated with chronic use of the anticonvulsants diphenylhydantoin (phenytoin and Dilantin®) and phenobarbital (Collins et al., 1988; Klipstein, 1964; Malpas et al., 1966; Reynolds et al., 1966). Diphenylhydantoin is known to inhibit the intestinal absorption of folate (Elsborg, 1974; Young and Ghadirian, 1989). Few studies, however, have controlled for potential differences in dietary folate intake between groups of anticonvulsant users and nonusers (Collins et al., 1988). Thus, definitive conclusions cannot be drawn relative to adverse effects of these drugs on folate status.
Methotrexate
Methotrexate is a folate antagonist that has been used frequently and successfully in the treatment of nonneoplastic diseases such as rheumatoid arthritis, psoriasis, asthma, primary biliary cirrhosis, and inflammatory bowel disease (Morgan and Baggott, 1995). Methotrexate has been especially effective in the treatment of rheumatoid
arthritis (Felson et al., 1990), with efficacy established in numerous trials (Morgan et al., 1994). Patients with rheumatoid arthritis are frequently reported to be folate deficient, and folate stores are decreased in patients with rheumatoid arthritis who take methotrexate (Morgan et al., 1987, 1994; Omer and Mowat, 1968). Some of the side effects of methotrexate administration, such as gastrointestinal intolerance, mimic severe folate deficiency (Jackson, 1984). When patients are also given high-folate diets or supplemental folate, there is a significant reduction in toxic side effects with no reduction in drug efficacy. It has been recommended that patients undergoing chronic methotrexate therapy for rheumatoid arthritis increase folate consumption (Morgan et al., 1994) or consider folate supplements (1 mg/day) (Morgan et al., 1997).
Other Drugs with Antifolate Activity
The following diseases have been treated with drugs having antifolate activity: malaria with pyrimethamine, bacterial infections with trimethoprim, hypertension with triamterene, Pneumocystis carinii infections with trimetrexate (Morgan and Baggott, 1995), and chronic ulcerative colitis with sulfasalazine (Mason, 1995).
Oral Contraceptives
A number of early studies of oral contraceptive agents containing high levels of estrogens suggested an adverse effect on folate status (Grace et al., 1982; Shojania et al., 1968, 1971; Smith et al., 1975). However, oral contraceptive use has not been reported to influence folate status in large-scale population surveys (LSRO/FASEB, 1984) or in metabolic studies in which dietary intake was controlled (Rhode et al., 1983).
Genetic Variations
Folic acid and its derivatives are involved in numerous biochemical reactions that are catalyzed by many different enzymes. As expected, folate metabolism is under genetic control, and genetic heterogeneity exists. To estimate the relative contribution of genetic and environmental factors in determining folate status, erythrocyte folate was measured in monozygotic and dizygotic twins (Mitchell et al., 1997); however, dietary intake was not assessed. The data were best described by a model in which 46 percent of the variance is attributable to additive genetic effects, 16 percent to age and sex,
and 38 percent to random environmental effects including errors in measurement. A similar study was done for plasma homocysteine, and the estimated heritability was between 72 percent and 84 percent (Reed et al., 1991). In studies of twins, however, the influence of genetic factors may be overestimated, especially if environmental similarities are greater in monozygotic than in dizygotic twins.
A significant genetic heterogeneity in folate metabolism is related to the activity of 5,10-methylenetetrahydrofolate reductase (MTHFR). Severe MTHFR deficiency is rare; a reduced activity associated with a thermolabile form of the enzyme is much more common. A C667T polymorphism in the gene coding MTHFR has been linked with thermolability and reduced enzymatic activity (Frosst et al., 1995). Estimates of the frequency of homozygosity for the MTHFR T677 allele in white populations vary from 2 to 16 percent (van der Put et al., 1995). Individuals homozygous for the MTHFR T677 allele have significantly elevated plasma homocysteine (Frosst et al., 1995) and a tendency to have low plasma and erythrocyte folate concentrations (Ma et al., 1996; Molloy et al., 1997; Schmitz et al., 1996). In one study (Jacques et al., 1996) elevated fasting homocysteine was observed in individuals homozygous for the MTHFR T677 allele who had plasma folate values below 15.4 nmol/L (7.07 ng/mL) but not in those with plasma folate values above this level. Because 5-methyl-tetrahydrofolate is a required substrate in the remethylation of homocysteine to methionine, reduced enzyme activity of the T677 polymorphism increases dependence on an adequate folate supply. More detailed coverage of this genetic variation is provided in Appendix L.
FINDINGS BY LIFE STAGE AND GENDER GROUP
Infants Ages 0 through 12 Months
An Adequate Intake (AI) is used as the goal for folate intake by infants.
Method Used to Set the Adequate Intake
The AI reflects the observed mean folate intake of infants consuming exclusively human milk. Hematological and growth rate changes that have been measured in controlled studies of infants are not considered to be specifically attributable to the adequacy of dietary folate intake.
Serum and erythrocyte folate values of newborn infants are signif-
icantly higher than maternal blood concentrations, possibly reflecting an active transport process in utero (Ek, 1980; Landon and Oxley, 1971). These high blood folate values decline during the first 6 months in concert with the decline in the rate of cell division (Landon and Oxley, 1971).
The AI is the quantity of dietary folate that maintains blood folate concentrations comparable with those of the infant exclusively fed human milk. When human milk is consumed exclusively, the infant’s serum or plasma folate concentration has been reported to range from 35 to over 60 nmol/L (16 to 30 ng/mL) whereas erythrocyte values averaged from 650 to over 930 nmol/L (300 to 430 ng/mL) (Ek and Magnus, 1979; Smith et al., 1985; Tamura et al., 1980). These values reported in infants are much higher than adult values (Smith et al., 1985), which makes the use of adult norms inappropriate for infants. Additionally there are no reports of full-term infants who are exclusively and freely fed human milk manifesting any signs of folate deficiency.
The folate concentration of human milk remains relatively constant regardless of maternal dietary folate intake unless there is a severe maternal deficiency (Metz, 1970). The reported concentration of folate in human milk varies with the methods used, and these have changed substantially over the past decade. However, recent data from the laboratories of Picciano and colleagues (Lim et al., 1997) are consistent with the data of Brown and colleagues (1986) and O’Connor and colleagues (1991), all of whom reported average human milk folate concentrations to be 85 µg/L. The human milk folate concentration used to estimate AIs for infants thus is 85 µg/L.
Ages 0 through 6 Months. The AI for infants 0 through 6 months of age, derived by using the average volume of milk of 0.78 L/day (see Chapter 2) for this age group and the average folate concentration in human milk after 1 month of lactation (85 µg/L), is 66 µg/day, which is rounded to 65 µg. This equals approximately 9.4 µg/kg of reference body weight. Because this is food folate, the amount is the same in dietary folate equivalents (DFEs).
Ages 7 through 12 Months. If the reference body weight ratio method described in Chapter 2 to extrapolate from the AI for folate for infants ages 0 through 6 months is used, the AI for folate for the older infants would be 80 µg/day after rounding. The second method (see Chapter 2), extrapolating from the Estimated Average Requirement (EAR) for adults and adjusting for the expected vari-
ance to estimate a recommended intake, gives a comparable AI of approximately 80 µg/day.
The five studies summarized in Table 8-1 illustrate the data from controlled studies that measured folate intake and assessed the infants’ status. They include studies in which infants were fed either human milk or formula. Asfour and colleagues (1977) concluded that although the observed serum and erythrocyte concentrations in three groups of infants fed formula were borderline, the folate values were sufficient to maintain growth, hematopoiesis, and clinical well-being. However, the criteria of growth, hematopoiesis, and clinical well-being are too nonspecific for evaluating folate status. Therefore, these data suggest that none of the folate levels (3.6, 4.3, or 5.0 µg/kg) maintained folate adequacy in all the infants tested based on serum or erythrocyte folate concentrations. Ek and Magnus (1982) provided data that infant formula containing folate at 78 µg/L supported blood folate concentrations comparable with those of infants fed human milk. Smith and coworkers (1983) reported that serum folate values of infants fed human milk were approximately 45 nmol/L (20 ng/mL) at age 6 weeks and 65 nmol/ L (30 ng/mL) at age 12 weeks, whereas erythrocyte folate concentrations were approximately 1,000 nmol/L (460 ng/mL) at age 6 weeks and 940 nmol/L (430 ng/mL) at age 12 weeks. Smith and coworkers (1985) reported that throughout the first 6 months, serum folate concentrations were significantly higher in infants fed formula than in those fed human milk; erythrocyte folate concentrations of approximately 2,200 nmol/L (1,000 ng/mL) at age 4 months clearly show that 158 µg/L of formula is in excess of what is needed. Salmenpera and colleagues (1986) reported that infants fed exclusively human milk all maintained adequate plasma folate concentrations with values twofold to more than threefold higher than maternal concentrations throughout the study.
Folate AI Summary, Ages 0 through 12 Months
Data from the research studies included in Table 8-1 supports the AI of 65 µg/day of folate for young infants and of 80 µg/day for older infants.
|
AI for Infants |
||
|
0–6 months |
65 µg/day of dietary folate equivalents |
≈9.4 µg/kg |
|
7–12 months |
80 µg/day of dietary folate equivalents |
≈8.8 µg/kg |
The extent to which the AIs for folate could be lowered and still meet the physiological needs for infants fed human milk is unknown.
Special Considerations
No data were found to support the need to adjust dietary intake of folate on the basis of the type of infant formula compared with human milk to achieve the same folate status other than that inherent in DFE equivalency.
Children Ages 1 through 8 Years
Method Used to Estimate the Average Requirement
No data were found on which to base an EAR for children. In the absence of additional information, EARs and RDAs for these ages have been estimated by using the method described in Chapter 2, which extrapolates from adult values. The resulting EARs are 120 and 160 µg/day of DFEs for children ages 1 through 3 and 4 through 8 years, respectively.
Folate EAR and RDA Summary, Ages 1 through 8 Years
|
EAR for Children |
|
|
1–3 years |
120 µg/day of dietary folate equivalents |
|
4–8 years |
160 µg/day of dietary folate equivalents |
The RDA for folate is set by assuming a coefficient of variation (CV) of 10 percent (see Chapter 1) because information is not available on the standard deviation of the requirement for folate; the RDA is defined as equal to the EAR plus twice the CV to cover the needs of 97 to 98 percent of the individuals in the group (therefore, for folate the RDA is 120 percent of the EAR).
|
RDA for Children |
|
|
1–3 years |
150 µg/day of dietary folate equivalents |
|
4–8 years |
200 µg/day of dietary folate equivalents |
TABLE 8-1 Folate Intake and Status of Infants by Study
|
Reference |
Age of Infants |
Number of Infants and Feeding Type |
Folate Intake |
Dietary Folate Equivalents |
|
Asfour et al., 1977 |
2–11 mo |
4 formula fed |
3.6 µg/kg of body weighta |
6.1 DFEs/kg |
|
|
4 formula fed |
4.3 µg/kga |
7.3 DFEs/kg |
|
|
5 formula fed |
5.0 µg/kga |
8.5 DFEs/kg |
||
|
Ek and Magnus, 1982 |
0–12 mo |
33 formula fed |
39 µg/Lc |
66 DFEs/L |
|
|
31 formula fed |
78 µg/Lc |
133 DFEs/L |
|
|
Smith et al., 1983 |
6 wk |
14 breastfed |
45 µg/L |
45 DFEs/L |
|
12 wk |
14 breastfed |
50 µg/Ld |
50 DFEs/L |
|
|
Smith et al., 1985 |
1st 6 mo |
14 breastfed |
85 µg/L |
85 DFEs/L |
|
|
3 and 6 wk |
31 formula fed |
162 µg/L |
275 DFEs/L |
|
3 and 6 wk |
22 formula fed |
158 µg/L (plus iron) |
269 DFEs/L |
|
|
12 mo |
14 breastfed |
85 µg/L |
85 DFEs/L |
|
|
12 mo |
31 formula fed |
162 µg/L |
275 DFEs/L |
|
|
12 mo |
22 formula fed |
158 µg/L (plus iron) |
269 DFEs/L |
|
|
Salmenpera et al., 1986 |
0–12 mo |
200f exclusively breastfed |
NAg |
– |
|
a Mean values. b Mean values at age 4 mo. c Volume consumed not reported. d Analyzed using older methods that may have underestimated the folate content. e Values were estimated from figures. |
||||
|
Serum Folate nmol/L (ng/mL) |
Erythrocyte Folate nmol/L (ng/mL) |
Comments |
|
8.5 ± 3.5 (3.9 ± 1.6)b |
353 ± 148 (162 ± 68)b |
2 of 4 in deficient range. |
|
11.1 ± 3.7 (5.1 ± 1.7)b |
538 ± 170 (247 ± 78)b |
1 of 4 had marginal erythrocyte folate. |
|
10.7 ± 4.8 (4.9 ± 2.2)b |
568 ± 244 (261 ± 112)b |
2 of 5 had marginal erythrocyte and serum folate. |
|
< 7 (3) (at 2 and 3 mo) |
< 220 (100) (at 2 and 3 mo) |
Values at other ages were higher. |
|
> 41 (19) (at 2 and 3 mo) |
> 435 (200) (at 2 and 3 mo) |
|
|
45 (20)e |
1,000 (460)e |
Within normal range. |
|
65 (30)e |
940 (430)e |
Within normal range. |
|
54–65 (25–30)e |
1,090 down to 915 (500 down to 420)e |
Within normal range. |
|
> 130 (60)e |
2,200 (1,000)e |
Above usual normal range. |
|
> 130 (60)e |
2,200 (1,000)e |
Above usual normal range. |
|
> 35 (15)e |
870 (400)e |
Within normal range. |
|
> 22 (10)e |
760 (350)e |
Within normal range. |
|
> 22 (10)e |
760 (350)e |
Within normal range. |
|
≥ 11 (5)h |
NA |
All infants had adequate plasma folate concentrations after 2 mo of age (> 7 nmol/ L [3] µg/L]). |
|
f The number of infants in the study decreased from an initial 200 to 7 infants at the end. g NA = not available. h Lowest individual concentration reported for the study period. |
||
Children and Adolescents Ages 9 through 18 Years
Method Used to Estimate the Average Requirement
As for younger children, EARs and RDAs for these ages have been extrapolated from adult values by using the method described in Chapter 2. Although body size varies because of gender in these age groups, no conclusive data indicating a difference in requirements for adults were determined, thus no difference based on gender is proposed for these age groups.
Folate EAR and RDA Summary, Ages 9 through 18 Years
|
EAR for Boys |
|
|
9–13 years |
250 µg/day of dietary folate equivalents |
|
14–18 years |
330 µg/day of dietary folate equivalents |
|
EAR for Girls |
|
|
9–13 years |
250 µg/day of dietary folate equivalents |
|
14–18 years |
330 µg/day of dietary folate equivalents |
The RDA for folate is set by assuming a coefficient of variation (CV) of 10 percent (see Chapter 1) because information is not available on the standard deviation of the requirement for folate; the RDA is defined as equal to the EAR plus twice the CV to cover the needs of 97 to 98 percent of the individuals in the group (therefore, for folate the RDA is 120 percent of the EAR).
|
RDA for Boys |
|
|
9–13 years |
300 µg/day of dietary folate equivalents |
|
14–18 years |
400 µg/day of dietary folate equivalents |
|
RDA for Girls |
|
|
9–13 years |
300 µg/day of dietary folate equivalents |
|
14–18 years |
400 µg/day of dietary folate equivalents |
Adults Ages 19 through 50 Years
Evidence Considered in Estimating the Average Requirement
No single indicator was judged a sufficient basis for deriving an EAR for adults. That is, it was not deemed appropriate to base the EAR on an examination limited to studies that provided data only
on erythrocyte folate, plasma homocysteine, or any other single laboratory value. The main approach to determining the EAR for adults uses a combination of erythrocyte folate, plasma homocysteine, and plasma or serum folate. The focus used was on the adequacy of specific quantities of folate consumed under controlled metabolic conditions to maintain normal blood concentrations of these indicators. Cutoff points for the normal range were based on the occurrence of documented biochemical abnormalities.
The types of studies considered were primarily those in which maintenance or restoration of folate status was evaluated in controlled metabolic conditions. In these studies folate was provided either as food or as food plus folic acid. Intakes related to these status indicators were computed by calculating DFEs, which gives higher intakes when folic acid is used as part of the protocol than what the authors describe when reporting their work (see “Bioavailability”).
In addition to data on maintenance or restoration of folate status, several other types of experimental data were critiqued and compared. These included kinetic estimates of body pool size and daily turnover (Gailani et al., 1970; Herbert, 1962b, 1968; Krumdieck et al., 1978; Russell et al., 1983; Stites et al., 1997; Von der Porten et al., 1992), quantitation of urinary folate catabolites as an index of folate turnover (McPartlin et al., 1993), and repletion of severe clinical folate deficiency (Hansen and Weinfeld 1962; Herbert, 1962a, 1968; Marshall and Jandl, 1960; Zalusky and Herbert, 1961). Analyses of relationships of dietary folate intake and biochemical indices of folate status from the Third National Health and Nutrition Examination Survey are in progress and were thus unavailable for use in this report.
Metabolic Studies
Two principal studies of healthy human subjects were critiqued and compared; the amounts of folate ranged from 100 to 489 µg/ day of DFEs (O’Keefe et al., 1995; Sauberlich et al., 1987). Two additional studies (Jacob et al., 1994; Milne et al., 1983) were also considered but were given less weight because of the study design. These four studies are summarized in Table 8-2.
100 to 150 µg/day of DFEs. Sauberlich and colleagues (1987) conducted a controlled depletion-repletion metabolic study (28 days of depletion followed by 64 days of graded repletion phases, each phase lasting 21 days) with nonpregnant women. Plasma and eryth-
TABLE 8-2 Key Controlled Metabolic Studies Providing Evidence Used to Derive the Estimated Average Requirement (EAR)a
|
Reference |
Type of Controlled Metabolic Study |
Number and Age of Subjects |
Baseline Folate Intake (µg) |
Duration of Study |
|
Milne et al., 1983 |
Maintenance |
40 men, 19–54 y |
NAc |
2–8 mo |
|
Sauberlich et al., 1987 |
Depletion-repletion |
3 women, 21–40 y |
400d |
28 d depletion 21 d repletion |
|
|
2 women |
400d |
28 d depletion 21 d repletion |
|
|
Jacob et al., 1994 |
Depletion-repletion |
10 men, 33–46 y |
440e |
30 d depletion 15 d repletion |
|
O’Keefe et al., 1995 |
Maintenance |
5 women, 21–27 y |
NA |
70 d |
|
|
6 women, 21–27 y |
NA |
70 d |
|
|
a The EAR is the intake that meets the estimated nutrient needs of 50% of the individuals in a group. b To compute dietary folate equivalents, use the formula µg food folate + (1.7 × µg folic acid). |
||||
rocyte folate concentrations continued to fall in response to repletion with 100 µg of food folate (equal to 100 µg DFEs) for 21 days. This continued depletion led to the conclusion that 100 µg of dietary folate is below the average requirement.
Jacob and coworkers (1994) conducted a controlled depletion-repletion metabolic study (30 days depletion at 25 µg/day of folate
|
Folate Intake During Repletion or Maintenance |
|
|||
|
Food Folate (µg) |
Folic Acid (µg) |
Dietary Folate Equivalentsb (µg) |
Results |
|
|
200 |
0 |
200 |
Serum and erythrocyte folate decreased significantly over time, but not below normal cutoff values. |
|
|
0 |
0 |
0 |
Plasma and erythrocyte folate decreased throughout. |
|
|
100 |
0 |
100 |
||
|
0 |
0 |
0 |
Plasma folate stabilized. Erythrocyte folate decreased throughout. |
|
|
200 |
0 |
200 |
||
|
25 |
0 |
25 |
Plasma homocysteine did not normalize. Plasma folate (and erythrocyte folate) did not return to predepletion values. |
|
|
25 |
74 |
151 |
||
|
30 |
170 |
319 |
Homocysteine rose above 16 µmol/L in 2 of 5; erythrocyte and serum folate values were low in 3 of 5 (<362 nmol/L [166 ng/mL] and <7 nmol/L [3 ng/ mL], respectively). |
|
|
30 |
270 |
489 |
Erythrocyte folate and plasma homocysteine were maintained in all. |
|
|
c NA = not applicable. d Analyzed value. e Calculated value for 9-d baseline diet. |
||||
[25 µg DFEs] followed by 15 days repletion at 151 µg/day of DFEs) with adult males. Although 150 µg of DFEs was insufficient to decrease the elevated plasma homocysteine concentration below 16 µmol in 4 of the 10 subjects or to return plasma folate to predepletion concentrations, the repletion period was too short to allow appropriate evaluation of the primary response variables. Thus, no
conclusion about the adequacy of 150 µg/day of DFEs can be reached from this study.
Approximately 200 µg/day of DFEs. Sauberlich and colleagues (1987) evaluated the repletion response of two subjects and reported that erythrocyte folate continued to fall in response to 200 µg of food folate (200 µg DFEs) for 21 days. Data are not sufficient for estimating the erythrocyte folate response to a longer repletion phase.
Milne and coworkers (1983) used serum and erythrocyte folate to evaluate maintenance of folate status in 40 men consuming 200 µg/ day of food folate (200 µg DFEs) for periods of 2 to 8 months. Both serum and erythrocyte folate decreased significantly over time regardless of initial status but not below the cutoff values of 7 nmol/L (3 ng/mL) and 305 nmol/L (140 ng/ml), respectively. This study was designed primarily for a different purpose, however, and had several limitations for the estimation of average requirements: the diet was changed during the study, subjects were included for different periods of time, and some of the subjects resumed their normal diet (for 10 days to 2 months) during the study. Thus, the findings from this study were judged equivocal.
Approximately 320 µg/day of DFEs. O’Keefe and colleagues (1995) conducted a controlled metabolic study in which five women were fed a diet that provided 319 µg/day of DFEs (30 µg from food sources and 170 µg from folic acid). Three of the five had erythrocyte folate concentrations less than 305 nmol/L (140 ng/mL) and serum folate concentrations less than 7 nmol/L (3 ng/mL). Two of the subjects had elevated homocysteine concentrations (greater than 16 µmol/L) and a third subject had a homocysteine concentration greater than 14 µmol/L. (These data were obtained directly from the investigators of the published study.) These findings suggest that approximately half would have had normal erythrocyte folate and plasma homocysteine concentrations if 320 µg/day of DFEs had been consumed.
Approximately 500 µg/day of DFEs. O’Keefe and coworkers (1995) fed subjects 270 µg as folic acid with 30 µg of food folate, corresponding to 489 µg of DFEs. This level of intake maintained normal plasma homocysteine, erythrocyte folate, and serum folate values with no significant increase or decrease throughout the 70-day maintenance study. Therefore, 489 µg/day of DFEs could be considered to be above the average requirement.
Summary. Of the controlled metabolic studies reviewed above, greatest weight was given to the study by O’Keefe for five reasons: (1) it was designed as a maintenance study for the purpose of estimating the folate requirement; (2) although it included only five subjects, this sample size exceeds that in the Sauberlich study, which was also rigorously controlled; (3) it evaluated the metabolic response of homocysteine in addition to erythrocyte and serum folate; (4) the diet was fed for 70 days in contrast to very short repletion phases in other metabolic studies (i.e., 15 days [Jacob et al., 1994], and 21 days [Sauberlich et al., 1987]); and (5) it provided folate largely in the form of folic acid, thus minimizing the possibility that folate intake was underestimated. Moreover, considering the evidence that problems with methods have led to underestimates of the folate content of food, it is likely that the subjects in the Sauberlich et al. (1987) and Milne et al. (1983) studies received more folate than reported.
Other Evidence Considered
Epidemiological data support an Estimated Average Requirement (EAR) of approximately 320 µg/day of DFEs. A primary example is the study by Selhub and colleagues (1993). In this study the prevalence of a homocysteine value greater than 14 µmol/L was significantly greater among individuals in the lowest four deciles of folate intake (less than 280 µg/day) as determined from a food frequency questionnaire. Reported intakes in this study were obtained prior to folate fortification and do not include supplements, but they include synthetic folic acid from ready-to-eat or cooked cereals (which frequently contained added folate) and thus would be higher if expressed in DFEs.
The amount of folate utilized daily has been estimated by measuring the catabolic products excreted in the urine and then expressing the sum as folate equivalents by multiplying the value by two (because the molecular weight of folate is approximately two times that of catabolites) (McPartlin et al., 1993). This approach may underestimate folate requirements because folate coenzymes may be recycled and not catabolized when utilized and because measurement of urinary catabolites does not account for endogenous folate lost from the body as a mixture of catabolites and intact folates in the feces (Caudill et al., 1998).
Results of other studies were considered (Table 8-3). Several (Gailani et al., 1970; Herbert, 1962a, b; Zalusky and Herbert, 1961) were found less useful than the previously cited metabolic studies
TABLE 8-3 Additional Studies of the Folate Status of Adults
|
Reference |
Type of Study |
Type of Dietary Assessment |
Age of Subjects (y) |
Number of Subjects |
|
Zalusky and Herbert, 1961 |
Depletion-repletion |
Folate-free synthetic diet |
60 |
1 male |
|
Herbert, 1962a |
Depletion |
Folate-free diet |
35 |
1 male |
|
Herbert, 1962b |
Depletion-repletion |
Defined folate-deficient diet |
NAc |
1 female |
|
|
1 female |
|||
|
1 female |
||||
|
Krumdieck et al., 1978 |
Kinetic |
Not reported |
36 |
1 female |
|
Von der Porten et al., 1992 |
Kinetic |
Self-selected diets |
22–31 |
6 males |
|
Stites et al., 1997 |
Kinetic |
Self-selected, folate-adequate diets |
20–30 |
4 males |
|
a IM = intramuscular. b DFEs = dietary folate equivalents. To compute DFEs, use the formula µg folic acid × 2 for IM injections or µg food folate + (1.7 × µg folic acid) for a combination of food folate and folic acid. c Not available. |
||||
for estimating the folate requirement because the diets were deficient in more than one nutrient. Ancillary information is provided by the studies using stable isotope methods to estimate in vivo folate pool size and the rate of daily utilization. With use of the estimate of the total body pool folate of 20 mg as extrapolated from liver folate measurements (Hoppner and Lampi, 1980; Whitehead, 1973), and
|
Dietary Folate Intake (µg/d) |
Other Folate Source |
Comments |
|
None |
Subject was folate deficient and scorbutic at the beginning of the study; folate injection produced a reticulocyte response. |
|
|
5 |
None |
Signs and symptoms of deficiency coincided with a fall in the serum folate level to < 7 nmol/L (3 ng/mL) and a decrease in erythrocyte folate concentration to < 305 nmol/L (140 ng/mL). Diet was also deficient in potassium. |
|
5 |
25 µg of folic acid p.o.d (48 µg of DFEs) |
Serum folate activity fell below normal levels in the subject supplemented with 25 µg/d. Test period was only 42 d. Subjects were on a low-calorie diet. |
|
5 |
50 µg of folic acid p.o. (90 µg of DFEs) |
|
|
5 |
100 µg of folic acid p.o. (170 µg of DFEs) |
|
|
None |
320 µg of labeled folic acid |
Turnover rate estimated to be ≈1% of total body folate pool per day. Subject was Hodgkin’s disease patient in remission. |
|
200e |
1.6 mg/d of labeled folic acid |
Turnover rate was 4.5% of the total body folate pool per day. |
|
443f |
100 µg of labeled folic acid + 100 µg of unlabeled folic acid |
Turnover rate was estimated to be ≈1%. |
|
d p.o. = by mouth. e Typical intake assessed by diet records. f Average value. |
||
the assumption of a 1 percent daily turnover rate of folate (Krumdieck et al., 1978; Stites et al., 1997; Von der Porten et al., 1992), the daily quantity of folate utilized is calculated to be approximately 200 µg. When 200 µg/day is corrected for the 50 percent bioavailability of food folate, the DFE is 400 µg/day.
Folate EAR and RDA Summary, Ages 19 through 50 Years
With greatest weight given to the metabolic maintenance study by O’Keefe along with data considered from the other studies reviewed above, it was concluded that the data support an EAR of approximately 320 µg/day of DFEs for the age group 19 through 50 years. A special recommendation is made for women capable of becoming pregnant (see “Recommendations for Neural Tube Defects Risk Reduction”).
|
EAR for Men |
|
|
19–30 years |
320 µg/day of dietary folate equivalents |
|
31–50 years |
320 µg/day of dietary folate equivalents |
|
EAR for Women |
|
|
19–30 years |
320 µg/day of dietary folate equivalents |
|
31–50 years |
320 µg/day of dietary folate equivalents |
The RDA for folate is set by assuming a coefficient of variation (CV) of 10 percent (see Chapter 1) because information is not available on the standard deviation of the requirement for folate; the RDA is defined as equal to the EAR plus twice the CV to cover the needs of 97 to 98 percent of the individuals in the group (therefore, for folate the RDA is 120 percent of the EAR).
|
RDA for Men |
|
|
19–30 years |
400 µg/day of dietary folate equivalents |
|
31–50 years |
400 µg/day of dietary folate equivalents |
|
RDA for Women |
|
|
19–30 years |
400 µg/day of dietary folate equivalents |
|
31–50 years |
400 µg/day of dietary folate equivalents |
Adults Ages 51 Years and Older
The aging process has not been associated with a reduction in the ability to utilize folate (Bailey et al., 1984). Folate status as measured by serum folate or erythrocyte folate has not been shown to decline as a function of age (Rosenberg, 1992; Selhub et al., 1993). In contrast, numerous reports indicate that homocysteine concentration increases as a function of age (Selhub et al., 1993). It has been postulated (Selhub et al., 1993) that this increase may result
from an age-related decline in cystathionine β-synthase and possibly other enzymes involved in homocysteine metabolism (Gartler et al., 1981).
Evidence Considered in Estimating the Average Requirement
The EAR for men and women ages 51 years and older is based on evaluation of three types of studies: metabolic (Jacob et al., 1998), observational folate status assessment of population subgroups (Bates et al., 1980; Garry et al., 1982, 1984; Jägerstad, 1977; Jägerstad and Westesson, 1979; Koehler et al., 1996; Ortega et al., 1993; Rosenberg, 1992; Sahyoun et al., 1988), and epidemiological (Selhub et al., 1993).
Jacob and colleagues (1998) conducted a depletion-repletion metabolic study in eight post-menopausal women aged 49 to 63 years. A folate depletion diet (56 µg/day [56 µg/day of DFEs]) was fed for 35 days, followed by three repletion periods in which graded amounts of folate were added to the diet. After being converted to DFEs, the three repletion amounts were 150, 450, and 850 µg/day for 28, 13, and 8 days, respectively. Plasma homocysteine concentrations remained elevated (greater than 12 µmol/L) in five of the eight women in response to either 150 or 450 µg/day of DFEs. Plasma folate remained low (less than 7 nmol/L [3 ng/mL]) in five of the eight subjects in response to 150 µg/day of DFEs but returned to normal in all subjects in response to 450 µg/day. The short repletion periods limit conclusions regarding the adequacy of these intake levels. From the plasma folate changes, which do respond quickly, it appears that 450 µg/day was adequate for all subjects and 150 µg/day was inadequate for a large percentage of the group. Extrapolating from these data, approximately 300 µg/day would result in normal folate status in approximately 50 percent of the group and would therefore be consistent with an EAR of 320 µg/day.
The observational folate status assessment studies that provide data on both folate intake and biochemical measures of folate status (Table 8-4) provide evidence that tends to support an EAR for older adults that is equivalent to that for younger adults: 320 µg/day of DFEs. Data from Selhub and colleagues (1993) (Figure 8-1) show that the mean homocysteine concentration begins to stabilize when folate intakes are approximately 300 µg/day. Figure 8-2 presents data showing the relationship of plasma homocysteine to plasma folate concentrations (Lewis et al., 1992).
TABLE 8-4 Observational Status Assessment Studies Considered in Setting the Estimated Average Requirement (EAR) for Folate in the Elderly
|
Reference |
Number and Age of Subjects |
Folate Intake Assessment |
|
Studies suggesting an EAR greater than 150–200 µg of dietary folate equivalentsa |
||
|
Jägerstad, 1977; Jägerstad and Westesson, 1979 |
37 Swedish men and women, 67 y |
Microbiological analysis |
|
Bates et al., 1980 |
21 elderly men and women |
Dietary record |
|
Ortega et al., 1993 |
72 men and women, 65–89 y |
5-d food records |
|
Studies suggesting an EAR of 250–300 µg of dietary folate equivalents |
||
|
Selhub et al., 1993; Tucker et al., 1996 |
1,000 men and women, 67–80 y |
Food frequency questionnaire |
|
Koehler et al., 1996 |
44 men and women, 68–96 y (nonsupplement users) |
Food frequency questionnaire |
|
Other studies |
||
|
Garry et al., 1982, 1984 |
304 Caucasian men and women, ≥ 60 y |
3-d diet records, prospective |
|
Sahyoun et al., 1988; Sahyoun, 1992; Rosenberg, 1992 |
686 free-living adults, ≥ 60 y |
3-d food records |
|
NOTE: In these studies, it is impossible to calculate dietary folate equivalents because intake of foods fortified with folic acid was not specified. Moreover, on the basis of data from Tamura et al. (1997) and Martin et al. (1990), it is believed that folate intakes are underestimated. |
||
|
Results |
|
Median intake of folate was 150 µg/d for males and 125 µg/d for females. Erythrocyte folate values ranged from approximately 175 to 350 nmol/L (80 to 160 ng/mL) Mean intake was 135 µg of folate/d; 40% had an erythrocyte folate value < 305 nmol/L (140 ng/mL). Intake averaged 214 µg/d of folate. Mean erythrocyte folate was 250 nmol/L (115 ng/mL); 85% of the values were < 327 nmol/L (150 ng/mL). Plasma hcyb plateaued in normal range (< 14 µmol/L) at folate intakes of 350–400 µg/d and serum folate of 15 nmol/L (7 ng/mL). See Figure 8-1. Mean erythrocyte folate was ≈1,035 nmol/L (475 ng/mL) and plasma hcy was 11.2 µmol/L for those not taking supplements (average intake ≈300 µg/d). Values for supplement users were not distinguished from those for nonusers. For nonusers, 75% had folate intakes < 250 µg/d. Overall, 3% had erythrocyte folate of 305 nmol/L (140 ng/mL). Median folate intakes of nonsupplement users were 254 µg for men and 216 µg for women. Median plasma folate was ≈19 nmol/L (9 ng/mL) for both. |
|
a Dietary folate equivalents: 1 µg food folate = 0.6 µg of folic acid from fortified food or as a supplement consumed with food = 0.5 µg of a supplement taken on an empty stomach. b hcy = total homocysteine. |
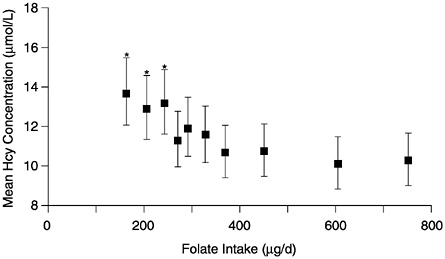
FIGURE 8-1 Mean plasma homocysteine (Hcy) concentrations (and 95% confidence intervals) by deciles of intake of folate. Means are adjusted for age, gender, and other vitamin intakes. Asterisk indicates significantly different from mean in the highest decile (p < 0.01). Reprinted with permission, from Selhub et al. (1993). Copyright 1993 by the American Medical Association.
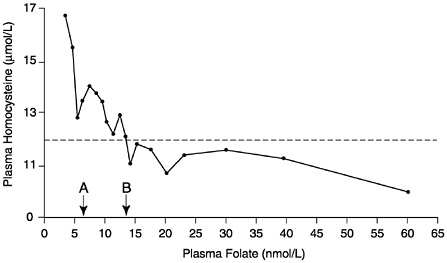
FIGURE 8-2 Relationship of plasma homocysteine concentrations to plasma folate concentrations in 209 adult males. A indicates lower limit of normal plasma folate as used by the Second National Health and Nutrition Examination Survey (6.8 nmol/L). B indicates lower limit of normal plasma folate as used by the World Health Organization (13.6 nmol/L). Homocysteine concentrations above the dotted line (12 µmol/L) are considered elevated. Reprinted with permission, from Lewis et al. (1992). Copyright 1992 by the New York Academy of Sciences.
Folate EAR and RDA Summary, Ages 51 Years and Older
Data from metabolic folate status assessment and epidemiological studies support an EAR for adults ages 51 years and older of 320 µg/day of DFEs. The EAR for this age group is expected to be the same as that for younger age groups because the aging process does not appear to impair folate absorption or utilization nor do studies separate those over age 70 from those 51 to 70 years.
|
EAR for Adults |
|
|
51–70 years |
320 µg/day of dietary folate equivalents |
|
> 70 years |
320 µg/day of dietary folate equivalents |
The RDA for folate is set by assuming a coefficient of variation (CV) of 10 percent (see Chapter 1) because information is not available on the standard deviation of the requirement for folate; the RDA is defined as equal to the EAR plus twice the CV to cover the needs of 97 to 98 percent of the individuals in the group (therefore, for folate the RDA is 120 percent of the EAR).
|
RDA for Adults |
|
|
51–70 years |
400 µg/day of dietary folate equivalents |
|
> 70 years |
400 µg/day of dietary folate equivalents |
Pregnancy
Folate requirements increase substantially during pregnancy because of the marked acceleration in single-carbon transfer reactions, including those required for nucleotide synthesis and thus cell division. During pregnancy, cells multiply in association with uterine enlargement, placental development, expansion of maternal erythrocyte number, and fetal growth (Cunningham et al., 1989). Additionally, folate is actively transferred to the fetus as indicated by elevated folate concentrations in cord blood relative to that of maternal blood. When folate intake is inadequate, maternal serum and erythrocyte folate concentrations decrease and megaloblastic marrow changes may occur (Picciano, 1996). If inadequate intake continues, megaloblastic anemia may develop. This section does not address the reduction of risk of neural tube defects because the neural tube is formed before most women know that they are pregnant (see “Neural Tube Defects”).
Evidence Considered in Estimating the Average Requirement
For pregnant women the maintenance of erythrocyte folate, which reflects tissue stores, was selected as the primary indicator of adequacy. When this indicator was not measured, serum folate was evaluated with the recognition that hemodilution contributes to a normal reduction in serum folate concentration during gestation. Homocysteine concentrations have not been shown to reflect folate status during pregnancy, possibly because of hormonal changes, hemodilution, or other unknown factors associated with pregnancy (Andersson et al., 1992; Bonnette et al., 1998).
Population-Based Studies. A number of population-based studies confirm that folic acid consumed in conjunction with diet prevents folate deficiency in pregnant women as assessed by maintenance of normal folate concentration in erythrocytes, serum, or both. The folate has been provided either by supplements (Chanarin et al., 1968; Dawson, 1966; Hansen and Rybo, 1967; Lowenstein et al., 1966; Qvist et al., 1986; Willoughby, 1967; Willoughby and Jewel, 1966) or fortified food (Colman et al., 1975) (see Table 8-5).
Willoughby and Jewel (1966, 1968) conducted a series of studies involving approximately 3,500 pregnant women beginning at 12 weeks of gestation who were assigned to different levels of folate supplementation (0, 100, 350, or 450 µg/day). Their dietary folate was estimated to be less than 100 µg/day. A supplementation level of 100 µg/day in conjunction with the low-folate diet was insufficient to prevent deficient (less than 7 nmol/L [3 ng/mL]) serum concentrations in 33 percent of the group (Willoughby and Jewel, 1966) or to prevent megaloblastic anemia in 5 percent of the group (Willoughby, 1967). In contrast, 300 µg/day of supplemental folate was sufficient to maintain a mean serum folate concentration that was comparable with the mean in healthy nonpregnant control subjects (Willoughby and Jewel, 1966) and to prevent megaloblastic anemia (Willoughby, 1967). These data agree with those of Dawson (1966), who found that taking 150 µg/day of folate supplements (beginning at 28 weeks) in addition to diet resulted in low serum folate concentrations (less than 7 nmol/L [3 ng/mL]) in 30 percent of the group at delivery. Also confirming these findings, Hansen and Rybo (1967) reported that 100 µg of folic acid plus diet was not sufficient to prevent serum folate reduction (defined as less than 4 nmol/L [2 ng/mL]) in 15 percent of the group whereas a folate supplement of 500 µg/day resulted in a mean serum folate concentration of 13 nmol/L (6 ng/mL) at 36 to 38 weeks of gestation.
Lowenstein and colleagues (1966) compared serum and erythrocyte folate and bone marrow morphology of women taking 500 µg/ day of supplemental folate with those of women taking a placebo. In the folate-supplemented women, mean serum and erythrocyte folate levels were approximately 21 and 870 nmol/L (10 and 400 ng/mL), respectively, at 36 and 38 weeks of gestation and postpartum. Bone marrow aspirates at 38 weeks were essentially normal. In contrast, a large percentage of the placebo-treated subjects had serum and erythrocyte folate concentrations that were less than normal.
Chanarin and colleagues (1968) compared erythrocyte folate concentrations in 103 pregnant women supplemented with 100 µg of folate from 25 weeks of gestation until delivery with those of 103 unsupplemented pregnant control subjects. Dietary intake was analyzed in 111, 24-hour duplicate diets and reported to be 676 µg/ day. Supplementation of the usual diet with 100 µg/day resulted in maintenance of erythrocyte folate concentration throughout pregnancy whereas a significant reduction in erythrocyte folate was observed in the unsupplemented subjects.
Colman et al. (1975) evaluated the efficacy of folate-fortified maize to maintain erythrocyte folate concentrations in 70 pregnant women. Erythrocyte folate response was compared between women receiving maize fortified to provide 300, 500, or 1,000 µg of folic acid and a control group. (Additional groups consumed folic acid in tablet form to assess the relative bioavailability of the fortified maize.) Maize containing 300 µg of folic acid in addition to dietary folate, the lowest level tested, was effective in preventing the progression of folate depletion in the eighth month of pregnancy.
Controlled Metabolic Study. Caudill and colleagues (1997) conducted a metabolic study in which either of two levels of folate was consumed for 12 weeks by pregnant women during the second trimester (14 weeks to 25 weeks of gestation). Their folate status was compared with that of nonpregnant control subjects. Folate was provided as a combination of dietary folate (120 µg/day) and folic acid (either 330 or 730 µg/day) consumed with the diet. After correcting for bioavailability, the intakes of the groups were approximately 60 µg/day of DFEs and more than 1,300 µg/day of DFEs, respectively. Folate status was normal (serum folate greater than 7 nmol/L [3 ng/mL] and erythrocyte folate values greater than 305 nmol/L [140 ng/mL]) in all subjects consuming the diet with 680 µg/day of DFEs and was not different from that of the nonpregnant control subjects with the same folate intake.
TABLE 8-5 Supplementation Studies in Pregnancy
|
Reference |
Number of Subjects |
Folate Diet |
Folate Supplement |
|
Dawson, 1966 |
20 |
Not reported |
150 |
|
Lowenstein et al., 1966 |
311 |
82–92 |
0 500 |
|
Willoughby and Jewell, 1966 |
350 |
< 50 |
0 100 300 450 |
|
Hansen and Rybo, 1967 |
95 |
Not reported |
50 100 200 500 |
|
Willoughby and Jewell, 1968 |
48 |
Not reported |
330 |
|
Chanarin et al., 1968 |
103 103 |
676 |
0 100 |
|
Colman et al., 1975 |
122 |
Not reported |
0 300 500 1,000 |
The data provided by the only diet-controlled metabolic study that has been conducted in pregnant women (Caudill et al., 1997) agree with the findings from the population studies and confirm that a combination of approximately 300 µg of folate from supplements, fortified food, or both plus dietary folate (assumed to be approximately 100 µg/day before folate fortification) has been shown to be sufficient to maintain normal folate status during pregnancy. When expressed as DFEs, the consistent finding across the numerous population studies and the controlled metabolic study is that 600 µg/day of DFEs is adequate to maintain normal folate status.
|
Total in Dietary Folate Equivalents |
Results |
|
300 plus diet |
Serum folate low in 40% |
|
Diet 1,000 plus diet |
Increase 40–60% abnormal erythrocyte folate normal level compared with 10–20% in supplemented group |
|
≤ 100 200 plus diet 600 plus diet 900 plus diet |
Prevented deficiency in 72%, 84%, and 94%, respectively, comparable with nonpregnancy control |
|
100 plus diet 200 plus diet 400 plus diet 1,000 plus diet |
Decrease in serum folate in 15%; normal level serum folate |
|
660 plus diet |
Prevented deficiency in supplemented groups |
|
Diet 200 plus diet |
Maintained normal levels erythrocyte folate |
|
Diet 510 plus diet 850 plus diet 1,700 plus diet |
Folate depletion No apparent folate depletion |
Three of the four studies provided data that 100 to 150 µg/day of supplemental folate plus a low-folate diet was inadequate to maintain normal serum and hematological indices, which were the only outcomes measured in all of the subjects. The accuracy of the dietary estimates could not be ascertained, but they were lower than the one analyzed intake estimate (676 µg/day) reported by Chanarin and coworkers (1968).
Other Evidence Considered. McPartlin and colleagues (1993) quantitated the urinary excretion of the major folate catabolites in six pregnant women and six nonpregnant control subjects. These in-
vestigators converted the quantity of urinary catabolites to urinary folate equivalents and estimated that the recommended folate intake for second-trimester pregnant women would be 660 µg/day.
Folate EAR and RDA Summary, Pregnancy
From these data, low dietary folate intake plus 100 µg of supplemental folate (equivalent to approximately 200 µg/day of DFEs) is inadequate to maintain normal folate status in a significant percentage of population groups assessed. The EAR therefore was derived by adding this quantity in DFEs (200 µg/day) to the EAR for nonpregnant women (320 µg/day) to provide an EAR of 520 µg/day of DFEs.
|
EAR for Pregnancy |
|
|
14–18 years |
520 µg/day of dietary folate equivalents |
|
19–30 years |
520 µg/day of dietary folate equivalents |
|
31–50 years |
520 µg/day of dietary folate equivalents |
The RDA for folate is set by assuming a coefficient of variation (CV) of 10 percent (see Chapter 1) because information is not available on the standard deviation of the requirement for folate; the RDA is defined as equal to the EAR plus twice the CV to cover the needs of 97 to 98 percent of the individuals in the group (therefore, for folate the RDA is 120 percent of the EAR). Data from the controlled metabolic study support an RDA of 600 µg/day of DFEs based on maintenance of normal erythrocyte folate concentrations and agree with the findings from the series of population studies that 600 µg/day of DFEs is adequate to maintain normal folate status in groups of pregnant women.
|
RDA for Pregnancy |
|
|
14–18 years |
600 µg/day of dietary folate equivalents |
|
19–30 years |
600 µg/day of dietary folate equivalents |
|
31–50 years |
600 µg/day of dietary folate equivalents |
Lactation
Method Used to Estimate the Average Requirement
The EAR for the lactating woman is estimated as the folate intake necessary to replace the folate secreted daily in human milk plus the amount required by the nonlactating woman to maintain folate
status. The average daily amount of folate secreted in human milk is estimated to be 85 µg/L, as described in the previous section “Infants Ages 0 through 12 Months” (see “Human Milk”). The dietary intake needed to provide this amount must account for the estimated 50 percent bioavailability of food folate (see “Bioavailability”).
Other Evidence Considered
There are no metabolic studies in which lactating women consumed controlled amounts of dietary folate. It is unclear whether the reduction in maternal folate concentration observed in lactating women (Keizer et al., 1995; Qvist et al., 1986; Smith et al., 1983) is related to the discontinuation of use of prenatal folate supplements, loss of maternal body folate stores, or other factors. For example, in a recent study of lactating adolescents (Keizer et al., 1995), both breastfeeding mothers and mothers of formula-fed infants showed a decline in erythrocyte folate between 4 and 12 weeks postpartum, suggesting that the postpartum decline in folate status may not be related to lactation. The decrease was prevented by supplemental folate (300 µg/day).
In a recent study in which folate status was compared in supplemented and nonsupplemented lactating women (Mackey et al., 1997), dietary folate intake was estimated to be 400 µg/day. In the unsupplemented lactating women, plasma homocysteine concentrations increased significantly but remained well within the normal range (6 to 7 µmol/L); this increase, therefore, does not appear to be of nutritional significance.
Folate EAR and RDA Summary, Lactation
The calculation used to obtain the extra amount of folate needed to cover lactation is
0.78 L (milk volume) × 85 µg/L (folate concentration) × 2 (bioavailability correction factor) =133 µg/day.
When this quantity is added to the EAR for the nonlactating nonpregnant woman (320 µg/day), the result is rounded down, giving an EAR of 450 µg/day of DFEs. Women who are only partially breast-feeding would need less.
|
EAR for Lactation |
|
|
14–18 years |
450 µg/day of dietary folate equivalents |
|
19–30 years |
450 µg/day of dietary folate equivalents |
|
31–50 years |
450 µg/day of dietary folate equivalents |
The RDA for folate is set by assuming a coefficient of variation (CV) of 10 percent (see Chapter 1) because information is not available on the standard deviation of the requirement for folate; the RDA is defined as equal to the EAR plus twice the CV to cover the needs of 97 to 98 percent of the individuals in the group (therefore, for folate the RDA is 120 percent of the EAR).
|
RDA for Lactation |
|
|
14–18 years |
500 µg/day of dietary folate equivalents |
|
19–30 years |
500 µg/day of dietary folate equivalents |
|
31–50 years |
500 µg/day of dietary folate equivalents |
Special Considerations
Intakes higher than the RDA may be needed by women who are pregnant with more than one fetus, mothers nursing more than one infant, individuals with chronic heavy intake of alcohol, and individuals on chronic anticonvulsant or methotrexate therapy. Folate from supplements or fortified foods in addition to dietary folate is recommended for women capable of becoming pregnant.
REDUCING RISK OF DEVELOPMENTAL DISORDERS AND CHRONIC DEGENERATIVE DISEASE
Neural Tube Defects
Neural tube defects (NTDs) constitute an important public health problem in terms of mortality, morbidity, social cost, and human suffering. Many studies have been conducted regarding the association between folate intake and the occurrence of NTDs. The aim of this section is to review the evidence linking folate with the etiology and occurrence of NTDs in humans, estimate the risk of NTDs according to various levels of folate intake in the U.S. and Canadian populations, and develop a folate recommendation for women capable of becoming pregnant. Survey data indicate that fewer than half of U.S. females aged 15 to 44 years are at any appreciable risk of conceiving (Abma et al., 1997). Approximately 22 percent of them are permanently sterile (most often as a result of a specific
operation done for that purpose); 20 percent are using highly effective contraceptives, usually long-term in nature; 5 percent are pregnant or immediately postpartum at any particular point in time; and 11 percent have never had sexual intercourse.
Classification, Anatomy, and Embryology
NTDs are the most common major congenital malformations of the central nervous system. They arise as a result of a disturbance of the embryonic process of neurulation and are midline defects that affect neural tissues, their coverings anywhere along the neuraxis, or both. They are heterogeneous malformations, and the terms used to define them here (see Box 8-1) are based on clinical descriptions and the presumed embryological defect (Lindseth, 1996; Volpe, 1995). The terminology in the literature may vary.
NTDs are not to be confused with spina bifida occulta, a common radiographic finding that does not involve neural elements, or encephalocele, a protrusion of meninges and brain tissue outside the cranium, most frequently in the occipital region.
|
BOX 8-1 Forms of Neural Tube Defects
|
In the less-severe forms of NTD a child may otherwise be normal and, with appropriate surgical and medical care, can lead a productive life, including parenthood. Less than 20 percent of NTDs show associations with malformations in nonneural tissues, chromosomal defects, or specific genetic syndromes (Khoury et al., 1982). Techniques have been established for prenatal screening for NTDs by measuring maternal serum and amniotic fluid α-fetoprotein and by fetal ultrasound (Hobbins, 1991).
Neurulation is the first organogenetic process to be initiated and completed. It begins in the human at approximately 21 days post-fertilization and is complete by 28 days. Thus, neurulation is ongoing at the time that a woman may first recognize her pregnancy by a missed menstrual period. Closure of the neural tube begins separately and consecutively in at least three sites: the cervical-hindbrain boundary, the forebrain-midbrain boundary, and the rostral extremity of the forebrain. Closure spreads to the intervening regions with completion of neural tube formation at neuropores in the forebrain (anterior neuropore), the hindbrain, and the lumbosacral region (posterior neuropore). NTDs appear to arise from failure or inadequacy of this closure process. Different forms of NTD could arise at different times in neurulation, possibly from distinct mechanisms. Although many specific molecules are involved in the successful completion of neurulation, none have been implicated in the mechanisms underlying the common human NTDs.
Prevalence of NTDs
United States and Canada. National birth-defect registry data are not available, but a decrease in the prevalence of NTDs at birth has been observed during the past 30 years. This is not entirely explained by increased widespread prenatal screening and diagnostic techniques (De Wals et al., 1999; Yen et al., 1992). Although the comparison of results of studies using different methods for case identification should be made cautiously, regional variation in the risk of NTDs is likely (Table 8-6). It is not known whether the especially low rate observed in Hawaii is caused by genetic or by environmental factors (Cragan et al., 1995). The populations studied included women who had taken vitamin supplements at the time of conception, but the frequency of folate supplementation was estimated only in California (Velie and Shaw, 1996).
Other Countries. The incidence of the common forms of NTD varies worldwide from less than 1 to approximately 9 per 1,000 total births,
TABLE 8-6 Total Prevalence Rates of Neural Tube Defect in Selected Areas of North America, from Birth Defect Registry Data, 1985–1994
|
Area |
Prevalence Rate per 1,000 |
95% Confidence Interval |
|
Arkansas |
1.03 |
0.85–1.24 |
|
Atlanta |
0.99 |
0.78–1.23 |
|
California |
0.94 |
0.87–1.01 |
|
Iowa |
0.90 |
0.78–1.07 |
|
Hawaii |
0.72 |
0.59–0.87 |
|
Québec, Canada |
1.41 |
0.95–2.01 |
|
SOURCES: Cragan et al. (1995), De Wals et al. (1999), and Velie and Shaw (1996). |
||
with the highest incidence reported in Great Britain and Ireland (Copp and Bernfield, 1994). Other populations with high incidence include northern Chinese and Australian Aborigines (Bower et al., 1984; Moore et al., 1997). Although Sikhs have a high NTD incidence, the defects are often thoracic and associated with minimal deficit, suggesting a distinct etiology (Baird, 1983). The decrease in NTDs among Irish immigrants to the United States could be explained by genetic dilution through interethnic marriages. However, some studies of migrant populations in which NTD incidence decreases with changes in locale suggest a nutritional etiology (Borman et al., 1986; Carter, 1974).
Etiology of NTDs
The causes of these abnormalities have been the subject of intensive research over many decades. Differences in the pathogenesis and the epidemiology of different categories of NTD have led to the idea that NTDs are highly heterogeneous in etiology (Dolk et al., 1991). Substantial familial aggregation indicates that anencephaly, myelomeningocele, and craniorachischisis are related pathogenetically and genetically. Evidence from epidemiological studies of NTDs indicates that heredity is a major contributor. Indeed, the recurrence risk in a sibling birth is 3 to 5 percent (Laurence, 1990). For the most cases the inheritance is believed to be polygenic, potentially involving multiple genes. Such polygenic traits are influenced by environmental factors, thus the etiology appears to be multifactorial (Laurence, 1990). Recently, attention has turned to assessing the genetic basis of NTD and to evaluating the role of
vitamins, specifically folate, in the prevention of NTDs. Coverage of other risk factors for NTDs is beyond the scope of this report.
Genetic Evidence. An assessment of heritability for common forms of NTDs has been put at 60 percent (Emery, 1986). Data from demographic, family, and mouse model studies have prompted a search for candidate genes that predispose individuals to an NTD. A defect in enzymes involved in homocysteine metabolism is suggested by altered folate, vitamin B12, homocysteine, and methylmalonate values in mothers of infants with NTDs (Mills et al., 1995; Steegers-Theunissen et al., 1994); the prevention of some human NTDs by folate administration; and the prevention of NTDs in some rodent models by methionine (Essien, 1992; Vanaerts et al., 1994). These enzymes are 5,10-methylenetetrahydrofolate reductase (MTHFR), cystathionine β-synthase, and methionine synthase (Figure 8-3). Interestingly, families with homocystinuria caused by severe mutations in genes for each of these enzymes do not exhibit NTDs
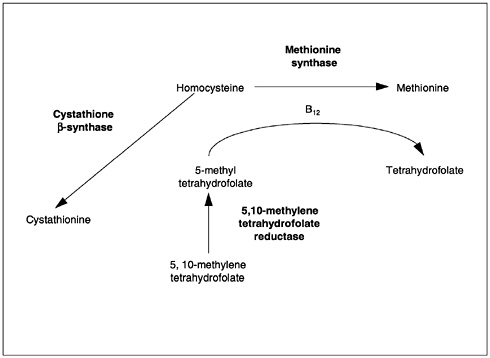
FIGURE 8-3 Major pathways depicting involvement of vitamin B12 and folate in homocysteine metabolism.
(Haworth et al., 1993; Kang et al., 1991b). Moreover, deletion of cystathionine β-synthase in the mouse yields a phenocopy of human homocystinuria but not an NTD (Watanabe et al., 1995). Subsequent work on other genetic markers of risk has not provided conclusive results (van der Put et al., 1997a, b).
Two studies have shown a statistically significant association between mothers of children with NTDs and a common variation within the gene for MTHFR (van der Put et al., 1995; Whitehead et al., 1995). This gene codes for a thermolabile variant of the enzyme that shows about 50 percent enzymatic activity and is associated with elevated serum homocysteine concentrations (Kang et al., 1991a). This association would account for approximately 15 percent of NTD cases (van der Put et al., 1995). The polymorphism was recently associated with low erythrocyte folate values (Molloy et al., 1997), which suggests that these values by themselves could account for the increased NTD risk. However, similar studies using linkage assessments are needed in suitable (genetically homogeneous) NTD populations with adequate numbers and types of controls.
No correlation has been found between two common mutations in cystathionine β-synthase and NTD prevalence in an Irish population (Ramsbottom et al., 1997). The gene for methionine synthase has only recently been cloned in mammals (Chen et al., 1997; Li et al., 1996). There are no reports of an association between mutations of this gene and NTDs.
The genetic mouse models of NTD suggest a variety of other candidate genes for human NTDs (Baldwin et al., 1992; Tassabehji et al., 1993). However, no reports assess whether any of the causative genes for mouse models show linkage with the common forms of human NTD. Because the likely heterogeneity of human NTDs may make it impossible to demonstrate linkage for any one candidate gene, candidate genes will need to be assessed in individuals with NTDs by sequence analysis.
A summary of evidence from animal studies on the etiology of NTD appears in Appendix M. Animal models of NTD have been examined and manipulated to elucidate the mechanisms of abnormal neurulation and to test etiologic hypotheses suggested by human epidemiological data.
Nutrition Evidence. Studies of migrant populations suggest a nutritional etiology for NTD (Borman et al., 1986; Carter, 1974). Lower socioeconomic class also correlates with NTD incidence (Elwood and Elwood, 1980; Laurence, 1990). Differences in diet and in supplement use could contribute to the inverse relationship of socio-
economic status with incidence of NTD, but this has not been analyzed in recent years.
Nutritional markers, particularly maternal serum vitamin B12 and serum and erythrocyte folate, as well as their metabolic indicators of adequacy, have been assessed in relation to the risk of NTD. The results have been inconsistent, some showing no association with NTD prevalence (Wald, 1994). Others have demonstrated low or low normal levels of both vitamin B12 and erythrocyte folate and suggested that both vitamins represent independent risk factors for NTD (Kirke et al., 1993). Methylmalonic acid is elevated in maternal serum of midterm NTD pregnancies (Adams et al., 1995). Some of the women who gave birth to infants with NTDs had elevated homocysteine values (Mills et al., 1995; Steegers-Theunissen et al., 1994). These studies support the proposition that NTD is associated with altered status of vitamin B12, folate, or both during pregnancy.
Teratology Studies. Drugs identified as causes of NTD in humans include folate antagonists (specifically aminopterin, previously used as an antitumor agent) (Thiersch, 1952); carbamazepine (Rosa, 1991) and valproate (commonly used antiepileptic drugs) (Blaw and Woody, 1983; Gomez, 1981; Stanley and Chambers, 1982); and retinoids, including isotretinoin (used to treat acne) (Dai et al., 1989; Hill, 1984) and etretinate (used to treat psoriasis) (Happle et al., 1984). Clomiphene (an oocyte maturation agent) is also suspected as a teratological cause of human NTDs (Wilson, 1973). These agents account for less than 0.1 percent of all NTDs. In general, the induced malformations are not restricted to NTD, and the precise mechanisms of these teratological effects are not clear. Indeed, as with other teratogens, the pharmacological and teratological mechanisms may differ because the embryo, especially at neurulation stages or earlier, is a qualitatively different organism from other developmental stages and the adult.
Risk of NTD According to Maternal Intake of Folate
The possibility that folate might be involved in NTD was first raised by Hibbard (1964). This was followed by observational studies of the effect of both dietary folate and folate supplements on NTD (Table 8-7), nonrandomized intervention studies of folate supplementation (Table 8-8), and randomized prevention studies, most of which were conducted with women who had prior NTD pregnancies (Table 8-8). The best evidence comes from the four randomized prevention trials (Czeizel and Dudas, 1992; Kirke et al., 1992;
Laurence et al., 1981; Wald et al., 1991), but the observational evidence (Table 8-7) strongly supports the intervention studies and provides the only evidence concerning dietary folate.
NTD Risk Associated with Different Levels of Dietary Folate. Data from two observational studies (Shaw et al., 1995c; Werler et al., 1993) indicate a statistically significant decreasing risk of NTD with increasing dietary folate in unsupplemented women. In both studies, the median dietary folate in the control group was approximately 300 µg/day. In the hospital-based case-control study carried out from 1988 to 1991 (Werler et al., 1993) (Tables 8-7 and 8-9), mothers were interviewed by telephone within 6 months after delivery. The interview included detailed questions about use of vitamin supplements and a semiquantitative food frequency questionnaire. In the population-based study from 1989 to 1991 (Shaw et al., 1995c) (Tables 8-7 and 8-9), folate supplement use and dietary folate intake during the periconceptional period were retrospectively assessed by using a face-to-face interview and a semiquantitative food frequency questionnaire with mothers of children with NTDs and randomly selected controls. Interviews were completed an average of 5 months after delivery. The proportion of women reporting no use of a folate supplement before conception or in the first trimester was 39 percent (207/526) for cases and 29 percent (149/523) for controls (Velie and Shaw, 1996). From these data, the average risk of NTD in the fraction of the population taking no supplement can be estimated to be 1.3 per 1,000.
In a case-control study in Australia, a negative association was found between NTD occurrence and free and total folate intake in early pregnancy (Bower and Stanley, 1989). However, the published results contain only the combined data on supplement use and dietary intake.
The results from the studies of Werler et al. (1993) and Shaw et al. (1995c) can be used to draw a tentative risk curve. Point estimates in the two studies are remarkably concordant (Figure 8-4). There is a quasilinear decreasing NTD risk for dietary folate values between 100 and 400 µg/day but no further decrease is observed for higher intake values. A possible explanation for the risk observed at higher intakes could be overreporting of consumption of folate-rich foods by some women. Also, imprecision in risk estimates because of the small sample numbers cannot be excluded.
NTD Risk Associated with Periconceptional Folate Supplement Use. The only randomized trial on the effect of periconceptional vitamin sup-
TABLE 8-7 Observational Studies of Folate and Risk of Neural Tube Defect
|
Study |
Design |
Subjects |
|
Mulinare et al., 1988 (as reported in CDC, 1992) |
Case/control in metropolitan Atlanta |
NTDa case infants and normal control infants Pregnant women without a prior NTD-affected pregnancy |
|
Bower and Stanley, 1989 (as reported in CDC, 1992) |
Case/control in Western Australia |
Spina bifida case infants and normal control infants Pregnant women without a prior NTD-affected pregnancy |
|
Mills et al., 1989 (as reported in CDC, 1992) |
Case/control in California and Illinois |
NTD case infants and normal control infants Pregnant women without a prior NTD-affected pregnancy |
|
Milunsky et al., 1989 (as reported in CDC, 1992) |
Prospective cohort in New England |
NTD case infants and normal control infants Pregnant women without a prior NTD-affected pregnancy |
|
Exposure |
Results |
Comments |
|
Multivitamin supplement containing 0–0.8 mg of folic acid at least 1 mo before conception through the 1st trimester |
24 NTD cases in infants from women supplemented and 157 cases in infants from women unsupplemented 405 normal cases in infants from supplemented mothers and 1,075 normal cases in infants from unsupplemented women controls Odds ratio = 0.40, p < 0.05 |
60% reduction in risk |
|
Dietary folate and multivitamin supplement at least 1 mo before conception through the 1st trimester |
77 NTD cases and 154 control mothers in study. The highest folate quartile was compared with the lowest. An increasing protective effect was observed from the lowest to the highest quartile. Odds ratio = 0.25, p < 0.05 |
75% reduction in risk |
|
Multivitamin plus folate supplement containing up to 0.8 mg of folic acid plus diet at least 1 mo before conception through the 1st trimester |
89 NTD cases in infants from supplemented women and 214 cases in infants from unsupplemented women 90 normal infants from supplemented women and 196 normal infants from unsupplemented women controls Odds ratio = 0.91, not statistically significant |
No protective effect |
|
Multivitamin plus folate supplement containing 0.1–1.0 mg of folic acid plus diet at least 1 mo before conception through the 1st trimester |
10 NTD pregnancies among 10,713 women who took multivitamin plus folate 39 NTD pregnancies among 11,944 women who took multivitamins without folate Relative risk = 0.28, p < 0.05 |
72% reduction in risk |
TABLE 8-8 Controlled Trials Relating Folate Supplementation and Risk of Neural Tube Defect in the Periconceptual Period
|
Study |
Design |
Subjects |
|
Randomized controlled trials—previous NTD pregnancy |
||
|
Laurence et al., 1981 |
Randomized controlled trial in Wales |
Pregnant women with prior NTDa-affected pregnancy; supplemented mothers took 4 mg of folic acid daily Unsupplemented mothers took a placebo |
|
Wald et al., 1991 |
Randomized controlled multicenter trial in United Kingdom and Hungary |
Pregnant women with prior NTD-affected pregnancy Supplemented mothers took 4 mg of folic acid daily Unsupplemented mothers took a placebo |
|
Exposure |
Results |
Comments |
|
Daily use of multivitamins, mostly 0.4 mg of folic acid, from 28 d before through 28 d after last menstrual period |
34 supplemented and 250 unsupplemented NTD case women 339 supplemented and 1,253 unsupplemented women controls Adjusted odds ratio = 0.6 (95% CI = 0.4–0.8) |
40% reduction in risk |
|
Any use of folate-containing vitamins in the 3 mo before conception |
88 supplemented and 207 unsupplemented NTD case women 98 supplemented and 149 unsupplemented women controls Odds ratio = 0.65 (95% confidence interval = 0.45–0.94) |
35% reduction in risk |
|
Exposure |
Results |
Comments |
|
4 mg of folic acid or placebo daily at least 1 mo before conception through the 1st trimester |
2 NTD pregnancies in 60 supplemented women 4 NTD pregnancies in 51 placebo-treated women Relative risk = 0.40, not statistically significant |
60% reduction in risk |
|
4 mg of folic acid or placebo daily at least 1 mo before conception through the 1st trimester |
6 NTD pregnancies in 593 supplemented women 21 NTD pregnancies in 602 unsupplemented women Relative risk = 0.28, p < 0.05 |
72% reduction in risk |
|
Exposure |
Results |
Comments |
|
Supplements taken for at least 2 mo before conception and until the date of the third missed menstrual period |
0 NTD in 172 infants/fetuses of supplemented women 1 NTD in 89 infants/fetuses of unsupplemented women Indeterminate protective effect, not statistically significant |
Trial was prematurely terminated |
|
0.36 mg of folic acid plus multivitamins or no use from 1 mo before conception through the 1st trimester |
3 NTD pregnancies in 454 supplemented women 24 NTD pregnancies in 519 unsupplemented women Relative risk = 0.14, p < 0.05 |
86% reduction in risk |
|
5 mg of folic acid or no use from 1 mo before conception through the 1st trimester |
0 NTD pregnancies in 81 supplemented women 4 NTD pregnancies in 114 untreated women Indeterminant protective effect, not statistically significant |
Complete protective effect |
|
Supplements taken for at least 1 mo before conception and until the date of the second missed period |
0 NTD pregnancies in 2,104 supplemented women 6 NTD pregnancies in 2,052 unsupplemented women Relative risk = 0.0, p = 0.029 |
Complete protective effect |
TABLE 8-9 Relative Risk of Neural Tube Defect Based on Reported Folate Intake During the Periconception Period
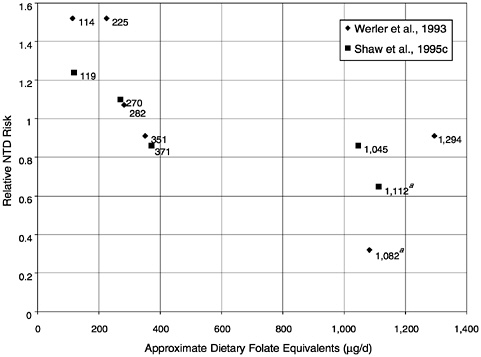
FIGURE 8-4 Risk of neural tube defect (NTD) according to folate intake based on two retrospective studies. Intake values appear next to each point, in micrograms. Midpoint values for each reference intake category have been used for defining folate intake, and relative NTD risks have been linearly adjusted to a baseline absolute risk of 1.29 per 1,000 for a folate intake of 312 µg/d. Values that include folate supplements (indicated by a) are estimated in dietary folate equivalents (1 dietary folate equivalent = 1 µg food folate = 0.6 µg folate from fortified food or as a supplement taken with food = 0.5 µg supplemented folate when fasting). SOURCE: Data from Shaw et al. (1995c) and Werler et al. (1993).
plementation (800 µg/day of folic acid) on the risk of a first occurrence of NTD was prematurely terminated after 4,753 women had been enrolled (Czeizel and Dudas, 1992) (Table 8-8). No case of NTD was observed in the group taking multivitamins containing 800 µg of folate daily compared with six cases in the group receiving a trace element supplement (p = 0.029). The effect of supplemental folate alone was not assessed. Although no protective effect was observed in one case-control study (Mills et al., 1989), a significant reduction in risk associated with supplementation was seen in one cohort (Milunsky et al., 1989) and four other case-control studies
(Bower and Stanley, 1992b; Mulinare et al., 1988; Shaw et al., 1995c; Werler et al., 1993) (Table 8-7). The optimal timing for supplementation seems to be during the 4 weeks before and after conception (Mulinare et al., 1988).
In the United States the risk reduction achieved with a daily supplement of 400 µg of folate, the most usual dose in multivitamins, was 70 percent (relative risk 0.3; 95 percent confidence interval [CI], 0.2 to 0.6) in New England (Werler et al., 1993) and 35 percent (relative risk 0.65; 95 percent CI, 0.45 to 0.94) in California (Shaw et al., 1995c) in unselected populations with average daily dietary folate intake of about 300 µg. The intake values assume a high level of compliance with supplementation, and the points represent values adjusted for bioavailability because they are given in dietary folate equivalents. It is not clear whether supplements at doses lower than 400 µg/day of folic acid provide the same level of protection as 400 µg/day or whether higher doses are associated with increased risk reduction.
The Medical Research Council Trial (Wald et al., 1991) (Table 8-8), which addressed reduction of the recurrence of NTD, used a factorial design to investigate folate in a dose of 4.0 mg/day and a mixture of other vitamins (A, thiamin, riboflavin, B6, C, D, and nicotinamide). This study found a 71 percent decreased NTD incidence in offspring of women taking the folate supplement relative to those on no supplements but no reduction with the other vitamins. In a nonrandomized trial on the risk of NTD recurrence conducted in the United Kingdom, a daily supplement of 360 µg in addition to normal diet was apparently protective (Smithells et al., 1981).
Because NTDs represent a heterogeneous group of congenital malformations both etiologically and pathogenetically, it is probable that there are cases not preventable even by large doses of folate, as was the case in the Medical Research Council Vitamin Study (Wald et al., 1991). More studies are needed to evaluate whether fortification of foods is similarly associated with reduced risk or with a valid proxy for NTD risk.
NTD Risk According to Maternal Folate Status. The erythrocyte folate concentration is a marker of long-term folate status. Studies looking for an association of erythrocyte folate with NTD risk based on estimating erythrocyte folate levels in blood samples taken early in pregnancy are preferred because maternal folate status is likely to change during pregnancy and postpartum. In four studies with blood specimens taken during pregnancy, erythrocyte folate values
were higher in women with a normal pregnancy than in women carrying a fetus with an NTD (Kirke et al., 1993; Laurence et al., 1981; Smithells et al., 1976) or with a fetus having another type of malformation (Bunduki et al., 1995). This difference was not found in one study with only eight NTD cases (Economides et al., 1992).
In a case-control study in three maternity hospitals in Dublin, Ireland, from 1986 to 1990, erythrocyte folate values were measured in frozen samples taken at a median gestational age of 15 weeks (Daly et al., 1995; Kirke et al., 1993). The percentage of women using folate supplements was 5 percent. A negative apparently nonlinear association was observed between NTD risk and erythrocyte folate concentration (Table 8-10). It is not known whether the risk would continue to decrease as erythrocyte folate values increased to higher than 1,241 nmol/L (570 ng/mL), which was the mean erythrocyte concentration of the controls who had concentrations in the highest category in Table 8-10. However, the population studied had a relatively high incidence of NTD, around 2 per 1,000 births. Extrapolation of results should be made with great care because the NTD risk in the U.S. population could be lower at every level of erythrocyte folate.
Determinants of Erythrocyte Folate. In a recent study in women aged 22 to 35 years in the Minneapolis-St. Paul area, folate supplements and folate-fortified cereals were found to be independent predic
TABLE 8-10 Distribution of Cases and Controls and Risks of Neural Tube Defect (NTD) by Erythrocyte Folate Concentration
|
Erythrocyte Folate nmol/L (ng/mL)a |
N (%) of Cases |
N (%) of Controls |
Risk of NTD per 1,000 Birthsb |
95% Confidence Interval |
|
0–339 (0–149) |
11 (13.1) |
10 (3.8) |
6.6 |
3.3–11.7 |
|
340–452 (150–199) |
13 (15.5) |
24 (9.0) |
3.2 |
1.7–5.5 |
|
453–679 (200–299) |
29 (34.5) |
75 (28.2) |
2.3 |
1.6–3.3 |
|
680–903 (300–399) |
20 (23.8) |
77 (29.0) |
1.6 |
1.0–2.4 |
|
≥ 906 (400) |
11 (13.1) |
80 (30.0) |
0.8 |
0.4–1.5 |
|
Total |
84 (100.0) |
266 (100.0) |
1.9 |
1.5–2.3 |
|
a 1 ng/mL = 2.27 nmol/L, as reported in the original study. This conversion factor differs from that used in the rest of this report. b Absolute NTD risk has been extrapolated from the odds ratio computed in a case-control study. SOURCE: Adapted from Daly et al. (1995). |
||||
tors of erythrocyte folate levels (Brown et al., 1997). An apparently nonlinear correlation was observed between folate intake from various sources and erythrocyte folate. These results are concordant with those of a controlled experiment in women who were randomly assigned to receive 0, 100, 200, or 400 µg/day of supplemental folate (Daly et al., 1997). In this randomized placebo trial, Daly and coworkers estimated the quantity of additional folate associated with an erythrocyte folate concentration of greater than 870 nmol/L (400 ng/mL), which is the amount previously shown to be associated with a significant reduction in NTD risk. The initial erythrocyte folate concentrations of the women were in the normal range (327 to 870 nmol/L [150 to 400 ng/mL], median 707 nmol/L [325 ng/ mL]). The median incremental changes in erythrocyte folate concentration in the 100-, 200-, and 400-µg/day groups were + 146 nmol/L (67 ng/mL), + 283 nmol/L (130 ng/mL), and + 435 nmol/ L (200 ng/mL), respectively.
The relative effectiveness of different interventions in increasing erythrocyte folate concentrations was evaluated in a 3-month randomized trial in 62 healthy women aged 17 to 40 years in Northern Ireland (Cuskelly et al., 1996). Erythrocyte folate concentrations improved significantly only in the groups taking folate supplements or food fortified with folate; there was no increase in the group provided extra food folate or dietary advice. Because food intake was not controlled, further studies are needed to evaluate more precisely the relative efficacy of different supplementation regimens in reducing NTD risk.
Mechanism. The mechanism by which folate could reduce NTD risk is not known. Increasing folate intake and thus the concentrations of folate derivatives in tissues might overcome a metabolic deficiency in the production of proteins or in DNA synthesis at the time of neural tube closure (Mills et al., 1995). Another hypothesis is that folate does not prevent the occurrence of NTD but selectively increases the abortion rate of affected fetuses (Hook and Czeizel, 1997). Certainly, more research is needed to understand the effect of folate on embryonic and fetal development.
Recommendations for NTD Risk Reduction
To summarize the data, a reduced risk of NTD has been observed for women who took a folate supplement of 360 to 800 µg/day in addition to a dietary folate intake of 200 to 300 µg/day. Folate intake is positively associated with erythrocyte folate concentration
(Bower and Stanley, 1989; Brown et al., 1997; Cuskelly et al., 1996; Daly et al., 1997), and NTD risk is inversely associated with both folate intake (Bower and Stanley, 1989; Shaw et al., 1995c; Werler et al., 1993) and erythrocyte folate concentration (Daly et al., 1995).
Although it is recognized that there are still uncertainties about the relationships among folate intake, erythrocyte folate, and NTD risk and the extent to which there are differences in the absorption of folate from food compared with supplements, the evidence is still judged sufficient to support a recommendation to reduce the risk of NTD. The recommendation made here for women capable of becoming pregnant is for intake that exceeds the Recommended Dietary Allowance (RDA) for folate. In particular, it is recommended that women capable of becoming pregnant consume 400 µg of folate daily from supplements, fortified foods, or both in addition to consuming food folate from a varied diet. At this time the evidence for a protective effect from folate supplements is much stronger than that for food folate. It is certainly conceivable that, if taken in adequate quantity, food folate will be shown to be as effective as folic acid, but it remains to be demonstrated. When more data are available, this recommendation will be revised.
An even larger dose of folate has been recommended to prevent recurrence in women with a previous NTD-affected pregnancy (CDC, 1991). However, some NTDs are not prevented by increasing folate intake.
To date there is no conclusive evidence to support any population screening for genetic markers of NTD risk. In the event that the correlation between the 5,10-MTHFR T677 allele and NTD is confirmed, screening women for the gene that codes for the thermolabile variant would identify only about 15 percent of those at risk for NTD. Thus, recommending consumption of 400 µg folate daily from supplementation or fortified foods for all women capable of becoming pregnant would be a more effective prevention measure than screening for the variant (Mills and Conley, 1996).
Other Congenital Anomalies
Folate may also prevent the occurrence of other types of congenital anomalies. In one randomized trial (Czeizel, 1993) and several case-control studies (Botto et al., 1996; Czeizel et al., 1996; Hayes et al., 1996; Munger et al., 1997; Shaw et al., 1995a, b; Tolarova and Harris, 1995), a reduction in the frequency of orofacial clefts and cardiovascular malformations was observed in women taking vitamin supplements and folate-fortified food. The results, however,
were not always consistent across the studies, and negative findings have also been reported (Bower and Stanley, 1992a; Hayes et al., 1996; Scanlon et al., 1998). Because multivitamins were used in all these studies, it is difficult to disentangle the effect of folate from that of other constituents. Also, the presence of unmeasured confounding cannot be excluded.
Vascular Disease
The link between homocysteine and the risk of vascular disease was derived from the study of homocystinuria. Classical homocystinuria is a rare autosomal recessive disease caused by a deficiency of cystathionine β-synthase and characterized by excessively elevated plasma homocysteine (Mudd et al., 1985). Clinical manifestations include mental retardation, skeletal abnormalities, lens dislocation, and a marked tendency to develop premature and severe atherosclerosis with thromboembolic events. In 1976 a study first showed a significant difference in homocysteine plasma concentration between patients with vascular disease and normal control subjects (Wilcken and Wilcken, 1976).
Since then, many observational and experimental studies have been published on the risk of vascular disease associated with elevated homocysteine levels. In 1995 Boushey and coworkers first published a meta-analysis; this work has recently been updated and includes a total of 20 studies (Beresford and Boushey, 1997). The relative increase in risk of coronary heart disease (CHD) as estimated by the combined odds ratio was 1.6 (95 percent CI, 1.5 to 1.7) for men and 1.5 (95 percent CI, 1.3 to 1.7) for women for each increment of 5 mmol/L in total plasma or serum homocysteine. The combined odds ratio for data from both men and women was 1.8 (95 percent CI, 1.6 to 2.0) for cerebrovascular disease and 2.0 (95 percent CI, 1.5 to 2.6) for peripheral vascular disease. There is evidence that hyperhomocysteinemia is a risk factor for CHD independent of other known risk factors such as smoking, cholesterol, body mass index, age, high blood pressure, and diabetes (Beresford and Boushey, 1997; Graham et al., 1997; Mayer et al., 1996; Verhoef et al., 1996). Similarly, Nygård and colleagues (1997) reported that plasma homocysteine values were a strong predictor of mortality in patients with angiographically confirmed coronary artery disease.
The mechanism by which elevated homocysteine might increase the risk of developing vascular disease is unclear. Several hypotheses have been proposed, and the subject was reviewed by Mayer et al. (1996). Homocysteine can exert a direct toxic effect on endothelial
cells and promote the growth of smooth muscle cells, leading to atherosclerotic lesions (Tsai et al., 1994). It can also increase adhesiveness of platelets and affect several factors involved in the clotting cascade (Harpel et al., 1996). Folate is required in the form of methyltetrahydrofolate as a substrate for methionine synthase. Therefore, the remethylation of homocysteine depends on adequate quantities of folate. Homocysteine levels can be markedly elevated in folate deficiency (Kang et al., 1987; Stabler et al., 1988). Negative correlations between serum and plasma folate and homocysteine have been seen in studies of normal subjects (Bates et al., 1997; Jacobsen et al., 1994; Pancharuniti et al., 1994; Selhub et al., 1993; Ubbink et al., 1993). Beresford and Boushey (1997) reviewed 14 intervention studies, 2 metabolic studies, and 1 observational study that included folate supplementation to reduce homocysteine levels. Results demonstrated an effect of various doses of supplemental folate in reducing homocysteine levels. Apparently, the effect of a given dose of folate was greater at higher pretreatment homocysteine values (Landgren et al., 1995; Ubbink et al., 1995b). The latter observation could, however, be partially explained by a regression to the mean of higher-than-usual values in some individuals.
As seen in Figure 8-5, the inverse association between mean dietary folate and mean homocysteine concentration is not linear but seems to reach a plateau at total folate intake levels greater than 300 mg/ day. A review of seven studies indicates that homocysteine concentrations are also inversely correlated with plasma folate concentrations, and there seems to be a serum folate concentration around 9 nmol/L (4 ng/mL) above which homocysteine values do not decrease significantly (Beresford and Boushey, 1997).
In two case-control studies, concentrations of plasma and serum folate were significantly lower in patients with early-onset vascular disease than in control subjects (Pancharuniti et al., 1994; Verhoef et al., 1996). Such an association was not found or was only observed in a subset of patients in six other studies (Bergmark et al., 1993; Brattstrom et al., 1984, 1990; Dalery et al., 1995; Giles et al., 1995; Molgaard et al., 1992). In a retrospective cohort study of participants in the Nutrition Canada Survey, a statistically significant association between serum folate concentration and risk of fatal CHD was found, with a rate ratio of 1.69 (95 percent CI: 1.10 to 2.61) for individuals in the lowest serum folate category compared with those in the highest category (Morrison et al., 1996). For participants in the U.S. Physicians’ Health Study, the reported inverse association of plasma folate concentrations with risk of myocardial
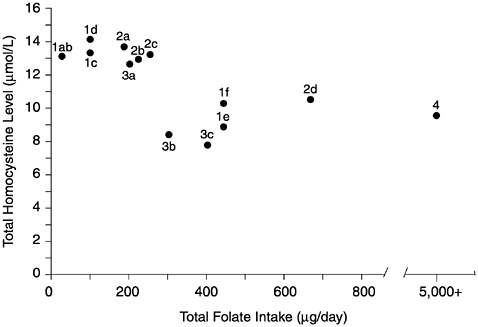
FIGURE 8-5 Mean intakes of folate and plasma levels of homocysteine (Hcy). Data points based on groups from Jacob et al. (1994) (1a–1f), mean levels of Hcy at three levels of dietary folate; Selhub et al. (1993) (2a–2d), mean levels of Hcy from lowest deciles and highest decile of folate intake; O’Keefe et al. (1995) (3a–3c), mean values of Hcy at three levels of dietary folate; Brattstrom et al. (1988) (4), mean Hcy level after added supplements of 5,000 ug of folate, pretreatmen t folate intake unknown. Reprinted with permission, from Beresford and Boushey (1997). Copyright 1997 by Humana Press.
infarction was not statistically significant (Chasan-Taber et al., 1996). For participants in the Multiple Risk Factor Intervention Trial, no association was observed between homocysteine concentration and the risk of heart disease (Evans et al., 1997).
A recent prospective observational study examined the effect of self-selection for intake of folate and vitamin B6 on the incidence of myocardial infarction and CHD (Rimm et al., 1998). After controlling for other risk factors for CHD and adjusting vitamin intake on the basis of energy intake, about a twofold reduction in CHD was found for individuals in the quintile with the highest folate and vitamin B6 intakes compared with those with the lowest intakes. When intakes of each of the vitamins were considered separately, the multivariate analyses suggested a reduction of about 30 percent
in disease incidence between the highest and lowest quintiles of intake for each of the vitamins. For folate the data are compatible with the Framingham study (Selhub et al., 1993), in which the lowest deciles of folate intake were associated with higher circulating homocysteine. In the Rimm et al. (1998) study, although multivariate analysis indicated a trend in risk reduction across the quintiles of intake, the major reduction appeared to occur between the first and second quintiles of intake (median intakes 158 and 217 mg of folate). In the subgroup analysis there appeared to be no risk reduction beyond the second quintile of folate intake (217 mg) in nondrinkers, but in alcohol consumers risk reduction increased over the quintiles of intake. Although these data are consistent with the hypothesis that self-selection for increased folate reduces vascular disease risk, other variables associated with lifestyle differences of individuals who consume higher vitamin intakes may also have influenced CHD risk. Some of these variables were not or could not have been considered in the analysis. Several ongoing randomized trials are addressing whether supplements per se will decrease risk of CHD.
Individuals homozygous for the 5,10-MTHFR T677 allele tend to have high homocysteine concentrations as a result of reduced enzymatic activity (Frosst et al., 1995). A few investigations found the risk of vascular disease to be increased in persons homozygous for the T677 allele (deFranchis et al., 1996; Gallagher et al., 1996; Kluijtmans et al., 1996) but the association has not been found in most studies (Ma et al., 1996; Schmitz et al., 1996; Schwartz et al., 1997; Verhoef et al., 1997a; Wilcken et al., 1996). In a meta-analysis the combined odds ratio of CHD associated with homozygosity for T677 allele was 0.98 (95 percent CI, 0.83 to 1.17) (Verhoef et al., 1997b).
The inverse relationship between folate intake and homocysteine concentration is well established. However, there are conflicting data on the association among indicators of folate status or metabolism, homocysteine concentration, and risk of vascular disease. Whether increasing intake of folate could reduce the risk of vascular disease remains to be demonstrated. Folate may reduce the risk of cardiovascular disease through other mechanisms. For example, the data from the study by Verhaar and colleagues (1998) support a direct effect of folate catabolites in restoring or preserving the endothelium function and integrity by affecting cellular oxidative metabolism. More evidence concerning a causal relationship between folate status and vascular disease will be provided by data from prospective controlled intervention trials that are currently under
way. At present it is premature to consider vascular disease risk reduction as an indicator for setting the Estimated Average Requirement (EAR) and Recommended Dietary Allowance (RDA) for folate.
Cancer
Experimental data indicate that changes in folate status may influence the process of neoplastic changes in certain epithelial tissue: a negative change in folate status may stimulate carcinogenesis. It is unclear if supraphysiological doses obtained from supplements afford any protection.
Dysplasia and Metaplasia
Dysplastic and metaplastic changes have been reported to reverse in response to high-dose supplemental folate. Butterworth and coworkers (1982) conducted a prospective, controlled clinical intervention trial giving supplements of 10 mg/day of folate to 47 women with dysplastic changes in the epithelium of the uterine cervix. They observed a significant attenuation of dysplasia, but the alteration in cytology may have been an attenuation of dysplasia or simply a reduction in megaloblastic cellular changes. A subsequent intervention trial by the same research group (Butterworth et al., 1992b) was unable to reproduce the results. However, the subjects in this second intervention study initially had the lowest grade of dysplasia, which has a greater than 60 percent spontaneous rate of reversion to normal. Heimburger and colleagues (1988) observed a significant reduction in metaplastic change in bronchial epithelial tissue in response to 10 mg of folate with 500 µg of vitamin B12 given daily for 4 months to 36 subjects compared with changes in 37 subjects given a placebo. These findings may be questioned because of spontaneous variation in bronchial cytology, small sample size, short duration of trial, and the very high doses of folate and vitamin B12 used.
It has been hypothesized that poor folate status by itself is not carcinogenic but may enhance an underlying predisposition to cancer (Heimburger et al., 1987; Mason and Levesque, 1996). Support for this theory includes data from a case-control intervention trial of patients with cervical dysplasia who also were at significantly higher risk for cervical cancer because of cervical infection with human papilloma virus-16 (HPV-16) (Butterworth et al., 1992a). Subjects with the HPV-16 infection had a fivefold greater risk of having dysplasia if they also had diminished erythrocyte folate values (660
nmol/L [303 ng/mL]) (Butterworth et al., 1992a). On the basis of these data and other data from study of the colorectum (Lashner, 1993), Mason and Levesque (1996) suggested that even a minor decrease in folate status may promote carcinogenesis.
Potential mechanisms for folate-related enhancement of carcinogenesis include the induction of DNA hypomethylation (Kim et al., 1997), increased chromosomal fragility or diminished DNA repair (Kim et al., 1997), secondary choline deficiency, diminution in natural killer cell surveillance, misincorporation of uridylate for thymidylate in DNA synthesis, and facilitation of tumorigenic virus metabolism (Mason and Levesque, 1996).
Cervical Neoplasia
Although several studies suggest that increased consumption of folate reduces the relative risk of cervical neoplasia (Brock et al., 1988; Potischman et al., 1991; Verreault et al., 1989; Ziegler et al., 1990, 1991), statistical significance was not attained in these studies after adjustments were made for confounding variables. These studies had several limitations: folate intake was assessed with a food frequency instrument that had not been validated for folate intake (Mason and Levesque, 1996); because subjects were not stratified for HPV infections as was done by Butterworth and colleagues (1992a), the inverse association between folate intake and cervical neoplasia in high-risk subjects was not examined; and the subjects had either carcinoma in situ or invasive cancer—advanced stages of neoplasia that may be unresponsive to folate (Heimburger et al., 1987; Mason and Levesque, 1996). Therefore, the effect of folate status on carcinogenesis in the cervix remains uncertain.
Colorectal Cancer
Data supporting the modulation of carcinogenesis by folate status are the strongest for the colorectum. Patients with chronic ulcerative colitis are at increased risk for colonic cancer and also coexisting folate deficiency. Sulfasalazine, a drug taken chronically by these patients, inhibits folate absorption (Halsted et al., 1981) and metabolism (Selhub et al., 1978). Lashner and coworkers (1989) observed that the rate of colonic neoplasia was 62 percent lower in folate-supplemented patients with chronic ulcerative colitis than in unsupplemented patients and that sulfasalazine therapy was associated with an increase in the risk of dysplasia. These observations were not statistically significant but pointed to an important area of
investigation. Lashner (1993) subsequently compared prospectively the erythrocyte folate concentrations in patients with neoplastic changes in the colorectum with those for disease-matched control patients without neoplasia. The mean erythrocyte concentration was significantly lower in the individuals with neoplasia (988 nmol/L [454 ng/mL]) than in the control patients (1,132 nmol/L [520 ng/ mL]) but was still well within the normal range, which is in line with observations of erythrocyte folate concentrations and dysplasia in the uterine cervix (Butterworth et al., 1992a). Meenan and colleagues (1996) described the lack of association between erythrocyte folate levels and colonic biopsy specimens in healthy individuals, indicating the potential difficulty in predicting localized folate deficiency. In a subsequent report (Meenan et al., 1997), epithelial cell folate depletion occurred in neoplastic but not adjacent normal colonic mucosa.
In general, epidemiological studies support an inverse relationship between folate status and the rate of colorectal neoplasia (Mason and Levesque, 1996). Two large, well-controlled prospective studies support the inverse association between folate intake and incidence of colorectal adenomatous polyps (Giovannucci et al., 1993) and colorectal cancers (Giovannucci et al., 1995). In these two studies, moderate-to-high alcohol intake greatly increased the neoplastic risk of a low-folate diet. There was a significant 35 percent lower risk of adenoma in those in the highest quintile of folate intake (approximately 800 µg/day) relative to those in the lowest quintile (approximately 200 µg/day, relative risk approximately 0.65). The adverse effect of high alcohol intake coupled with a low-folate diet was confirmed by Glynn and colleagues (1996), who observed a significant fourfold increase in risk of colorectal cancer. Physicians’ Health Study participants with the MTHFR polymorphism had reduced risk of colon cancer, but low folate intake or high alcohol consumption appeared to negate some of the protective effect (Ma et al., 1997) (see Appendix L for further discussion of MTHFR polymorphism).
More evidence for or against a causal relationship between folate status and colorectal cancer will be provided by data from prospective controlled intervention trials that are currently under way.
Lung, Esophageal, and Stomach Cancer
As reviewed by Mason and Levesque (1996), data are not sufficient for making conclusions regarding the possible role of folate in reducing the risk of cancer of the lung, esophagus, or stomach.
Psychiatric and Mental Disorders
The suggestion that folate deficiency might produce psychiatric disturbances was made more than 30 years ago (Herbert, 1962a). Since then the issue has been examined by three approaches: assessment of the incidence of psychiatric disturbances in patients presenting with a medical condition related to folate deficiency (e.g., megaloblastic anemia), assessment of the incidence of folate deficiency in patients presenting with a psychiatric condition (of any etiology), and evaluation of the efficacy of folate treatment in the resolution of psychiatric disorders. In general, the database linking folate to altered mental function is not large but appears sufficient to suggest the likelihood of a causative association. However, it is still unclear whether reduced folate intake is the cause or an effect of the mental disorders.
The most unambiguous observation suggesting this link is derived from studying patients with megaloblastic anemia. Shorvon and coworkers (1980) reported that among such patients having a clear folate deficiency (plasma folate 3.4 ± 1.4 [standard deviation] nmol/ L [1.5 ± 0.6 ng/mL]) in the absence of vitamin B12 deficiency, the prevalence of an affective (mood) disturbance was 56 percent. Other studies of nonpsychiatric patients are consistent with this observation, showing changes in mood and in mental function (Goodwin et al., 1983; Herbert, 1962a; Reynolds et al., 1973).
Most studies that attempt to link folate deficiency and mental disorder are in psychiatric patients. The studies involved measurements of serum, plasma, or erythrocyte folate concentrations in patients on long-term drug therapy, some of whom were drug free when examined. No patients with a psychiatric diagnosis appear to have been assessed at first admission before drug therapy was instituted. Coppen and Abou-Saleh (1982), for example, measured serum folate concentrations in unipolar and bipolar depressed patients: mean plasma folate concentrations were significantly lower than those in a group of control subjects (13 vs. 15 nmol/L [6 vs. 7 ng/mL]). They further observed that in the psychiatric subjects, morbidity was significantly higher in individuals with plasma folate concentrations below 9 nmol/L (4 ng/mL) than in those with values at or above 18 nmol/L (8 ng/mL). In subjects with depression, the prevalence of folate deficiency (plasma folate less than 5.7 nmol/L [2.5 ng/mL]) was found to be 15 to 17 percent, a value substantially higher than the 2 percent found in control subjects (Abou-Saleh and Coppen, 1989); erythrocyte folate was also measured and found to correlate highly with plasma folate concentrations.
In a study of erythrocyte folate concentrations, Carney and colleagues (1990) observed that among patients admitted to a psychiatric unit with endogenous depression, 20 percent had erythrocyte folate concentrations below 327 nmol/L (150 ng/mL), a prevalence markedly higher than that observed in euthymic, manic, schizophrenic, or alcoholic patients. A recent study involving plasma folate determinations suggests that the prevalence of folate deficiency may not be this high (Fava et al., 1997). Nevertheless, patients with low plasma folate levels responded less well to standard antidepressant (fluoxetine) therapy than did those with normal folate values. In these studies, there appears to be no uniform definition of folate deficiency (as indexed via the plasma or erythrocyte folate determination); moreover, folate assays (and absolute folate values) differed among laboratories (and within studies, e.g., Coppen et al. [1986]), making any blood deficiency threshold difficult to standardize (Young and Ghadirian, 1989).
Two double-blind studies (Coppen et al., 1986; Godfrey et al., 1990) evaluated the efficacy of folate supplementation in the recovery from psychiatric illness, but the use of nutrients for treatment is not relevant to this report and will not be discussed here.
Although the connection between folate and mental function has been most strongly made for depression and affective state, intake of the vitamin has also been linked (though less convincingly at present) to other psychiatric conditions and to deficits in learning and memory, particularly in the elderly (Joyal et al., 1993; Riggs et al., 1996; Wahlin et al., 1996).
The mechanism by which folate modifies brain functions has been sought for more than two decades and is generally hypothesized to be related to its role in single-carbon metabolism (Alpert and Fava, 1997). In particular, methylene tetrahydrofolate is the methyl donor in methionine synthesis from homocysteine and is postulated to be important in maintaining adequate methionine pools for S-adenosylmethionine (SAM) biosynthesis (Bottiglieri et al., 1994). SAM is the cofactor in key methylation reactions in catecholamine synthesis and metabolism in brain (Turner, 1977); catecholamines are transmitters known to be important in maintaining affective state, and exogenous SAM has been shown by some to elevate mood (Bell et al., 1988). Folate has also been linked to the maintenance of adequate brain levels of tetrahydropterin (Hamon et al., 1986), a key cofactor in the hydroxylation reactions leading to the synthesis of transmitters such as serotonin and the catecholamines (Turner, 1977). Methylation reactions involving folate may be important in maintaining neuronal and glial membrane lipids (Hirata and Axelrod,
1980), which could have effects on more general brain functions as reflected in changes in mood, irritability, and sleep.
Although available information may suggest that a link exists between folate deficiency and abnormal mental function, more than three decades of research have not produced a definitive connection. There is a clear need to evaluate folate supplementation more completely at multiple doses, under double-blind conditions, and in individuals with mental disease as well those having nonpsychiatric illnesses in order to make this connection more convincing (Joyal et al., 1993). Furthermore, coexistent conditions in subjects with low folate status rather than the folate deficiency may account for observed deficits in mental function and affective state. These conditions include chronic disease, drug history, alcohol use, age, education, and family history and must be more carefully considered in future studies (Young and Ghadirian, 1989).
Summary of Evidence Concerning the Risk of Developmental Disorders and Chronic Degenerative Disease
Reducing the Risk of NTD
Uncertainties still exist about the relationships among folate intake, erythrocyte folate, and NTD risk and about the extent to which the effect of food folate should be distinguished from the effect of folate from supplements or fortified foods, but the evidence is judged sufficient to support a specific recommendation to reduce the risk of NTD.
Reducing the Risk of Cardiovascular Disease, Cancer, and Psychiatric and Mental Disorders
The evidence that folate may reduce the risk of cardiovascular disease, certain types of cancer, and psychiatric and mental disorders is provocative and promising. However, it is not yet sufficiently substantiated and is somewhat conflicting. It is premature to consider reduction of any of these risks as a basis for setting an EAR or Adequate Intake (AI).
INTAKE OF FOLATE
Food Sources
Data obtained from the Continuing Survey of Food Intakes by
Individuals (CSFII) indicates that the greatest contribution to folate intake of the U.S. adult population in 1992–1994 came from fortified ready-to-eat cereals and a category called “other vegetables” (see footnote d in Table 8-11 for the list of vegetables in this category). Although many of the vegetables in the “other vegetables” category have lower folate content than dark green vegetables such as spinach, some of them (e.g., green beans and vegetable soup) are so commonly eaten that their contribution to total folate intake is relatively high.
As of January 1, 1998, all enriched cereal grains (e.g., enriched bread, pasta, flour, breakfast cereal, and rice) are required to be fortified with folate at 1.4 mg/kg of grain (DHHS, 1996). During the period when data were collected in CSFII, with few exceptions the only grain products that were fortified with folate were ready-to-eat cereals (most kinds) and cooked cereals. Because enriched cereal grains are widely consumed in the United States, they are now an even more important contributor of folate than is indicated in Table 8-11. In Canada the fortification of flour and cornmeal with folate is proposed at a level of 1.5 mg/kg and fortification of
TABLE 8-11 Food Groups Providing Folate in the Diets of U.S. Men and Women Aged 19 Years and Older, CSFII, 1995a
|
|
Contribution to Total Folate Intakeb (%) |
Foods Within the Group that Provide at Least 80 µg of Folatec per Serving |
||
|
Food Group |
Men |
Women |
80–160 µg |
> 160 µg |
|
Food groups providing at least 5% each of total folate intake |
||||
|
Ready-to-eat cereals |
16.1 |
18.6 |
Moderately fortified |
Highly fortified |
|
Other vegetablesd |
11.5 |
12.4 |
Green beans, green peas, lettuce, cabbage, and vegetable soup |
— |
|
Bread and bread products |
8.1 |
7.6 |
— |
— |
|
Citrus fruits and juices |
6.3 |
7.5 |
Orange juice |
— |
|
|
Contribution to Total Folate Intakeb (%) |
Foods Within the Group that Provide at Least 80 µg of Folatec per Serving |
||
|
Food Group |
Men |
Women |
80–160 µg |
> 160 µg |
|
Mixed foodse |
6.0 |
4.3 |
NAf |
NA |
|
Legumes |
5.6 |
4.9 |
Chickpeas; pink, pinto, red kidney, mung, and fava beans; and black-eye peas |
Cowpeas and lentils |
|
Mixed foods, main ingredient is grain |
5.6 |
4.4 |
NA |
NA |
|
Folate from other foods |
||||
|
Pasta, rice, and cooked cereals |
3.2 |
3.2 |
— |
Fortified oatmeal |
|
Dark green vegetables |
2.7 |
4.3 |
Spinach and turnip greens |
— |
|
Organ meats |
0.5 |
0.6 |
Kidney |
Liver |
|
NOTE: The fortification in the United States of all enriched cereal grains with folate that began in 1998 and the recommended use of mg of dietary folate equivalents in place of mg of folate, which takes into account bioavailability of the various sources, would cause major changes in the relative contributions of each food group to total folate intake following mandatory fortification of enriched cereals and grains. a CSFII = Continuing Survey of Food Intakes by Individuals. b Contribution to total intake reflects both the concentration of the nutrient in the food and the amount of the food consumed. It refers to the percentage contribution to the American diet for both men and women, based on 1995 CSFII data. c 80 µg represents 20% of the Reference Daily Intake (400 µg) of folate—a value set by the Food and Drug Administration. Values do not represent dietary folate equivalents; expressed as dietary folate equivalents, values for ready-to-eat cereals or other food fortified with folate would be higher. d Includes artichoke, asparagus, green beans, fresh lima beans, beets, Brussels sprouts, cabbage, cauliflower, corn, cucumber, eggplant, kohlrabi, lettuce, mushrooms, onions, okra, green peas, peppers, rutabaga, snowpeas, squash, turnips, vegetable salads, vegetable combinations, and vegetable soups. e Includes sandwiches and other foods with meat, poultry, or fish as main ingredient. f NA = not applicable. Mixed foods were not considered for this table. SOURCE: Unpublished data from the Food Surveys Research Group, Agricultural Research Service, U.S. Department of Agriculture, 1997. |
||||
alimentary paste is proposed at a level of at least 2.0 mg/kg (Health Canada, 1997). It is estimated that folate fortification will increase the folate intake of most U.S. women by 80 µg/day (136 µg of dietary folate equivalents [DFEs]) or more. This amount would be provided by one cup of pasta plus one slice of bread. Depending on what cereal grains are chosen and how much is consumed, five servings daily might add 220 µg/day or more of folate from fortified foods (nearly 400 µg of DFEs) to the diet (see Chapter 13).
Dietary Intake
According to the U.S. Department of Agriculture’s CSFII (Appendix G), the mean dietary folate intake by young women in the United States in 1994 through 1995 was approximately 200 µg/day. Intake data from the Third National Health and Nutrition Examination Survey (NHANES III) (Appendix H) gathered from 1988 to 1994 indicate a mean dietary intake of approximately 220 µg for young women and a total intake (including supplements) that was only slightly higher (250 µg). These values substantially underestimate actual current intake, partly because of the problems with analysis of the folate content of food (DeSouza and Eitenmiller, 1990; Pfeiffer et al., 1997b; Tamura et al., 1997), partly because of underreporting of intake (LSRO/FASEB, 1995), and partly because of the change in fortification discussed above. Thus, it is not possible to use these data to accurately assess the adequacy of current folate intake by Americans.
Survey data from the early 1990s from two Canadian provinces found similar or lower mean dietary intakes of folate for young women (approximately 200 µg/day in Québec and 160 µg/day in Nova Scotia) (Appendix I).
The Boston Nutritional Status Survey (Appendix F) conducted from 1981 to 1984 estimated that this relatively advantaged group of people over age 60 who were not taking supplements had median folate intakes of 254 µg/day for men and 208 µg/day for women.
Intake from Supplements
Results of a nationwide telephone survey conducted during January and February 1997 indicated that 43 percent of women of childbearing age reported taking some form of vitamin supplement containing folate. Thirty-two percent reported taking a folate supplement daily and 12 percent reported taking a supplement less frequently (CDC, 1998).
Information from the Boston Nutritional Status Survey on folate supplement use by a free-living elderly population from 1981 to 1984 is given in Appendix F. Both the fiftieth percentile and seventy-fifth percentiles of folate intake from supplements were 400 µg for supplement users. Largely because of supplement use, the median folate intake by pregnant women in NHANES III in 1988 to 1994 was nearly 1,000 µg/day (Appendix H). Supplements containing 1,000 µg or more of folate are available only by prescription in the United States and Canada. Smaller doses, usually 400 (g, are available over the counter.
TOLERABLE UPPER INTAKE LEVELS
Hazard Identification
This section reviews the potential hazards associated with high intake of folate as one of the primary steps in developing a Tolerable Upper Intake Level (UL). In reviewing potential hazards, careful consideration was given to the metabolic interrelationships between folate and vitamin B12, which include shared participation of the two vitamins in an enzymatic reaction; identical hematological complications resulting from deficiency of either nutrient; amelioration by folate administration of the hematological complications caused by either folate or vitamin B12 deficiency; and in vitamin B12 deficiency, the occurrence of neurological complications that do not respond to folate administration.
Adverse Effects
No adverse effects have been associated with the consumption of the amounts of folate normally found in fortified foods (Butterworth and Tamura, 1989). Therefore, this review is limited to evidence concerning intake of supplemented folate. The experimental data in animal studies and in vitro tissue and cell culture studies were considered briefly to determine whether they supported the limited human data.
Neurological Effects. The risk of neurological effects described in this section applies to individuals with vitamin B12 deficiency. Vitamin B12 deficiency is often undiagnosed but may affect a substantial percentage of the population, especially older adults (see Chapter 9). Three types of evidence suggest that excess supplemental folate intake may precipitate or exacerbate the neurological damage of
vitamin B12 deficiency. First, numerous human case reports show onset or progression of neurological complications in vitamin B12-deficient individuals receiving supplemental folate (Table 8-12). Second, studies in monkeys (Agamanolis et al., 1976) and fruit bats (van der Westhuyzen and Metz, 1983; van der Westhuyzen et al., 1982) show that vitamin B12-deficient animals receiving supplemental folate develop signs of neuropathology earlier than do controls. The monkey studies used dietary methods to induce vitamin B12 deficiency whereas the fruit bat studies used a well-described method involving nitrous oxide (Metz and van der Westhuyzen, 1987). Third, a metabolic interaction between folate and vitamin B12 is well documented (Chanarin et al., 1989). Although the association between folate treatment and neurological damage observed in human case reports does not provide proof of causality, the hazard associated with excess supplemental folate cannot be ruled out. The hazard remains plausible given the findings from animal studies and the demonstrated biochemical interaction of the two nutrients. The resulting neurological damage may be serious, irreversible, and crippling.
For many years, it has been recognized that excessive intake of folate supplements may obscure or mask and potentially delay the diagnosis of vitamin B12 deficiency. Delayed diagnosis can result in an increased risk of progressive, unrecognized neurological damage. Evidence from animal as well as in vitro tissue and cell culture studies (Baxter et al., 1973; Hommes and Obbens, 1972; Kehl et al.,
TABLE 8-12 Dose and Duration of Oral Folate Administration and the Occurrence of Neurological Manifestations in Patients with Pernicious Anemia
|
Study |
Number of Subjects |
Dose (mg/d) |
Duration |
Occurrence of Neurological Manifestationsa |
|
Crosby, 1960 |
1 |
0.35 |
2 y |
1 of 1 |
|
Ellison, 1960 |
1 |
0.33–1 |
3 mo |
1 of 1 |
|
Allen et al., 1990 |
3 |
0.4–1 |
3–18 mo |
3 of 3 |
|
Baldwin and Dalessio, 1961 |
1 |
0.5 |
16 mo |
1 of 1 |
|
Ross et al., 1948 |
4 |
1.25 |
9–23 mo |
1 of 4 |
|
Chodos and Ross, 1951 |
4 |
1.25b |
3.5–26 mo |
3 of 4 |
|
Victor and Lear, 1956 |
2 |
1.5–2.55 |
10–39 mo |
2 of 2 |
|
Conley and Krevans, 1951 |
1 |
4.5 |
3 y |
1 of 1 |
|
Study |
Number of Subjects |
Dose (mg/d) |
Duration |
Occurrence of Neurological Manifestationsa |
|
Schwartz et al., 1950 |
48 |
5 |
48 mo |
32 of 48 |
|
Ross et al., 1948 |
2 |
5 |
20–23 mo |
1 of 2 |
|
Conley and Krevans, 1951 |
2 |
5–8 |
2–2.5 y |
2 of 2 |
|
Will et al., 1959 |
36 |
5–10 |
1–10 y |
16 of 36 |
|
Bethell and Sturgis, 1948 |
15 |
5–20 |
12 mo |
4 of 15 |
|
Chodos and Ross, 1951 |
11 |
5–30 |
3–25 mo |
7 of 11 |
|
Israels and Wilkinson, 1949 |
20 |
5–40 |
35 mo |
16 of 20 |
|
Wagley, 1948 |
10 |
5–600 |
12 mo |
8 of 10 |
|
Ellison, 1960 |
1 |
5.4–6.4 |
2 y |
1 of 1 |
|
Victor and Lear, 1956 |
1 |
6.68 |
2.5 y |
1 of 1 |
|
Berk et al., 1948 |
12 |
10 |
> 17 mo |
3 of 12 |
|
Best, 1959 |
1 |
10 |
26 mo |
1 of 1 |
|
Spies and Stone, 1947 |
1 |
10 |
22 d |
1 of 1 |
|
Ross et al., 1948 |
6 |
10–15 |
≤ 12 mo |
4 of 6 |
|
Hall and Watkins, 1947 |
14 |
10–15 |
2–5 mo |
3 of 14 |
|
Heinle et al., 1947 |
16 |
10–40 |
≤ 12 mo |
2 of 16 |
|
Jacobson et al., 1948 |
1 |
10–65 |
5 mo |
1 of 1 |
|
Heinle and Welch, 1947 |
1 |
10–100 |
4 mo |
1 of 1 |
|
Spies et al., 1948 |
38 |
≥10 |
24 mo |
28 of 38 |
|
Ross et al., 1948 |
7 |
15 |
28–43 moc |
3 of 7 |
|
Chodos and Ross, 1951 |
1 |
15 |
10.5 moc |
1 of 1 |
|
Fowler and Hendricks, 1949 |
2 |
15–20 |
4–5 mo |
2 of 2 |
|
Vilter et al., 1947 |
21 |
50–500 |
10–40 d |
4 of 4 |
|
NOTE: All studies except Allen et al. (1990) were conducted before folate was added to any foods as a fortificant. In most of the case reports for which hematological status was reported, some degree of hematological improvement occurred. Studies are presented in increasing order by dose. When different doses were reported within a study, there is more than one entry for that study. Case reports that covered hematological rather than neurological effects were excluded, namely, Alperin (1966), Heinle and Welch (1947), Herbert (1963), Reisner and Weiner (1952), Ritz et al. (1951), Sheehy et al. (1961), and Thirkettle et al. (1964). The exception was the study by Allen et al. (1990) in which the subjects were vitamin B12 deficient but did not have pernicious anemia. a Refers to neurological relapses or progression of preexisting neurological manifestations while on folate therapy. b In two patients, the neurological progression was characterized as minimal or slight. Neurological progression was also observed when the dose was increased to 15 mg/d in these patients. c The initial dosage of 1.25 mg/d was increased to 15 mg/d after variable durations of treatment. Neurological progression occurred only at 15 mg/d in these patients. |
||||
1984; Loots et al., 1982; Olney et al., 1981; Spector, 1972; Weller et al., 1994) suggests that folate in the form of folic acid is neurotoxic and epileptogenic in animals; however, there is no clear evidence of folate-induced neurotoxicity in humans. Concerns have been raised about the possibility of decreased effectiveness of treatment if individuals treated with anticonvulsant drugs take high doses of folate. However, the UL does not apply to drug-drug interactions or to high doses taken under medical supervision (see “Anticonvulsants” and “Methotrexate”).
General Toxicity. In one nonblinded uncontrolled trial, oral doses of 15 mg/day of folate for 1 month were associated with mental changes, sleep disturbances, and gastrointestinal effects (Hunter et al., 1970). However, studies using comparable or higher doses, longer durations, or both failed to confirm these findings (Gibberd et al., 1970; Hellstrom, 1971; Richens, 1971; Sheehy, 1973; Suarez et al., 1947).
Reproductive and Developmental Effects. Many studies have evaluated the periconceptional use of supplemental folate (in doses of approximately 0.4 to 5.0 mg) to prevent neural tube defects (Table 8-13). No adverse effects have been demonstrated, but the studies were not specifically designed to assess adverse effects. No reports were found of adverse effects attributable to folate in long-term folate supplement users or in infants born each year to mothers who take supplements, but this has not been investigated systematically. Because it is possible that subtle effects might have been missed, investigations designed to detect adverse effects are needed.
Carcinogenicity. In a large epidemiological study, positive associations were found between supplemental folate intake and the incidence of cancer of the oropharynx and hypopharynx and of total cancer (Selby et al., 1989). However, the authors of this study suggest that these associations might have been related to unmeasured confounding variables such as alcohol and smoking. Additionally, other studies suggest that folate might be anticarcinogenic (see “Cancer”) (Campbell, 1996).
Hypersensitivity. Individual cases of hypersensitivity reactions to oral and parenteral folate administration were reported (Gotz and Lauper, 1980; Mathur, 1966; Mitchell et al., 1949; Sesin and Kirschenbaum, 1979; Sparling and Abela, 1985). Such hypersensitivity is rare, but
reactions have occurred at supplemental folate doses as low as 1 mg/day (Sesin and Kirschenbaum, 1979).
Intestinal Zinc Absorption. Although there has been some controversy regarding whether supplemental folate intake adversely affects intestinal zinc absorption (Butterworth and Tamura, 1989), a comprehensive review of the literature reveals that folate supplementation has either no effect on zinc nutriture or an extremely subtle one (Arnaud et al., 1992; Butterworth et al., 1988; Hambidge et al., 1993; Keating et al., 1987; Milne et al., 1984; Tamura, 1995; Tamura et al., 1992). In a study of prenatal folate supplementation, Mukherjee et al. (1984) noted a significant association between the occurrence of fetomaternal complications and the combination of low maternal plasma zinc and high maternal plasma folate concentrations. However, this study may have failed to control for potential confounding factors. Furthermore, these findings are not supported by Tamura and colleagues (1992), who found high serum folate concentrations to be associated with favorable pregnancy outcomes including higher birth weight and Apgar scores of newborns, reduced prevalence of fetal growth retardation, and lower incidence of maternal infection close to the time of delivery.
Summary
The weight of the limited but suggestive evidence that excessive folate intake may precipitate or exacerbate neuropathy in vitamin B12-deficient individuals justifies the selection of this endpoint as the critical endpoint for the development of a UL for folate.
Dose-Response Assessment
Adults
Data Selection. To evaluate a dose-response relationship and derive a UL for folate, case reports were used that involved oral administration of folate in patients with vitamin B12 deficiency who showed development or progression of neurological complications. Because a number of apparently healthy individuals are vitamin B12 deficient (see Chapter 9), these individuals are considered part of the general population in setting a UL.
Identification of a No-Observed-Adverse-Effect Level (NOAEL) and a Lowest-Observed-Adverse-Effect Level (LOAEL). The literature was re-
TABLE 8-13 Assessing Adverse Reproductive Effects from Studies Involving Supplemental Folate
|
Reference |
Subjects |
Duration of Study |
Study Design |
|
Laurence et al., 1981 |
95 women |
≥ 9 wk |
Clinical trial: randomized, controlled, double-blinded |
|
Smithells et al., 1981 |
550 women |
110 d (mean duration) |
Clinical trial: controlled |
|
Mukherjee et al., 1984 |
450 pregnant women |
≥ 9 mo |
Prospective cohort study |
|
Vergel et al., 1990 |
81 women |
≥ 3 mo |
Clinical trial: controlled |
|
Wald et al., 1991 |
910 women |
A few monthsd |
Clinical trial: randomized, double-blinded, controlled |
|
Czeizel and Dudas, 1992 |
4,753 women (< 35 y) |
3 mo |
Clinical trial: randomized, controlled |
|
Holmes-Siedle et al., 1992 |
100 women |
Periconceptional period; 7–10 y follow-up |
Observational study |
|
Kirke et al., 1992 |
354 pregnant women |
5 mo |
Clinical trial: randomized, controlled |
|
Czeizel et al., 1994 |
5,502 women |
3 mo |
Randomized, controlled trial |
|
a NR = not reported. Study was not designed to assess adverse effects. b Plasma folate was measured at different times in pregnancy, but compliance with prenatal vitamin use was not recorded. c There was no control of confounding variables making it difficult to interpret the results. d The average duration of exposure is not indicated in the publication but was likely a few months. |
|||
viewed to find cases in which vitamin B12-deficient patients who were receiving oral doses of folate experienced progression of neurological disorders. Data were not available on which to set a NOAEL. A LOAEL of 5 mg of folate is based on the data presented in Table 8-12:
-
at doses of folate of 5 mg/day and above, there were more than 100 reported cases of neurological progression;
-
at doses of less than 5 mg/day of folate (0.33 to 2.5 mg/day), there are only eight well-documented cases;
|
Folate Dose (mg/d) |
Adverse Effects Observed |
Methods for Assessing Associations and Adverse Effects |
|
4 |
None |
NRa |
|
1 |
None |
NR |
|
0.4–1b |
Pregnancy complications, fetal distressc |
Statistical association between 12 indices of nutrient status and 7 poorly defined categories of complications |
|
5 |
None |
NR |
|
4 |
None |
Medical exams performedb |
|
0.8 |
None |
NR |
|
1 |
Frequency of developmental anomalies not greater than expectede |
NR |
|
0.36 |
None |
NR |
|
0.8 |
13.4% fetal death rate in supplemented group compared with 11.5% fetal death rate on controlsf |
Documentation for all pregnancy outcomes was collected. Statistical evaluation based on two-tailed chi-square test. |
|
e The frequency of developmental anomalies was not greater than expected but parental reports of worries, fearfulness, and fussiness in the children were greater than expected. f This may be a chance finding resulting from multiple comparisons. It has been reported that prenatal multivitamin supplementation (which includes folic acid) can reduce preterm deliveries, causing an apparent increase in recognized abortions as the duration of all pregnancies increases (Scholl et al., 1997). |
||
-
in most cases throughout the dose range, folate supplementation maintained the patients in hematological remission over a considerable time span; and
-
the background intake of folate from food was not specified, but all except for three cases (those reported by Allen and coworkers [1990]) occurred before the fortification of breakfast cereal with added folate.
Uncertainty Assessment. An uncertainty factor (UF) of 5 was selected. Compared with the UFs used to date for other nutrients for
which there was also a lack of controlled, dose-response data, a UF of 5 is large. The selection of a relatively large UF is based primarily on the severity of the neurological complications observed but also on the use of a LOAEL rather than a NOAEL to derive the UL. The UF is not larger than 5 on the basis of the uncontrolled observation that millions of people have been exposed to self-treatment with about one-tenth of the LOAEL (i.e., 400 µg in vitamin pills) without reported harm.
Derivation of a UL. The LOAEL of 5 mg/day of folate was divided by a UF of 5 to obtain the UL for adults of 1 mg/day or 1,000 µg/ day of folate from supplements for fortified food. A UL of 1,000 µg/day is set for all adults rather than just for the elderly because of (1) the devastating and irreversible nature of the neurological consequences, (2) data suggesting that pernicious anemia may develop at a younger age in some racial or ethnic groups (Carmel and Johnson, 1978), and (3) uncertainty about the occurrence of vitamin B12 deficiency in younger age groups. In general, the prevalence of vitamin B12 deficiency in females in the childbearing years is very low and the consumption of supplemental folate at or above the UL in this subgroup is unlikely to produce adverse effects.
Folate UL Summary, Adults
|
UL for Adults |
|
|
19 years and older |
1,000 µg/day of folate from fortified food or supplements |
Other Life Stage Groups
There are no data on other life stage groups that can be used to identify a NOAEL or LOAEL and derive a UL. For infants the UL was judged not determinable because of a lack of data on adverse effects in this age group and concern about the infant’s ability to handle excess amounts. To prevent high levels of intake, the only source of intake for infants should be from food. No data were found to suggest that other life stage groups have increased susceptibility to adverse effects of high supplemental folate intake. Therefore, the UL of 1,000 µg/day is also set for adult pregnant and lactating women. The UL of 1,000 µg/day for adults was adjusted for children and adolescents on the basis of relative body weight as described in Chapter 3. Values have been rounded down.
|
ULs for Infants |
|
|
0–12 months |
Not possible to establish for supplemental folate |
|
ULs for Children |
|
|
1–3 years |
300 µg/day of folate from fortified foods or supplements |
|
4–8 years |
400 µg/day of folate from fortified foods or supplements |
|
9–13 years |
600 µg/day of folate from fortified foods or supplements |
|
14–18 years |
800 µg/day of folate from fortified foods or supplements |
|
ULs for Pregnancy |
|
|
14–18 years |
800 µg/day of folate from fortified foods or supplements |
|
19 years and older |
1,000 µg/day of folate from fortified foods or supplements |
|
ULs for Lactation |
|
|
14–18 years |
800 µg/day of folate from fortified foods or supplements |
|
19 years and older |
1,000 µg/day of folate from fortified foods or supplements |
Special Considerations
Individuals who are at risk of vitamin B12 deficiency (e.g., those who eat no animal foods [vegans] and other individuals identified in Table 9-4) may be at increased risk of the precipitation of neurological disorders if they consume excess folate.
Intake Assessment
It is not possible to use data from the Third National Health and Nutrition Examination Survey (NHANES III) or the Continuing Survey of Food Intakes by Individuals to determine the population’s exposure to folic acid. Currently, survey data do not distinguish between food folate and folic acid added as a fortificant or taken as a supplement. Based on data from NHANES III and excluding pregnant women (for whom folate supplements are often prescribed), the highest reported total folate intake from food and supplements
at the ninety-fifth percentile, 983 µg/day, was found in females aged 30 through 50 years. This intake was obtained from food (which probably included fortified ready-to-eat cereals, a few of which contain as much as 400 µg of folic acid per serving) and supplements. For the same group of women, the reported intake at the ninety-fifth percentile from food alone (which also probably included fortified ready-to-eat cereal) was 438 µg/day. In Canada, the contribution of ready-to-eat cereals is expected to be lower because the maximum amount of folic acid that can be added to breakfast cereal is 60 µg/100 g (Health Canada, 1996).
It would be possible to exceed the UL of 1,000 µg/day of folic acid through the ingestion of fortified foods, supplements, or both, as indicated by the information on the folate content of foods in Table 8-14.
Risk Characterization
The intake of folate is currently higher than indicated by NHANES III because enriched cereal grains in the U.S. food supply, to which no folate was added previously, are now fortified with folate at 140 µg/100 g of cereal grain. Using data from the 1987– 1988 U.S. Department of Agriculture’s Nationwide Food Consump-
TABLE 8-14 Folate Content of Selected Fortified Cereal-Grain Productsa and Commonly Used Folate-Containing Supplements
|
Food Product |
Serving Size |
Folic Acid Content per Serving (µg) |
|
Ready-to-eat cereal |
||
|
Highly fortified |
30 g |
400 |
|
Moderately fortified |
Variesb |
100 |
|
Noodles, pasta, rice (prepared) |
140 g (1 cup) |
60 |
|
Bread |
25 g (1 slice) |
20 |
|
Over-the-counter supplements |
1 unit |
400 |
|
a Other products containing grains (such as prepared macaroni and cheese, crackers, cookies, donuts, and hot cereal) may also be fortified with folate. See DHHS, 1993b. b Serving size ranges from 15 g for puffed cereals to 55 g for dense cereals (e.g., biscuit types); the volume of a serving would be approximately 1 cup to 1/2 cup, respectively. SOURCE: Data adapted from DHHS (1996). |
||
tion Survey, the U.S. Food and Drug Administration (FDA) estimated that the 95th percentile of folate intakes for males aged 11 to 18 years would be 950 µg of total folate at this level of fortification; this value assumes that these young males would also take supplements containing 400 µg of folate (DHHS, 1993a). Excluding pregnant women, for whom estimates were not provided, the 95th percentile for total folate for all other groups would be lower, and folic acid intake would be lower still. Using a different method of analysis, the FDA estimated that those who follow the guidance of the Food Guide Pyramid and consume cereal grains at the upper end of the recommended range would obtain an additional 440 µg of folate under the new U.S. fortification regulations (DHHS, 1993a). (This estimate assumes 8 servings [16 slices] of bread at 40 µg of folic acid per serving and approximately two 1-cup servings of noodles or pasta at 60 µg of folic acid per serving.) Those who eat other fortified foods (such as cookies, crackers, and donuts) instead of bread might ingest a comparable amount of folic acid. By either method of analysis and with the assumption of regular use of an over-the-counter supplement that contains folate (ordinarily 400 µg per dose), it is unlikely that intake of folate added to foods or as supplements would regularly exceed 1,000 µg for any of the life stage or gender groups.
RESEARCH RECOMMENDATIONS FOR FOLATE
High-Priority Recommendations
Priority should be given to four topics of research related to folate:
-
Determination of the mechanisms and magnitude of relationships of folate intake with risk reduction for the occurrence of neural tube defects (NTDs) and vascular disease and the influence of related factors, including genetic polymorphism, on these relationships. Targeted intervention programs need a clearer understanding of the mechanisms by which adequate folate intake ensures normal embryogenesis and may reduce vascular disease risk.
-
Estimation of folate requirements in high-risk groups for which data are limited and for which public health problems may result from deficiencies. These groups include children, adolescents, women of reproductive age (including pregnant women by trimester and lactating women), and the elderly. These studies should identify and use new folate status indicators that are linked to metabolic function and traditional indices of folate status.
-
Development of more precise and reproducible methods of analysis for the estimation of both blood and food folate and for the estimation of folate bioavailability. Improved methods would allow for comparison of status indicators among laboratories, revision of the food folate databases, and improved estimation of how dietary requirements are influenced by the food matrix and the source of folate (food or synthetic).
-
Identification and quantitation of adverse effects of high intakes. Further investigation is needed on the effect of increasing folate intake from supplements and fortified foods on the onset and progression of vitamin B12 deficiency.
Other Research Areas
Other areas of recommended research are as follows:
-
Determination of the mechanisms by which maternal folate sufficiency reduces the occurrence of NTDs in the infant, including the establishment of which genes are responsible for the heritability and folate-responsiveness of NTD.
-
Determination of the effect of folate fortification on folate intake and occurrence of NTD and vascular disease.
-
Determination of whether folate status affects the risk of birth defects other than NTDs and of chronic diseases other than vascular disease (e.g., cancer).
REFERENCES
Abma J, Chandra A, Mosher W, Peterson L, Piccinino L. 1997. Fertility, Family Planning, and Women’s Health: New Data from the 1995 National Survey of Family Growth. National Center for Health Statistics. Vital Health Stat Series 23, Number 19.
Abou-Saleh MT, Coppen A. 1989. Serum and red blood cell folate in depression. Acta Psychiatr Scand 80:78–82.
Adams MJ Jr, Khoury MJ, Scanlon KS, Stevenson RE, Knight GJ, Haddow JE, Sylvest er GC, Cheek JE, Henry JP, Stabler SP. 1995. Elevated midtrimester serum methylmalonic acid levels as a risk factor for neural tube defects. Teratology 51:311–317.
Agamanolis DP, Chester EM, Victor M, Kark JA, Hines JD, Harris JW. 1976. Neuropathology of experimental vitamin B12 deficiency. Neurology 26:905–914.
Allen RH, Stabler SP, Savage DG, Lindenbaum J. 1990. Diagnosis of cobalamin deficiency. I. Usefulness of serum methylmalonic acid and total homocysteine concentrations. Am J Hematol 34:90–98.
Allen RH, Stabler SP, Lindenbaum J. 1993. Serum betaine, N,N-dimethylglycine and N-methylglycine levels in patients with cobalamin and folate deficiency and related inborn errors of metabolism. Metabolism 42:1448–1460.
Alperin JB. 1966. Response to varied doses of folic acid and vitamin B12 megaloblastic anemia. Clin Res 14:52.
Alpert JE, Fava M. 1997. Nutrition and depression: The role of folate. Nutr Rev 55:145–149.
Andersson A, Hultberg B, Brattstrom L, Isaksson A. 1992. Decreased serum homocysteine in pregnancy. Eur J Clin Chem Clin Biochem 30:377–379.
Arnaud J, Favier A, Herrmann MA, Pilorget JJ. 1992. Effect of folic acid and folinic acid on zinc absorption. Ann Nutr Metab 36:157–161.
Asfour R, Wahbeh N, Waslien CI, Guindi S, Darby WJ. 1977. Folacin requirement of children. 3. Normal infants. Am J Clin Nutr 30:1098–1105.
Baggott JE, Morgan SL, Ha TS, Vaughn WH, Hine RJ. 1992. Inhibition of folate-dependent enzymes by non-steroidal anti-inflammatory drugs. Biochem J 282:197–202.
Bailey LB. 1988. Factors that affect folate bioavailability. Food Technol 42:206–212, 238.
Bailey LB, Gerda JJ, Bloch BS, Busby MJ, Vargas L, Chandler CJ, Halsted CH. 1984. Effect of age on poly- and monoglutamyl folacin absorption in human subjects. J Nutr 114:1770–1776.
Bailey LB, Barton LE, Hillier SE, Gerda JJ. 1988. Bioavailability of mono and polyglutamyl folate in human subjects. Nutr Rep Int 38:509–518.
Baird PA. 1983. Neural tube defects in the Sikhs. Am J Med Genet 16:49–56.
Baldwin CT, Hoth CF, Amos JA, da Silva EO, Milunsky A. 1992. An exonic mutation in the HuP2 paired domain gene causes Waardenburg’s syndrome. Nature 355:637–638.
Baldwin JN, Dalessio DJ. 1961. Folic acid therapy and spinal-cord degeneration in pernicious anemia. N Engl J Med 264:1339–1342.
Bates CJ, Fleming M, Paul AA, Black AE, Mandal AR. 1980. Folate status and its relation to vitamin C in healthy elderly men and women. Age Ageing 9:241– 248.
Bates CJ, Mansoor MA, van der Pols J, Prentice A, Cole TJ, Finch S. 1997. Plasma total homocysteine in a representative sample of 972 British men and women aged 65 and over. Eur J Clin Nutr 51:691–697.
Baxter MG, Millar AA, Webster RA. 1973. Some studies on the convulsant action of folic acid. Br J Pharmacol 48:350–351.
Bell KM, Plon L, Bunney WE, Potkin SG. 1988. S-Adenosylmethionine treatment of depression: A controlled clinical trial. Am J Psychiatry 145:1110–1114.
Beresford SA, Boushey CJ. 1997. Homocysteine, folic acid, and cardiovascular disease risk. In: Bendich A, Deckelbaum RJ, eds. Preventive Nutrition: The Comprehensive Guide for Health Professionals. Totowa, NJ: Humana Press.
Bergmark C, Mansoor MA, Swedenborg J, de Faire U, Svardal AM, Ueland PM. 1993. Hyperhomocysteinemia in patients operated for lower extremity ischeamia below the age of 50—effect of smoking and extent of disease. Eur J Vasc Surg 7:391–396.
Berk L, Bauer JL, Castle WB. 1948. A report of 12 patients treated with synthetic pteroylglutamic acid with comments on the pertinent literature. S Afr Med J 22:604–611.
Best CN. 1959. Subacute combined degeneration of spinal cord after extensive resection of ileum in Crohn’s disease: Report of a case. Br Med J 2:862–864.
Bethell FH, Sturgis CC. 1948. The relations of therapy in pernicious anemia to changes in the nervous system. Early and late results in a series of cases observed for periods of not less than ten years, and early results of treatment with folic acid. Blood 3:57–67.
Blaw ME, Woody RC. 1983. Valproic acid embryopathy? Neurology 33:255.
Blount BC, Mack MM, Wehr CM, MacGregor JT, Hiatt RA, Wang G, Wickramasinghe SN, Everson RB, Ames BN. 1997. Folate deficiency causes uracil misincorporation into human DNA and chromosome breakage: Implications for cancer and neuronal damage. Proc Natl Acad Sci USA 94:3290–3295.
Bonnette RE, Caudill MA, Bailey LB. 1998. Plasma homocysteine response to controlled folate intake in pregnant women. Obstet Gynecol 92:167–170.
Borman GB, Smith AH, Howard JK. 1986. Risk factors in the prevalence of anencephalus and spina bifida in New Zealand. Teratology 33:221–230.
Bottiglieri T, Hyland K, Reynolds EH. 1994. The clinical potential of ademetionine (S-adenosylmethionine) in neurological disorders. Drugs 48:137–152.
Botto LD, Khoury MJ, Mulinare J, Erickson JD. 1996. Periconceptional multivitamin use and the occurrence of conotruncal heart defects: Results from a population-based, case-control study. Pediatrics 98:911–917.
Boushey CJ, Beresford SA, Omenn GS, Motulsky AG. 1995. A quantitative assessment of plasma homocysteine as a risk factor for vascular disease. Probable benefits of increasing folic acid intakes. J Am Med Assoc 274:1049–1057.
Bower C, Stanley FJ. 1989. Dietary folate as a risk factor for neural-tube defects: Evidence from a case-control study in Western Australia. Med J Aust 150:613– 619.
Bower C, Stanley FJ. 1992a. Dietary folate and nonneural midline birth defects: No evidence of an association from a case-control study in Western Australia. Am J Med Genet 44:647–650.
Bower C, Stanley FJ. 1992b. Periconceptional vitamin supplementation and neural tube defects; evidence from a case-control study in Western Australia and a review of recent publications. J Epidemiol Community Health 46:157–161.
Bower C, Hobbs M, Carney A, Simpson D. 1984. Neural tube defects in Western Australia 1966–81 and a review of Australian data 1942–81. J Epidemiol Community Health 38:208–213.
Brattstrom LE, Herbebo JE, Hultberg BL. 1984. Moderate homocysteinemia—a possible risk factor for arteriosclerotic cerebrovascular disease. Stroke 15:1012– 1016.
Brattstrom LE, Israelsson B, Jeppsson JO, Hultberg BL. 1988. Folic acid—an innocuous means to reduce plasma homocysteine. Scand J Clin Lab Invest 48:215– 221.
Brattstrom LE, Israelsson B, Norrving B, Bergkvist D, Thorne J, Hultberg B, Hamfelt A. 1990. Impaired homocysteine metabolism in early-onset cerebral and peripheral occlusive arterial disease. Effects of pyridoxine and folic acid treatment. Atherosclerosis 81:51–60.
Brock KE, Berry G, Mock PA, MacLennan R, Truswell AS, Brinton LA. 1988. Nutrients in diet and plasma and risk of in situ cervical cancer. J Nail Cancer Inst 80:580–585.
Brown CM, Smith AM, Picciano MF. 1986. Forms of human milk folacin and variation patterns. J Pediatr Gastroenterol Nutr 5:278–282.
Brown JE, Jacobs DR, Hartman TJ, Barosso GM, Stang JS, Gross MD, Zeuske MA. 1997. Predictors of red cell folate level in women attempting pregnancy. J Am Med Assoc 277:548–552.
Bunduki V, Dommergues M, Zittoun J, Marquet J, Muller F, Dumez Y. 1995. Maternal-fetal folate status and neural tube defects: A case control study. Biol Neonate 67:154–159.
Burke G, Robinson K, Refsum H, Stuart B, Drumm J, Graham I. 1992. Intrauterine growth retardation, perinatal death, and maternal homocysteine levels. N Engl J Med 326:69–70.
Butterworth CE, Tamura T. 1989. Folic acid safety and toxicity: A brief review. Am J Clin Nutr 50:353–358.
Butterworth CE Jr, Hatch K, Gore H, Meuller H, Krumdieck C. 1982. Improvement in cervical dysplasia associated with folic acid therapy in users of oral contraceptives. Am J Clin Nutr 35:73–82.
Butterworth CE Jr, Hatch K, Cole P, Sauberlich HE, Tamura T, Cornwell PE, Soong S-J. 1988. Zinc concentration in plasma and erythrocytes of subjects receiving folic acid supplementation . Am J Clin Nutr 47:484–486.
Butterworth CE Jr, Hatch K, Macaluso M, Cole P, Sauberlich HE, Soong S-J, Borst M, Baker V. 1992a. Folate deficiency and cervical dysplasia. J Am Med Assoc 267:528–533.
Butterworth CE Jr, Hatch K, Soong S-J, Cole P, Tamura T, Sauberlich HE, Borst M, Macaluso M, Baker V. 1992b. Oral folic acid supplementation for cervical dysplasia: A clinical intervention trial. Am J Obstet Gynecol 166:803–809.
Campbell NR. 1996. How safe are folic acid supplements? Arch Intern Med 156:1638– 1644.
Carmel R, Johnson CS. 1978. Racial patterns in pernicious anemia: Early age at onset and increased frequency of intrinsic-factor antibody in black women. N Engl J Med 298:647–650.
Carney MW, Chary TK, Laundy M, Bottiglieri T, Chanarin I, Reynolds EH, Toone B. 1990. Red cell folate concentrations in psychiatric patients. J Affect Disord 19:207–213.
Carter CO. 1974. Clues to the aetiology of neural tube malformations. Dev Med Child Neurol 16:3–15.
Caudill MA, Cruz AC, Gregory JF 3rd, Hutson AD, Bailey LB. 1997. Folate status response to controlled folate intake in pregnant human subjects. J Nutr 127:2363–2370.
Caudill MA, Gregory JF, Hutson AD, Bailey LB. 1998. Folate catabolism in pregnant and nonpregnant women with controlled folate in takes. J Nutr 128:204– 208.
CDC (Centers for Disease Control and Prevention). 1991. Use of folic acid for prevention of spina bifida and other neural tube defects—1983–1991. Morb Mortal Wkly Rep 40:513–516.
CDC (Centers for Disease Control and Prevention). 1992. Recommendations for the use of folic acid to reduce the number of cases of spina bifida and other neural tube defects. Morb Mortal Wkly Rep 41:1–7.
CDC (Centers for Disease Control and Prevention). 1998. Use of folic acid-containing supplements among women of childbearing age—United States, 1997. Morb Mortal Wkly Rep 47:131–134.
Chadefaux B, Cooper BA, Gilfix BM, Lue-Shing H, Carson W, Gavsie A, Rosenblatt DS. 1994. Homocysteine: Relationship to serum cobalamin, serum folate, erythrocyte folate, and lobation of neutrophils. Clin Invest Med 17:540–550.
Chanarin I, Rothman D, Ward A, Perry J. 1968. Folate status and requirement in pregnancy. Br Med J 2:390–394.
Chanarin I, Deacon R, Lumb M, Perry J. 1989. Cobalamin-folate interrelations. Blood Rev 3:211–215.
Chasan-Taber L, Selhub J, Rosenberg IH, Malinow MR, Terry M, Tishler PV, Willett W, Hennekens CH, Stampfer MJ. 1996. A prospective study of folate and vitamin B6 and risk of myocardial infarction in U.S. physicians . J Am Coll Nutr 15:136–143.
Chen LH, Liu ML, Hwang HY, Chen LS, Korenberg J, Shane B. 1997. Human methionine synthase, cDNA cloning, gene localization, and expression. J Biol Chem 272:3628–3634.
Chodos RB, Ross JF. 1951. The effects of combined folic acid and liver extract therapy. Blood 6:1213–1233.
Collins CS, Bailey LB, Hillier S, Gerda JJ, Wilder BJ. 1988. Red blood cell uptake of supplemental folate in patients on anticonvulsant drug therapy. Am J Clin Nutr 48:1445–1450.
Colman N. 1982. Addition of folic acid to staple foods as a selective nutrition intervention strategy. Nutr Rev 40:225–233.
Colman N, Larsen JV, Barker M, Barker EA, Green R, Metz J. 1975. Prevention of folate deficiency by food fortification. 3. Effect in pregnant subjects of varying amounts of added folic acid. Am J Clin Nutr 28:465–470.
Conley CL, Krevans JR. 1951. Development of neurologic manifestations of pernicious anemia during multivitamin therapy. N Engl J Med 245:529–531.
Cooperman JM, Pesci-Bourel A, Luhby AL. 1970. Urinary excretion of folic acid activity in man. Clin Chem 16:375–381.
Copp AJ, Bernfield M. 1994. Etiology and pathogenesis of human neural tube defects: Insights from mouse models. Curr Opin Pediatr 6:624–631.
Coppen A, Abou-Saleh MT. 1982. Plasma folate and affective morbidity during long-term lithium therapy. Br J Psychiatr 141:87–89.
Coppen A, Chaudhry S, Swade C. 1986. Folic acid enhances lithium prophylaxis. J Affect Disord 10:9–13.
Cragan JD, Roberts HE, Edmonds LD, Khoury MJ, Kirby RS, Shaw GM, Velie EM, Merz RD, Forrester MB, Williamson RA. 1995. Surveillance for anencephaly and spina bifida and the impact of prenatal diagnosis—United States, 1985– 1994. CDC Surveill Summ 44:1–13.
Crosby WH. 1960. The danger of folic acid in multivitamin preparations. Mil Med 125:233–235.
Cunningham FG, MacDonald PC, Grant NF. 1989. Williams Obstetrics. Norwalk, Conn.: Appleton & Lange.
Curtis D, Sparrow R, Brennan L, Van der Weyden MB. 1994. Elevated serum homocysteine as a predictor for vitamin B12 or folate deficiency. Eur J Haematol 52:227–232.
Cuskelly GJ, McNulty H, Scott JM. 1996. Effect of increasing dietary folate on redcell folate: Implications for prevention of neural tube defects. Lancet 347:657– 659.
Czeizel A. 1993. Prevention of congenital abnormalties by periconceptional multivitamin supplementation. Br Med J 306:1645–1648.
Czeizel AE, Dudas I. 1992. Prevention of the first occurrence of neural-tube defects by periconceptional vitamin supplementation . N Engl J Med 327:1832–1835.
Czeizel AE, Dudas I, Metneki J. 1994. Pregnancy outcomes in a randomized controlled trial of periconceptional multivitamin supplementation. Final report. Arch Gynecol Obstet 255:131–139.
Czeizel AE, Toth M, Rockenbauer M. 1996. Population-based case contol study of folic acid supplementation during pregnancy. Teratology 53:345–351.
Dai WS, Hsu M-A, Itri LM. 1989. Safety of pregnancy after discontinuation of isotretinoin. Arch Dermatol 125:362–365.
Dalery K, Lussier-Cacan S, Selhub J, Davignon J, Latour Y, Genest J. 1995. Homocysteine and coronary artery disease in French Canadian subjects: Relation with vitamins B12, B6, pyridoxal phosphate, and folate. Am J Cardiol 75:1107– 1111.
Daly LE, Kirke PN, Molloy A, Weir DG, Scott JM. 1995. Folate levels and neural tube defects. Implications for prevention . J Am Med Assoc 274:1698–1702.
Daly S, Mills JL, Molloy AM, Conley M, Lee YJ, Kirke PN, Weir DG, Scott JM. 1997. Minimum effective dose of folic acid for food fortification to prevent neural tube defects. Lancet 350:1666–1669.
Dawson DW. 1966. Microdoses of folic acid in pregnancy. J Obstet Gynaecol Br Commonw 73:44–48.
DeSouza S, Eitenmiller R. 1990. Effects of different enzyme treatments on extraction of total folate from various foods prior to microbiological assasy and radioassay. J Micronutr Anal 7:37–57.
deFranchis R, Mancini FP, D’Angelo A, Sebastio G, Fermo I, DeStefano V, Margaglione M, Mazzola G, DiMinno G, Andria G. 1996. Elevated total plasma homocysteine and 677C→T mutation of the 5,10-methylenetetrahydrofolate reductase gene in thrombotic vascular disease. Am J Hum Genet 59:262–264.
De Wals P, Trochet C, Pinsonneault L. 1999. Prevalence of neural tube defects in the province of Quebec, 1992. Can J Public Health 90:237–239.
DHHS (U.S. Department of Health and Human Services). 1993a. Food and Drug Administration. Folic acid; proposed rules. Fed Regist 21:53293–53294.
DHHS (U.S. Department of Health and Human Services). 1993b. Food and Drug Administration. Food standards: Amendment of the standards of identity for enriched grain products to require the addition of folic acid. Fed Regist 58:53305.
DHHS (U.S. Department of Health and Human Services). 1996. Food and Drug Administration. Food standards: Amendment of the standards of identity for enriched grain products to require addition of folic acid. Fed Regist 61:8781– 8807.
Dolk H, De Wals P, Gillerot Y, Lechat MF, Ayme S, Cornel M, Cuschieri A, Garne E, Goujard J, Laurence KM. 1991. Heterogeniety of neural tube defects in Europe: The significance of site of defect and presence of other major anomalies in relation to geographic differences in prevalence. Teratology 44:547– 559.
Economides DL, Ferguson J, Mackenzie IZ, Darley J, Ware II, Holmes-Siedle M. 1992. Folate and vitamin B12 concentrations in maternal and fetal blood, and amniotic fluid in second trimester pregnancies complicated by neural tube defects. Br J Obstet Gynaecol 99:23–25.
Eichner ER, Hillman RS. 1971. The evolution of anemia in alcoholic patients. Am J Med 50:218–232.
Eichner ER, Hillman RS. 1973. Effect of alcohol on serum folate level. J Clin Invest 52:584–591.
Eichner ER, Pierce HI, Hillman RS. 1971. Folate balance in dietary-induced megaloblastic anemia. N Engl J Med 284:933–938.
Eichner ER, Loewenstein JE, McDonald CR, Dickson VL. 1979. Effect of common drugs on serum level and binding of folate in man. In: Kisliuk RL, Brown GM, eds. Chemistry and Biology of Pteridines. New York: Elsevier North Holland. Pp. 537–542.
Ek J. 1980. Plasma and red cell folate values in newborn infants and their mothers in relation to gestational age. J Pediatr 97:288–292.
Ek J, Magnus EM. 1979. Plasma and red blood cell folate in breastfed infants. Acta Paediatr Scand 68:239–243.
Ek J, Magnus E. 1982. Plasma and red cell folate values and folate requirements in formula-fed term infants. J Pediatr 100:738–744.
Ellison ABC. 1960. Pernicious anemia masked by multivitamins containing folic acid. J Am Med Assoc 173:240–243.
Elsborg L. 1974. Inhibition of intestinal absorption of folate by phenytion. Acta Haematol 52:24–28.
Elwood JM, Elwood JH. 1980. Epidemiology of Anencephalus and Spina Bifida. Oxford: Oxford University Press.
Emery AE. 1986. Methodology in Medical Genetics: An Introduction to Statistical Methods. 2nd ed. Edinburgh: Churchill Livingstone.
Essien FB. 1992. Maternal methionine supplementation promotes the remediation of axial defects in Axd mouse neural tube mutants. Teratology 45:205–212.
Evans RW, Shaten BJ, Hempel JD, Cutler JA, Kuller LH. 1997. Homocyst(e)ine and risk of cardiovascular disease in the Multiple Risk Factor Intervention Trial. Arterioscler Thromb Vasc Biol 17:1947–1953.
Fava M, Borus JS, Alpert JE, Nierenberg AA, Rosenbaum JF, Bottiglieri T. 1997. Folate, vitamin B12, and homocysteine in major depressive disorder. Am J Psychiatry 154:426–428.
Felson DT, Anderson JJ, Meenan RF. 1990. The comparative efficacy and toxicity of second-line drugs in rheumatoid arthritis. Results of two metaanalyses. Arthritis Rheum 33:1449–1461.
Fowler WM, Hendricks AB. 1949. Folic acid and the neurologic manifestations of pernicious anemia. Am Pract 3:609–613.
Frosst P, Blom HJ, Milos R, Goyette P, Sheppard CA, Matthews RG, Boers GJ, den Heijer M, Kluijtmans LA, van den Heuvel LP, Rozen R. 1995. A candidate genetic risk factor for vascular disease: A common mutation in methylenetetrahydrofolate reductase. Nat Genet 10:111–113.
Gailani SD, Carey RW, Holland JF, O’Malley JA. 1970. Studies of folate deficiency in patients with neoplastic diseases. Cancer Res 30:327–333.
Gallagher PM, Meleady R, Shields DC, Tan KS, McMaster D, Rozen R, Evans A, Graham IM, Whitehead AS. 1996. Homocysteine and risk of premature coronary heart disease. Evidence for a common gene mutation. Circulation 94:2154– 2158.
Garry PJ, Goodwin JS, Hunt WC, Hooper EM, Leonard AG. 1982. Nutritional status in a healthy elderly population: Dietary and supplemental intakes. Am J Clin Nutr 36:319–331.
Garry PJ, Goodwin JS, Hunt WC. 1984. Folate and vitamin B12 status in a healthy elderly population. J Am Geriatr Soc 32:719–726.
Gartler SM, Hornug SK, Motulsky AG. 1981. Effect of chronologic age on induction of cystathionine synthase, uroporphyrinogen I synthase, and glucose 6-phosphate dehydrogenase activities in lymphocytes. Proc Natl Acad Sci USA 78:1916–1919.
Gibberd FB, Nicholls A, Dunne JF, Chaput de Saintonge DM. 1970. Toxicity of folic acid. Lancet 1:360–361.
Giles WH, Kittner SJ, Anda RF, Croft JB, Casper ML. 1995. Serum folate and risk for ischemic stroke. First National Health and Nutrition Examination Survey epidemiology follow-up study. Stroke 26:1166–1170.
Giovannucci E, Stampfer MJ, Colditz GA, Rimm EB, Trichopolous D, Rosner BA, Speizer FE, Willett WC. 1993. Folate, methionine, and alcohol intake and risk of colorectal adenoma. J Natl Cancer Inst 85:875–884.
Giovannucci E, Rimm EB, Ascherio A, Stampfer MJ, Colditz GA, Willett WC. 1995. Alcohol, low-methionine-low folate diets and risk of colon cancer in men. J Natl Cancer Inst 87:265–273.
Glynn SA, Albanes D, Pietinen P, Brown CC, Rautalahti M, Tangrea JA, Gunter EW. 1996. Colorectal cancer and folate status: A nested case control study among male smokers. Cancer Epidemiol Biomarkers Prev 5:487–494.
Goddijn-Wessel TA, Wouters MG, van de Molen EF, Spuijbroek MD, Steegers-The-unissen RP, Blom HJ, Boers GH, Eskes TK. 1996. Hyperhomocysteinemia: A risk factor for placental abruption or infarction. Eur J Obstet Gynecol Reprod Biol 66:23–29.
Godfrey PS, Toone BK, Carney MW, Flynn TG, Bottiglieri T, Laundy M, Chanarin I, Reynolds EH. 1990. Enhancement of recovery from psychiatric illness by methylfolate. Lancet 336:392–395.
Gomez MR. 1981. Possible teratogenicity of valproic acid. J Pediatr 98:508–509.
Goodwin JS, Goodwin JM, Garry PJ. 1983. Association between nutritional status and cognitive functioning in a healthy elderly population. J Am Med Assoc 249:2917–2921.
Gotz VP, Lauper RD. 1980. Folic acid hypersensitivity or tartrazine allergy? Am J Hosp Pharm 37:1470–1474.
Grace E, Emans SJ, Drum DE. 1982. Hematologic abnormalities in adolescents who take oral contraceptive pills. J Pediatr 101:771–774.
Graham IM, Daly LE, Refsum HM, Robinson K, Brattstrom LE, Ueland PM, Palma-Reis RJ, Boers GH, Sheahan RG, Israelsson B, Uiterwaal CS, Meleady R, McMaster D, Verhoef P, Witteman J, Rubba P, Bellet H, Wautrecht JC, de Valk HW, Sales Luis AC, Parrot-Rouland FM, Tan KS, Higgins I, Garcon D, Andria G. 1997. Plasma homocysteine as a risk factor for vascular disease. The European Concerted Action Project. J Am Med Assoc 277:1775–1781.
Gregory JF 3rd. 1989. Chemical and nutritional aspects of folate research: Analytical procedures, methods of folate synthesis, stability and bioavailability of dietary folates. Adv Food Nutr Res 33:1–101.
Gregory JF 3rd. 1995. The bioavailability of folate. In: Bailey LB, ed. Folate in Health and Disease. New York: Marcel Dekker. Pp. 195–235.
Gregory JF 3rd. 1997. Bioavailability of folate. Eur J Clin Nutr 51:S54-S59.
Gregory JF 3rd, Engelhardt R, Bhandari SD, Sartain DB, Gustafson SK. 1990. Adequacy of extraction techniques for determination of folate in foods and other biological materials. J Food Comp Anal 3:134–144.
Gunter EW, Bowman BA, Caudill SP, Twite DB, Adams MJ, Sampson EJ. 1996. Results of an international round robin for serum and whole-blood folate. Clin Chem 42:1689–1694.
Hall BE, Watkins CH. 1947. Experience with pteroylglutamic (synthetic folic acid) in the treatment of pernicious anemia. J Lab Clin Med 32:622–634.
Halsted CH, Griggs RC, Harris JW. 1967. The effect of alcoholism on the absorption of folic acid (H3-PGA) evaluated by plasma levels and urine excretion. J Lab Clin Med 69:116–131.
Halsted CH, Robles EA, Mezey E. 1971. Decreased jejunal uptake of labeled folic acid (H3-PGA) in alcoholic patients: Roles of alcohol and malnutrition. N Engl J Med 285:701–706.
Halsted CH, Robles EA, Mezey E. 1973. Intestinal malabsorption in folate-deficient alcoholics. Gastroenterology 64:526-532.
Halsted CH, Gandhi G, Tamura T. 1981. Sulfasalazine inhibits the absorption of folates in ulcerative colitis. N Engl J Med 305:1513-1517.
Hambidge M, Hackshaw A, Wald N. 1993. Neural tube defects and serum zinc. Br J Obstet Gynecol 100:746-749.
Hamon CG, Blair JA, Barford PA. 1986. The effect of tetrahydrofolate on tetrahydrobiopterin metabolism. J Ment Defic Res 30:179-183.
Hansen H, Rybo G. 1967. Folic acid dosage in profylactic treatment during pregnancy. Acta Obstet Gynecol Scand 46:107-112.
Hansen HA, Weinfeld A. 1962. Metabolic effects and diagnostic value of small doses of folic acid and B12 megaloblastic anemias. Acta Med Scand 172:427– 443.
Happle R, Traupe H, Bounameaux Y, Fisch T. 1984. Teratogenic effects of etretinate in humans. Dtsch Med Wochenschr 109:1476-1480.
Harpel PC, Zhang X, Borth W. 1996. Homocysteine and hemostasis: Pathogenic mechanisms predisposing to thrombosis. J Nutr 126:12855-12895.
Haworth JC, Dilling LA, Surtees RA, Seargeant LE, Lue-Shing H, Cooper BA, Rosenblatt DS. 1993. Symptomatic and asymptomatic methylenetetrahydrofolate reductase deficiency in two adult brothers. Am J Med Genet 45:572-576.
Hayes C, Werler MM, Willett WC, Mitchell AA. 1996. Case-control study of periconceptional folic acid supplementation and oral clefts. Am J Epidemiol 143:1229– 1234.
Health Canada. 1996. Departmental Consolidation of the Food and Drugs Act and the Food and Drug Regulations with Amendments to December 19, 1996. Ottawa: Canada Communications Group.
Health Canada. 1997. Regulations amending the Food and Drug Regulations (1066). Canada Gazette, Part I, November 29. Pp. 3702-3705.
Heimburger DC, Krumdieck CL, Alexander CB, Birch R, Dill SR, Bailey WC. 1987. Localized folic acid deficiency and bronchial metaplasia in smokers: Hypothesis and preliminary report. Nutr Int 3:54-60.
Heimburger DC, Alexander CB, Birch R, Butterworth CE, Bailey WC, Krumdieck CL. 1988. Improvement in bronchial squamous metaplasia in smokers treated with folate and vitamin B12. Report of a preliminary randomized, double-blind intervention trial. J Am Med Assoc 259:1525-1530.
Heinle RW, Welch AD. 1947. Folic acid in pernicious anemia: Failure to prevent neurologic relapse. J Am Med Assoc 133:739-741.
Heinle RW, Dingle JT, Weisberger AS. 1947. Folic acid in the maintenance of pernicious anemia. J Lab Clin Med 32:970-981.
Hellstrom L. 1971. Lack of toxicity of folic acid given in pharmacological doses to healthy volunteers. Lancet 1:59-61.
Herbert V. 1962a. Experimental nutritional folate deficiency in man. Trans Assoc Am Physicians 75:307-320.
Herbert V. 1962b. Minimal daily adult folate requirement. Arch Intern Med 110:649– 652.
Herbert V. 1963. Current concepts in therapy: Megaloblastic anemia. N Engl J Med 268:201-203, 368-371.
Herbert V. 1968. Nutritional requirements for vitamin B12 and folic acid. Am J Clin Nutr 21:743-752.
Herbert V. 1987. Making sense of laboratory tests of folate status: Folate requirements to sustain normality. Am J Hem 26:199-207.
Herbert V, Das KC. 1993. Folic acid and vitamin B12. In: Shils ME, Olson JA, Shike M, eds. Modern Nutrition in Health and Disease, 8th ed. Philadelphia: Lea & Febiger. Pp. 402–425.
Herbert V, Zalusky R, Davidson CS. 1963. Correlates of folate deficiency with alcoholism and associated macrocytosis, anemia, and liver disease. Ann Intern Med 58:977–988.
Hibbard BM. 1964. The role of folic acid in pregnancy. J Obstet Gynaecol Br Commonw 71:529–542.
Hill RM. 1984. Isotretinoin teratogenicity. Lancet 1:1465.
Hirata F, Axelrod J. 1980. Phospholipid methylation and biological signal transmission. Science 209:1082–1090.
Hobbins JC. 1991. Diagnosis and management of neural tube defects today. N Engl J Med 324:690–691.
Hoffbrand AV, Newcombe BF, Mollin DL. 1966. Method of assay of red cell folate activity and the value of the assay as a test for folate deficiency. J Clin Pathol 19:17–28.
Holmes-Siedle M, Lindenbaum RH, Galliard A. 1992. Recurrence of neural tube defect in a group of at risk women: A 10 year study of Pregnavite Forte F. J Med Genet 29:134–135.
Hommes OR, Obbens EA. 1972. The epileptogenic action of Na-folate in the rat. J Neurol Sci 16:271–281.
Hook EB, Czeizel AE. 1997. Can terathanasia explain the protective effect of folic-acid supplementation on birth defects? Lancet 350:513–515.
Hoppner K, Lampi B. 1980. Folate levels in human liver from autopsies in Canada. Am J Clin Nutr 33:862–864.
Houghton LA, Green TJ, Donovan UM, Gibson RS, Stephen AM, O’Connor DL. 1997. Association between dietary fiber intake and the folate status of a group of female adolescents. Am J Clin Nutr 66:1414–1421.
Hultberg B, Andersson A, Sterner G. 1993. Plasma homocysteine in renal failure. Clin Nephrol 40:230–235.
Hunter R, Barnes J, Oakeley HF, Matthews DM. 1970. Toxicity of folic acid given in pharmacological doses to healthy volunteers. Lancet 1:61–3.
Israels MC, Wilkinson JF. 1949. Risk of neurological complications in pernicious anemia treated with folic acid. Br Med J 2:1072–1075.
Jackson RC. 1984. Biological effects of folic acid antagonists with antineoplastic activity. Pharmacol Ther 25:61–82.
Jacob RA, Wu M-M, Henning SM, Swendseid ME. 1994. Homocysteine increases as folate decreases in plasma of healthy men during short-term dietary folate and methyl group restriction. J Nutr 124:1072–1080.
Jacob RA, Gretz DM, Taylor PC, James SJ, Pogribny IP, Miller BJ, Henning SM, Swendseid ME. 1998. Moderate folate depletion increases plasma homocysteine and decreases lymphocyte DNA methylation in postmenopausal women. J Nutr 128:1204–1212.
Jacobsen DW, Gatautis VJ, Green R, Robinson K, Savon SR, Secic M, Ji J, Otto JM, Taylor LM. 1994. Rapid HPLC determination of total homocysteine and other thiols in serum and plasma: Sex differences and correlation with cobalamin and folate concentrations in healthy subjects. Clin Chem 40:873–881.
Jacobson SD, Berman L, Axelrod AR, Vonder Heide EC. 1948. Folic acid therapy: Its effect as observed in two patients with pernicious anemia and neurologic symptoms. J Am Med Assoc 137:825–827.
Jacques PF, Sulsky SI, Sadowski JA, Phillips JC, Rush D, Willett WC. 1993. Comparison of micronutrient intake measured by a dietary questionnaire and biochemical indicators of micronutrient status. Am J Clin Nutr 57:182–189.
Jacques PF, Bostom AG, Williams RR, Ellison RC, Eckfeldt JH, Rosenberg IH, Selhub J, Rozen R. 1996. Relation between folate status, a common mutation in methylenetetrahydrofolate reductase, and plasma homocysteine concentrations. Circulation 93:7–9.
Jägerstad M. 1977. Folate intake and blood folate in elderly subjects, a study using the double sampling portion technique. Nutr Metab 21:29–31.
Jägerstad M, Westesson A-K. 1979. Folate. Scand J Gastroenterol 14:196–202.
Joyal CC, Lalonde R, Vikis-Freibergs V, Botez MI. 1993. Are age-related behavioral disorders improved by folate administration? Exp Aging Res 19:367–376.
Kang SS, Wong PW, Norusis M. 1987. Homocysteinemia due to folate deficiency. Metabolism 36:458–462.
Kang SS, Wong PW, Bock HG, Horwitz A, Grix A. 1991a. Intermediate hyperhomocysteinemia resulting from compound heterozygosity of methylenetetrahydrofolate reductase mutations. Am J Hum Genet 48:546–551.
Kang SS, Wong PW, Susmano A, Sora J, Norusis M, Ruggie N. 1991b. Thermolabile methylenetetrahydrofolate reductase: An inherited risk factor for coronary artery disease. Am J Hum Genet 48:536–545.
Keagy PM, Oace SM. 1989. Rat bioassay of wheat bran folate and effects of intestinal bacteria. J Nutr 119:1932–1939.
Keagy PM, Shane B, Oace SM. 1988. Folate bioavailability in humans: Effects of wheat bran and beans. Am J Clin Nutr 47:80–88.
Keating JN, Wada L, Stokstad EL, King JC. 1987. Folic acid: Effect of zinc absorption in humans and in the rat. Am J Clin Nutr 46:835–839.
Kehl SJ, McLennan H, Collingridge GL. 1984. Effects of folic and kainic acids on synaptic responses of hippocampal neurones. Neuroscience 11:111–124.
Keizer SE, Gibson RS, O’Connor DL. 1995. Postpartum folic acid supplementation of adolescents: Impact on maternal folate and zinc status and milk composition. Am J Clin Nutr 62:377–384.
Khoury MJ, Erickson JD, James LM. 1982. Etiologic heterogeneity of neural tube defects: Clues from epidemiology. Am J Epidemiol 115:538–548.
Kim Y-I, Pogribny IP, Basnakian AG, Miller JW, Selhub J, James SJ, Mason JB. 1997. Folate deficiency in rats induces DNA strand breaks and hypomethylation with the p53 tumor suppressor gene. Am J Clin Nutr 65:46–52.
Kirke PN, Daly LE, Elwood JH. 1992. A randomized trial of low-dose folic acid to prevent neural tube defects. Arch Dis Child 67:1442–1446.
Kirke PN, Molloy AM, Daly LE, Burke H, Weir DG, Scott JM. 1993. Maternal plasma folate and vitamin B12 are independent risk factors for neural tube defects. Q J Med 86:703–708.
Klipstein FA. 1964. Subnormal serum folate and macrocytosis associated with anti-convulsant drug therapy. Blood 23:68–86.
Kluijtmans LA, van den Heuvel LP, Boers GH, Frosst P, Stevens EM, van Oost BA, den Heijer M, Trijbels FJ, Rozen R, Blom HJ. 1996. Molecular genetic analysis in mild hyperhomocysteinemia: A common mutation in the methylenetetrahydrofolate reductase gene is a genetic risk factor for cardiovascular disease. Am J Hum Genet 58:35–41.
Koehler KM, Romero LJ, Stauber PM, Pareo-Tubbeh SL, Liang HC, Baumgartner RN, Carry PJ, Allen RH, Stabler SP. 1996. Vitamin supplementation and other variables affecting serum homocysteine and methylmalonic acid concentrations in elderly men and women. J Am Coll Nutr 15:364–376.
Krause LJ, Forsberg CW, O’Connor DL. 1996. Feeding human milk to rats increases bifidobacterium in the cecum and colon which correlates with enhanced folate status. J Nutr 126:1505–1511.
Krumdieck CL, Fukushima K, Fukushima T, Shiota T, Butterworth CE Jr. 1978. A long-term study of the excretion of folate and pterins in a human subject after ingestion of 14C folic acid, with observations on the effect of diphenylhydantoin administration. Am J Clin Nutr 31:88–93.
Landgren F, Israelsson B, Lindgren A, Hultberg B, Andersson A, Brattstrom L. 1995. Plasma homocysteine in acute myocardial infarction: Homocysteine-lowering effect of folic acid. J Intern Med 237:381–388.
Landon MJ, Oxley A. 1971. Relation between maternal and infant blood folate activities. Arch Dis Child 46:810–814.
Lashner BA. 1993. Red blood cell folate is associated with the development of dysplasia and cancer in ulcerative colitis. J Cancer Res Clin Oncol 119:549–554.
Lashner BA, Heidenreich PA, Su GL, Kane SV, Hanauer SB. 1989. The effect of folate supplementation on the incidence of dysplasia and cancer in chronic ulcerative colitis. A case-control study. Gastroenterology 97:255–259.
Laurence KM. 1990. The genetics and prevention of neural tube defects and “uncomplicated” hydrocephalus. In: Emery AE, Rimoin DL, eds. Principles and Practice of Medical Genetics, 2nd ed., Vol. 1. Edinburgh: Churchill Livingstone. Pp. 323–346.
Laurence KM, James N, Miller MH, Tennant GB, Campbell H. 1981. Double-blind randomized controlled trial of folate treatment before conception to prevent recurrence of neural tube defects. Br Med J 282:1509–1511.
Lawrence VA, Loewenstein JE, Eichner ER. 1984. Aspirin and folate binding: In vivo and in vitro studies of serum binding and urinary excretion of endogenous folate. J Lab Clin Med 103:944–948.
Lewis CA, Pancharuniti N, Sauberlich HE. 1992. Plasma folate adequacy as determined by homocysteine level. Ann NY Acad Sci 669:360–362.
Li YN, Gulati S, Baker PJ, Brody LC, Banerjee R, Kruger WD. 1996. Cloning, mapping and RNA analysis of the human methionine synthase gene. Hum Mol Genet 5:1851–1858.
Lim HS, Mackey AD, Tamura T, Picciano MF. 1997. Measurable folates in human milk are increased by treatment with α-amylase and protease. FASEB J 11:A395.
Lindenbaum J, Healton EB, Savage DG, Brust JC, Garrett TJ, Podell ER, Marcell PD, Stabler SP, Allen RH. 1988. Neuropsychiatric disorders caused by cobalamin deficiency in the absence of anemia or macrocytosis. N Engl J Med 318:1720–1728.
Lindseth RE. 1996. Myelomeningocele. In: Morrissy RT, Weinstein SL, eds. Lovell and Winter’s Pediatric Orthopaedics, 4th ed., Vol. 1. Philadelphia: Lippincott-Raven. Pp. 503–505.
Loots JM, Kramer S, Brennan MJW. 1982. The effect of folates on the reflex activity in the isolated hemisected frog spinal cord. J Neural Transm 54:239–249.
Lowenstein L, Candie G, Ramos O, Brunton L. 1966. The incidence and prevention of folate deficiency in a pregnant clinic population. Can Med Assoc J 95:797–806.
LSRO/FASEB (Life Sciences Research Office/Federation of American Societies for Experimental Biology). 1984. Assessment of the Folate Nutritional Status of the U.S. Population Based on Data Collected in the Second National Health and Nutrition Examination Survey, 1976–1980. Senti FR, Pilch SM, eds. Bethesda, MD: LSRO/ FASEB.
LSRO/FASEB (Life Sciences Research Office/Federation of American Societies for Experimental Biology). 1994. Assessment of the Folate Methodology Used in the Third National Health and Nutrition Examination Survey (NHANES III, 1988– 1994). Raiten DJ, Fisher KD, eds. Bethesda, MD: LSRO/FASEB.
LSRO/FASEB (Life Sciences Research Office/Federation of American Societies for Experimental Biology). 1995. Third Report on Nutrition Monitoring in the United States. Washington DC: U.S. Government Printing Office.
Ma J, Stampfer MJ, Hennekens CH, Frosst P, Selhub J, Horsford J, Malinow MR, Willett WC, Rozen R. 1996. Methylenetetrahydrofolate reductase polymorphism, plasma folate, homocysteine, and risk of myocardial infarction in U.S. physicians. Circulation 94:2410–2416.
Ma J, Stampfer MJ, Giovannucci E, Artigas C, Hunter DJ, Fuchs C, Willett WC, Selhub J, Hennekens CH, Rozen R. 1997. Methylenetetrahydrofolate reductase polymorphism, dietary interactions, and risk of colorectal cancer. Cancer Res 57:1098–1102.
Mackey AD, Lim HS, Picciano MF, Smiciklas-Wright H. 1997. Biochemical indices of folate adequacy diminish in women during lactation. FASEB J 11:A179.
Malinow MR, Nieto FJ, Kruger WD, Duell PB, Hess DL, Gluckmann RA, Block PC, Holzgang CR, Anderson PH, Seltzer D, Upson B, Lin QR. 1997. The effects of folic acid supplementation on plasma total homocysteine are modulated by multivitamin use and methylenetetrahydrofolate reductase genotypes. Arterioscler Thromb Vasc Biol 17:1157–1162.
Malpas JS, Spray GH, Witts LJ. 1966. Serum folic acid and vitamin B12 levels in anticonvulsant therapy. Br Med J 1:955–957.
Marshall RA, Jandl JH. 1960. Response to “physiologic” doses of folic acid on megaloblastic anemia. AMA Arch Intern Med 105:352–360.
Martin JI, Landen WO, Soliman A-G, Eitenmiller RR. 1990. Application of a trienzyme extraction for total folate determination in foods. J Assoc Offic Anal Chem 73:805–808.
Mason JB. 1995. Folate status: Effects on carcinogenesis. In: Bailey LB, ed. Folate in Health and Disease. New York: Marcel Dekker. Pp. 361–378.
Mason JB, Levesque T. 1996. Folate: Effects on carcinogenesis and the potential for cancer chemoprevention. Oncology 10:1727–1736.
Mathur BP. 1966. Sensitivity of folic acid: A case report. Indian J Med Sci 20:133– 134.
Mayer EL, Jacobsen DW, Robinson K. 1996. Homocysteine and coronary atherosclerosis. J Am Coll Cardiol 27:517–527.
McMartin KE, Collins TD, Shiao CQ, Vidrine L, Redetzki HM. 1986. Study of dose-dependence and urinary folate excretion produced by ethanol in humans and rats. Alcohol Clin Exp Res 10:419–424.
McPartlin J, Halligan A, Scott JM, Darling M, Weir DG. 1993. Accelerated folate breakdown in pregnancy. Lancet 341:148–149.
Meenan J, O’Hallinan E, Lynch S, Molloy A, McPartlan J, Scott J, Weir DG. 1996. Folate status of gastrointestinal epithelial cells is not predicted by serum and red cell folate values in replete subjects. Gut 38:410–413.
Meenan J, O’Hallinan E, Scott J, Weir DG. 1997. Epithelial cell folate depletion occurs in neoplastic but not adjacent normal colon mucosa. Gastroenterology 112:1163–1168.
Metz J. 1970. Folate deficiency conditioned by lactation. Am J Clin Nutr 23:843–847.
Metz J, van der Westhuyzen J. 1987. The fruit bat as an experimental model of the neuropathy of cobalamin deficiency. Comp Biochem Physiol 88A:171–177.
Mills JL, Conley MR. 1996. Folic acid to prevent neural tube defects: Scientific advances and public health issues. Curr Opin Obstet Gynecol 8:394–397.
Mills JL, Rhoads GG, Simpson JL, Cunningham GC, Conley MR, Lassman MR, Walden ME, Depp DR, Hoffman HJ. 1989. The absence of a relation between the periconceptional use of vitamins and neural tube defects. National Institute of Child Health and Human Development Neural Tube Defects Study Group. N Engl J Med 321:430–435.
Mills JL, McPartiin JM, Kirke PN, Lee YJ, Conley MR, Weir DG, Scott JM. 1995. Homocysteine metabolism in pregnancies complicated by neural-tube defects. Lancet 345:149–151.
Milne DB, Johnson LK, Mahalko JR, Sandstead HH. 1983. Folate status of adult males living in a metabolic unit: Possible relationships with iron nutriture. Am J Clin Nutr 37:768–773.
Milne DB, Canfield WK, Mahalko JR, Sandstead HH. 1984. Effect of oral folic acid supplements on zinc, copper, and iron absorption and excretion. Am J Clin Nutr 39:535–539.
Milunsky A, Jick H, Jick SS, Bruell CL, MacLaughlin DS, Rothman KJ, Willett W. 1989. Multivitamin/folic acid supplementation in early pregnancy reduces the prevalence of neural tube defects. J Am Med Assoc 262:2847–2852.
Mitchell DC, Vilter RW, Vilter CF. 1949. Hypersensivity to folic acid. Ann Intern Med 31:1102–1105.
Mitchell LE, Duffy DL, Duffy P, Bellingham G, Martin NG. 1997. Genetic effects on variation in red-blood-cell folate in adults: Implications for the familial aggregation of neural tube defects. Am J Hum Genet 60:433–438.
Molgaard J, Malinow MR, Lassvik C, Holm A-C, Upson B, Olsson AG. 1992. Hyperhomocyst(e)inaemia: An independent risk factor for intermittent claudication. J Intern Med 231:273–279.
Molloy AM, Daly S, Mills JL, Kirke PN, Whitehead AS, Ramsbottom D, Conley MR, Weir DG, Scott JM. 1997. Thermolabile variant of 5,10-methylenetetrahydrofolate reductase associated with low red-cell folates: Implications for folate intake recommendations. Lancet 349:1591–1593.
Moore CA, Li S, Li Z, Hong SX, Gu HQ, Berry RJ, Mulinare J, Erickson JD. 1997. Elevated rates of severe neural tube defects in a high-prevalence area in northern China. Am J Med Genet 73:113–118.
Morgan SL, Baggott JE. 1995. Folate antagonists in nonneoplastic disease: Proposed mechanisms of efficacy and toxicity. In: Bailey LB, ed. Folate in Health and Disease. New York: Marcel Dekker. Pp. 405–433.
Morgan SL, Baggott JE, Altz-Smith M. 1987. Folate status of rheumatoid arthritis patients receiving long term, low-dose methotrexate therapy. Arthritis Rheum 30:1348–1356.
Morgan SL, Baggott JE, Vaughn WH, Austin JS, Veitch TA, Lee JY, Koopman WJ, Krumdieck CL, Alarcon GS. 1994. Supplementation with folic acid during methotrexate therapy for rheumatoid arthritis. A double-blind, placebocontrolled trial. Ann Intern Med 121:833–841.
Morgan SL, Baggott JE, Alarcon GS. 1997. Methotrexate in rheumatoid arthritis. Folate supplementation should always be given. Bio Drugs 8:164–175.
Morrison HI, Schaubel D, Desmeules M, Wigle DT. 1996. Serum folate and risk of fatal coronary heart disease. J Am Med Assoc 275:1893–1896.
Mudd SH, Skovby F, Levy HL, Pettigrew KD, Wilcken B, Pyeritz RE, Andria G, Boers GH, Bromberg IL, Cerone R, Fowler B, Gröbe H, Schmidt H, Schweitzer L. 1985. The natural history of homocystinuria due to cystathionine β-synthase deficiency. Am J Hum Genet 37:1–31.
Mukherjee MD, Sandstead HH, Ratnaparkhi MV, Johnson LK, Milne DB, Stelling HP. 1984. Maternal zinc, iron, folic acid and protein nutriture and outcome of human pregnancy. Am J Clin Nutr 40:496–507.
Mulinare J, Cordero JF, Erickson JD, Berry RJ. 1988. Periconceptional use of multivitamins and the occurrence of neural tube defects. J Am Med Assoc 260:3141– 3145.
Munger R, Romitti P, West N, Murray J, Hanson J. 1997. Maternal intake of folate, vitamin B12, and zinc and risk of orofacial cleft birth defects. Am J Epidemiol 145:830.
Nakazawa Y, Chiba K, Imatoh N, Kotoroii T, Sakamoto T, Ishizaki T. 1983. Serum folic acid levels and antipyrine clearance rates in smokers and nonsmokers. Drug Alcohol Depend 11:201–207.
Nygård O, Nordrehaug JE, Fefsum H, Ueland PM, Farstad M, Vollset SE. 1997. Plasma homocysteine levels and mortality in patients with coronary artery disease. N Engl J Med 327:230–236.
O’Connor DL, Tamura T, Picciano MF. 1991. Pteroylpolyglutamates in human milk. Am J Clin Nutr 53:930–934.
O’Keefe CA, Bailey LB, Thomas EA, Hofler SA, Davis BA, Gerda JJ, Gregory JF 3rd. 1995. Controlled dietary folate affects folate status in nonpregnant women. J Nutr 125:2717–2725.
Olney JW, Fuller TA, de Gubareff T, Labruyere J. 1981. Intrastriatal folic acid mimics the distant but not local brain damaging properties of kainic acid. Neurosci Lett 25:207–210.
Omer A, Mowat AG. 1968. Nature of anaemia in rhematoid arthritis. 9. Folate metabolism in patients with rheumatoid arthritis. Ann Rheum Dis 27:414–424.
Ortega RM, Redondo R, Andres P, Eguileor I. 1993. Nutritional assessment of folate and cyanocobalamin status in a Spanish elderly group. Int J Vitam Nutr Res 63:17–21.
Ortega RM, Lopez-Sobaler AM, Gonzalez-Gross MM, Redondo RM, Marzana I, Zamora MJ, Andres P. 1994. Influence of smoking on folate intake and blood folate concentrations in a group of elderly Spanish men. J Am Coll Nutr 13:68– 72.
Pancharuniti N, Lewis CA, Sauberlich HE, Perkins LL, Go RC, Alvarez JO, Macaluso M, Acton RT, Copeland RB, Cousins AL, Gore TB, Cornwell PE, Roseman JE. 1994. Plasma homocyst(e)ine, folate, and vitamin B12 concentrations and risk for early-onset coronary artery disease. Am J Clin Nutr 59:940–948.
Pfeiffer CM, Rogers LM, Bailey LB, Gregory JF 3rd. 1997a. Absorption of folate from fortified cereal-grain products and of supplemental folate consumed with or without food determined by using a dual-label stable-isotope protocol . Am J Clin Nutr 66:1388–1397.
Pfeiffer CM, Rogers LM, Gregory JF 3rd. 1997b. Determination of folate in cereal-grain food products using trienzyme extraction and combined affinity and reversed-phase liquid chromatography. J Agric Food Chem 45:407–413.
Picciano MF. 1996. Pregnancy and lactation. In: Ziegler EE, Filer LJ Jr., eds. Present Knowledge in Nutrition. Washington, DC: ILSI Press. Pp. 384–395.
Piyathilake CJ, Macaluso M, Hine RJ, Richards EW, Krumdieck CL. 1994. Local and systemic effects of cigarette smoking on folate and vitamin B-12. Am J Clin Nutr 60:559–566.
Potischman N, Brinton LA, Laiming VA, Reeves WC, Brenes MM, Herroro R, Tenorio F, de Britton RC, Gaitan E. 1991. A case-control study of serum folate levels and invasive cervical cancer. Cancer Res 51:4785–4789.
Qyist I, Abdulla M, Jägerstad M, Svensson S. 1986. Iron, zinc and folate status during pregnancy and two months after delivery. Acta Obstet Gynecol Scand 65:15–22.
Rajkovic A, Catalano PM, Malinow MR. 1997. Elevated homocyst(e)ine levels with preeclampsia. Obstet Gynecol 90:168–171.
Ramsbottom D, Scott JM, Molloy A, Weir DG, Kirke PN, Mills JL, Gallagher PM, Whitehead AS. 1997. Are common mutations of cystathionine beta-synthase involved in the aetiology of neural tube defects? Clin Genet 51:39–42.
Rasmussen K, Moller J, Lyngbak M, Pedersen A-M, Dybkjaer L. 1996. Age- and gender-specific reference intervals for total homocysteine and methylmalonic acid in plasma before and after vitamin supplementation. Clin Chem 42:630– 636.
Reed T, Malinow MR, Christian JC, Upson B. 1991. Estimates of heritability of plasma homocyst(e)ine levels in aging adult male twins. Clin Genet 39:425– 428.
Reisner EH Jr, Weiner L. 1952. Studies on mutual effect of suboptimal oral doses of vitamin B12 and folic acid in pernicious anemia. N Engl J Med 247:15–17.
Retief FP. 1969. Urinary folate excretion after ingestion of pteroylmonoglutamic acid and food folate. Am J Clin Nutr 22:352–355.
Reynolds EH, Chanarin I, Milner G, Matthews DM. 1966. Anticonvulsant therapy, folic acid and vitamin B12 metabolism and mental symptoms. Epilepsia 7:261– 270.
Reynolds EH, Rothfeld P, Pineus JH. 1973. Neurological disease associated with folate deficiency. Br Med J 2:398–400.
Rhode BM, Cooper BA, Farmer FA. 1983. Effect of orange juice, folic acid, and oral contraceptives on serum folate in women taking a folate-restricted diet. J Am Coll Nutr 2:221–230.
Richens A. 1971. Toxicity of folic acid. Lancet 1:912.
Riggs KM, Spiro A, Tucker K, Rush D. 1996. Relations of vitamin B-12, vitamin B-6, folate, and homocysteine to cognitive performance in the Normative Aging Study. Am J Clin Nutr 63:306–314.
Rimm EB, Willett WC, Hu FB, Sampson L, Colditz GA, Manson JE, Hennekens C, Stampfer MJ. 1998. Folate and vitamin B6 from diet and supplements in relation to risk of coronary heart disease among women. J Am Med Assoc 279:359– 364.
Ritz ND, Meyer LM, Brahin C, Sawitsky A. 1951. Further observations on the oral treatment of pernicious anemia with subminimal doses of folic acid and vitamin B12. Acta Hematol 5:334–338.
Rong N, Selhub J, Goldin BR, Rosenberg IH. 1991. Bacterially synthesized folate in rat large intestine is incorporated into host tissue folyl polyglutamates. J Nutr 121:1955–1959.
Rosa FW. 1991. Spina bifida in infants of women treated with carbamazepine during pregnancy. N Engl J Med 324:674–677.
Rosenberg IH. 1992. Folate. In: Hartz SC, Russell RM, Rosenberg IH, eds. Nutrition in the Elderly. The Boston Nutritional Status Survey. London: Smith-Gordon. Pp. 135–139.
Ross JF, Belding H, Paegel BL. 1948. The development and progression of subacute combined degeneration of the spinal cord in patients with pernicious anemia treated with synthetic pteroylglutamic (folic) acid. Blood 3:68–90.
Russell RM, Ismail-Beigi F, Reinhold JG. 1976. Folate content of Iranian breads and the effect of their fiber content on the intestinal absorption of folic acid. Am J Clin Nutr 29:799–802.
Russell RM, Rosenberg IH, Wilson PD, Iber FL, Oaks EB, Giovetti AC, Otradovec CL, Karwoski PA, Press AW. 1983. Increased urinary excretion and prolonged turnover time of folic acid during ethanol ingestion. Am J Clin Nutr 38:64–70.
Sahyoun N. 1992. Nutrient intake by the NSS elderly population. In: Hartz SC, Russell RM, Rosenberg IH, eds. Nutrition in the Elderly. The Boston Nutritional Status Survey. London: Smith-Gordon. Pp. 31–44.
Sahyoun NR, Otradovec CL, Hartz SC, Jacob RA, Peters H, Russell RM, McGandy RB. 1988. Dietary intakes and biochemical indicators of nutritional status in an elderly, institutionalized population. Am J Clin Nutr 47:524–533.
Saleh AM, Pheasant AE, Blair JA, Allan RN, Walters J. 1982. Folate metabolism in man: The effect of malignant disease. Br J Cancer 46:346–353.
Salmenpera L, Perheentupa J, Siimes MA. 1986. Folate nutrition is optimal in exclusively breast-fed infants but inadequate in some of their mothers and in formula-fed infants. J Pediatr Gastroenterol Nutr 5:283–289.
Sauberlich HE, Kretsch MJ, Skala JH, Johnson HL, Taylor PC. 1987. Folate requirement and metabolism in nonpregnant women. Am J Clin Nutr 46:1016–1028.
Savage DG, Lindenbaum J, Stabler SP, Allen RH. 1994. Sensitivity of serum methylmalonic acid and total homocysteine determinations for diagnosing cobalamin and folate deficiencies. Am J Med 96:239–246.
Scanlon KS, Ferencz C, Loffredo CA, Wilson PD, Correa-Villaseñor A, Khoury MJ, Willett WC. 1998. Preconceptional folate intake and malformations of the cardiac outflow tract. Epidemiology 9:95–98.
Schmitz C, Lindpaintner K, Verhoef P, Gaziano JM, Buring J. 1996. Genetic polymorphism of methylenetetrahydrofolate reductase and myocardial infarction. A case-control study. Circulation 94:1812–1814.
Scholl TO, Hediger ML, Bendich A, Schall JI, Smith WK, Krueger PM. 1997. Use of multivitamin/mineral prenatal supplements: Influence on the outcome of pregnancy. Am J Epidemiol 146:134–141.
Schwartz SM, Siscovick DS, Malinow MR, Rosendaal FR, Beverly RK, Hess DL, Psaty BM, Longstreth WT, Koepsell TD, Raghunathan TE, Reitsma PH. 1997. Myocardial infarction in young women in relation to plasma total homocysteine, folate, and a common variant in the methylenetetrahydrofolate reductase gene. Circulation 96:412–417.
Schwartz SO, Kaplan SR, Armstrong BE. 1950. The long-term evaluation of folic acid in the treatment of pernicious anemia. J Lab Clin Med 35:894–898.
Selby JV, Friedman GD, Fireman BH. 1989. Screening prescription drugs for possible carcinogenecity: Eleven to fifteen years of follow-up. Cancer Res 49:5736– 5747.
Selhub J, Rosenberg IH. 1996. Folic acid. In: Ziegler EE, Filer LJ Jr., eds. Present Knowledge in Nutrition. Washington, DC: ILSI Press. Pp. 206–219.
Selhub J, Dhar G, Rosenberg IH. 1978. Inhibition of folate enzymes by sulfasalazine. J Clin Invest 61:221–224.
Selhub J, Jacques PF, Wilson PWF, Rush D, Rosenberg IH. 1993. Vitamin status and intake as primary determinants of homocysteinemia in an elderly population. J Am Med Assoc 270:2693–2698.
Senti FR, Pilch SM. 1985. Analysis of folate data from the Second National Health and Nutrition Examination Survey (NHANES II). J Nutr 115:1398–1402.
Sesin GP, Kirschenbaum H. 1979. Folic acid hypersensitivity and fever: A case report. Am J Hosp Pharm 36:1565–1567.
Shaw GM, Lammer EJ, Wasserman CR, O’Malley CD, Tolarova MM. 1995a. Risks of orofacial clefts in children born to women using multivitamins containing folic acid periconceptionally. Lancet 346:393–396.
Shaw GM, O’Malley CD, Wasserman CR, Tolarova MM, Lammer EJ. 1995b. Maternal periconceptional use of multivitamins and reduced risk for conotruncal heart defects and limb deficiencies among offspring. Am J Med Genet 59:536– 545.
Shaw GM, Schaffer D, Velie EM, Morland K, Harris JA. 1995c. Periconceptional vitamin use, dietary folate, and the occurrence of neural tube defects. Epidemiology 6:219–226.
Sheehy TW. 1973. Folic acid: Lack of toxicity. Lancet 1:37.
Sheehy TW, Rubini ME, Perez-Santiago E, Santini R Jr, Haddock J. 1961. The effect of “minute” and “titrated” amounts of folic acid on the megaloblastic anemia of tropical sprue. Blood 18:623–636.
Shojania AM, Hornady G, Barnes PH. 1968. Oral contraceptives and serum-folate level. Lancet 1:1376–1377.
Shojania AM, Hornady GJ, Barnes PH. 1971. The effect of oral contraceptives on folate metabolism. Am J Obstet Gynecol 111:782–791.
Shorvon SD, Carney MW, Chanarin I, Reynolds EH. 1980. The neuropsychiatry of megaloblastic anaemia. Br Med J 281:1036–1038.
Smith AM, Picciano MF, Deering RH. 1983. Folate supplementation during lactation: Maternal folate status, human milk folate content, and their relationship to infant folate status. J Pediatr Gastroenterol Nutr 2:622–628.
Smith AM, Picciano MF, Deering RH. 1985. Folate intake and blood concentrations of term infants. Am J Clin Nutr 41:590–598.
Smith JL, Goldsmith GA, Lawrence JD. 1975. Effect of oral contraceptive steroids on vitamin and lipid levels in serum. Am J Clin Nutr 28:371–376.
Smithells RW, Sheppard S, Schorah CJ. 1976. Vitamin deficiencies and neural tube defects. Arch Dis Child 51:944–950.
Smithells RW, Sheppard S, Schorah CJ, Seller MJ, Nevin NC, Harris R, Read AP, Fielding DW. 1981. Apparent prevention of neural tube defects by periconceptional vitamin supplementation. Arch Dis Child 56:911–918.
Smithells RW, Nevin NC, Seller MJ, Sheppard S, Harris R, Read AP, Fielding DW, Walker S, Schorah CJ, Wild J. 1983. Further experience of vitamin supplementation for prevention of neural tube defect recurrences. Lancet 1:1027–1031.
Sparling R, Abela M. 1985. Hypersensitivity to folic acid therapy. Clin Lab Haematol 7:184–185.
Spector RG. 1972. Influence of folic acid on exitable tissues. Nature 240:247–249.
Spies TD, Stone RE. 1947. Liver extract, folic acid, and thymine in pernicious anemia and subacute combined degeneration. Lancet 1:174–176.
Spies TD, Stone RE, Lopez GG, Milanes F, Aramburu T, Toca RL. 1948. The association between gastric achlorhydria and subacute combined degeneration of the spinal cord. Postgrad Med 4:89–95.
Stabler SP, Marcell PD, Podell ER, Allen RH, Savage DG, Lindenbaum J. 1988. Elevation of total homocysteine in the serum of patients with cobalamin or folate deficiency detected by capillary gas chromatography-mass spectrometry. J Clin Invest 81:466–474.
Stabler SP, Lindenbaum J, Allen RH. 1996. The use of homocysteine and other metabolites in the specific diagnosis of vitamin B-12 deficiency. J Nutr 126:1266S–1272S.
Stanley OH, Chambers TL. 1982. Sodium valproate and neural tube defects. Lancet 2:1282–1283.
Steegers-Theunissen RP, Boers GH, Blom HJ, Trijbels FJ, Eskes TK. 1992. Hyper-homocysteinaemia and recurrent spontaneous abortion or abruptio placentae. Lancet 339:1122–1123.
Steegers-Theunissen RP, Boers GH, Trijbels FJ, Finkelstein JD, Blom HJ, Thomas CM, Borm GF, Wouters MG, Eskes TK. 1994. Maternal hyperhomocysteinemia: A risk factor for neural tube defects? Metabolism 43:1475–1480.
Stites TE, Bailey LB, Scott KC, Toth JP, Fisher WP, Gregory JF 3rd. 1997. Kinetic modeling of folate metabolism through use of chronic administration of deuterium-labeled folic acid in men. Am J Clin Nutr 65:53–60.
Suarez RM, Spies TD, Suarez RM Jr. 1947. The use of folic acid in sprue. Ann Intern Med 26:643–677.
Subar AF, Harlan LC, Mattson ME. 1990. Food and nutrient intake differences between smokers and non-smokers in the U.S. Am J Publ Health 80:1323–1329.
Tamura T. 1995. Nutrient interaction of folate and zinc. In: Bailey LB, ed. Folate in Health and Disease. New York: Marcel Dekker. Pp. 287–312.
Tamura T, Stokstad EL. 1973. The availability of food folate in man. Br J Haematol 25:513–532.
Tamura T, Yoshimura Y, Arakawa T. 1980. Human milk folate and folate status in lactating mothers and their infants. Am J Clin Nutr 33:193–197.
Tamura T, Goldenberg RL, Freeberg LE, Cliver SP, Cutter GR, Hoffman HJ. 1992. Maternal serum folate and zinc concentrations and their relationships to pregnancy outcome. Am J Clin Nutr 56:365–370.
Tamura T, Mizuno Y, Johnston KE, Jacob RA. 1997. Food folate assay with protease, α-amylase, and folate conjugase treatments. J Agric Food Chem 45:135– 139.
Tassabehji M, Read AP, Newton VE, Patton M, Gross P, Harris R, Strachan T. 1993. Mutations in the PAX3 gene causing Waardenburg syndrome type I and type 2. Nat Genet 3:26–30.
Thiersch JB. 1952. Therapeutic abortions with folic acid antagonists, 4-amino pteroylglutamic acid administration by the oral route. Am J Obstet Gynecol 63:1298–1304.
Thirkettle JL, Gough KR, Read AE. 1964. Diagnostic value of small oral doses of folic acid in megaloblastic anemia . Br Med J 1:1286–1289.
Tolarova M, Harris J. 1995. Reduced recurrence of orofacial clefts after periconceptional supplementation with high-dose folic acid and multivitamins. Teratology 51:71–78.
Tsai JC, Perrella MA, Yoshizumi M, Hsieh CM, Haber E, Schlegel R, Lee ME. 1994. Promotion of vascular smooth muscle cell growth by homocysteine: A link to atherosclerosis. Proc Natl Acad Sci USA 91:6369–6373.
Tucker KL, Selhub J, Wilson PW, Rosenberg IH. 1996. Dietary intake pattern relates to plasma folate and homocysteine concentrations in the Framingham Heart Study. J Nutr 126:3025–3031.
Turner AJ. 1977. Commentary: The roles of folate and pteridine derivatives in neurotransmitter metabolism. Biochem Pharmacol 26:1009–1014.
Ubbink JB, Vermaak WJ, van der Merwe A, Becker PJ. 1993. Vitamin B-12, vitamin B-6, and folate nutritional status in men with hyperhomocysteinemia. Am J Clin Nutr 57:47–53.
Ubbink JB, Becker PJ, Vermaak WJ, Delport R. 1995a. Results of B-vitamin supplementation study used in a prediction model to define a reference range for plasma homocysteine. Clin Chem 41:1033–1037.
Ubbink JB, Vermaak WJ, Delport R, van der Merwe A, Becker PJ, Potgieter H. 1995b. Effective homocysteine metabolism may protect South African blacks against coronary heart disease. Am J Clin Nutr 62:802–808.
Vanaerts LA, Blom HJ, Deabreu RA, Trijbels FJ, Eskes TK, Copius Peereboom-Stegeman JH, Noordhoek J. 1994. Prevention of neural tube defects by and toxicity of L-homocysteine in cultured postimplantation rat embryos. Teratology 50:348–360.
van der Put NM, Steegers-Theunissen RP, Frosst P, Trijbels FJ, Eskes TK, van den Heuvel LP, Mariman EC, den Heyer M, Rozen R, Blom HJ. 1995. Mutated methylenetetrahydrofolate reductase as a risk factor for spina bifida. Lancet 346:1070–1071.
van der Put NM, Thomas CM, Eskes TK, Trijbels FJ, Steegers-Theunissen RP, Mariman EC, De Graaf-Hess A, Smeitink JA, Blom HJ. 1997a. Altered folate and vitamin B12 metabolism in families with spina bifida offspring. Q J Med 90:505– 510.
van der Put NM, van der Molen EF, Kluijtmans LA, Heil SG, Trijbels JM, Eskes TK, Van Oppenraaij-Emmerzaal D, Banerjee R, Blom HJ. 1997b. Sequence analysis of the coding region of human methionine synthase: Relevance to hyperhomocysteinaemia in neural-tube defects and vascular disease. Q J Med 90:511– 517.
van der Westhuyzen J, Metz J. 1983. Tissue S-adenosylmethionine levels in fruit bats with N2O-induced neuropathy. Br J Nutr 50:325–330.
van der Westhuyzen J, Fernandes-Costa F, Metz J. 1982. Cobalamin inactivation by nitrous oxide produces severe neurological impairment in fruit bats: Protection by methionine and aggravation by folates. Life Sci 31:2001–2010.
Varadi S, Abbott D, Elwis A. 1966. Correlation of peripheral white cell and bone marrow changes with folate levels in pregnancy and their clinical significance. J Clin Pathol 19:33–36.
Velie EM, Shaw GM. 1996. Impact of prenatal diagnosis and elective termination on prevalence and risk estimates of neural tube defects in California, 1989– 1991. Am J Epidemiol 144:473–479.
Vergel RG, Sanchez LR, Heredero BL, Rodriguez PL, Martinez AJ. 1990. Primary prevention of neural tube defects with folic acid supplementation: Cuban experience. Prenat Diagn 10:149–152.
Verhaar MC, Wever RM, Kastelein JJ, van Dam T, Koomans HA, Rabelink TJ. 1998. 5-Methyltetrahydrofolate, the active form of folic acid, restores endothelial function in familial hypercholesterolemia. Circulation 97:237–241.
Verhoef P, Stampfer MJ, Buring JE, Gaziano JM, Allen RH, Stabler SP, Reynolds RD, Kok FJ, Hennekens CH, Willett WC. 1996. Homocysteine metabolism and risk of myocardial infarction: Relation with vitamins B6, B12, and folate. Am J Epidemiol 143:845–859.
Verhoef P, Kok FJ, Kluijtmans LA, Blom HJ, Refsum H, Ueland PM, Kruyssen DA. 1997a. The 677C→T mutation in the methylene te trahydrofolate reductase gene: Associations with plasma total homocysteine levels and risk of coronary atherosclerotic disease. Atherosclerosis 132:105–113.
Verhoef P, Rimm EB, Hunter DJ, Chen J, Willett WC, Kelsey K, Stampfer MJ. 1997b. Methylenetetrahydrofolate reductase polymorphism and risk of coronary heart disease: Results from health professionals study and meta-analysis. Am J Epid 145:307.
Verreault R, Chu J, Mandelson M, Shy K. 1989. A case-control study of diet and invasive cervical cancer. Int J Cancer 43:1050–1054.
Victor M, Lear AA. 1956. Subacute combined degeneration of the spinal cord. Current concepts of the disease process. Value of serum vitamin B12 determinations in clarifying some of the common clinical problems. Am J Med 20:896– 911 .
Vilter CF, Vilter RW, Spies TD. 1947. The treatment of pernicious and related anemias with synthetic folic acid. 1. Observations on the maintenance of a normal hematologic status and on the occurrence of combined system disease at the end of one year. J Lab Clin Med 32:262–273.
Volpe JJ. 1995. Neurology of the Newborn, 3rd ed. Philadelphia: WB Saunders.
Von der Porten AE, Gregory JF 3rd, Toth JP, Gerda JJ, Curry SH, Bailey LB. 1992. In vivo folate kinetics during chronic supplementation of human subjects with deuterium-labeled folic acid. J Nutr 122:1293–1299.
Wagley PF. 1948. Neurologic disturbances with folic acid therapy. N Engl J Med 238:11–15.
Wagner C. 1996. Symposium on the subcellular compartmentation of folate metabolism. J Nutr 126:1228S–1234S.
Wahlin A, Hill RD, Winblad B, Backman L. 1996. Effects of serum vitamin B12 and folate status on episodic memory performance in very old age: A population-based study. Psychol Aging 11:487–496.
Wald NJ. 1994. Folic acid and neural tube defects: The current evidence and implications for prevention. Ciba Found Symp 181:192–208.
Wald N, Sneddon J, Densem J, Frost C, Stone R. 1991. Prevention of neural tube defects: Results of the Medical Research Council vitamin study. Lancet 338:131– 137.
Watanabe M, Osada J, Aratani Y, Kluckman K, Reddick R, Malinow MR, Maeda N. 1995. Mice deficient in cystathionine beta-synthase: Animal models for mild and severe homocyst(e)inemia. Proc Natl Acad Sci USA 92:1585–1589.
Ward M, McNulty H, McPartlin J, Strain JJ, Weir DG, Scott JM. 1997. Plasma homocysteine, a risk factor for cardiovascular disease, is lowered by physiological doses of folic acid. Q J Med 90:519–524.
Wei M-M, Bailey LB, Toth JP, Gregory JF 3rd. 1996. Bioavailability for humans of deuterium-labeled monoglutamyl and polyglutamyl folates is affected by selected foods. J Nutr 126:3100–3108.
Weir DG, McGing PG, Scott JM. 1985. Commentary: Folate metabolism, the enterohepatic circulation and alcohol. Biochem Pharmacol 34:1–7.
Weller M, Marini AM, Martin B, Paul SM. 1994. The reduced unsubstituted pteroate moiety is required for folate toxicity of cultured cerebellar granule neurons. J Pharmacol Exp Ther 269:393–401.
Werler MM, Shapiro S, Mitchell AA. 1993. Periconceptional folic acid exposure and risk of occurrent neural tube defects. J Am Med Assoc 269:1257–1261.
Whitehead AS, Gallagher P, Mills JL, Kirke PN, Burke H, Molloy AM, Weir DG, Shields DC, Scott JM. 1995. A genetic defect in 5, 10 methylenetetrahydrofolate reductase in neural tube defects. Q J Med 88:763–766.
Whitehead VM. 1973. Polygammaglutamyl metabolites of folic acid in human liver. Lancet 1:743–745.
Whitehead VM. 1986. Pharmacokinetics and physiological disposition of folate and its derivatives. In: Blakely RL, Whitehead VM, eds. Folates and Pterins, Vol. 3. New York: John Wiley & Sons. Pp. 177–205.
Wilcken DE, Wilcken B. 1976. The pathogenesis of coronary artery disease. A possible role for methionine metabolism. J Clin Invest 57:1079–1082.
Wilcken DE, Wang XL, Sim AS, McCredie RM. 1996. Distribution in healthy and coronary populations of the methylenetetrahydrofolate reductase (MTHFR) C677T mutation. Arterioscler Thromb Vasc Biol 16:878–882.
Will JJ, Mueller JF, Brodine C, Kiely CE, Friedman B, Hawkins VR, Dutra J, Vilter RN. 1959. Folic acid and vitamin B12 pernicious anemia. Studies on patients treated with these substances over a ten-year period. J Lab Clin Med 53:22–38.
Willard JE, Lange RA, Hillis LD. 1992. The use of aspirin in ischemic heart disease. N Engl J Med 327:175–181.
Willoughby ML. 1967. An investigation of folic acid requirements in pregnancy. II. Br J Haematol 13:503–509.
Willoughby ML, Jewell FJ. 1966. Investigation of folic acid requirements in pregnancy. Br Med J 2:1568–1571.
Willoughby ML, Jewell FG. 1968. Folate status throughout pregnancy and in postpartum period. Br Med J 4:356–360.
Wilson JG. 1973. Environment and Birth Defects. New York: Academic Press
Witter FR, Blake DA, Baumgardner R, Mellits ED, Niebyl JR. 1982. Folate, carotene, and smoking. Am J Obstet Gynecol 144:857.
Wouters MG, Boers GH, Blom HJ, Trijbels FJ, Thomas CM, Borm GF, Steegers-Theunissen RP, Eskes TK. 1993. Hyperhomocysteinemia: A risk factor in women with unexplained recurrent early pregnancy loss . Fertil Steril 60:820– 825.
Wu A, Chanarin I, Slavin G. Levi AJ. 1975. Folate deficiency in the alcoholic—its relationship to clinical and haematological abnormalities, liver disease and folate stores. Br J Haematol 29:469–478.
Yen IH, Khoury MJ, Erickson JD, James LM, Waters GD, Berry RJ. 1992. The changing epidemiology of neural tube defects: United States, 1968–1989. Am J Dis Child 146:857–861.
Young SN, Ghadirian AM. 1989. Folic acid and psychopathology. Prog Neuropsychopharmacol Biol Psychiatry 13:841–863.
Zalusky R, Herbert V. 1961. Megaloblastic anemia in scurvy with response to 50 micrograms of folic acid daily. N Engl J Med 265:1033–1038.
Ziegler RG, Brinton LA, Hammon RF, Lehman HF, Levine RS, Mallin K, Norman SA, Rosenthal JF, Trumble AC, Hoover RN. 1990. Diet and risk of invasive cervical cancer among white women in the United States. Am J Epidemiol 132:432–445.
Ziegler RG, Jones CJ, Brinton LA, Norman SA, Mallin K, Levine RS, Lehman HF, Hammon RF, Trumble AC, Rosenthal JF. 1991. Diet and risk of in situ cervical cancer among white women in the United States. Cancer Causes Control 2:17– 29.
Zimmerman J. 1990. Folic acid transport in organ-cultured mucosa of human intestine. Evidence for distinct carriers. Gastroenterology 99:964–972.


