National Academies Press: OpenBook

Issues in Potable Reuse: The Viability of Augmenting Drinking Water Supplies with Reclaimed Water (1998)

Chapter: Appendix A: Use of Consequence-Frequency Assessment to Evaluate Performance of an Advanced Wastewater Treatment Facility

« Previous: 6 Reliability and Quality Assurance Issues for Reuse Systems
Suggested Citation:"Appendix A: Use of Consequence-Frequency Assessment to Evaluate Performance of an Advanced Wastewater Treatment Facility." National Research Council. 1998. Issues in Potable Reuse: The Viability of Augmenting Drinking Water Supplies with Reclaimed Water. Washington, DC: The National Academies Press. doi: 10.17226/6022.
×

A
Use of Consequence-Frequency Assessment to Evaluate Performance of an Advanced Wastewater Treatment Facility

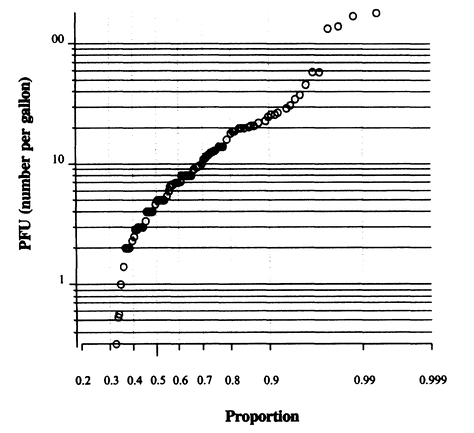
The consequence-frequency assessment methodology (see Chapter 6) can be illustrated by example. For the purpose of this discussion, only advanced wastewater treatment facilities subsequent to secondary wastewater treatment are considered. For acute contaminants (such as microorganisms), the influent stream to such a facility may be highly variable. For example, at Water Factory 21, the range in influent virus levels was more than two orders of magnitude, and the distribution could be roughly described by a log normal distribution (see Figure A-1).

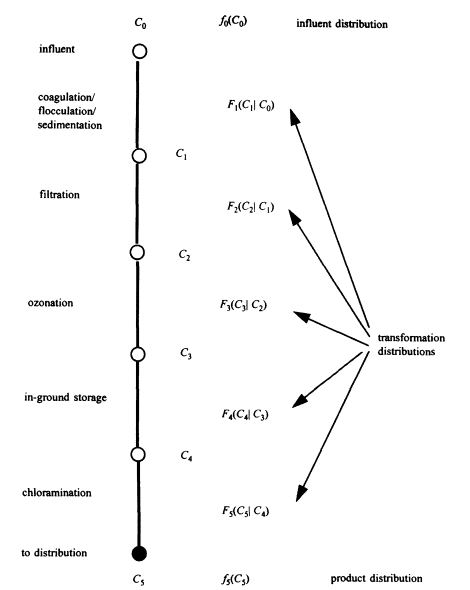
A given facility may have a sequence of processes individually capable of changing the microbial distribution. Figure A-2 depicts such a treatment in general terms. The concentrations of pollutants (e.g., viruses) at each stage of treatment are given as C0, C1, C2, and so on. The connection between individual concentrations is given by a conditional distribution. For example, F2(C2 C1) is the probability density of virus following filtration, given the virus concentration entering the filter. In other words, if the filter influent contains a virus concentration C1 then the integral

gives the probability that the filter effluent will contain a virus concentration between . Where the processes behave in a linear (first-order) fashion, this distribution may be written simply in terms of the
Suggested Citation:"Appendix A: Use of Consequence-Frequency Assessment to Evaluate Performance of an Advanced Wastewater Treatment Facility." National Research Council. 1998. Issues in Potable Reuse: The Viability of Augmenting Drinking Water Supplies with Reclaimed Water. Washington, DC: The National Academies Press. doi: 10.17226/6022.
×

FIGURE A-1 Influent (secondary effluent) virus concentrations on BGM cells at Water Factory 21. The x-axis is a normal probability scale. NOTE: BGM = Buffalo Green Monkey; PFU = plaqueforming units. SOURCE: Reprinted, with permission, from James Montgomery Consulting Engineers, 1979. © 1979 by James Montgomery Consulting Engineers.

ratio of the effluent to influent concentration; however the conditional framework (as shown in Figure A-2) provides a more general approach Formally the probability distribution of the product concentrations may be evaluated as a multiple integral, which can (for the indicated process train) be written as (Stuart and Ord, 1987)

Suggested Citation:"Appendix A: Use of Consequence-Frequency Assessment to Evaluate Performance of an Advanced Wastewater Treatment Facility." National Research Council. 1998. Issues in Potable Reuse: The Viability of Augmenting Drinking Water Supplies with Reclaimed Water. Washington, DC: The National Academies Press. doi: 10.17226/6022.
×

FIGURE A-2 Conceptual diagram of process train and reliability distributions.

Suggested Citation:"Appendix A: Use of Consequence-Frequency Assessment to Evaluate Performance of an Advanced Wastewater Treatment Facility." National Research Council. 1998. Issues in Potable Reuse: The Viability of Augmenting Drinking Water Supplies with Reclaimed Water. Washington, DC: The National Academies Press. doi: 10.17226/6022.
×

For compactness, the arguments for the conditional distributions are omitted in this integral. Analytical evaluation of this integral may not be possible in many (perhaps most) cases. Therefore the problem must be approached numerically, and there are at least two numerical approaches to the problem. In one approach, the deterministic function connecting C0 and C5 is written:

If the moments (mean, variance, etc.) of the influent distribution (C0) and the process removal (Ci/Ci-1) distributions, along with any correlations, are known, then the moments of the quantity ln(C5) can be computed using propagation methods (Ku, 1966). However, this method is algebraically complex, and unless further assumptions are made, it cannot directly produce confidence distributions.

The Monte Carlo method is an alternative that is widely employed in risk assessment (Burmaster and Anderson, 1994; Finkel, 1990; Haas et al., 1993; Smith, 1994). In this approach, each of the distributions is sampled repeatedly, and the final concentration is computed for each set of random samples. By repeated sampling, the distribution of final concentrations is obtained.

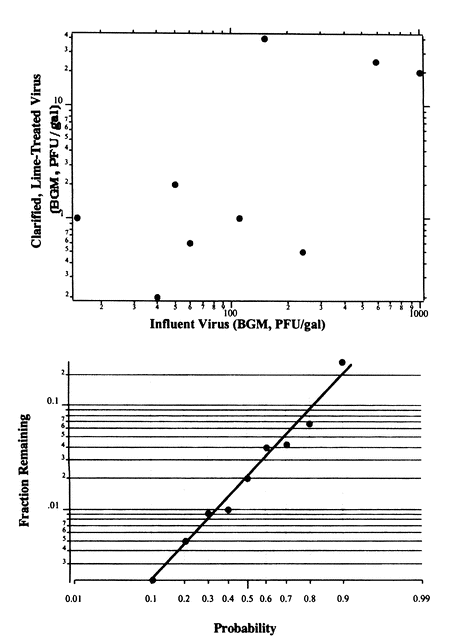
To employ either of these methods, information about the transformation probability distributions must be obtained or assumed. For example, in the Water Factory 21 project (James M. Montgomery Consulting Engineers, 1979), paired samples of influent and clarified lime-treated water were analyzed for viruses. The resulting data are presented in the two panels of Figure A-3. It would appear that the removal in this process can be characterized by a log normal distribution of a removal efficiency (effluent/influent); however, the low number of data points does not provide a powerful test of alternative models. (For example, is removal efficiency dependent in a systematic manner on the influent viral loading or on other process descriptors such as pH?)

Obtaining information on process removal distributions is a data-intensive task. The actual data in Figure A-3 span from 10 to 90 percent cumulative probability. The implementation of a full Monte Carlo analy-
Suggested Citation:"Appendix A: Use of Consequence-Frequency Assessment to Evaluate Performance of an Advanced Wastewater Treatment Facility." National Research Council. 1998. Issues in Potable Reuse: The Viability of Augmenting Drinking Water Supplies with Reclaimed Water. Washington, DC: The National Academies Press. doi: 10.17226/6022.
×

FIGURE A-3 Removal of virus (BGM) by lime treatment at Water Factory 21. The x-axis in the bottom panel is a normal probability scale. NOTE: BGM = Buffalo Green Monkey; PFU = plaque-forming units.

Suggested Citation:"Appendix A: Use of Consequence-Frequency Assessment to Evaluate Performance of an Advanced Wastewater Treatment Facility." National Research Council. 1998. Issues in Potable Reuse: The Viability of Augmenting Drinking Water Supplies with Reclaimed Water. Washington, DC: The National Academies Press. doi: 10.17226/6022.
×

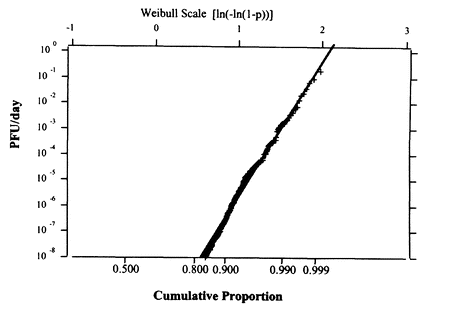
FIGURE A-4 Example of output of a Monte Carlo simulation. NOTE: PFU = plaque-forming units.

sis would require fitting this distribution to a particular form, which can then be used to extrapolate beyond the ''tails" of the observed data. There are an infinite number of potential distributions. While the log normal has most frequently been used, the gamma and pareto may also have particular utility in the description of relatively rare failure distributions. The degree to which the choice of a particular distributional assumption influences the results of a Monte Carlo calculation has not been well studied, although preliminary results suggest that the choice of distributional form may not be overly crucial except in very highly skewed situations.

In principle, if the data on process performance distributions are available, then the probability distribution of a particular contaminant in the water to be ingested may be estimated. The final results may be presented as Figure A-4. Results from hypothetical data are plotted on a Weibull scale, which would result in a linear plot if the Weibull distribution provided a good fit to the data. From this figure one could estimate, for example, that there would be exposure to 10-3 plaque forming units per day more than 1 percent of the time. This information may be com-

Suggested Citation:"Appendix A: Use of Consequence-Frequency Assessment to Evaluate Performance of an Advanced Wastewater Treatment Facility." National Research Council. 1998. Issues in Potable Reuse: The Viability of Augmenting Drinking Water Supplies with Reclaimed Water. Washington, DC: The National Academies Press. doi: 10.17226/6022.
×

bined with a dose-response assessment to ascertain the likelihood of a risk of infection or illness of a given magnitude.

References

Burmaster, D. E., and P. D. Anderson. 1994. Principles of good practice for the use of Monte Carlo techniques in human health and ecological risk assessment. Risk Analysis 14(4): 477-481.


Finkel, A. M. 1990. Confronting Uncertainty in Risk Management. Washington D.C.: Resources for the Future, Center for Risk Management.


Haas, C. N., J. B. Rose, C. P. Gerba, and S. Regli. 1993. Risk assessment of virus in drinking water. Risk Analysis 13(5):545-552.


James M. Montgomery Consulting Engineers. 1979. Water Factory 21 Virus Study, Orange County Water District. New York: John Wiley.


Ku, H. 1966. Notes on the use of propagation of error formulas. Journal of Research of the National Bureau of Standards-C: Engineering and Instrumentation 70C(4):263-273.


Smith, R. L. 1994. Use of Monte Carlo simulation for human exposure assessment at a Superfund site. Risk Analysis 14(4):433-439.

Stuart, A., and J. K. Ord. 1987. Kendall's Advanced Theory of Statistics. New York:Oxford University Press.

Suggested Citation:"Appendix A: Use of Consequence-Frequency Assessment to Evaluate Performance of an Advanced Wastewater Treatment Facility." National Research Council. 1998. Issues in Potable Reuse: The Viability of Augmenting Drinking Water Supplies with Reclaimed Water. Washington, DC: The National Academies Press. doi: 10.17226/6022.
×
Page 241
Suggested Citation:"Appendix A: Use of Consequence-Frequency Assessment to Evaluate Performance of an Advanced Wastewater Treatment Facility." National Research Council. 1998. Issues in Potable Reuse: The Viability of Augmenting Drinking Water Supplies with Reclaimed Water. Washington, DC: The National Academies Press. doi: 10.17226/6022.
×
Page 242
Suggested Citation:"Appendix A: Use of Consequence-Frequency Assessment to Evaluate Performance of an Advanced Wastewater Treatment Facility." National Research Council. 1998. Issues in Potable Reuse: The Viability of Augmenting Drinking Water Supplies with Reclaimed Water. Washington, DC: The National Academies Press. doi: 10.17226/6022.
×
Page 243
Suggested Citation:"Appendix A: Use of Consequence-Frequency Assessment to Evaluate Performance of an Advanced Wastewater Treatment Facility." National Research Council. 1998. Issues in Potable Reuse: The Viability of Augmenting Drinking Water Supplies with Reclaimed Water. Washington, DC: The National Academies Press. doi: 10.17226/6022.
×
Page 244
Suggested Citation:"Appendix A: Use of Consequence-Frequency Assessment to Evaluate Performance of an Advanced Wastewater Treatment Facility." National Research Council. 1998. Issues in Potable Reuse: The Viability of Augmenting Drinking Water Supplies with Reclaimed Water. Washington, DC: The National Academies Press. doi: 10.17226/6022.
×
Page 245
Suggested Citation:"Appendix A: Use of Consequence-Frequency Assessment to Evaluate Performance of an Advanced Wastewater Treatment Facility." National Research Council. 1998. Issues in Potable Reuse: The Viability of Augmenting Drinking Water Supplies with Reclaimed Water. Washington, DC: The National Academies Press. doi: 10.17226/6022.
×
Page 246
Suggested Citation:"Appendix A: Use of Consequence-Frequency Assessment to Evaluate Performance of an Advanced Wastewater Treatment Facility." National Research Council. 1998. Issues in Potable Reuse: The Viability of Augmenting Drinking Water Supplies with Reclaimed Water. Washington, DC: The National Academies Press. doi: 10.17226/6022.
×
Page 247
Next: Appendix B: Biographies of Committee Members and Staff »
Issues in Potable Reuse: The Viability of Augmenting Drinking Water Supplies with Reclaimed Water Get This Book
×
Buy Hardback | $58.00 Buy Ebook | $46.99
MyNAP members save 10% online.
Login or Register to save!
Download Free PDF

A small but growing number of municipalities are augmenting their drinking water supplies with highly treated wastewater. But some professionals in the field argue that only the purest sources should be used for drinking water.

Is potable reuse a viable application of reclaimed water? How can individual communities effectively evaluate potable reuse programs? How certain must "certain" be when it comes to drinking water safety? Issues in Potable Reuse provides the best available answers to these questions.

Useful to scientists yet accessible to concerned lay readers, this book defines important terms in the debate and provides data, analysis, and examples of the experience of municipalities from San Diego to Tampa. The committee explores in detail the two major types of contaminants:

Chemical contaminants. The committee discusses how to assess toxicity, reduce the input of contaminants, evaluate treatment options, manage the byproducts of disinfection and other issues.

Microbial contaminants, including newly emerging waterborne pathogens. The book covers methods of detection, health consequences, treatment, and more.

Issues in Potable Reuse reviews the results of six health effects studies at operational or proposed reuse projects. The committee discusses the utility of fish versus mammals in toxicology testing and covers issues in quality assurance.

  1. ×

    Welcome to OpenBook!

    You're looking at OpenBook, NAP.edu's online reading room since 1999. Based on feedback from you, our users, we've made some improvements that make it easier than ever to read thousands of publications on our website.

    Do you want to take a quick tour of the OpenBook's features?

    No Thanks Take a Tour »
  2. ×

    Show this book's table of contents, where you can jump to any chapter by name.

    « Back Next »
  3. ×

    ...or use these buttons to go back to the previous chapter or skip to the next one.

    « Back Next »
  4. ×

    Jump up to the previous page or down to the next one. Also, you can type in a page number and press Enter to go directly to that page in the book.

    « Back Next »
  5. ×

    Switch between the Original Pages, where you can read the report as it appeared in print, and Text Pages for the web version, where you can highlight and search the text.

    « Back Next »
  6. ×

    To search the entire text of this book, type in your search term here and press Enter.

    « Back Next »
  7. ×

    Share a link to this book page on your preferred social network or via email.

    « Back Next »
  8. ×

    View our suggested citation for this chapter.

    « Back Next »
  9. ×

    Ready to take your reading offline? Click here to buy this book in print or download it as a free PDF, if available.

    « Back Next »
Stay Connected!