
Page 87
3
Who Has Reading Difficulties?
Among the reasons public attention has turned to the need for systematic prevention of reading difficulties are the patterns of reading difficulty cited in the first chapter: failure to learn to read adequately is present among children of low social risk who attend well-funded schools and is much more likely among poor children, among nonwhite children, and among nonnative speakers of English. To begin our consideration of who is likely to have reading difficulties and how many children we are talking about, we outline a number of conceptual issues in identifying and measuring reading difficulties in young children.
MODELS OF READING DIFFICULTIES
The major sources of evidence pertaining to these conceptual issues are several large-scale epidemiological studies in which population-representative samples of children have been examined to determine the incidence, prevalence, characteristics, persistence, and academic outcomes of individuals who have been identified (by various criteria) as having reading difficulties. Prospective longitudinal studies of sample surveys and general populations allow us to deter
Page 88
mine the natural history of a disorder over time, to determine whether the problem is transient or chronic, and how various risk factors relate to outcomes. Earlier studies of representative school-age children are those by Rutter and Yule (1975) in the important Isle of Wight and London studies and, later, studies by Rodgers (1983) in Great Britain and Northern Ireland and by Silva et al. (1985)in Dunedin, New Zealand.
More recently, Shaywitz et al. (1990, 1992) have reported on the results of a sample survey of Connecticut schoolchildren followed longitudinally from kindergarten through high school, and Catts et al. (1997) have reported on reading difficulties in a representative sample of children in Iowa. Together, these studies provide the strongest basis for estimating the prevalence of reading difficulties in childhood. It is also of interest, of course, to compare estimates of reading problems from studies like the National Assessment of Educational Progress (NAEP) and the Prospects Study to those from prospective sample surveys.
Categorical Approach to Estimating Reading Difficulties
In identifying, studying, and treating reading problems, two main kinds of reading difficulties have traditionally been distinguished. Reading disability, also called "dyslexia" and "specific reading retardation," was at first considered to be a qualitatively and etiologically distinct condition that an individual either had or did not have. The condition was viewed as having a biological and perhaps genetic basis, as being invariant over time, and as affecting a small group of children, primarily boys.
A key criterion for identifying dyslexia was the existence of a substantial discrepancy between the child's aptitude (operationalized as IQ) and his or her achievement, reflecting the assumption that the reading problems of a bright and otherwise capable youngster are different in nature from those of a child who is generally less able to cope with schoolwork. In this traditional conceptual model, poor readers who do not meet the criteria for a reading disability are characterized instead as having garden-variety reading problems (or "general reading backwardness"), arising from such causes as poor
Page 89
instruction, low intelligence, and weak motivation. This model is called a "categorical" one, in that reading disability is viewed as a separate diagnostic category, distinct from "normal" reading and from other reading problems. This categorical approach is typically followed in educational classifications, in which a variety of separate diagnostic labels are applied to children who are assumed to have different kinds of reading problems.
A categorical model is still reflected in current education policies for the provision of services to learning-disabled children, affecting in particular those with reading disability. Special education services or programs, for example, require children to qualify for services in specific disability categories, such as mental retardation, specific learning disabilities, speech or language impairment, serious emotional disturbance, multiple disabilities, hearing impairment, visual impairment, deafness-blindness, and other health impairments. Special education services are required by federal and state law and are provided at no cost to parents.
The U.S. Department of Education is mandated by Congress to report annually on the number of disabled children who are receiving assistance through special education programs. According to the most recent data (from the 18th Annual Report to Congress on the Implementation of the Individuals with Disabilities Education Act of the U.S. Department of Education for the 1994-1995 school year), 2,560,121 school-age children ages 6 to 21 with specific learning disabilities are receiving special education services under the Individuals with Disabilities Education Act, Part B and Chapter I. This group of children represents 4.43 percent of the total estimated population of 57,803,809 schoolchildren in this age group. The U.S. Department of Education does not specify the nature of the learning disability, but the generally accepted estimate that reading disability accounts for about 80 percent of all learning disabilities indicates that 3.54 percent of all schoolchildren in the United States (or 2,046,254 children) are ostensibly receiving services for a reading disability (Lerner, 1989).
Of course, these data reflect school-based decisions, using arbitrary cutoffs, subject to local personnel and financial constraints; they clearly underestimate the number of children having difficulties
Page 90
in reading by ignoring those who are just on the other side of an arbitrary categorical boundary (Shaywitz et al., 1992).
In prospective epidemiological studies, the rates of specific reading retardation in Yule et al.'s sample was 3.5 percent of 10-year-olds and 4.5 percent of 14-year-olds on the Isle of Wight and 6 percent of the 10-year-olds in London; the criterion was scores that were two standard deviations (SD) from the mean (Yule et al., 1974). In contrast, Silva et al. (1985) found only 1.2 percent of a sample of New Zealand schoolchildren met the same SD criterion. Similarly, Rodgers (1983), examining populations in Great Britain and Northern Ireland, reported that 2.29 percent of children had scores falling two SD below the mean for reading achievement.
The Connecticut longitudinal study, using a less stringent discrepancy criterion of a 1.5 SD discrepancy between predicted and actual reading achievement based on a regression equation or on a criterion of low achievement in reading, found 17.5 percent of the population of schoolchildren in primary and middle school to have reading difficulties (Shaywitz and Shaywitz, 1996). Other available prevalence data are limited either by the population base or by definitional concerns. For example, in Canada, a privately appointed multidisciplinary committee, the Commission on Emotional and Learning Disorders in Children (1970), estimated that between 10 and 16 percent of school-age children required diagnostic and remedial help in learning. This finding is consistent with findings in U.S. studies that 14.8 percent of students in grades 3 and 4 (Mykelbust and Boshes, 1969) and 14 percent of students in grades 7-11 (Meier, 1971) met criteria for underachievement.
Reviewing both population-based studies and numbers of school-age children receiving special education services, the Interagency Committee on Learning Disabilities (1987), in a report to Congress, estimated the prevalence of learning disabilities as ranging from 5 to 10 percent. The vast majority of children identified as having learning disabilities, and therefore reading difficulties, are identified by grade 4. Standard measures of reading are often inappropriate for identifying reading difficulties in older individuals, particularly those who can identify words accurately but not automatically. Preva-
Page 91
lence estimates based only on children in grade 4 or below will inevitably underestimate reading problems.
Dimensional Approach to Reading Skills
In recent research, strong challenges to the traditional categorical model have been raised. For instance, evidence for qualitative differences between dyslexics and other poor readers has been shown to be sparse, and genetic influences appear to be equivalent for the two categories. Also, for many years it was thought that reading difficulties were much more common in boys than girls. Even today the ratio of boys to girls in samples of students identified by schools or clinics as reading disabled typically ranges from 2:1 to 5:1 or higher (e.g., Critchley, 1970; Finucci and Childs, 1981). When more population-representative samples have been examined, however, much smaller sex ratios have been observed, sometimes approaching unity (e.g., Flynn and Rahbar, 1994; Naiden, 1976; Shaywitz et al., 1990; Wadsworth et al., 1992).
As a result of this research, the categorical distinction between these two kinds of reading difficulties is no longer as widely accepted. A "dimensional" model of individual differences in reading achievement, described below, has been embraced by most researchers, although not yet by a majority of educators (Shaywitz et al., 1992).
Dimensional models are appropriate when human abilities, such as reading skill, are distributed in a statistically normal way along a continuous dimension. From this perspective, reading difficulties form the lower tail of a bell-shaped distribution that shades gradually into normal and superior ranges of reading abilities. The population distribution is bell shaped because relatively fewer individuals have extremely high or extremely low reading scores, and relatively more individuals have intermediate scores. The same factors—biological, cognitive, instructional—are assumed to influence differences in reading skill at all points along the continuum. Therefore, deciding on the precise point on the dimension at which to distinguish normal reading from reading disability is quite arbitrary. In this sense, reading difficulties are analogous to many dimensional disor-
Page 92
ders in nature, such as hypertension (high blood pressure) and obesity. Blood pressure, like most physiological parameters (e.g., heart rate, temperature), varies from individual to individual along a continuum. Somewhere along the gradient from low to high values, a cut-point is imposed to distinguish hypertension from normal blood pressure (see Box 3-1).
Evidence supporting the hypothesis that reading disability represents the lower tail of a normally distributed ability comes from several sources. First, the results of most epidemiological studies support a normal distributional model of reading ability (e.g., Rodgers, 1983; Shaywitz et al., 1992; Silva et al., 1985; Share et al., 1987; van der Wissel and Zegers, 1985), whereas only Stevenson's (1988) research has been consistent with Rutter and Yule's (1975) original findings. Second, data from research in behavioral genetics employing a range of models and techniques (including admixture, segregation, linkage, and twin studies) have also converged to support the conclusion that reading disability is neither distributionally
| BOX 3-1 There is considerable evidence to show that reading difficulties represent not a discrete entity but instead a graded continuum (Shaywitz et al.. 1992). However, the fact that the distribution is a graded continuum does not render the concept of reading difficulty scientifically useless, as many critics would like to argue. Years ago, Ellis (1985) argued that the proper analogy for reading difficulty is a condition like hypertension (high blood pressure). Hypertension is a good analogy because no one doubts that it is a very real health problem, despite the fact that it is operationally defined in a somewhat arbitrary way by choosing a criterion in a continuous distribution. One's blood pressure is located on an uninterrupted continuum from low to dangerously high. Although the line between "normal" and "hypertensive" is drawn somewhat arbitrarily, hypertension is a real and worrisome condition. The question of how prevalent reading difficulty is in a particular population is as meaningful as the question of now prevalent hypertension is. The prevalence of both is dependent on the choice of a cut point in a continuous distribution. |
Page 93
nor etiologically distinct from other types of reading problems (Gilger et al., 1996). Third, many studies that have compared groups of poor readers, who would be assigned to different categories according to the traditional categorical model, have generally found few meaningful differences between them (e.g., Fletcher et al., 1994; Stanovich and Siegel, 1994).
When reading difficulties are understood from a dimensional perspective, it becomes clear that using a dimensionally distributed measure to assign children to categorical groupings (such as special education classifications) can be problematic due to the arbitrariness of the choice of a cut-point for distinguishing normal reading from reading disability. For instance, children who do not quite meet the arbitrary cutoff score have very similar abilities and needs as those of children whose reading levels are just on the other side of the cut-point. In the blood pressure analogy, individuals with values just below the cut-point, although not labeled as hypertensive, share many physical traits and vulnerabilities with those who do meet the arbitrary clinical criterion for hypertension. Also, when reading ability (or blood pressure) is measured, we know that the results can vary somewhat from one test to another. These fluctuations in scores within individuals may shift a child from one side of the cutpoint to the other, leading to the erroneous conclusion that a change in reading status has occurred (Shaywitz et al., 1992). To serve children with reading difficulties effectively, it is essential that the dimensional nature of reading ability be understood and taken into account in making educational decisions—just as in treating hypertension a range of therapies are instituted to benefit those "borderline" as well as those with severe hypertension.
Assessing Reading Difficulties
In terms of the dimensional model, we have defined reading difficulties as the lower tail of a normal distribution of reading ability in the population. In other words, individuals with reading difficulties are those whose achievement levels are lower than those of the rest of the people in the distribution. In general, it is most reasonable to consider as the population of interest the people who
Page 94
have had the same amount of formal reading instruction. That is, there is a distribution of first graders, a distribution of second graders, and so on, and the children at the low end of each are said to have reading difficulties.
A nationally standardized reading test is one that provides information about where a particular test taker's score falls within the distribution that is typical for all children from around the country who are in the same school grade. When using a nationally standardized reading test, therefore, the cut-point for identifying reading difficulties can be set at a particular agreed-on level (e.g., the 25th percentile). The location of the cut-point necessarily determines the incidence and prevalence of reading difficulties in the population.
The situation is complicated, however, by the fact that two sorts of children who have traditionally been viewed as having legitimate reading problems and in need of special help would often fail to qualify for additional assistance if a national norm criterion is the only one used. First, it is well known that the distributions of reading scores in some schools (typically schools with affluent families) are consistently much higher than those for the nation as a whole. In other words, the second-grade distribution in these schools actually resembles, say, the fourth-grade distribution for a school that is more typical of the national average. Many of the poorer readers (relative to their classmates) at such a school will not earn scores that are below a cut-point (such as the 25th percentile) based on national averages. Nevertheless, their teachers, parents, and communities consider these children to have real reading difficulties because their achievement is considerably lower than that of their classmates, despite equivalent schooling.
Second, a key criterion for assignment to the category of reading disability has been a large discrepancy between achievement and aptitude (IQ). This notion of an IQ-achievement discrepancy criterion has been incorporated into many states' guidelines for classifying learning disabilities in schools. Studies have shown that about 75 percent of children who meet an IQ-achievement discrepancy criterion are poor enough readers that they would also be considered to have reading difficulties even if only their reading levels were considered, ignoring IQ (Shaywitz et al., 1992). The other 25 per-
Page 95
cent would not, however, because these children have very high IQs but only average, or slightly below average, reading scores for their grade.
Should these two subgroups—those whose reading levels are low relative to their classmates but not relative to national norms, and those whose reading levels are discrepant from their aptitude but not low in relation to national (or even local) norms—be considered to have reading difficulties? The committee's affirmative answer to this question is based on research findings that (1) the way these children read (i.e., the aspects of the process that are most difficult for them to learn, the kinds of errors they make, and so forth) is very similar to that of children who are poor readers by other criteria (see, e.g., Francis et al., 1996; Fletcher et al., 1994; Shaywitz et al., 1992; Stanovich and Siegel, 1994) and (2) they are at risk for the same kinds of negative educational and occupational outcomes, discussed below, as are other poor readers (Fowler and Scarborough, 1993).
In endorsing an inclusive approach to the identification of reading problems, however, we emphasize that no claim is being made for any distinct qualitative categorical differences between these children and others. Instead, we are simply suggesting that in interpreting reading test scores it is sometimes appropriate to use criteria other than the national distribution to represent the expectations for achievement for some children.
So far, we have considered only how well a child reads relative to an appropriate comparison population—a ''norm-referenced" basis for identifying reading difficulties (i.e., norms). This approach presumes that the population distribution matches expectations about how well children at a given grade "ought" to be reading. Another approach, called "criterion-referenced" assessment, offers a means of addressing this issue. Briefly, this approach requires that standards be established regarding what achievements children should attain at successive points in their educational careers. In principle, such standards can be stated in very narrow terms (e.g., by grade 2, the "silent e" convention should be mastered in reading and spelling) or much more broadly (e.g., by grade 4, all children should be able to read and understand the literal meaning of texts; by grade 11, the reader should be able to "understand complicated information"
Page 96
through reading). Assessments are then designed to determine whether or not children have reached the standards for their grade. The National Assessment of Educational Progress (NAEP) is an important national program that takes this approach.
Based on criterion-referenced assessments, any child who does not demonstrate mastery of the expected skills and knowledge, despite having received instruction in a curriculum that covered the requisite material, would be considered to be having difficulty learning to read. Note that, when this approach is taken, the prevalence of reading difficulties will depend on how challenging the standards are. If higher standards are expected to be met than are currently aimed at, large numbers of children will fail to attain them. If the standards are less challenging, fewer children will be identified as having reading difficulties.
ESTIMATING THE PREVALENCE OF READING DIFFICULTIES
Classroom practitioners, like the designers of the NAEP, are more likely to make criterion-referenced decisions, such as "she doesn't read well enough to understand the fourth-grade history text." Potential employers share this preference; they are looking for high school graduates who can read technical manuals, understand and fill out order forms, and process memos. Educational administrators prefer norm-referencing—"90 percent of the third graders in my school read above third-grade level" or "70 percent of the children in this school district are below average in reading.'' Of course, each of these various approaches leads to a different set of conclusions and implications concerning the incidence of reading difficulties.
In the absence of a widely accepted basis for a national estimate of reading problems, the NAEP results give a limited but useful view. Although the NAEP does not include assessments of decoding, nor of oral reading, and it is not taken by the age range that is the focus of this study, it provides assessment of some comprehension skills of children over age 9. On these limited assessments, average reading achievement has not changed markedly over the last 20 years (NAEP,
Page 97
| TABLE 3-1 Mean Reading Achievement of 9-Year-Olds on the National Assessment of Educational Progress, 1971-1996a | ||||||
| Group/Subgroup | 1971 | 1980 | 1990 | 1992 | 1994 | 1996 |
| National average | 208 | 215 | 209 | 211 | 211 | 212 |
| White | 214 | 221 | 217 | 218 | 218 | 220 |
| Black | 170 | 189 | 182 | 185 | 185 | 190 |
| Hispanic | 190 | 189 | 192 | 186 | 194 | |
| aAll scores are scale scores ranging from 0 to 500. A conservative standard error for the scales is 1.5: since 2 standard errors are most often used to indicate significant differences, a difference of ±3 would be used for this purpose. | ||||||
1997). And following a gain in scores by black children from 1970 to 1980, the white-black gap has remained roughly constant for the last 16 years (see Table 3-1).
NAEP provides estimates of the percentage of children at each grade who are reading at a basic level or below. "Fourth-grade students performing at the basic level should demonstrate an understanding of the overall meaning of what they read. . . . [T]hey should be able to make relatively obvious connections between the text and their own experiences, and extend the ideas in the text by making simple inferences" (NAEP, 1994, p. 42). In the most recent NAEP report (1996), 40 percent of fourth graders, 30 percent of eighth graders, and 25 percent of twelfth graders were reading below this level. Among black and Hispanic students, the percentages of fourth graders reading below the basic level are 69 and 64 percent, respectively—this translates into about 4.5million black and 3.3 million Hispanic children reading very poorly in fourth grade.
Data from the Prospects study (Puma et al., 1997; Herman and Stringfield, 1997) confirm this picture. The mean weighted reading comprehension score for students in the fall semester of first grade in the Prospects national sample was at the 50th percentile. By contrast, for students in schools in which more than 75 percent of all students received free or reduced-price lunches (a measure of high
Page 98
poverty), the mean score for students in the fall semester of first grade was at approximately the 44th percentile. By the spring of third grade, this difference had expanded significantly. Children living in high-poverty areas tended to fall further behind, regardless of their initial reading skill level. In many regards, this finding replicates those from the Coleman report (Coleman et al., 1966) of 30 years earlier, which highlighted the achievement gap related to low incomes. Yet additional analyses from a subsample of Prospects sites, and from the Special Strategies studies conducted in conjunction with the Prospects study (Stringfield et al., 1997), indicate that such differences were not inevitable.
It is the concentration of poor readers in certain ethnic groups and in poor, urban neighborhoods and rural towns that is most worrisome, rather than the overall level of reading among American schoolchildren. Americans do very well in international comparisons of reading—much better, comparatively speaking, than on math or science. In a 1992 study comparing reading skill levels among 9-year-olds in 18 Western nations, U.S. students scored among the highest levels and were second only to students in Finland (see Figure 3-1) (Elley, 1992) .
Despite these heartening findings, the educational careers of 25 to 40 percent of American children are imperiled because they do not read well enough, quickly enough, or easily enough to ensure comprehension in their content courses in middle and secondary school. Although some men and women with reading disability can and do attain significant levels of academic and occupational achievement, more typically poor readers, unless strategic interventions in reading are afforded them, fare poorly on the educational and, subsequently, the occupational ladder. Although difficult to translate into actual dollar amounts, the costs to society are probably quite high in terms of lower productivity, underemployment, mental health services, and other measures.
CONCLUSION
This chapter has examined various issues in identifying and measuring the population of American children with reading difficulties.
Page 99
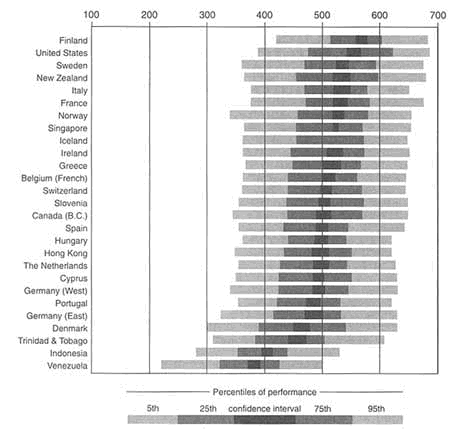
FIGURE 3-1 Countries ranked by fourth-grade reading achievement (narrative score).
Note: The center solid bar indicates a confidence interval around the average reading
proficiency for a country. The 5th, 25th, 75th, and 95th percentiles are indicated by
shaded bars. Source: Elley (1992).
Identifying reading difficulties is essential for young school-age children, to ensure that intervention can be offered early and targeted to the children who need it most. However, this report on the prevention of reading difficulties also addresses prevention efforts that occur before formal instruction in reading. Therefore, we are interested in factors that predict later success and failure in learning to read. These predictors are addressed in the following chapter.


