
Proc. Natl. Acad. Sci. USA
Vol. 95, pp. 5865–5871, May 1998
Colloquium Paper
This paper was presented at the colloquium “Computational Biomolecular Science,” organized by Russell Doolittte, J.Andrew McCammon, and Peter G.Wolynes, held September 11–13, 1997, sponsored by the National Academy of Sciences at the Arnold and Mabel Beckman Center in Irvine, CA.
Highly specific protein sequence motifs for genome analysis
CRAIG G.NEVILL-MANNING, THOMAS D.WU, AND DOUGLAS L.BRUTLAG*
Department of Biochemistry. Stanford University, Stanford, CA 94305–5307
ABSTRACT We present a method for discovering conserved sequence motifs from families of aligned protein sequences. The method has been implemented as a computer program called EMOTIF (http://motif.stanford.edu/emotif). Given an aligned set of protein sequences, EMOTIF generates a set of motifs with a wide range of specificities and sensitivities. EMOTIF also can generate motifs that describe possible subfamilies of a protein superfamily. A disjunction of such motifs often can represent the entire superfamily with high specificity and sensitivity. We have used EMOTIF to generate sets of motifs from all 7,000 protein alignments in the BLOCKS and PRINTS databases. The resulting database, called IDENTIFY (http://motif.stanford.edu/identify), contains more than 50,000 motifs. For each alignment, the database contains several motifs having a probability of matching a false positive that range from 10–10to 10–5. Highly specific motifs are well suited for searching entire proteomes, while generating very few false predictions. IDENTIFY assigns biological functions to 25–30% of all proteins encoded by the Saccharomyces cerevisiae genome and by several bacterial genomes. In particular, IDENTIFY assigned functions to 172 of proteins of unknown function in the yeast genome.
Assigning function to genes in newly sequenced genomes requires highly specific search and comparison methods (1–4). The process involves first identifying all ORFs or coding regions in the genome and translating them into putative protein sequences. These protein sequences then are compared with (i) databases of individual protein sequences, (ii) databases of protein consensus sequences, or (iii) families of aligned proteins (4–9). Finally, the remaining unassigned proteins may be compared with known protein folds or structures by using sequence-structure alignment or threading methods (10–16).
In large-scale searches for biological function, a high level of specificity is critical to minimize the number of false predictions made among the thousands of genes in a genome. Many popular sequence similarity methods calculate expectation values that can be used together with a threshold to guarantee a specific level of false predictions. However such highly specific similarity search methods often sacrifice sensitivity and fail to find all of the members in a particular protein family in a genome. On the other hand, protein sequence motifs usually are generated manually in an attempt to maximize the sensitivity while sacrificing specificity, thus giving rise to relatively high frequencies of false predictions (17, 18).
In this paper, we present a highly systematic and objective method for determining sequence motifs from aligned sets of protein sequences called EMOTIF (19). Unlike most methods that attempt to find a single “best” motif optimized at one level of sensitivity and specificity, EMOTIF generates many possible motifs over a wide range of sensitivity and specificity. Thus, EMOTIF can generate extremely specific motifs that will produce fewer than one expected false prediction per 10l0 tests, as well as more sensitive motifs that cover all members of a family. EMOTIF also can be used to find several highly specific motifs that characterize different subsets of a protein family. By combining these highly specific motifs together in a disjunction, we can potentially describe a protein family with both high specificity and sensitivity.
We have applied EMOTIF to two large data sets of aligned proteins of families, the BLOCKS and the PRINTS databases (7, 9, 20). Together, these data sets contain nearly 7,000 alignments representing protein active sites, substrate binding sites, superfamily signatures, and so on. By applying EMOTIF to all of these alignments, we have generated a database called IDENTIFY, which contains more than 50,000 sequence motifs with specificities varying from one expected false positive prediction in 105 tests to as low as one expected false positive prediction in 1010 tests. IDENTIFY can be used to scan newly sequenced ORFs from genomic sequences for function. Each IDENTIFY motif has an associated specificity, indicating the likelihood that a match is a true or false prediction.
By using the IDENTIFY database of motifs, we have scanned all ORFs in several bacterial genomes and in the yeast genome for function. IDENTIFY was able to determine the function of 25–30% of all of the proteins in these genomes, usually resulting in 3–4 motifs per protein identified. In particular, IDENTIFY was able to assign a function to 172 of the 833 ORFs whose function was labeled as unknown.
METHODS
Motif Substitution Groups. A sequence motif is a particular kind of representation called a regular expression (21). It represents a generalization about the range of variability that occurs in corresponding positions across a family of protein sequences. A sequence motif represents variability by specifying a group of amino acids permitted in that position. In our notation, this group of amino acids is enclosed by brackets, e.g., [ILMV]. When only a single amino acid is allowed in a position, that amino acid is represented by a single character without brackets. On the other hand, when a position has no meaningful conservation, all 20 amino acids are permitted; in that case, we use the wild-card character ‘.’. For a sequence to match a motif, each of the amino acids in the sequence must be permitted by the corresponding group in the motif. In some cases, we may relax this requirement to allow one or more mismatches.
To characterize the types of variability observed in nature, we conducted a study of amino acid groups, by using empirical studies of two databases of protein families. The BLOCKS
©
PNAS is available online at http://www.pnas.org.
* | To whom reprint requests should be addressed at: Department of Biochemistry. Beckman Center B400, Stanford University, Stanford, CA 94305–5307. e-mail: brutlag@stanford.edu. |
database (22) contains short, ungapped regions that are highly conserved, according to sequence characteristics. The HSSP database (23) contains global alignments of sequences based on structural alignments. We examined all possible subsets S of amino acids to find those groups that are well conserved. We had two criteria for conservation: (i) compactness—amino acids within the group should substitute for one another with relatively high frequency, and (ii) isolation—amino acids outside the group should substitute for those in the group with relatively low frequency. These criteria follow those often used in cluster analysis (24).
To measure compactness and isolation, we first used the BLOCKS and HSSP databases to provide a set of conditional counts c(a|S), which equals the total number of occurrences of amino acid a in all aligned positions that contain the group S. Conceptually, we found all aligned positions that contain S. and then tabulated all amino acids from those positions. Then, we computed conditional frequencies
where the quantity f(a|S) is defined only for amino acids a not in group S.
For each group, we computed the expected conditional frequencies and the standard error of the proportion for amino acids outside the group:
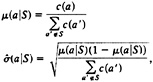
where c(a′) is the marginal count of amino acid a’ over all aligned positions.
We then computed a separation score for each group, as follows:
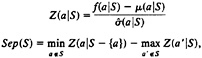
where Z(a|S) is a conditional relative deviate, or Z-score. The first term represents our measure of compactness, and the second term represents our measure of isolation. Based on these separation scores, we found all amino acid groups that had a separation score greater than three standard errors, which is equivalent to a significance level of 0.01. Further details of our analysis are presented in ref. 25.
Our criteria were met by 30 substitution groups in the BLOCKS database and 51 substitution groups in the HSSP database. The HSSP database yielded more groups because of its larger size, and because our criterion is based on statistical significance. Twenty substitution groups were conserved empirically in both databases, and the validation by both databases provides good evidence that these groups are indeed conserved in nature. If we arrange these groups hierarchically, we obtain the set of amino acid groups shown in Fig. 1. We used these substitution groups to define the space of motifs available to describe protein families.
Motif Enumeration and Ranking. A conserved region may be described by many possible motifs, with different levels of coverage and specificity. To better understand the choices involved, consider the sequence alignment in Fig. 2a. We can cover all sequences in the training set if we select the smallest group of amino acids that accounts for all of the amino acids
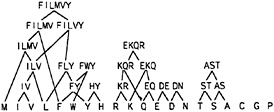
FIG. 1. Substitution groups. Groups of amino acids found to occur together in columns of aligned sequences in both the BLOCKS and HSSP databases. Only groups of amino acids that occur together at a significant frequency and are separated from all other amino acids at a level of significance of less than 0.01 are included. The substitution groups are arranged hierarchically to show relationships between their physical properties.
in each position. For example, every sequence has methionine in the first position, so the first position of the motif should specify M. In the second position, both phenylalanine and tyrosine occur. The smallest group of amino acids from Fig. 1 that accounts for the entire position is [FYW], which allows tryptophan to occur in addition to phenylalanine and tyrosine. Using this group is tantamount to inferring that this position requires an aromatic amino acid. In the third position, no allowable group can account for the diverse amino acids that are observed, so to achieve complete coverage we must place a wild-card character in this position.
The resulting motif, shown in Fig. 2b, has complete coverage, because it describes the entire training set, but it can be affected by problems with the data. Consider again the alignment in Fig. 2a. In the eighth position from the right, every sequence but one contains a leucine. The first sequence, however, contains a proline at this position. This may be the result of a sequencing error, a rare mutation, or a sequence that has been erroneously assigned to the family. In any case, if the first sequence was removed from consideration in the formation of the motif, this position in the motif would change from ‘.’ to L. Doing this reduces the coverage of the motif by one sequence, but makes it more specific.
Even in the absence of problems in the data, motifs with high coverage generally may have low specificity, thereby resulting in false positives. In constructing a motif, we are faced then with a fundamental tradeoff between coverage and sensitivity. The EMOTIF algorithm explores this tradeoff for a particular alignment by exhaustively generating all possible motifs using the allowable substitution groups and quantifying the coverage and specificity for each motif.
Another feature of our example bears discussion. The sequences can be partitioned into two subclasses based on the amino acid in the fourth position. The first group has arginine in this position, whereas the second group has lysine. All sequences in the first group have tyrosine in the final position, whereas none in the second group do. Indeed, partitioning the sequences in this way allows the conserved region to be described by two highly specific motifs, rather than a single, more general one. Fig. 2c shows the motif for the first group. Thirteen positions are more specific than the motif for the entire set of sequences, resulting in an factor of 1010 increase in specificity. Thus, by finding motifs that cover only part of the training set, EMOTIF is potentially able to discover subfamilies within a superfamily and characterize them with a specific motif.
We define specificity as the probability that a random sequence would match the motif. To calculate this, we assume that the distribution of amino acids in each position of a random sequence is independent and identically distributed. We use the observed distribution of amino acids in the SWISSPROT database as an estimate for this distribution. The
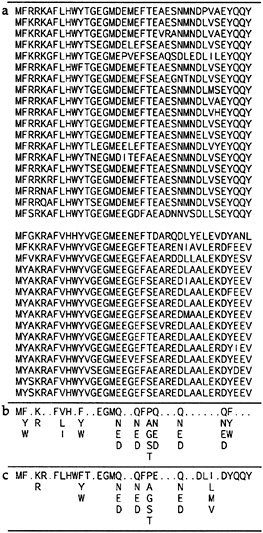
FIG. 2. Aligned block of 34 tubulin proteins and two motifs representing these sequences, (a) An aligned block of 34 tubulin proteins and the sequence variation observed among them, (b) One possible sequence motif for the alignment in a that can be formed by using the amino acid substitution groups from Fig. 1. (c) A much more specific sequence motif that can be used to represent the upper 19 tubulin sequences, which form a group more closely related to each other than to the lower 15 sequences.
specificity of a motif then is simply the product of the probabilities in each position. A wild-card character matches with probability 1.0. and a specific amino acid matches with the probability taken from database. A group of amino acids matches with the sum of the probabilities of the individual amino acids. So the probability of the motif in Fig. 2b is
p(M)·1·[p(F)+p(W)+p(Y)]·[p(K)+p(R)]·1·1p(F)·…·1.
We have found empirically that this estimate accurately predicts false positive rates for matches of motifs against large protein databases, so the assumption of independence of positions is reasonable in practice.
The EMOTIF algorithm exhaustively generates all possible motifs for a particular alignment using the allowable substitution groups, and quantifies the coverage and specificity for each motif. The graph in Fig. 3 illustrates the tradeoff between these quantities. Each point in the graph corresponds to a single motif for the alignment of 159 segments of tubulin sequences similar to those shown in Fig. 2a. The vertical axis is the specificity of the motif, which ranges from 1 to 10–44. The horizontal axis is the coverage of the motif, measured as the number of training sequences that the motif matches. In this case, the training set contains 159 sequences, and motifs covering fewer than 30% of the total (47 sequences) were not generated. The EMOTIF algorithm uses a lower limit on coverage to help prune the search space and to allow all motifs to be generated efficiently. Typically, the lower limit on coverage is 30%, but this value may be specified by the user. Because coverage of the training set is an integer, the graph consists of a series of vertical lines, one for each number of sequences covered. Note that even if two motifs lie in the same vertical line, meaning that they cover the same number of sequences, they do not necessarily cover the same particular subset of sequences.
An ideal motif would lie in the lower right of the graph, with complete coverage and maximum specificity. However, the tradeoff between coverage and sensitivity makes the ideal motif unattainable. Motifs at the extremes are generally undesirable. Motifs in the lower left of the graph are very specific, accounting for only 30% of the training set. Motifs in the upper right are very sensitive, but result in a high number of expected false positives. Because EMOTIF displays the tradeoff between coverage and specificity explicitly, we may choose optimal motifs that achieve a desired level of specificity. One strategy for searching a large database is to require that the expected number of false positives be less than one. The expected number of false positives is approximately equal to the specificity of the motif multiplied by the number of possible match positions in the database. For example, a search of the GenPept protein sequence database, which contains 108 amino acids, achieves fewer than one expected false positive when the motif has a specificity of 10–8 or less. This specifies those motifs below a particular horizontal position in the graph. For searches of smaller databases, the line would be higher, and therefore, we could use more sensitive motifs. For searches of
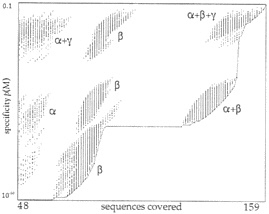
FIG. 3. Enumeration of tubulin motifs by EMOTIF. EMOTIF generates all possible sequence motifs that can cover at least 30% of 159 tubulin sequences in a training set. Each motif is plotted as a dot in the figure where the horizontal axis gives the coverage of the motif (number of sequences covered in the training set), and the vertical axis plots the specificity of the motif as the probability of matching a random protein segment. The motifs occur in vertical lines because coverage is an integer quantity. The lower curve is the Pareto-optimal curve, which represents the most specific motif at each level of sensitivity.
larger databases, the line would be lower, and we would require more specific motifs. Given this restriction, the optimal motif for a particular level of specificity would be the one beneath the line having the highest sensitivity, as approximated by coverage of the training set.
The space of optimal motifs also is reduced by the principle of dominance. For any particular level of coverage, a motif that is more specific dominates one that is less specific. On the graph, for any vertical line, a motif that has fewer expected false positives specificity dominates those with more expected false positives. A similar argument can be made for motifs with a particular level of specificity. A motif with high coverage dominates those with lower coverage. The dominating motifs lie along a Pareto-optimal curve, shown in Fig. 3 as a line along the lower right frontier of motifs. No motif on that line can be made more specific without reducing its coverage, nor be made to cover more sequences without reducing its sensitivity. Therefore, motifs on or near this line should be used for searching tasks. In practice, we select the motif on the Paretooptimal line with maximum coverage at the desired level of specificity.
Disjunctive Motifs. By allowing only part of the training set to be covered, we obtain motifs that may fail to describe an entire family or superfamily. thereby resulting in lower sensitivity. To solve this problem, we use disjunctive motifs to achieve high specificity and sensitivity. After we apply EMOTIF to a given training set and select an optimal motif at a given level of specificity, we can invoke EMOTIF on the sequences that were not covered. This generates a second motif, which in conjunction with the first motif, covers more of the training set than the first motif alone. This process may be continued until some coverage criteria is met, such as coverage of 90% of the training set.
To evaluate the increase in coverage possible with this approach, we obtained disjunctive motifs for each of the 7,000 multiple sequence alignments in the BLOCKS and PRINTS databases. The disjunctive motif strategy requires one parameter: a desired minimum level of specificity. We applied our strategy for five levels of specificity, from 10–6 to 10–10, by factors of 10. For each level of specificity, we measured the number of motifs required to achieve 90% coverage for each sequence alignment. The results of our experiments are shown in Fig. 4. At a specificity level of 10–10, 65% of the sequence alignments had 90% coverage by a single motif, whereas at a specificity level of 10–6, 80% of the blocks had 90% coverage by a single motif. At a specificity level 10–10, 80% of the sequence alignments had 90% coverage by a disjunction of two motifs, whereas at a specificity level of 10–6, nearly 95% of blocks had 90% coverage by a disjunction of two motifs. It appears that for reasonable levels of specificity, one or two motifs are sufficient to cover most sequence alignments reasonably well in these databases.
A disjunction of motifs may identify subfamilies in the training set. Each subfamily can be described specifically by its own motif. For instance, the graph in Fig. 3 shows motifs that are clustered into distinct groups. The clustering suggests the presence of several subfamilies in the training set. In fact, the training set, which consists of tubulins, can be divided biologically into subfamilies, and the various clusters in the figure correspond to motifs that cover α-tubulins only, β-tubulins only, both α- and β-tubulins, and α-, β- and γ-tubulins. We have developed methods for identifying subfamilies optimally using criteria from statistics and minimum description length principles. These methods are discussed in further detail in ref. 19.
The IDENTIFY Motif Database. We used the results of the above experiments to produce a motif database for evaluating individual sequences and searching sequence databases. At each level of specificity, we obtained approximately 10,000 motifs. The collective database of motifs is called the IDENTIFY database. The motifs are grouped according to the level of specificity for which they are optimal. For large databases requiring high specificity, motifs at the 10–10 level are most appropriate. For smaller databases requiring less specificity, motifs at the 10–6 level may be appropriate.
RESULTS
Unidentified ORFs from Yeast. We have applied the IDENTIFY database to predict functions in unidentified ORFs in Saccharomyces cerevisiae. At the time of the experiment (May 1997), there were 6,220 known ORFs in the yeast genome
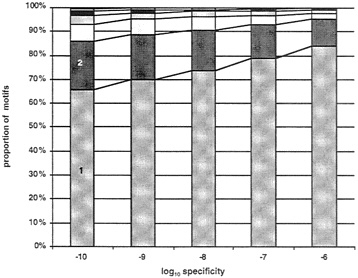
FIG. 4. The number of motifs required to cover at least 90% of the protein family in the IDENTIFY database. EMOTIF was used to generate one or more motifs that cover at least 90% of all the sequences in each of 7,000 alignments in the BLOCKS or PRINTS databases at five different levels of specificity. Plotted are the number of motifs that are required to cover at least 90% of the sequences in the alignment.
database (http://genome-www.stanford.edu/Saccharomyces), of which 833 had no confirmed function (26). We applied the IDENTIFY database to each translated ORF, and assigned a predicted function based on matches to motifs. Table 1 shows how many ORFs are identified by motifs at each level of specificity. For example, using the motifs at a specificity of 10–10, we assigned putative functions to 61 ORFs. Forty-one of these had no annotation whatsoever, indicating that other methods (e.g., BLAST, PROSITE, etc.) had failed to identify any significant homology to a known protein. Based on the calculated specificity of the motifs, along with the number of motifs and size of the ORFs database, the expected number of false positives is 0.02, so it is highly likely that all of the assignments are correct. Relaxing the procedure a little by using motifs with specificity at least 10–9 produces 86 assignments, including 59 not previously annotated. Again, the expected number of false positives is less than one. At the other end of the spectrum, the 10–7 set produced 172 predicted functions, but the expected number of false positives is 17.
To test these 172 predictions, we compared our results with those in the Sacch3D database (http://genome-www.stanford.edu/Sacch3D) (S.Chervitz, J.M.Cherry, and D.Botstein, personal communication). This database compares each of the translated ORFs in S.cerevisiae against proteins of known structure by using sensitive alignment and threading approaches. Of the 833 unidentified ORFs, 83 had functions assigned by Sacch3D alone. 124 had functions assigned by
We analyzed our results at the level of motifs. The BLOCKS and PRINTS databases often contain several sequence alignments for a given family of proteins. Each alignment corresponds to a different conserved segment of the protein. On average, these databases contain three sequence alignments per protein family. Therefore, a match of a sequence to several distinct motifs from the same family provides independent confirmations of the predicted function. In the 48 ORFs with functions assigned by both
Whole Genome Analysis. We applied IDENTIFY to search for functions in all ORFs in several genomes including S.cerevisiae, Haemophilus influenzae, and Methanococcus jannaschii. To assess the performance of IDENTIFY, we tested our assignments against the annotations for each genome as follows. For those ORFs with annotations, we extracted keywords from the description, ignoring common words such as protein, enzyme, and domain. We also extracted significant keywords from the associated entry for the motif from the BLOCKS or PRINTS sequence alignment databases. We considered an assignment correct if the significant keywords from the genomic annotation matched significant keywords from the alignment annotation. If there was no match, then the prediction was incorrect, or the annotations were either insufficient or described
Table 1. Assignment of function to 833 yeast ORFs of unknown function
Specificity | # ORFs assigned | # ORFs assigned with no annotations | # Motifs assigned | Expected # of false motif assignments |
10–10 | 61 | 41 | 179 | 0.02 |
10–9 | 86 | 59 | 238 | 0.2 |
10– 8 | 103 | 69 | 301 | 1.7 |
10–7 | 172 | 121 | 488 | 17 |
the same function differently. To decide among these alternatives, we examined each of the remaining predictions manually (4,647 in total over three genomes).
Table 2 summarizes the predictions for the seven genomes by using motifs from IDENTIFY at different levels of specificity. For each genome and level of specificity, the third column shows the number of correct predictions, as determined by automatic keyword matches. The fourth column contains the number of predictions that could not be verified by automatic keyword matching, but were found to be correct by manual inspection. In the fifth column are the number of predictions that were not confirmed by the annotations. Many of these cases corresponded to ORFs without annotations, whereas other cases showed conflicts between the annotated function and the function predicted by IDENTIFY. The conflicting predictions may be incorrect or may perhaps be plausibly related to the annotated functions. The sixth column shows the number of incorrect predictions expected by chance, based on the number of motifs, their specificity, and the size of the genomes. In the bacterial genomes and in the yeast genome with the most specific motifs, there was less than expected incorrect predictions. The seventh column shows the number of ORFs for which a function was predicted correctly by IDENTIFY. This is different from the number of correct predictions, because each ORF may match several motifs in the database, each resulting in a predicted function. The eighth column shows the total number of ORFs in the entire genome, and the final column shows the percentage of ORFs for which a function was predicted by IDENTIFY.
Depending on the level of specificity used, the IDENTIFY program predicts functions that match the genomic annotation for 22–26% of ORFs in the yeast genome, 28–30% of the ORFs in H.influenzae, and 9–11% of the ORFs in M. jannaschii. The relatively few predictions for M.jannaschii may be because of its evolutionary divergence from those species that have been sequenced more extensively. In addition, the IDENTIFY program predicts several functions that are not confirmed by the genome annotations. Based on a 10–9 level of specificity, we predict novel functions in 31 ORFs in yeast, 33 ORFs in H.influenzae, and 21 ORFs in M.jannaschii. On the average, three motifs are assigned to each ORF that is identified. These ORFs often represent distinct BLOCKS or PRINTS alignments from a single protein family, thus supporting each other in the assignment of a particular function to a protein. Because these ORFs often confirm or support each other, the probability of a false positive prediction is likely to be much less than that of a single motif match.
DISCUSSION
Principled Motif Generation. Motifs, including those in the PROSITE database (17, 18), generally have been generated manually. In this paper, we introduce a method for generating motifs automatically. Automated methods are becoming increasingly important as sequence databases grow. An automated method requires knowledge about sequence conservation. For EMOTIF, this knowledge is encoded as an allowed set of amino acid substitution groups. Although we have presented a empirical analysis that supports a certain set of groups (Fig. 1), the algorithm may be easily adapted to use other sets of amino acid substitution groups. For instance, substitution groups based on chemical principles (27, 28) may be appropriate in certain cases.
Other researchers have generated motifs from a predefined set of substitution groups (29, 30), but these sets of allowable groups often have been too limited. Previous sets of substitution groups generally have been mutually exclusive, meaning that each amino acid may belong to only a single group. In contrast, we use overlapping groups, which allows each amino acid to belong to more than one group. This is biologically
Table 2. Genomes scanned by using IDENTIFY
appropriate, because each amino acid has several properties and can serve different functions, depending on the biochemical context. In some contexts, the size of an amino acid may be critical; in others, its charge may be the conserved property.
By using only an allowed set of substitution groups, we avoid the problem of overfitting, which occurs commonly when motifs are generated manually. Overfitting occurs when a motif is designed to cover all variability in a training set, even when such variability may be caused by errors or may not be biologically meaningful. Errors in training sets may arise for a variety of reasons: (i) the sequence data may contain errors, including insertions, deletions, or substitutions; (ii) one or more sequences may be misaligned; (iii) the sequences may be contaminated, meaning that some sequences in the alignment may not truly belong to a particular family; or (iv) the family may contain subfamilies or subclasses, each of which may generalize well individually, but not together. Biologically meaningless variation occurs when the observed variation is caused by mutations that do not affect the structure or function of the protein. For instance, if a position in a protein family were to contain one example each of alanine. cysteine, and valine, the observed variation likely would be biologically meaningless because we know of no chemical or physical reasons that these three amino acids should be conserved together. Therefore, a motif that contains the group [ACV] would be an example of overfitting the data. A biologically meaningful generalization of the observed variation would depend on the available substitution groups. In our set of substitution groups, these three amino acids would be generalized by the wild-card character.
Nevertheless, groups that are difficult to interpret biologically, such as [ACV], occur frequently in prosite. In that database, motifs are constructed by using 867 distinct amino acid substitution groups. A few groups are used frequently, such as [ILMV], which occurs 826 times in prosite. In fact, the 20 most frequently used groups account for 60% of the groups used by motifs in prosite. On the other hand, the vast majority of distinct groups—more than 70%—occur in only a single motif, and an additional 13% of groups occur in only two motifs. These groups are probably examples of overfitting.
Overfitting is of concern in machine learning, because at some point, further fitting of the training set worsens performance on future test sets. For example, the group [ACV] may cover the training set entirely, but it does not allow for any other amino acid at that position, which may worsen predictive power if, in fact, there is no true conservation at that position.
Enumeration Strategy. EMOTIF uses an enumeration strategy that generates all possible motifs for a given protein family. It is somewhat surprising that, in most cases, EMOTIF is able to enumerate all motifs within a few seconds. Most enumeration strategies in computer science are impractical because the space of solutions is typically so large that a complete enumeration cannot be performed in tractable time. In fact, in an early version of a motif generating program called SeqClass (31), we used a heuristic search strategy to find the single best motif. However, heuristic search strategies are not guaranteed to find the globally optimal solution. On the other hand, an enumerative strategy, if tractable, will guarantee an optimal solution. The tractability of EMOTIF relies on the fact that sequences in a protein family are related, so a single motif may be the most specific one for many different subsets of the training set. Therefore, the space of possible motifs often is limited in practice by the amount of variability possible in the protein family. For additional efficiency,
Enumeration affords three major advantages over heuristic search. First, as mentioned above, it guarantees finding the optimal motif for a particular criterion. Second, an enumeration approach finds optimal motifs for multiple criteria simultaneously. For example, EMOTIF provides optimal motifs for a wide range of specificities, each of which may be useful for a particular task. For example, scanning an entire database may require highly specific motifs, whereas characterizing a single protein sequence may require motifs with much lower specificity. A single run of EMOTIF on a single protein family will find the optimal motif at each level of specificity in advance. We have exploited this advantage in constructing the IDENTIFY database, which provides optimal motifs at different levels of specificity for different tasks.
The third advantage of an enumeration strategy is that it produces a two-dimensional graph, such as in Fig. 3, which characterizes variability in a protein family. The graph provides clues about possible subfamilies, as exemplified by the α-, β-, and γ-tubulins. In addition, the shape of the Pareto-optimal line also gives insight into the structure of the set of sequences. Bulges in the line toward the lower right indicate clusters of
sequences, whereas a hyperbolic line along the top and left of the graph results from sequences that form no discernible clusters. Finally, the graph helps users view the tradeoff between coverage and specificity for various motifs and allows them to select motifs interactively.
Assigning Function to Novel Proteins. The motifs in the IDENTIFY database are particularly valuable for assigning function to newly sequenced proteins, either individually or in large-scale searches. Motifs are particularly well-suited to large-scale searching tasks. Motifs can be used to search a database very quickly, and many fast algorithms for performing regular expression searches exist. In addition, because motifs in the IDENTIFY database are characterized by their specificity, a search using motifs can be tailored to provide maximum sensitivity for a given desired level of specificity and to minimize false positives.
Each motif also is linked to the BLOCKS or PRINTS databases, which describe the family of proteins from which it was derived. Because these protein families typically have several members, a match to a motif may provide an association with several other members of the family. In addition, when a match to a motif is obtained, that motif may be used to search sequence databases, such as SWISSPROT and GenPept. for other proteins that share this motif. This function, which is implemented in IDENTIFY, provides all sequences that may share a closely related form of the motif and thereby represent a particular subfamily containing the motif.
More importantly, most families in the PRINTS and BLOCKS databases are represented by several motifs, each corresponding to a different conserved region of the family. On average, each family has 3–4 conserved regions. The presence of multiple conserved regions increases the sensitivity of a search using motifs. Furthermore, they provide additional certainty about a functional assignment, above the statistical estimate of significance, when several independent motifs match a given unknown sequence.
Motifs, such as those in IDENTIFY, are useful for assigning functions to proteins even in the absence of any homology apart from the limited motif regions. Unlike similarity search methods that weight every position in a sequence alignment to some extent, motifs evaluate only those positions that show conservation in the training set. Hence, motifs can discover function and assign a protein to a family even if that protein is so distantly related that it shows no sequence similarity outside the motifs. This explains why IDENTIFY can assign function to 172 proteins from the yeast genome that have no significant homology to any known protein. The frequency with which IDENTIFY assigns function to these nonhomologous proteins (172/833=21%) is somewhat less than the frequency with which IDENTIFY assigns function to the bulk of the yeast proteins (1,621/6,220=26%). The ability of motifs to assign function by using only homology at particular positions makes them particularly useful for evaluating newly sequenced genomes such as M.jannaschii, most of whose proteins are not homologous to other organisms.
Currently, IDENTIFY assigns function to about 25–30% of novel protein sequences. This limit reflects, among other things, the fraction of newly sequenced proteins that share at least one motif with a current protein family present in the BLOCKS or PRINTS databases. As more genomes are sequenced and more protein families are defined in these databases, IDENTIFY should be able to assign function to a larger fraction of proteins. Despite this current limitation, IDENTIFY is a valuable tool for assignment of function to newly sequenced proteins, especially in those cases where there are no significant sequence similarities by alignment, profile, or hidden Markov methods.
Availability. Access to the EMOTIF and IDENTIFY programs is available over the Internet at http://motif.stanford.edu/emotif and http://motif.stanford.edu/identify. Nonprofit institutions wishing to install the programs locally may send requests to D.L.B. (brutlag@stanford.edu). Commercial and for-profit institutions can license the programs from Pangea Systems Inc. or from Stanford’s Office of Technology Licensing.
This work was supported by a grant from SmithKline Beecham Pharmaceuticals and by Grant LM 05716 from the National Library of Medicine. T.D.W. is a Howard Hughes Medical Institute Physician Postdoctoral Fellow.
1. Scharf, M., Schneider, R., Casari. G., Bork, P., Valencia, A., Ouzounis. C. & Sander, C. (1994) ISMB 2, 348–353.
2. Casari, G., Ouzounis, C., Valencia, A. & Sander, C. (1996) in GeneQuiz II: Automatic Function Assignment for Genome Sequence Analysis, Pacific Symposium and Biocomputing, 1996 (World Scientific, Kohala Coast, HI), pp. 707–709.
3. Altschul, S.F., Madden. T.L., Schaffer, A.A., Zhang, J., Zhang, Z., Miller, W. & Lipman, D.J. (1997) Nucleic Acids Res. 25, 3389–3402.
4. Sonnhammer, E.L., Eddy, S.R. & Durbin, R. (1997) Proteins 28, 405–420.
5. Attwood, T.K., Beck, M.E., Bleasby, A.J. & Parry-Smith, D.J. (1994) Nucleic Acids Res. 22, 3590–3596.
6. Krogh, A., Brown, M., Mian, I.S., Sjolander, K. & Haussler, D. (1994) J. Mol. Biol. 235, 1501–1531.
7. Henikoff, J.G. & Henikoff, S. (1996) Methods Enzymol. 266, 88–105.
8. Gribskov, M. & Veretnik, S. (1996) Methods Enzymol. 266, 198–211.
9. Attwood, T.K., Beck, M.E., Bleasby, A.J., Degtyarenko, K., Michie, A.D. & Parry-Smith, D.J. (1997) Nucleic Acids Res. 25, 212–217.
10. Holm, L. & Sander, C. (1994) Nucleic Acids Res. 22, 3600–3609.
11. Murzin, A.G., Brenner, S.E., Hubbard, T. & Chothia, C. (1995) J. Mol. Biol. 247, 536–540.
12. Holm, L. & Sander, C. (1995) Trends Biochem. Sci. 20, 478–480.
13. Brenner, S.E., Chothia, C., Hubbard, T.J.P. & Murzin, A.G. (1996) Methods Enzymol. 266, 635–642.
14. Orengo, C.A., Michie, A D., Jones, S., Jones, D.T., Swindells, M.B. & Thornton, J.M. (1997) Structure 5, 1093–1108.
15. Holm, L. & Sander, C. (1997) Nucleic Acids Res. 25, 231–234.
16. Hubbard, T.J.P., Murzin, A.G., Brenner, S.E. & Chothia, C. (1997) Nucleic Acids Res. 25, 236–239.
17. Bairoch, A. & Apweiler, R. (1997) Nucleic Acids Res. 25, 31–36.
18. Bairoch, A., Bucher, P. & Hofmann, K. (1997) Nucleic Acids Res. 25, 217–221.
19. Nevill-Manning, C., Sethi, K., Wu, T.D. & Brutlag, D.L. (1997) ISMB-97 4, 202–209.
20. Henikoff, S., Henikoff, J.G., Alford, W.J. & Pietrokovski, S. (1995) Gene 163, GC17–GC26.
21. Hopcroft, J.E. & Ullman, J.D. (1979) Introduction to Automata Theory. Languages and Computation (Addison-Wesley, Reading, MA).
22. Henikoff, J.G., Pietrokovski, S. & Henikoff, S. (1997) Nucleic Acids Res. 25, 222–225.
23. Schneider, R., de Daruvar, A. & Sander, C. (1997) Nucleic Acids Res. 25, 226–230.
24. Jain, A K. & Dubes, R.C. (1988) Algorithms for Clustering Data (Prentice Hall, Englewood Cliffs, NJ).
25. Wu.T.D. & Brutlag, D.L. (1996) ISMB-96 3, 230–240.
26. Cherry, J.M., Ball, C., Weng, S., Juvik, G., Schmidt, R., Adler, C., Dunn, B., Dwight, S., Riles, L., Mortimer, R.K. & Botstein, D. (1997) Nature (London) 387, 67–73.
27. Kidera, A., Yonishi, Y., Masahito, O., Ooi, T. & Scheraga, H.A. (1985) J. Protein Chem. 4, 23–55.
28. Nakai, M., Kidera, A. & Kanehisa, M. (1988) Protein Eng. 2, 93–100.
29. Smith, R.F. & Smith, T.F. (1990) Proc. Natl. Acad. Sci. USA 87, 118–122.
30. Saqi, M.A. & Sternberg, M.J. (1994) Protein Eng. 7, 165–171.
31. Wu, T.D. & Brutlag, D.L. (1995) ISMB 3, 402–410.


