
2
The Burden of Cancer Among Ethnic Minorities and Medically Underserved Populations
This chapter focuses on the burden of cancer among ethnic minorities and medically underserved populations. These deceptively simple terms conceal the degree of complexity involved in defining the populations and the disease. The chapter therefore discusses the problems associated with defining ''minorities" and "underserved individuals," the complexity of the disease commonly known as cancer, the findings that describe the burden of cancer in these groups, and the conclusions derived from those data. The limitations of current federal cancer surveillance data are then discussed, followed by recommendations for the improvement of cancer surveillance among ethnic minority and medically underserved populations. Finally, a discussion of surveillance needs for cancer risk factor and control research is presented, with recommendations for National Institutes of Health (NIH) programs.
Defining the Populations
Federal Definitions of Race and Ethnicity
The simplest way of defining ethnic minority groups would be to use the census counts for the distribution of the total U.S. population, but it would first be necessary to have an appropriate method of classifying the various groups in the population. Herein lies the first problem. The existing federal classification by race and ethnicity was established by the U.S. Office of Management and Budget (OMB) in its Statistical Policy Directive No. 15, "Race and Ethnic Standards for Federal Statistics and Administrative
Reporting" (U.S. Office of Management and Budget, 1997; see Box 2-1). Directive No. 15 requires that all federal agencies collect and report demographic data according to a limited number of racial and ethnic categories, despite criticism that such a classification scheme fails to recognize the increasing ethnic diversity of the U.S. population (U.S. Bureau of the Census, 1998a).
Definitions of race, ethnicity, or origin are not included within the Directive, although the categories and inclusion criteria for the categories are given. OMB specifies four minimum categories for race, which include American Indian or Alaska Native, black or African American, white, and Asian or Pacific Islander. The two categories for data on ethnicity are Hispanic or Latino and Not Hispanic or Not Latino. The latest revisions to the Directive separated the Asian or Pacific Islander populations into two categories, and the term "Hispanic" was changed to "Hispanic or Latino." OMB recommends that these new revisions of the categories be adopted by other federal programs as soon as possible, but the official deadline for adoption of the requirement is January 1, 2003. Modifications to Directive No. 15 were made at the recommendation of the Interagency Committee for the Review of the Racial and Ethnic Standards, which suggested that changes are needed to reflect the nation's population (U.S. Bureau of the Census, 1998a).
A number of scientific and professional organizations have criticized the Directive, stating that the standards lack scientific utility and do not encompass the diverse range of peoples in the United States. For example, the American Anthropological Association (AAA) has commented that OMB has noted the absence of "scientific or anthropological" foundations in developing its categories (American Anthropological Association, 1997). However, the race and ethnicity categories of the Directive are regularly used in federally sponsored scientific research and the interpretations of the findings are often based on the variables of race and ethnicity. (The scientific utility of the concept of race and its use in epidemiologic and health research will be discussed later in this chapter.) AAA also criticized the fact that Directive No. 15 did not explain what is meant by "race" or "origin" or the difference between the two concepts.
In addition, it is not clear whether the race or origins of people were to be chosen by the individual respondent (self-identification) or by others such as interviewers. Many discrepancies in these two methods may arise in the process of sampling populations, although the Bureau of the Census department disagrees (Sink, 1997). In the U.S. census, respondents are allowed to self-identify their racial and ethnic background. In other health research, however, both methods may be used. Further, it is unclear what the impact will be for the reporting of health statistics for population groups of the policy change in the year 2000 census allowing
respondents to report more than one category of racial and ethnic background. Many federal agencies, including the National Cancer Institute (NCI), are attempting to address these challenges to identify populations accurately and trace any possible risk factors affecting their health.
Robert Hahn of the Centers for Disease Control and Prevention (CDC) points out the varying and conflicting definitions of race and ethnicity used by federal agencies, and noted the difficulty this situation creates for comparing populations. He notes four assumptions that must be confronted and redressed to operationalize such an effort (Hahn, 1992). These four assumptions have allowed for an ambiguity about terms that define or characterize racial and ethnic groups. Too often, he argues, it is assumed that:
|
1. |
Government agencies have no conflicting classifications of denominator for disease rates, that classifications do not vary by region, sub-group, or individual, and do not change over time; |
|
2. |
Racial and ethnic categories are understood by the populations questioned and that understanding does not vary by region, sub-group, or individual; |
|
3. |
Survey enumeration, participation, and response rates are high and similar for all racial and ethnic populations; |
|
4. |
Individual responses to questions of racial and ethnic identity are consistent in different surveys and at different times. |
These assumptions lead to inaccurate data by miscounting or misunderstanding both the base population denominator and the numerator(Scrimshaw and McMiller, 1996).
Defining Ethnicity and Race
Anthropologists and other social scientists view "race" and "ethnicity" differently from the federal definitions of population groups noted above. In fact, the federal definitions as currently applied mix and confuse the concepts of race and ethnicity, thereby reinforcing the outmoded concept of race, failing to allow the important concept of ethnicity to be fully functional, and failing to acknowledge recent advances in our understanding of the role that genetics plays in illness and susceptibility to illness. Ethnicity is a recent term that involves how one sees oneself and how one is "seen by others as part of a group on the basis of presumed ancestry and sharing a common destiny with others on the basis of this background" (Zenner, 1996, p. 393). Common threads that may tie one to an ethnic group include skin color, religion, language, customs, ancestry, and occupational or regional features. In addition, persons belonging to the same
|
BOX 2-1 This directive provides standard classifications for recordkeeping, collection, and presentation of data on race and ethnicity in Federal program administrative reporting and statistical activities. These classifications should not be interpreted as being scientific or anthropological in nature, nor should they be viewed as determinants of eligibility for participation in any Federal program. They have been developed in response to needs expressed by both the executive branch and the Congress to provide for the collection and use of compatible, nonduplicated, exchangeable racial and ethnic data by Federal agencies.
|
||||||||||||||||||||||||||||||
When race and ethnicity are collected separately, the number of White and Black persons who are Hispanic must be identifiable, and capable of being reported in that category. If combined format is used to collect racial and ethnic data, the minimum acceptable categories are: American Indian or Alaskan [sic] Native Asian or Pacific Islander Black, not of Hispanic origin Hispanic White, not of Hispanic origin. The category which most closely reflects the individual's recognition in his community should be used for purposes of reporting on persons who are of mixed racial and/or ethnic origins. In no case should the provision of this Directive be construed to limit the collection of data to the categories described above. However, any reporting required which uses more detail shall be organized in such a way that the additional categories can be aggregated into these basic racial/ethnic categories. SOURCE: U.S. Office of Management and Budget (1997). |
||||||||||||||||||||||||
ethnic group share a unique history different from that of other ethnic groups (American Anthropological Association, 1997; Zenner, 1996). Usually, a combination of these features identifies as ethnic group. For example, physical appearance alone does not consistently identify one as belonging to a particular ethnic group; individuals belonging to certain ethnic groups may vary widely in physical appearance (e.g., skin color and hair texture), but they share a common ethnic identity. In the U.S., there are "macro" ethnic groups, such as Latinos or Hispanics, which have many sub-groups, such as Mexicans, Mexican Americans, Cubans, Puerto Ricans, and so on. "Race," in contrast, represents a social or cultural construct of human variability based on perceived differences in biology, physical appearance, and behavior (American Anthropological Association, 1997; Smedley, 1999). The problems with the concept of race for purposes of health research will be discussed later in this chapter.
It is useful in medical and epidemiologic research to distinguish ethnic groups from one another, provided that researchers are clear on the nature and source of human variation (e.g., cultural and behavioral patterns, environmental influences) and their relationship to health outcomes. Membership in an ethnic group may be associated with behavioral and environmental factors which may increase or decrease the likelihood of illness. Thus, the availability of pertinent information for a diversity of ethnic groups would assist both those involved in health research and the population as a whole by indicating if any ethnic differences need to be further explored. Such research, however, can be accomplished only by clearly identifying population groups and understanding that human identity is not static or mutually exclusive. Ethnicity can be a product of interaction between people of different origins and identities. The "boundaries" of ethnic identity, however, are still unclear. Some may identify themselves as belonging to a particular group in one context, and to another group in a different context. "Identities thus become circumstantial" (Zenner, 1996, p. 394). Ethnicity is more flexible, fluid, or perceived, than rigid or fixed. This has been compounded by the increased number of mixed ethnicity families in this country, where individuals may claim two or more ethnicities, or give different ethnic identifications at different times or for different purposes. This makes the proposed revisions for the year 2000 census all the more important, as federally sponsored health research will need to account for individuals who identify themselves as from diverse backgrounds.
Medically Underserved Populations
In the study of cancer, considerable attention has been given to "minorities" as a group, but medically underserved individuals make up a
separate group that cuts across all ethnic groups. The term "medically underserved" is sometimes used to include underinsured or uninsured people; those with low levels of education; rural and inner-city populations; unemployed people; or those with low socioeconomic status (SES). As noted below, no consistent definition of "medically underserved" populations appears in the NIH descriptions of this construct.
Socioeconomic Status
Social class is traditionally measured through socioeconomic indicators such as education, income, and occupation (Adler et al., 1994). Many problems have been linked to low SES such as crime (Reiman, 1997), ill health (Pincus and Callahan, 1995), poor education (Levine and Nidiffer, 1996) and inadequate access to health care. Criticism and controversy have existed over which indexes have appropriately or inappropriately assessed SES to characterize social determinants of health. Schneider (1986) criticizes the use of common measures of SES such as Hollingshead's Four Factor Index of Social Status and Duncan's Socioeconomic Index for all occupations, noting the paucity of information on household patterns, social relationships, and the historical context of people's lives, all of which are factors that may mediate social status. Schneider advocates the use of an index that includes race or ethnicity, a detailed work history, autonomy, and decision-making authority. Lillie-Blanton and LaVeist (1996) agree that these factors in one's social environment (including power arrangements such as political empowerment and individual and community control and influence) are related to one's physical and mental health. A person may be working or living in an environment that exposes him or her to toxins that directly affect health, yet social relations and the conditions of one's neighborhood and work environment can also affect health. The latter experiences may shape the sense of "self worth, influence linkages to social structure and develop adaptive skills" (Lillie-Blanton and La Viest, 1996, p. 85).
Many researchers have made the mistake of attributing the health disparities between groups to race or ethnicity without paying close attention to socioeconomic variability. Lillie-Blanton and LaVeist (1996) explain the social context of health by describing an individual's SES as an "expression of the educational and economic opportunities available in one's social environment" (p. 84). They suggest that SES may be more relevant than race or ethnicity in assessing one's socioeconomic context or social environment. This approach not only incorporates the individual, but also incorporates the social forces that also affect individuals and their health.
Socioeconomic Status and Cancer
A number of factors have been implicated in the relatively poor cancer outcomes for populations of lower SES. Disparities in cancer incidence by SES can be explained by differential levels of exposure to environmental carcinogens, differences in personal health habits (e.g., cigarette smoking, poor diet, and lack of education regarding health risks), and other sociocultural factors. Some negative health behaviors are more prevalent among people of lower SES, but these behaviors should not be considered only as matters of purely personal choice. One's social environment can pose barriers to awareness and to making changes in behavior. Individuals living in poverty, for example, have poorer access to information regarding cancer risks and health behavior, to nutritious foods that may diminish cancer risk, and to role models in the form of cancer survivors who can relay information regarding help-seeking. On the other hand, individuals living in poverty "tend to concentrate on day-to-day survival and often develop a sense of hopelessness and powerlessness and become socially isolated" (Freeman, 1990, p. 18), all of which may contribute to negative health behaviors and decreased survival.
Poverty or low SES has not been implicated as a direct cause for a higher incidence of cancer, although research has found that it has an adverse relationship to survival rates. The American Cancer Society estimates that cancer survival rates of poor individuals are 10 to 15 percent lower than those of other Americans (American Cancer Society, 1990). For example, more affluent women have a higher incidence of breast cancer, yet their survival rates surpass those for women living under disadvantaged socioeconomic conditions. Some of the proposed reasons for the disparities in survival rates between the groups are that women of lower SES are diagnosed or seek treatment at later stages of the disease, compared to women in higher income brackets. The results of the 1990 U.S. National Health Interview Survey show that "poorer" women (i.e., those whose annual income was less than $15,200) were significantly less likely to receive Pap smears and mammograms within the previous year than women whose income was at least $46,500. The survey reported that the upper-income women were twice as likely to have received a Pap smear and almost three times as likely to have had a mammogram within the previous year compared with women of low SES. It is suggested that poorer people have fewer opportunities to seek preventive care because of life obstacles, such as difficulties in finding a job or having job security, arranging child care, and arranging transportation (Harvard Center for Cancer Prevention, 1996).
Friedell, Linville, and Hullet (1998), in discussing cancer control efforts among low-income women, note that
some barriers to increasing participation in cancer control exist at all socioeconomic levels, e.g., lack of information about cancer and about both the availability and the benefit of cancer screening. Fear of what might be found during such an examination mitigates against women either gaining information about cancer or doing something with the information once it is obtained. Other barriers … are more prevalent in low-income, medically underserved populations (Friedell, Linville, and Hullet, 1998, p. 1869).
These barriers are noted in Table 2-1.
Even after the diagnosis of cancer, not all groups of people are given the opportunity to receive the same quality of treatment. In one study reviewing lung cancer treatment patterns for more than 1,800 patients in New England hospitals, researchers found that more educated and privately insured individuals received more aggressive therapy than those without these attributes. In addition, people of lower SES seek health care more often in emergency room settings because they are underinsured or uninsured, which diminishes the continuity of care (Harvard Center for Cancer Prevention, 1996). This lack of proper and continuous care for individuals of lower SES subjects many to higher cancer mortality rates.
Tracing cancer disparities between groups of different SES continues
TABLE 2-1 Barriers to Optimal Cancer Screening, Diagnosis, and Treatment
|
Poverty |
|
Isolation |
|
Geographic |
|
Transportation |
|
Literacy |
|
Age |
|
Cultural |
|
"Fatalism" |
|
Male dominance |
|
Putting the family's needs above one's own |
|
Fear |
|
Fear that cancer will be diagnosed |
|
Fear of the exam (e.g., mammogram and proctoscopy) |
|
Acceptability of the service provided |
|
Physical arrangements, visiting time |
|
Hours of service |
|
Staff attitudes |
|
Language barriers |
|
Cultural understanding by staff |
|
Lack of continuity of care |
|
SOURCE: Friedell et al., (1998), with additions by the study committee. |
to prove to be complex when integrating other factors such as psychological responses to illness. Exposure to psychological stresses and a lack of coping skills or resources also affect survival from cancer. Individuals of lower SES are less likely to have social networks and support than those of higher SES, because the former may lack employment or other social resources in their communities. Such social supports contribute to a sense of connection to others, aiding in one's ability to deal with an illness such as cancer (Harvard Center for Cancer Prevention, 1996). Increased research support in this area may demonstrate that strengthening social support for those with cancer in disadvantaged communities can help to lower mortality rates when the many components of lower SES prove less amenable to intervention.
In summary, poverty "is a proxy for other elements of living, including lack of education, unemployment, substandard housing, poor nutrition, risk-promoting lifestyle and behavior, and diminished access to health care" (Freeman, 1990, p. 18), all of which affect an individual's chances of developing cancer and surviving it.
NCI does not define SES in its report to this committee (National Cancer Institute, 1998b), although it does consider individuals of low income as "special populations," without further defining that group. Nevertheless, studies are underway at NCI to evaluate the extent to which racial and ethnic disparities in cancer incidence may be related to SES factors (see Chapter 3). As noted above, however, the term "low SES" could imply the existence of a number of cancer risk factors, yet for the low-income group within the NCI's "special populations" portfolio the focus seems to be only on the lack of monetary resources. It is therefore unclear what populations are referred to, or what needs should be addressed first (i.e., education, income, insurance status, or social environment) to reduce the risk of cancer.
Ethnicity, Socioeconomic Status and Health
Unfortunately, differences in SES among U.S. ethnic groups exist. When examined collectively, African Americans and Hispanics are three times as likely as whites to be poor, according to U.S. Census Bureau (as reported by the National Center for Health Statistics, 1998; see Table 2-2). Such gaps have been related to inequalities in the levels of educational and economic attainment associated with racial barriers (Gimenez, 1989; Lillie-Blanton and LaVeist, 1996; Harvard Center for Cancer Prevention, 1996). Low SES and ethnic minority status are not synonymous, but many members of ethnic minority groups who also have low income comprise an important proportion of underserved populations in the United States. Low-income ethnic minorities are least likely to have a regular source of
TABLE 2-2 Percentage of People Below Poverty Level, 1996
|
Race and Hispanic Origin |
Percent Below Poverty Level |
|
All races |
12.8 |
|
White |
10.0 |
|
Black of African American |
30.7 |
|
Asian or Pacific Islander |
14.1 |
|
Hispanic origin |
26.2 |
|
American Indian |
31.2 |
|
SOURCE: U.S. Bureau of the Census, as reported by the National Center for Health Statistics (1998). |
|
TABLE 2-3 Percent and Number of Individuals Below Poverty Level, by Ethnicity and Metropolitan Region, 1987
|
|
Metropolitan |
Non-Metropolitan |
||
|
Ethnicity |
Percent |
Number |
Percent |
Number |
|
White |
9.6 |
13.3 million |
13.7 |
6.6 million |
|
African American |
30.7 |
7.3 million |
44.1 |
2.2 million |
|
Hispanic |
27.6 |
3.9 million |
35.6 |
0.6 million |
|
SOURCE: U.S. Congress, Office of Technology Assessment (1990) |
||||
primary care (i.e., family doctor or clinic; Giachello, 1994). Many of these ethnic minority group members do not know where to go when they get sick (Robert Wood Johnson Foundation, 1997). When a regular source of care is reported, it tends to be a public health care facility, a hospital outpatient clinic, or an emergency room (Giachello, 1994; Robert Wood Johnson Foundation, 1997). Members of ethnic minority groups are also least likely to have insurance coverage. Approximately one-third of the Hispanic population does not have health insurance coverage, and the problem is most severe among Mexican Americans and Central Americans (Giachello, 1993; Naranjo, 1992; Valdez et al., 1993).
Conversely, the largest numbers of low-SES persons are white, and many of them have the same health care access problems as do members of minority groups (Friedell, Linville, and Hullet, 1998). Nearly 20 million white Americans lived below the poverty line in 1987, as depicted in Table 2-3, with many of these living in non-metropolitan, rural areas.
Special Populations
NCI states that several ethnic minority populations have ''disturbingly" high cancer incidence and mortality rates for cancers at some sites. These disparities, they state, may be genetically triggered, although the incidence more likely reflects differences in environmental exposures, risk behaviors, and utilization of prevention, screening, treatment, and rehabilitation services (National Cancer Institute, 1998b). These and other "underserved" populations have inadequate access to or reduced rates of utilization of high-quality cancer-related services or cancer programs. NCI refers to these groups as "special populations." In its report, NCI Initiatives for Special Populations, 1998, the Institute writes:
The term "special populations" encompasses those ethnic and racial groups designated by the U.S. government (namely Alaska Natives, American Indians, Native Hawaiians, Pacific Islanders, Asians, Hispanics or Latinos, and Blacks or African Americans). In many instances, these groups experience higher cancer incidence and/or mortality rates, or have been relatively underserved in terms of cancer programs. The National Cancer Institute (NCI) working definition of "special populations" also includes the elderly, low-income and low-literate individuals. The term "underserved" is meant to refer to populations that have inadequate access to, or reduced utilization of, high quality cancer prevention, screening and early detection, treatment, and/or rehabilitation services. (National Cancer Institute, 1998b, p. 1)
The NCI report did not define low-income individuals or groups with low levels of literacy. One could be led to believe that low-income groups could be interchanged with groups living under the poverty level, given that NCI follows OMB's recommendations, as well as those of the U.S. Bureau of the Census, which reports estimates of the numbers of people in the United States living under the poverty level. The low-income group, which is part of the "special populations" group, could possibly include some of the 15.6 percent of Americans who did not have health insurance during all of 1996. It was unclear if the low-income group includes some of the 14.4 million people in 1996 who had incomes of less than half of the poverty level, up from 13.9 million in 1995 (U.S. Bureau of the Census, 1997). NCI notes that the nomenclature for these groups is not standardized across the NIH.
Among the changes being considered within NCI's new Division of Cancer Control and Population Science (DCCPS) is the use of the term "special populations." According to Division Director Barbara Rimer, "the definition of 'special' should emerge from data and will change over time" (Barbara Rimer, National Cancer Institute, communication with the study committee, June 12, 1998). The committee agrees with this statement, and
recognizes the difficulty of trying to classify a heterogeneous group, but the statement did not suggest the kind of data that would prompt a change in name. One way of interpreting this would be to assume that the emphasis would be on risk and that "special populations" would include those populations at highest risk. On the other hand, understanding the factors related to cancer would involve a careful study of the differences between those who are at highest risk and those who are at lowest risk. In the end, it does not matter so much who is defined as "special" as that there be consistency within NCI—and within NIH in general—with respect to how the term is defined.
Defining populations under study is a critical first step to adequately addressing needs of groups most burdened by cancer. The committee therefore offers the following recommendation:
Recommendation 2-1: NIH should develop and implement across all institutes a uniform definition of "special populations" with cancer. This definition should be flexible but should be based on disproportionate or insufficiently studied burdens of cancer, as measured by cancer incidence, morbidity, mortality, and survival statistics.
A consistent definition of "special populations" would therefore result from a thorough assessment of cancer burden among specific groups, including data on cancer incidence, mortality, survival, and access to and utilization of cancer services or cancer programs. Where these data are lacking, special efforts should be made to increase data collection and availability. Presumably, these definitions will change as groups at greatest risk for or experiencing disproportionate cancer burden are identified.
The Burden of Cancer Among Ethnic Minorities and Medically Underserved Populations
Cancer was the eighth leading cause of death in the United States at the beginning of the 20th century. Today it is the second leading cause of death. Current estimates indicate that cancer is responsible for one of every four deaths in the United States, second only to cardiovascular disease. The combined national cost of cancer is estimated to be $104 billion, with costs attributed to loss of productivity, medical care, and mortality (National Cancer Institute, 1996c).
Cancer can take the form of more than 100 different diseases, each of which is characterized by the uncontrolled growth of abnormal cells. Researchers have discovered that changes in the genetic material of cells initiate the abnormal growth. Some of the causes of these genetic changes
are known, such as tobacco smoke, but others remain elusive. However, the study of the distribution of cancer within the population has led to important developments in cancer prevention and control. The identification of factors associated with an increased risk of cancer (e.g., smoking and lung cancer) allows health professionals and public health experts to target areas for interventions and future research.
In studying cancer in relationship to different population groups, one focuses on those forms that are most prevalent in each group and that are associated with the highest rate of mortality. This means that the same forms of cancer may not be of equal importance for all groups. Because there are so many different forms of cancer and because changes in the prevalence of the disease occur slowly, it is neither practical nor necessary to report routinely on all possible forms of cancer. In addition, because of the complexity of classifying groups, because of the different ways of identifying people within groups at the numerator (i.e., the number of specific cases counted) or denominator (i.e., the number of individuals in a defined group) levels, and because small groups with only a few cases of individuals with cancer will result in unreliable rates, one must be aware of the limitations of data analysis and avoid drawing conclusions beyond what is justified by the quality of the data.
Assessing the Burden of Cancer Among U.S. Population Groups
The responsibility within NIH for assessing the burden of cancer among various groups lies with the NCI, and specifically with the Surveillance, Epidemiology and End Results (SEER) program. The goals of the SEER program are as follows (National Cancer Institute, 1998c):
|
1. |
Determine the incidence of cancer in selected geographic areas of the United States with respect to demographic and social characteristics of the population and provide information relevant to the generalizability of the rates to the total U.S. population. |
|
2. |
Using data from the National Center for Health Statistics, provide cancer mortality rates for the total U.S. as well as by county and state. |
|
3. |
Monitor trends in cancer incidence and mortality associated with specific forms of cancer with respect to geographic area and demographic, social, ethnic, and biological characteristics of the population. |
|
4. |
Monitor trends in cancer patient survival with respect to specific forms of cancer, extent of disease, demographic and socioeconomic variables of prognostic importance, and patterns of care. |
|
5. |
Identify factors related to the length and quality of patient survival through special studies of treatment patterns and other aspects of medical care. |
|
6. |
Provide a basis for cancer control interventions through the identification of subgroups of the population at high risk of cancer. These groups may be defined by geographic location, demographic variables, variables reflecting socioeconomic status, environmental and occupational exposures, biological characteristics, and factors which measure the effects of host and environment interactions. |
|
7. |
Conduct surveys of selected subgroups of the covered populations which provide data on the prevalence of cancer risk factors and screening, knowledge, and attitudes related to cancer control. |
|
8. |
Promote research studies measuring progress in cancer control and that link information from the biomedical and social sciences. |
|
9. |
Conduct studies of multiple primary cancers with particular emphasis on the identification of iatrogenic cancers. |
|
10. |
Encourage specialty training in epidemiology, biostatistics, and tumor registry methodology, operation, and management. |
Data collection for the SEER program began in 1973 and included the entire states of Connecticut, Iowa, New Mexico, Utah, and Hawaii, and the metropolitan areas of Detroit and San Francisco-Oakland. These seven areas were selected both because of their diverse ethnic subgroups and because of ongoing registration activities. The Commonwealth of Puerto Rico was also included as a participant to "monitor cancer incidence in an industrially developing area with overall low cancer risk" (National Cancer Institute, 1998c, p. 35). Coverage of the SEER program was expanded in 1974 to include representation from southern (New Orleans, Louisiana) and northwestern (Seattle-Puget Sound in Washington state) regions of the country which were not covered in the initial program. The program was further expanded in 1975 to include the metropolitan area of Atlanta, Georgia, which increased coverage of the African-American population, and was expanded again in 1979 to include 10 rural counties in Georgia to provide coverage of a rural, African-American population of 50,000. In 1983, a four-county area of New Jersey was added to increase coverage of African Americans and Hispanics. New Orleans and New Jersey were subsequently dropped from the program for "technical reasons" (National Cancer Institute, 1998c).
In early 1988, an extramural panel of epidemiologists, clinical oncologists, and pathologists was convened to review the accomplishments of the SEER program and make recommendations for the future. They recommended that the scope be expanded to cover a much wider range of surveillance. Specifically, the committee recommended that the "registration areas should be expanded to achieve adequate coverage of those populations—such as ethnic groups, rural dwellers, and the economically deprived—that are not yet sufficiently represented" (National Cancer Institute,
1998c, p. 36). In response to these recommendations, the SEER program was expanded in 1992 to include the county of Los Angeles and the San Jose-Monterey area of California to further increase representation of Hispanics and other ethnic groups of interest. This resulted in a 46 percent increase in the overall, population covered by the SEER program, and increases of 41 percent for African Americans and 223 percent for Hispanics. The relative increases for other groups were also substantial. The current coverage areas of the 11 SEER program contractors are shown in Table 2-4.
In 1997, the NCI Cancer Control Review Group also recommended that SEER program coverage "be expanded to include several populations not adequately represented: Appalachia; the rural south (with emphasis
TABLE 2-4 Areas Covered by the 11 SEER Program Contractors
|
Registry Location |
Year of Entry |
First Full Year of Data |
Coverage Area |
|
Utah |
1973 |
1973 |
Entire state |
|
Connecticut |
1973 |
1973 |
Entire state |
|
Iowa |
1973 |
1973 |
Entire state |
|
New Mexico |
1973 |
1973 |
Entire state |
|
Hawaii |
1973 |
1973 |
Entire state |
|
Detroit, Michigan |
1973 |
1973 |
Macomb, Oakland, and Wayne counties |
|
San Francisco-Oakland, California |
1973 |
1973 |
Alameda, Contra Costa, Marin, San Francisco, and San Mateo counties |
|
Seattle, Washington |
1974 |
1975 |
Clallam, Grays Harbor, Island, Jefferson, King, Kitsap, Mason, Pierce, San Juan, Skagit, Snohomish, Thurston, and Whatcom counties |
|
Atlanta, Georgia |
1974 |
1975 |
Clayton, Cobb, DeKalb, Fulton, and Gwinnet counties |
|
Rural Georgia |
1978 |
1979 |
Glasock, Greene Hancock, Jasper, Jefferson, Morgan, Putnam, Taliaferro, Warren, and Washington counties |
|
San Jose-Monterey, California |
1992 |
1993 |
Monterey, San Benito, Santa Clara, and Santa Cruz counties |
|
Los Angeles, California |
1992 |
1993 |
Los Angeles County |
|
SOURCE: Miller et al., (1996). |
|||
on African Americans); Native Americans; and Hispanics from Cuban, Puerto Rican, and similar ancestries" (National Cancer Institute, 1997a, p. 22–23). To date, this recommendation has not been fully implemented, although it is under study by NCI.
Representation of Ethnic Minorities and Underserved Populations in the SEER Program
With regard to the current sampling configuration, it is apparent that the ethnic minority populations are not equally distributed across the SEER program regions (Miller et al., 1996). For example, most of the SEER program Hispanic population lives in California (69 percent), and Mexican Americans account for the majority of the Hispanic population in that area. Therefore, results from the SEER program may not reflect the life-style, environment, or cancer burden among Hispanic groups in other geographic areas such as the Northeast and Florida. Similarly, two-thirds of the Chinese population covered by the SEER program lives in California, as does 54 percent of the Korean population. Half of the SEER program's Japanese population lives in Hawaii, and 40 percent lives in areas of California. The SEER program's urban African-American population is more evenly distributed across the country, with 28 percent in Los Angeles, 25 percent in Detroit, 19 percent in Atlanta, 12 percent in San Francisco, and 8 percent in Connecticut. However, current representation of African Americans in rural areas is limited primarily to the 10 rural counties in Georgia. Numbering approximately 50,000, these African Americans are poorer and less well-educated than whites in the same counties. The majority of the American Indians in the SEER program registry live in New Mexico and Arizona, although the American Indian population resides primarily in other regions of the United States.
The overall percentage of people living below the poverty level and the number of high school graduates in the SEER program registry are similar to those among adults in the United States (13 percent and 78 percent, respectively). Ethnic minority groups are intentionally overrepresented in the SEER program to ensure adequate numbers for statistical purposes (i.e., to allow the enumeration of cancer rates). The populations covered by the SEER program areas, based on the 1990 Census, are shown in Table 2-5 (Miller et al., 1996).
However, even with this expanded coverage, the data for smaller populations are less precise than those for larger groups and must be viewed with caution. Another difficulty in interpreting information from the SEER program is the manner in which racial or ethnic group membership is determined. SEER program data on cancer cases are based on information
TABLE 2-5 Populations Covered by the 11 SEER Program Areas
|
Racial or Ethnic Group |
U.S. Population Size |
Percent Covered by SEER Program |
|
Total |
248,710,000 |
13.9 |
|
White |
199,686,000 |
12.5 |
|
Black |
29,968,000 |
12.3 |
|
Hispanic |
22,354,000 |
24.9 |
|
Native American |
1,959,000 |
27.2 |
|
Chinese |
1,645,000 |
43.0 |
|
Filipino |
1,407,000 |
49.2 |
|
Japanese |
848,000 |
59.9 |
|
Korean |
799,000 |
33.8 |
|
Vietnamese |
615,000 |
30.7 |
|
Hawaiian |
211,000 |
77.6 |
|
SOURCE: Miller et al., (1996). |
||
in medical records or death certificates, whereas the U.S. Census uses self-designation of race or ethnicity. Surname lists were used to improve the identification of several groups (Hispanic, Chinese, Filipino, Japanese and Korean patients with cancer). These sources of error, however, indicate that "the cancer rates are best used to identify general racial/ethnic patterns of cancer" (Miller et al., 1996, p. 8).
Measuring Progress Against Cancer
The SEER program registry reports on three important pieces of information for selected populations: (1) the occurrence of cancer (incidence); (2) rate of death from cancer (mortality), as reported by the National Center for Health Statistics (NCHS); and (3) the length of survival following cancer diagnosis (survival rate). Incidence measures the frequency of cancer in a group or population. Decreases in cancer incidence can indicate successful efforts in the prevention of cancer. For example, the incidence of cervical cancer has decreased in the United States since the advent of the Pap smear in the 1940s, which detects cervical lesions for treatment before they become cancerous. Conversely, an increase in the prevalence of smoking among women has been reflected in increasing rates of lung cancer in this group. Typically, as in the case of lung cancer among women, increased incidences of cancer precede an increase in mortality (Extramural Committee to Assess Measures of Progress Against Cancer, 1990).
Mortality rates remain the most important measure of the overall
progress against cancer. Decreasing rates of death from cancer reflect improvements in both prevention and treatment. Rates of mortality from cancer were steadily increasing in the United States since they were first measured by the SEER program in 1973. However, the recent "Report Card to the Nation" on progress against cancer indicates that this trend was reversed for the first time during 1991–1995, when a decrease in overall cancer mortality in the United States could be shown (Wingo et al., 1998). However, this may not reflect trends in the cancer burden experienced by ethnic minorities and underserved groups.
SEER program data are the major source for cancer survival statistics in the United States, and one of the biggest accomplishments of the War on Cancer has been the ability to measure improvements in the rate of survival among patients with some cancers (American Cancer Society, 1997). Advances in diagnosis and treatment have improved the overall rate of survival among these populations from one in four cancer patients in 1930 to one in two patients today.
Today, no single database provides information on incidence, mortality, and survival data on all cancer cases in the United States. Therefore, SEER program data are frequently used as an estimate of cancer rates in this country. Data from the SEER program are used by legislators, health professionals, advocacy groups, educators, patients, and the public to guide cancer prevention and control efforts, and to allocate funds for research and treatment based on the assumption that SEER program data can be extrapolated to geographic areas and populations not covered by the SEER program. Unfortunately, this assumption does not hold for ethnic minorities and medically underserved populations. It is important that cancer surveillance information truly reflect the national populations for which programs are to be developed if the War on Cancer is to be effective.
Cancer Burden Among Ethnic Minority and Underserved Populations—Existing SEER Program Data
Cancer can strike persons of any age, race, gender or SES. However, the occurrence of cancer, mortality rates, and length of survival can vary from group to group. In fact, research suggests that the cancer experience of ethnic minorities and underserved populations is very different than that of the majority of Americans. Data collected by the SEER program were used to target cancer prevention and control efforts in minorities beginning in 1985, when then Secretary of Health and Human Services Margaret M. Heckler noted a "stubborn disparity" in the cancer experience of minorities in comparison to the nation as a whole (U.S. Department of Health and Human Services, 1985). The SEER program registry
does not currently provide reports regarding SES and cancer. Therefore, the discussion in this section is limited to patterns of disease according to the prevailing racial and ethnic classifications.
Cancer Incidence Among Ethnic Minorities
In the United States, African American males experience cancer approximately 15 percent more frequently than white men, according to SEER program data, and have the highest overall incidence of cancer among all racial groups (Miller et al., 1996). This trend is consistent when major sites of cancer (colon and rectum, lung and bronchus, prostate, and stomach) are examined (see Table 2-6). However, it is noteworthy that the incidence of lung cancer in 1992 among white men in Kentucky (111 per 100,000) was almost the same as that reported for African American men in the SEER program data. In Appalachian Kentucky, a region characterized by high poverty, the incidence of lung cancer among white males in 1992 was 127 per 100,000 (Gilbert Friedell, Director for Cancer Control, Kentucky Cancer Program, personal communication, 1998).
TABLE 2-6 Cancer Incidence at Selected Sites Among U.S. Men by Racial or Ethnic Group, Age Adjusted to 1970 U.S. Standardsa
|
|
Incidence per 100,000 Population |
||||
|
Racial or Ethnic Group |
Stomach |
Colon and Rectum |
Lung and Bronchus |
Prostate |
All Sites |
|
Alaska Native |
27.2 |
79.7 |
81.1 |
46.1 |
372 |
|
American Indian (New Mexico) |
18.6 |
14.4 |
52.5 |
196 |
|
|
Black |
17.9 |
60.7 |
117.0 |
180.6 |
560 |
|
Chinese |
15.7 |
44.8 |
52.1 |
46.0 |
282 |
|
Filipino |
8.5 |
35.4 |
52.6 |
69.8 |
274 |
|
Hawaiian |
20.5 |
42.4 |
89.0 |
57.2 |
340 |
|
Japanese |
30.5 |
64.1 |
43.0 |
88.0 |
322 |
|
Korean |
48.9 |
31.7 |
53.2 |
24.2 |
266 |
|
Vietnamese |
25.8 |
30.5 |
70.9 |
40.0 |
326 |
|
Hispanic (total) |
15.3 |
38.3 |
41.8 |
89.0 |
319 |
|
White, non-Hispanicc |
9.6 |
57.6 |
79.0 |
137.9 |
481 |
|
a SEER program estimates are from 1988 to 1992. b SEER program does not calculate incidence when fewer than 25 cases are reported. c Includes medically underserved white, non-Hispanic males among whom the cancer incidence differs from that among the majority white, non-Hispanic population. SOURCE: Miller et al., (1996). |
|||||
In general, other ethnic minority groups among the U.S. population have an overall cancer incidence rate that is lower than that of white, non-Hispanic Americans. However, examination of cancer incidence by site of diagnosis and ethnic group suggests several areas of concern. All ethnic minority groups have higher rates of stomach cancer than the majority of white Americans. Korean males, for example, experience up to a fivefold increased incidence of stomach cancer compared to the majority of white Americans (Table 2-6). Similarly, disproportionate rates of cancer of the cervix are observed in many minority women (Table 2-7). For example, African-American and Hispanic women are twice as likely as white women to receive a diagnosis of cervical cancer. However, it is noteworthy that the incidence of cervical cancer among white women in Appalachian Kentucky (14.9 per 100,000) was almost twice as high as the incidence among white women and almost the same as the incidence among African-American women in the United States, according to SEER program data (Friedell, 1992). The rate of cervical cancer among Vietnamese women is an alarming 43.0 per 100,000, whereas it is 7.5 per 100,000 among U.S. white women.
Mortality Among Ethnic Minorities
Among all ethnic groups in the United States, African-American males have the highest overall rate of mortality from cancer (Miller et al., 1996; see Table 2-8). Rates of mortality from prostate cancer are notably high at two to five times higher than the level seen among other groups. Rates of mortality from lung cancer are also high among African-American males (30 percent higher than that among white males).
Examination by site of cancer and ethnic group indicates that ethnic minorities have the highest rate of mortality from stomach cancer. Rates of mortality from cancer of the cervix are also elevated among many groups of ethnic minority women (see Table 2-9). Cancer mortality rates for Native Americans were not reported because of a low incidence (fewer than 25 cases), and information on rates among Koreans and Vietnamese were also not available.
Cancer Survival Among Ethnic Minorities
Examination of survival data from the SEER program (1978 to 1981) gives a dismal picture of progress against cancer in ethnic minorities (Bacquet and Ringen, 1986). Although overall incidence and rates of mortality from cancer for many ethnic minority groups are low in comparison to those for the majority of Americans, survival from cancer is consistently poorer in these groups (Table 2-10). Today, half of all whites with cancer
TABLE 2-7 Cancer Incidence at Selected Sites Among U.S. Women by Racial or Ethnic Group, Age Adjusted to 1970 U.S. Standardsa
|
|
Incidence per 100,000 Population |
|||||
|
Racial or Ethnic Group |
Stomach |
Colon and Rectum |
Lung and Bronchus |
Breast |
Cervix Uteri |
All Sites |
|
Alaska Native |
67.4 |
50.6 |
78.9 |
15.8 |
348 |
|
|
American Indian (New Mexico) |
15.3 |
31.6 |
9.9 |
180 |
||
|
Black |
7.6 |
45.5 |
44.2 |
95.4 |
13.2 |
326 |
|
Chinese |
8.3 |
33.6 |
25.3 |
55.0 |
7.3 |
213 |
|
Filipino |
5.3 |
20.9 |
17.5 |
73.1 |
9.6 |
224 |
|
Hawaiian |
13.0 |
30.5 |
43.0 |
105.6 |
9.3 |
321 |
|
Japanese |
15.3 |
39.5 |
15.2 |
82.3 |
5.8 |
241 |
|
Korean |
19.1 |
21.9 |
16.0 |
28.5 |
15.2 |
180 |
|
Vietnamese |
25.8 |
27.1 |
31.2 |
37.5 |
43.0 |
273 |
|
Hispanic (total) |
15.3 |
24.7 |
19.5 |
69.8 |
16.2 |
243 |
|
White, non-Hispanicc |
9.6 |
39.2 |
43.7 |
115.7 |
7.5 |
354 |
|
a SEER program estimates are from 1988 to 1992. b SEER program does not calculate incidence when fewer than 25 cases are reported. c Includes medically underserved white, non-Hispanic males among whom the cancer incidence differs from that among the majority white, non-Hispanic population. SOURCE: Miller et al., (1996). |
||||||
TABLE 2-8 Cancer Mortality at Selected Sites Among U.S. Men by Racial or Ethnic Group, Age Adjusted to 1970 U.S. Standardsa
|
|
Deaths per 100,000 Population |
||||
|
Racial or Ethnic Group |
Stomach |
Colon and Rectum |
Lung and Bronchus |
Prostate |
All Sites |
|
Alaska Native |
27.2 |
69.4 |
225 |
||
|
American Indian (New Mexico) |
16.2 |
123 |
|||
|
Black |
13.6 |
28.2 |
44.2 |
53.7 |
319 |
|
Chinese |
10.5 |
15.7 |
25.3 |
6.6 |
139 |
|
Filipino |
3.6 |
11.4 |
17.5 |
13.5 |
105 |
|
Hawaiian |
14.4 |
23.7 |
43.0 |
19.9 |
239 |
|
Japanese |
17.4 |
20.5 |
15.2 |
11.7 |
133 |
|
Korean |
NA |
NA |
16.0 |
NA |
NA |
|
Vietnamese |
NA |
NA |
31.2 |
NA |
NA |
|
Hispanic (Total) |
8.4 |
12.8 |
19.5 |
15.3 |
129 |
|
White, non-Hispanicc |
6.0 |
23.4 |
43.7 |
24.4 |
217 |
|
a SEER program estimates are from 1988 to 1992. b SEER program does not calculate mortality when fewer than 25 cases are reported. c Includes medically underserved white, non-Hispanic males among whom the cancer mortality differs from that among the majority white, non-Hispanic population. SOURCE: Miller et al., (1996). |
|||||
TABLE 2-9 Cancer Mortality at Selected Sites Among U.S. Women by Racial or Ethnic Group, Age Adjusted to 1970 U.S. Standardsa
|
|
Incidence per 100,000 Population |
|||||
|
Racial or Ethnic Group |
Stomach |
Colon and Rectum |
Lung and Bronchus |
Breast |
Cervix Uteri |
All Sites |
|
Alaska Native |
24.0 |
45.3 |
179 |
|||
|
American Indian (New Mexico) |
99 |
|||||
|
Black |
5.6 |
20.4 |
31.5 |
31.4 |
6.7 |
168 |
|
Chinese |
4.8 |
10.5 |
18.5 |
11.2 |
2.6 |
86 |
|
Filipino |
2.5 |
5.8 |
10.0 |
11.9 |
2.4 |
63 |
|
Hawaiian |
12.8 |
11.4 |
44.1 |
25.0 |
b |
168 |
|
Japanese |
9.3 |
12.3 |
12.9 |
12.5 |
1.5 |
88 |
|
Korean |
NAb |
NA |
NA |
NA |
NA |
NA |
|
Vietnamese |
NA |
NA |
NA |
NA |
NA |
NA |
|
Hispanic (total) |
4.2 |
7.3 |
10.8 |
15.0 |
3.4 |
85 |
|
White, non-Hispanic |
2.7 |
15.6 |
32.9 |
27.7 |
2.5 |
143 |
|
a SEER program estimates are from 1988 to 1992. b SEER program does not calculate mortality when fewer than 25 cases are reported. SOURCE: Miller et al., (1996). |
||||||
TABLE 2-10 Five-Year Relative Survival Rates by Selected Sites Among Racial or Ethnic Groups in the United Statesa
|
Racial or Ethnic Group |
Colon and Rectum |
Lung and Bronchus |
Female Breast |
Cervix Uteri |
All Sites |
|
Native American |
37 |
5 |
53 |
67 |
34 |
|
Black |
44 |
11 |
63 |
63 |
38 |
|
Chinese |
50 |
15 |
78 |
72 |
44 |
|
Filipino |
41 |
12 |
72 |
72 |
46 |
|
Hawaiian |
51 |
16 |
76 |
73 |
44 |
|
Japanese |
58 |
14 |
85 |
72 |
51 |
|
Korean |
NAb |
NA |
NA |
NA |
NA |
|
Vietnamese |
NA |
NA |
NA |
NA |
NA |
|
Hispanic (total) |
46 |
11 |
72 |
69 |
47 |
|
White, non-Hispanic |
51 |
12 |
75 |
68 |
50 |
|
a Percentage (both sexes) surviving 5 years following cancer diagnosis; SEER program estimates are from 1978 to 1981. b SEER program does not calculate incidence when fewer than 25 cases are reported. SOURCE: Miller et al., (1996). |
|||||
will be alive 5 years from the time of diagnosis. In contrast, 5-year survival rates among African Americans and Native Americans are considerably reduced (38 percent and 34 percent, respectively). Similar patterns are seen, for example, for breast cancer among females and cancers of the colon and rectum. The 5-year breast cancer survival rate among U.S. white women is 75 percent, whereas the rates are 63 percent among African Americans and 53 percent among Native American women. Survival rates for cancer of the colon and rectum are 51 percent among U.S. whites, 41 percent among Filipinos, and 37 percent among Native Americans. Updated survival rates (1960 to 1992), which are available only for African Americans, support the suggested picture of poor survival among ethnic minority populations.
Thus, the effort to improve survival rates appears to have been least effective for members of ethnic minority groups. This has largely been attributed to late stage at diagnosis, perhaps in part due the limited use of early-detection services and access to state-of-the-art treatment.
Other Data Sources
Information from sources other than the SEER program, such as other national databases, special collaborative reports, or the results of independent
researchers, serve as valuable resources in assessing the cancer burden among members of ethnic minority and medically underserved groups. The discussion in this section highlights some of the major information available and compares the findings to those of the SEER program when appropriate.
National Center for Health Statistics
NCHS collects all vital health statistics in the United States and has virtually complete data on all causes of death, including cancer. Using NCHS data, Frey et al., (1992) compared the rate of mortality from cancer among SEER programs registry participants to that among the total U.S. population and found that in most cases the SEER program provides an accurate picture of rates of mortality from cancer for the entire U.S. population. However, SEER program data failed to identify statistically significant trends in rates of mortality from cancer among ethnic minorities and in the rates of mortality from relatively rare cancers due to the small numbers of cases such types of cancer. For example, the SEER program failed to identify significant increases in mortality from cancers of the colon and rectum among African-American males.
The most disturbing highlight of this study was the lack of a consistent pattern of nonrepresentativeness of the SEER program data:
These results should be reviewed in the context of the underlying issue that motivated these analyses. In particular, the fact that SEER data are frequently used in lieu of national estimates for cancer incidence, survival, and in some cases mortality has created a need for a systematic understanding of the degree of representativeness in the SEER data. This need is especially acute insofar as the SEER data are used not just to provide a summary of experiences, but also to establish baselines and projections for future trends. (Frey et al., 1992, p. 876)
Future work in understanding the differences between the SEER program data and the actual data for the U.S. population may be used to adjust SEER program data to ensure that they accurately describe the national cancer burden.
State Tumor Registries
The National Program of Cancer Registries (NPCR) was established by the U.S. Congress in 1992 to enable states to enhance existing cancer registries or to establish new cancer registries through funding and technical assistance from the CDC (Centers for Disease Control and Prevention, 1998). At this time some states have excellent registries, but 10 states did
not begin registries until 1990 and half the states have had one for less than 10 years. Most of these registries currently collect and report incidence, tumor diagnosis and stage, and first course of treatment, but several have become or are becoming longitudinal registries collecting follow-up information regarding subsequent treatment and survival.
These registries complement and cooperate with other national databases, primarily through the North American Association of Central Cancer Registries (NAACCR). Sponsoring members of NAACCR include NCI, CDC, the American Cancer Society, the American College of Surgeons, the American Joint Committee on Cancer, Laboratory Centre for Disease Control Health Canada, Statistics Canada, and the National Cancer Registrars Association. Dr. Brenda Edwards of NCI serves as permanent Secretary and as an ex-officio member of the Board of Directors of NAACCR. All SEER program registries and all other central cancer registries in the U.S. are members of NAACCR. Cancer statistics from the non-SEER program state cancer registries are published annually by NAACCR together with those of the five SEER program-supported state registries. This is the closest approximation to a national cancer registry report available in the United States. Published data, however, are limited to only African American and white racial classifications, and no survival data are included in these reports. The usefulness of this aggregate information from NAACCR is limited, but this database—including information from both the SEER program and NPCR-supported state registries—will become increasingly useful as more state registries improve the completeness and quality of their data collection and analysis.
Through a separate activity NAACCR is now responsible on a voluntary basis for quality assurance review of state supported cancer registries. After extensive consideration, NAACCR has established an annual program of certification based on the completeness, timeliness, and quality of data collection and reporting. In its first year of operation 36 U.S. and Canadian registries, including all SEER program registries, applied for certification. Twenty-seven were awarded certificates. Every registry is encouraged to submit data annually for review. The intent of NAACCR and NPCR is to have all state-funded (and SEER program) registries be certified annually by NAACCR. All registries are also encouraged to become longitudinal registries in time. When that happens, a truly national picture of cancer incidence, mortality, and survival will be available in the U.S.
Data collected by state cancer registries highlight some important regional differences in cancer rates that are not ascertained by the SEER program and illustrate the need to have state-specific data in order to develop and evaluate cancer control programs in each state. SEER data cannot be used for this purpose, except for the states included in the
TABLE 2-11 Age-Adjusted Cancer Incidence in Kentucky for Selected Sites, 1992 to 1995
|
|
Incidence per 100,000 Population |
||||
|
Year |
Colon and Rectum |
Lung and Bronchus |
Female Breast |
Cervix Uteri |
All Sites |
|
1992 |
49.1 |
75.2 |
103.1 |
11.3 |
385.7 |
|
1993 |
47.3 |
78.0 |
103.0 |
10.5 |
390.5 |
|
1994 |
48.4 |
84.6 |
109.8 |
11.4 |
403.7 |
|
1995 |
50.1 |
86.7 |
109.7 |
12.2 |
415.7 |
|
SOURCE: Gilbert Friedell, Director for Cancer Control, Kentucky Cancer Center, Personal communication, 1998. |
|||||
SEER program. For example, the cancer incidence rate reported for Kentucky, a state that does not participate in the SEER program and that has a large, rural white population and a high prevalence of poverty (19.0 percent versus a 13.7 percent rate of poverty nationally), suggests that overall rates of cancer in Kentucky are somewhat higher than estimates of the rates for the U.S. population as a whole (see Table 2-11). Specifically, the incidences of colorectal, lung, and cervical cancer are higher among the population in Kentucky than among the non-Hispanic white rate U.S. population, according to SEER program data. Of additional concern is the increasing cancer incidence trend suggested by the data for Kentucky. This is in contrast to the decrease in cancer incidence noted nationally among non-Hispanic whites for the same time period according to SEER program data.
Coordinated National Effort
The American Cancer Society, SEER, NCHS, and CDC combined efforts to produce a report card covering over 20 years of cancer experience in the United States, Cancer Incidence and Mortality, 1973–1995: A Report Card for the United States (Wingo et al., 1998), using data drawn from SEER and NCHS databases. Rates of cancer for several ethnic minority groups (African Americans, Asians, Pacific Islanders, and Hispanics) were included. However, cancer rates for Native Americans were notably absent. Also notably absent from this report were survival rates.
The report card confirmed the disparate cancer burdens among members of different ethnic minority groups, illustrated by SEER program data from 1988 to 1992. Additionally, data from this coordinated effort suggested an increasing trend in the incidence of and mortality from all major cancers among Asians and Pacific Islanders, but statistical significance was
not attained due to the small numbers of cases in these groups. As noted in the report of the NCI Cancer Control Review Group, SEER program incidence data do not cover Appalachia or the rural South (National Cancer Institute, 1997b).
Cancer Incidence Among Native Americans
Four facts are consistently found in studies examining cancer among American Indian populations. They are:
- cancer is the second leading cause of death;
- American Indians have the lowest 5-year survival rate for all cancers when compared to other populations;
- American Indians have the highest percentage of disseminated and ill-defined cancers; and,
- very little is known about prevention and treatment patterns for cancer in American Indians.
SEER program information on cancer incidence, mortality and survival in Native Americans is only available for American Indians living in New Mexico and Arizona (the Southwestern American Indians), and Alaska Natives (Miller et al., 1996). As indicated in Table 2-12, the five foremost
TABLE 2-12 Five Most Frequently Diagnosed Cancers Among Alaska Native and American Indian (New Mexico) Men, 1988 to 1992, Age Adjusted to 1970 U.S. Standard Population*
|
|
Incidence per 100,000 Population |
||||
|
Group |
Lung and Bronchus |
Colon and Rectum |
Prostate |
Stomach |
Kidney and Renal Pelvis |
|
Alaska Native |
81.1 |
79.7 |
46.1 |
27.2 |
19.0* |
|
|
Prostate |
Colon and Rectum |
Kidney and Renal Pelvis |
Lung and Bronchus |
Liver and Intrahepatic |
|
American Indian (New Mexico) |
52.5 |
18.6 |
15.6 |
14.4 |
13.1* |
|
* The rate is based on fewer than 25 cases and may be subject to greater variability than the other rates, which are based on larger numbers. SOURCE: SEER program (Miller et al., 1996). |
|||||
TABLE 2-13 Five Most Frequently Diagnosed Cancers Among Alaska Native and American Indian (New Mexico) Women, 1988 to 1992, Age Adjusted to 1970 U.S. Standard Population*
|
|
Incidence per 100,000 Population |
||||
|
Group |
Breast |
Colon and Rectum |
Lung and Bronchus |
Kidney and Renal Pelvis |
Cervix Uteri |
|
Alaska Native |
78.9 |
67.4 |
50.6 |
16.7* |
15.8 |
|
|
Breast |
Ovary |
Colon and Rectum |
Gallbladder |
Corpus Uteri |
|
American Indian (New Mexico) |
31.6 |
17.5 |
15.3 |
13.2 |
10.7 |
|
* The rate is based on fewer than 25 cases and may be subject to greater variability than the other rates, which are based on larger numbers SOURCE: SEER program (Miller et al., 1996). |
|||||
cancers in Alaska Native men are lung, colon and rectum, prostrate, stomach, and kidney, whereas the leading sites for Southwestern American Indian men are prostrate, colon and rectum, kidney, lung, and liver. Colorectal cancers among Alaska Native men and kidney cancer among Southwestern American Indian men are higher than those for any other racial or ethnic group. The high incidence of liver cancer in Southwestern American Indian men may not be very accurate due to the reporting of fewer than 25 cases.
Among Alaska Native women, the leading cancer sites are breast, colon and rectum, lung, kidney, and cervix, while among Southwestern American Indian women the leading incidence sites are breast, ovary, colon and rectum, gallbladder, and corpus uteri (see Table 2-13). Alaska Native women have higher rates of colorectal cancer and lung cancer than any other ethnic group. Southwestern American Indian women, in contrast, have very high incidence rates of ovarian and gallbladder cancers.
Mortality data provided by SEER indicate a disparity in the two Native American groups studied (see Tables 2-14 and 2-15). Cancer mortality rates for Alaska Native women from 1988 to 1992 exceeds that for white non-Hispanic women (45.3 compared to 32.9). Mortality rates for Alaska Native women from colorectal cancer also exceeded white non-Hispanic women (24 compared to 15.6). Whereas Alaska Native men had higher
TABLE 2-14 Five Most Common Causes of Cancer Deaths Among Alaska Native and American Indian (New Mexico) Men, 1988 to 1992, Age Adjusted to 1970 U.S. Standard Population*
|
|
Incidence per 100,000 Population |
||||
|
Group |
Lung and Bronchus |
Colon and Rectum |
Stomach |
Kidney and Renal Pelvis |
Nasopharynx |
|
Alaska Native |
69.4 |
27.2 |
18.9* |
13.4* |
11.6* |
|
|
Prostate |
Stomach |
Liver and Intrahepatic |
Lung and Bronchus |
Colon and Rectum |
|
American Indian (New Mexico) |
16.2 |
11.2* |
11.2* |
10.4* |
8.5* |
|
* The rate is based on fewer than 25 deaths and may be subject to greater variability than the other rates which are based on larger numbers. SOURCE: SEER program (Miller et al., 1996). |
|||||
TABLE 2-15 Five Most Common Causes of Cancer Deaths Among Alaska Native and American Indian (New Mexico) Women, 1988 to 1992, Age Adjusted to 1970 U.S. Standard Population*
|
|
Incidence per 100,000 Population |
||||
|
Group |
Lung and Bronchus |
Colon and Rectum |
Breast |
Pancreas |
Kidney and Renal Pelvis |
|
Alaska Native |
45.3 |
24.0 |
16.0* |
15.5* |
7.4* |
|
|
Gallbladder |
Breast |
Cervix Uteri |
Pancreas |
Ovary |
|
American Indian (New Mexico) |
8.9* |
8.7* |
8.0* |
7.4* |
7.3* |
|
* The rate is based on fewer than 25 deaths and may be subject to greater variability than the other rates which are based on larger numbers. SOURCE: SEER program (Miller et al., 1996). |
|||||
mortality rates due to cancer of lung and colon and rectum, Southwestern American Indian men experienced their highest mortality due to prostate cancer for that same period.
In general, the cancer incidence and mortality rates are not necessarily lower for all Native American populations and the data from the Southwest cannot be extrapolated to all American Indian and Alaska Native populations. Mortality statistics in state tumor registries are subject to underreporting of Indian ethnicity and hence all of this data must be interpreted with caution. Data on the larger cross-section of the American Indian population are needed to more accurately evaluate the cancer status of American Indians. SEER has established a tumor registry among the Cherokee Nation of Oklahoma to provide accurate statistics on this tribe.
Although the Indian Health Service (IHS) is generally viewed as the overseer of medical care for American Indian/Alaska Native populations, involvement is limited to the 33 ''reservation states" (Mahoney and Michalek, 1998). Contrary to popular impression, about two-thirds of American Indians reside in urban areas while fewer than 40 percent reside on federal reservations. Urban Indian health care programs account for just 2 percent of the IHS budget. IHS does not assume sole responsibility for American Indian and Alaska Native health care and attempts to incorporate support from federal and states agencies to assist in these programs.
IHS data for cancer incidence and mortality among American Indian and Alaska Native women demonstrated marked regional differences (Valway, 1990). These data document a high incidence of lung cancer among Alaska Native men (85 per 100,000 compared to 79 per 100,000, the overall average rate for U.S. men), and a high incidence of colorectal cancer among Alaska Native women (90.2 per 100,000 compared to 39.2 per 100,000 for U.S. women). In addition, IHS data reveal a higher incidence of lung cancer in American Indian men of the Northern Plains area, as well as a high incidence of breast cancer in American Indian women of that region.
Valway (1990), reporting on regional differences in cancer mortality among Native Americans, indicates that reporting statistics on one region of American Indians did not adequately describe cancer mortality for all Native Americans. Mortality statistics for Native Americans in the Southwest were lower than those living in the Northern Plains (North and South Dakota, Wisconsin, Michigan, Minnesota and Montana). This study confirmed the increasing American Indian mortality rates from cancer from 1968 to 1987, which was subsequently observed by Mahoney et al., (1998) from 1973 to 1993.
Special Studies
Studies by independent researchers who used data from agencies, hospitals, and state health departments provide additional insight into the cancer burden among members of ethnic minority and medically underserved groups. In many cases, as discussed below, these studies highlight important differences between regional data and national estimates provided by the SEER program.
A study that used hospital discharge data from IHS during the period between 1980 and 1987 provides estimates of cancer incidence and mortality for the 11 IHS regions (Nutting et al., 1993). A high degree of variation in the occurrence of cancer was seen among Native Americans in different geographic regions (see Tables 2-16 and 2-17). For example, the incidence of cancer among American Indian males in the Billings, Montana, area was nine times higher than that among American Indian males of the Phoenix area (56.4 per 100,000 population, in contrast to 6.3 per 100,000 population). Female breast cancer incidence also varied widely according to geographic region. The incidence in the Phoenix area was 18.8 per 100,000 population, in comparison to 51.5 per 100,000 population among Alaska Natives.
The IHS data for cancer incidence among American Indian women also illustrated large regional differences not shown by the SEER program estimates. For example, the incidence of cancer of the cervix in the Albuquerque, New Mexico area was approximately two- to threefold higher than seen in Portland, Bemidji, and Oklahoma.
A second study was initiated to determine the extent of racial misclassification of American Indians in the Washington State Cancer Registry when compared to data obtained from the Portland Area Indian Health Service and tribal specific cancer data (Sugarman et al., 1996). The estimated age-adjusted cancer incidence among American Indians in Washington state increased from 153.5 per 100,000 population before record linkage to 267.5 per 100,000 after linkage. This study found that most cases of cancer in American Indian individuals were identified by the IHS registry and a few additional cases were identified using the tribal rolls. More than one quarter of American Indians classified as full heritage (100 percent blood quantum) were not coded as American Indians in the tumor registry, again suggesting that true misclassification frequently occurs.
Cancer Survival Among Ethnic Groups
Special studies that use data from the SEER program are also a source of important information regarding the incidence of cancer among members
TABLE 2-16 Cancer Incidence Among American Indian, Alaska Native, and Non-Hispanic White Males, Age Adjusted to 1970 U.S. Standard
TABLE 2-17 Cancer Incidence Among American Indian, Alaska Native, and Non-Hispanic White Women, Age Adjusted to 1970 U.S. Standard
TABLE 2-18 Five-Year Survival Rates by Selected Cancer Sites and Ethnic Group
|
|
Percent |
|||
|
Group |
Colon |
Lung |
Female Breast |
Cervix (invasive) |
|
Non-Hispanic white |
64 |
11 |
85 |
94 |
|
Hispanic |
58 |
10 |
76 |
94 |
|
Native American |
48 |
10 |
75 |
90 |
|
SOURCE: Gilliland, Hunt, and Key (1998). |
||||
of ethnic minority groups. For example, a study using the New Mexico (a SEER program state) tumor registry data from 1983 to 1994 found significant differences in the rate of survival from cancer among Hispanic, Native American, and white patients (Gilliland, Hunt, and Key, 1998). The study found that whites had the highest 5-year survival rates, that the rates among Hispanics were intermediate, and that Native Americans had the poorest rates of survival (see Table 2-18).
Similarly, Samet et al., (1987) in an earlier study found that the diagnosis of cancer at a late stage was correlated with poor survival rates (see Table 2-19), supporting the rationale for increased early detection services in special populations.
Gilliland and Key (1998), in a study of prostate cancer among American Indians in New Mexico from 1969 to 1994, also point to late stage at diagnosis as a factor in disproportionate mortality rates in relation to incidence rates. For example, among American Indian men, 23.3 percent of prostate cancers were diagnosed after distant spread, whereas among non-Hispanic white men 11.6 percent of prostate cancer were diagnosed after distant spread (Gilliland and Key, 1998). Other studies of cancer survival rates for this population (covering 1973 to 1992) supports the findings that American Indian women have poorer survival rates than non-Hispanic whites (Frost et al., 1996). For example, survival was poorer among American Indian women during both the period from 1973 to 1982 and the period from 1983 to 1992. Survival among Hispanic women was also notably poor during the latter time period. The authors note that the lower survival rates among this population is amplified by increasing breast cancer incidence rates among New Mexico Hispanics and American Indians (Frost et al., 1996).
In addition to early detection, cancer survival is highly dependent upon effective treatment. Evidence indicates that there are ethnic differences
TABLE 2-19 Stage of Cancer at Diagnosis by Selected Cancer Site and Ethnic Group
|
|
Percent |
|||
|
Stage of Cancer and Ethnic Group |
Colon |
Lung |
Female Breast |
Cervix (invasive) |
|
In Situ |
||||
|
Non-Hispanic white |
2.5 |
0.2 |
5.0 |
81.0 |
|
Hispanic |
1.3 |
0.0 |
3.9 |
72.7 |
|
Native American |
3.6 |
0.0 |
2.2 |
76.1 |
|
Local |
||||
|
Non-Hispanic white |
28.4 |
32.0 |
52.3 |
12.3 |
|
Hispanic |
29.3 |
32.5 |
43.8 |
15.2 |
|
Native American |
29.1 |
23.2 |
33.3 |
11.3 |
|
Regional |
||||
|
Non-Hispanic white |
43.1 |
24.7 |
36.3 |
4.8 |
|
Hispanic |
40.7 |
21.9 |
42.9 |
8.5 |
|
Native American |
42.7 |
25.3 |
48.4 |
9.2 |
|
Distant |
||||
|
Non-Hispanic white |
26.0 |
43.1 |
6.5 |
1.9 |
|
Hispanic |
28.7 |
45.6 |
9.5 |
3.6 |
|
Native American |
24.5 |
51.5 |
16.1 |
3.3 |
|
SOURCE: Samet et al., (1987). |
||||
in the aggressiveness of treatment of cancer. For example, one study found that African-American women with advanced breast cancer were less likely than white women to receive surgery, and mortality was higher among African-American women than in white women with advanced disease (Breen and Ching, 1995). Similarly, SEER program data were used to evaluate prostate cancer treatment, and the proportion of African-American men who receive prostatectomy was lower than that of white men (Harlan et al., 1995). This trend appears to be consistent over the time period of evaluation (1984 to 1991).
Socioeconomic Status and Cancer Surveillance
No national database or agency reports the relationship between SES and cancer. Over the last 40 years, many studies have supported the conclusion that SES is somehow related to cancer. However, differences in the measures of SES (education, income, residence, occupation, or a calculated composite value) between studies have resulted in difficulties in examining this relationship in its entirety (Greenwald et al., 1996). Differences
in the types of cancers studied may also affect the interpretability of the results. For example, studies of disease in which early detection through screening is a determinant of survival (such as breast cancer) may indicate that income level is a predictor of outcome because this measures the level of access to health care. Conversely, a cancer that is largely affected by lifestyle choices (such as colon cancer, which is associated with poor diet) may show a stronger relationship to education than to income.
Further complicating the issue is the fact that many members of ethnic minority groups are also among the most poor citizens of the population. This is more true in some regions of the country than others, as shown in Table 2-20.
Other Measures of Progress against Cancer
Beyond the measurement of cancer outcomes such as survival and mortality, efforts have been made to measure a number of attributes related to cancer, such as levels of screening for cancer and the incidence of risk factors for cancer such as smoking and diet, and to assess differences among members of ethnic minority groups and medically underserved individuals in these attributes. These measures are important in cancer prevention and control efforts.
Primary prevention measures related to behavioral risk factors have the greatest potential for reducing the incidence of and mortality from cancer in the United States. For example, smoking and diet have been shown to significantly influence the rate of death from cancer (estimated to cause 30 percent and 35 percent of deaths from cancer, respectively). Smoking is a well-established etiologic agent in lung cancer and has been associated with cancers of the cervix, stomach, pancreas, and colorectal system. High-fat, high-calorie, low-fiber diets often lead to obesity and have been associated with cancers of the breast, prostate, and digestive system. Excessive alcohol consumption increases the risk of cancers of the mouth and esophagus when combined with smoking, and has also been linked to breast and prostate cancers. Regular monitoring of the prevalence of these behavioral factors is an important tool in the national effort because it identifies segments of the population at high risk of developing cancer and permits the targeting of research and intervention efforts.
In addition to lifestyle changes, increasing levels of participation in cancer screening programs among high-risk groups can effectively reduce the burden of cancer. Early detection improves the rate of survival. For example, studies indicate that regular mammography can reduce the mortality rate from breast cancer by 35 percent among U.S. women ages 50 to 69 years (Harris et al., 1992). The introduction of the Pap smear in the 1940s effectively reduced the incidence of cervical cancer by 90 percent
TABLE 2-20 Distribution of Racial or Ethnic Minority Groups, by State and Percentage of Population with Incomes Below the Poverty Level
|
State (% below poverty level) |
Non-Hispanic White |
Hispanic |
Black |
American Indian |
Pacific Islander/Asian |
|
Alabama (18.3) |
73.3 |
0.6 |
25.2 |
0.5 |
0.5 |
|
Alaska (9.0) |
74.0 |
3.3 |
3.9 |
15.5 |
3.3 |
|
Arizona (15.8) |
71.8 |
18.6 |
2.9 |
5.2 |
1.4 |
|
Arkansas (19.1) |
82.2 |
0.8 |
15.1 |
0.6 |
0.5 |
|
California (12.5) |
57.4 |
25.4 |
7.1 |
0.7 |
9.2 |
|
Colorado (11.7) |
80.9 |
12.7 |
3.9 |
0.7 |
1.7 |
|
Connecticut (6.8) |
84.0 |
6.2 |
8.0 |
0.2 |
1.5 |
|
Delaware (8.7) |
79.4 |
2.3 |
16.6 |
0.3 |
1.3 |
|
District of Columbia (16.9) |
27.4 |
5.2 |
65.3 |
0.2 |
1.8 |
|
Florida (12.7) |
73.3 |
12.0 |
13.2 |
0.3 |
1.1 |
|
Georgia (14.7) |
70.2 |
1.6 |
26.8 |
0.2 |
1.1 |
|
Hawaii (8.3) |
31.4 |
7.1 |
2.3 |
0.4 |
58.5 |
|
Idaho (13.3) |
92.3 |
5.1 |
0.3 |
1.3 |
0.9 |
|
Illinois (11.9) |
75.0 |
7.7 |
14.7 |
0.2 |
2.4 |
|
Indiana (10.7) |
89.6 |
1.7 |
7.7 |
0.3 |
0.7 |
|
Iowa (11.5) |
96.1 |
1.1 |
1.7 |
0.3 |
0.9 |
|
Kansas (11.5) |
88.6 |
3.6 |
5.7 |
0.9 |
1.2 |
|
Kentucky (19.0) |
91.7 |
0.6 |
7.1 |
0.2 |
0.5 |
|
Louisiana (23.6) |
65.8 |
2.2 |
30.6 |
0.5 |
0.9 |
|
Maine (10.8) |
97.9 |
0.6 |
0.4 |
0.5 |
0.6 |
|
Maryland (8.3) |
69.6 |
2.5 |
24.7 |
0.3 |
2.8 |
|
Massachusetts (8.9) |
88.0 |
4.6 |
4.6 |
0.2 |
2.3 |
|
Michigan (13.1) |
82.4 |
2.0 |
13.8 |
0.6 |
1.1 |
|
Minnesota (10.2) |
93.9 |
1.1 |
2.1 |
1.1 |
1.7 |
|
Mississippi (25.2) |
63.1 |
0.6 |
35.5 |
0.3 |
0.5 |
|
Missouri (13.3) |
87.0 |
1.2 |
10.6 |
0.4 |
0.8 |
|
Montana (16.1) |
91.9 |
<0.1 |
0.2 |
5.8 |
0.5 |
|
Nebraska (11.1) |
92.6 |
2.2 |
3.6 |
0.8 |
0.8 |
|
Nevada (10.2) |
78.8 |
10.1 |
6.4 |
1.5 |
3.1 |
|
New Hampshire (6.4) |
97.3 |
1.0 |
0.6 |
0.2 |
0.8 |
|
New Jersey (7.6) |
74.2 |
9.3 |
12.8 |
0.2 |
3.4 |
|
New Mexico (20.6) |
50.6 |
38.1 |
1.8 |
8.5 |
0.9 |
|
State (% below poverty level) |
Non-Hispanic White |
Hispanic |
Black |
American Indian |
Pacific Islander/Asian |
|
New York (13.0) |
69.4 |
12.0 |
14.5 |
0.3 |
3.7 |
|
North Carolina (13.0) |
75.1 |
1.0 |
21.9 |
1.2 |
0.7 |
|
North Dakota (14.4) |
94.3 |
0.7 |
0.5 |
3.9 |
0.5 |
|
Ohio (12.5) |
87.1 |
1.2 |
10.6 |
0.2 |
0.8 |
|
Oklahoma (16.7) |
81.1 |
2.7 |
7.3 |
7.9 |
1.0 |
|
Oregon (12.4) |
90.8 |
3.9 |
1.6 |
1.4 |
2.3 |
|
Pennsylvania (11.1) |
87.8 |
1.9 |
9.0 |
0.1 |
1.1 |
|
Rhode Island (9.6) |
89.5 |
4.4 |
3.4 |
0.4 |
1.7 |
|
South Carolina (15.4) |
68.6 |
0.8 |
29.7 |
0.3 |
0.6 |
|
South Dakota (15.9) |
91.2 |
0.8 |
0.4 |
7.1 |
0.5 |
|
Tennessee (15.7) |
82.6 |
0.6 |
15.9 |
0.3 |
0.6 |
|
Texas (18.1) |
60.8 |
25.3 |
11.7 |
0.4 |
1.8 |
|
Utah (11.4) |
91.3 |
4.8 |
0.6 |
1.4 |
1.9 |
|
Vermont (9.9) |
98.0 |
0.7 |
0.4 |
0.4 |
0.5 |
|
Virginia (10.3) |
76.0 |
2.5 |
18.7 |
0.3 |
2.5 |
|
Washington (10.9) |
86.9 |
4.2 |
3.0 |
1.6 |
4.2 |
|
West Virginia (19.7) |
95.9 |
0.4 |
3.1 |
0.2 |
0.4 |
|
Wisconsin (10.7) |
91.4 |
1.8 |
5.0 |
0.8 |
1.1 |
|
Wyoming (11.9) |
91.1 |
5.5 |
0.7 |
2.1 |
0.6 |
|
SOURCE: Statistics are from the U.S. Bureau of the Census (1997a). |
|||||
because the procedure can detect abnormal cells before they become cancerous (U.S. Public Health Service, 1991). Other cancer screening tests such as fecal occult blood testing are readily available.
Existing data demonstrate that the rates of late stage at diagnosis and poor cancer survival rates are disproportionately higher among ethnic minorities. Similarly, the available information indicates that the rate of participation in cancer screening programs is lower among ethnic minorities and low SES individuals (Breen and Figueroa, 1996; Breen et al., 1996; Hoffman-Goetz et al., 1998). For example, recent trends in breast cancer mortality indicate that the mortality rate for U.S. white women decreased during the period from 1980 to 1988, whereas the rate for African-American women increased significantly. This difference in trends was
largely attributed to late stage at diagnosis (Chevarley and White, 1997). Increasing levels of participation in screening programs by groups at high risk of death from cancers can lead to earlier detection, greater treatment efficacy, and better survival rates.
Behavioral Risk Factor Surveillance: Existing Mechanisms
The purpose of the Behavioral Risk Factor Surveillance Survey (BRFSS) is to collect data regarding the prevalence of behavioral risk factors among U.S. adults to be used to establish and monitor progress toward public health objectives. The data are collected by telephone by using responses to surveys that are administered by the states in coordination with the CDC (Sugarman et al., 1992). Use of telephone responses limits the generalizability of the results of BRFSS, since many low-income households lack telephone service. For example, only approximately a third of all households on northern Arizona reservations (e.g., that of the Hopi tribe) have telephones (National Cancer Institute, 1994). Special studies with the results of BRFSS have been conducted among Native Americans in attempts to address some of these concerns. Oklahoma developed its own Native-American Supplement, which was administered in 1994 (Smith et al., 1995). Additionally, BRFSS data from 1,055 Native American respondents obtained from 1985 to 1988 were evaluated for their usefulness in monitoring the progress of this population toward achieving year 2000 national health objectives (Sugarman et al., 1992). The conclusion of that report was that BRFSS data may be useful in the surveillance of Native Americans if they are combined with community-specific household-based surveys. Similar conclusions may be appropriate for other distinct geographic, cultural, and ethnic groups. For example, in several counties of eastern Kentucky, 20 percent or more of the households do not have telephones (U.S. Bureau of Census, 1997b).
National Health and Nutrition Examination Survey
In 1967, the U.S. Congress mandated that appropriate federal and state officials conduct a comprehensive survey in response to concerns about hunger, malnutrition, and health. In 1969, the initial 10-state effort was expanded by President Richard Nixon to cover the entire United States. NCHS added a nutritional assessment component to health status measurements already being collected in the National Health Examination Survey, and the first National Health and Nutrition Examination Survey (NHANES) was conducted between 1971 and 1974.
The purpose of NHANES is to periodically assess the nutritional and
health status of the U.S. population and to monitor trends over time. Nutritional status is evaluated through interviews and direct physician examinations. During interviews a 24-hour diet recall, a food frequency questionnaire, and a medical history are obtained. Physical examinations include anthropometric and biochemical measurements and physical and dental examinations.
A multistage probability cluster sampling plan is used to ensure a representative sample of U.S. households. For example, the second NHANES, (NHANES II; 1976 to 1980) had a sample size of 27,805, with 91 percent of these agreeing to participate in the survey. Oversampling of subgroups at high risk of malnutrition (such as households in areas with high levels of poverty) was conducted to ensure their adequate representation. In addition, a special survey of Hispanics in five southwestern states, Cubans in Dade County, Florida, and Puerto Ricans in the New York City metropolitan area was conducted from 1982 to 1984. To date, the routine collection of nutrition and health information has systematically excluded people in the military, institutionalized individuals, and individuals living on Native American reservations.
National Health Interview Survey
In addition to NHANES, NCHS administers the annual National Health Interview Survey (NHIS) to collect information on the health of civilian, noninstitutionalized Americans. NHIS collects information on the occurrence of injuries, acute illnesses, chronic conditions, and disabilities and the utilization of health care serves among people in the United States who are 17 years of age and older. NHIS consists of a two-part questionnaire that requests basic health and demographic information and a supplemental survey of several health related topics. For example, information on cancer-related risk factors such as participation in screening programs, diet, and family history of cancer were collected in 1987 and 1992.
African Americans and Hispanics have been oversampled in NHIS to improve estimates for these populations. However, Americans Indians and other ethnic minority groups with smaller numbers of individuals have historically been surveyed in insufficient numbers to draw conclusions about these populations. For example, 0.0006 percent (n = 135) of respondents to the 1987 Cancer Control Supplement were American or Alaska Natives. This percentage of respondents was poor in comparison to the proportions of indigenous peoples in the United States, which were estimated to be 0.6 percent in 1980 and 0.8 percent in 1990.
TABLE 2-21 Percentage of U.S. Women Who Reported Ever Having a Mammogram or Pap Smear, by Racial or Ethnic Group
|
|
Percent of U.S. Women Who Have Had the Following: |
|
|
Racial or Ethnic Group |
Mammogram |
Pap Smear |
|
White, non-Hispanica |
38.9 |
91.0 |
|
Blacka |
29.6 |
88.1 |
|
Hispanica |
26.2 |
74.8 |
|
American Indianb |
14.8 |
82.6 |
|
SOURCE: a National Health Interview Survey for 1987; b National Medical Expenditure Survey for 1987. |
||
National Medical Expenditure Survey
A special survey of American Indians and Alaska Natives was conducted in 1982 by using the National Medical Expenditure Survey. Some of its findings regarding the use of mammography and Pap smear screening techniques are summarized in Table 2-21. There are several major concerns with the validity of the results of this survey. These concerns were related to the cultural appropriateness of the survey instrument and the possibility of misinterpretation of responses by researchers who are not American Indians or Alaska Natives (Burhansstipanov, 1995). However, the results of this survey indicate that American Indian women, like other minorities, received screenings less often than the non-Hispanic white population (Coyne et al., 1992).
National Survey of Family Growth
The National Survey of Family Growth (Wilcox and Mosher, 1993) was based on a national sample of 8,450 reproductive age (15 to 44 years) U.S. women who participated in NHIS between October 1985 and March 1987. The NHIS data were used to compare women who had received screening in the previous year to those who had not received an annual screening. Results indicated that women with little education or low income, Native American women, Hispanic women, and women of Asian or Pacific Islander descent were less likely to receive regular screenings (see Table 2-22).
TABLE 2-22 Percentage of U.S. Women Who Reported Annual Breast Examination of Pap Spear, by Racial or Ethnic Group, Education, and Income
|
|
Percent of U.S. Women Who Have Reported Having the Following: |
|
|
Racial or Ethnic Group |
Breast Examination |
Pap Smear |
|
White, non-Hispanic |
67.3 |
67.1 |
|
Black |
74.2 |
76.3 |
|
Hispanic |
62.9 |
63.6 |
|
American Indian |
53.3 |
50.0 |
|
Asian or Pacific Islander |
56.7 |
54.2 |
|
Education (in years) |
|
|
|
<12 |
62.9 |
65.5 |
|
12 |
69.9 |
70.8 |
|
13–15 |
74.3 |
73.7 |
|
>16 or more |
77.5 |
77.1 |
|
Income as percentage of poverty level |
|
|
|
<150 |
60.7 |
61.8 |
|
150–299 |
63.7 |
64.8 |
|
300–399 |
67.8 |
66.8 |
|
>400 |
73.2 |
72.9 |
|
SOURCE: National Survey of Family Growth. |
||
Future Directions in Assessing the Burden of Cancer among Ethnic Minority and Medically Underserved Groups
Cancer Surveillance Among Ethnic Minorities and Medically Underserved Individuals
Data on the incidence of cancer among ethnic minorities and medically underserved individuals indicate that not all of these groups are at higher risk of cancer than members of the majority population, and that the rates of some cancers among white Americans who are medically underserved are not very different from the highest rates among some ethnic minority groups. On the other hand, cancer mortality rates are significantly higher and cancer survival rates are lower among many ethnic minority populations, a fact attributed in several studies to late stage of diagnosis and inferior treatment in the health care system. Further, many cancer risk behaviors are more prevalent among ethnic minority and medically underserved groups, portending an increase in cancer mortality.
It is important that the reasons for the differences in cancer incidence,
mortality, survival rates, and risk behaviors be understood, because this understanding may be crucial to reducing the rates of cancer among the entire population. Studying groups of people of different cultures, behaviors, environmental exposures, and patterns of cancer in different geographic settings is a critical step in identifying factors related to risk of disease. However, before the reasons for the differences can be understood, it is necessary to have reliable and valid data for the groups under consideration. For reasons beyond the control of the agencies collecting these data, the available data are not always valid. For example, as noted earlier, the identification of both ''race" and ethnicity in the U.S. census may cause confusion among respondents and inconsistent self-reporting. Federal health data are also distorted because of the persistent problem of census "undercounting," which is more prevalent among ethnic minority and underserved groups. Statistical sampling to correct this undercount, which has been debated extensively in Congress, would help to yield more reliable data regarding cancer incidence and mortality rates. Another methodological challenge is posed by the various methods that data collectors, providers, interviewers, and others used to identify the "race" or ethnicity of individuals. The lack of consistency in definitions among various government agencies also raises questions about the reliability of some of the data.
Accurate classification of groups and enumeration of their cancer experience are therefore critical to ensuring the effectiveness of future cancer prevention and control efforts. It is clear from the review of data collection from the government sector that several agencies are involved in this activity, including NCI, CDC (including the NCHS), state tumor registries, and the IHS, but that data collection activities are inconsistent. These agencies all acknowledge that there are ethnic minority and medically underserved populations but do not always publish or collect information in a consistent fashion that would adequately assess the burden of cancer in these groups. Some entities, for example, primarily report on rates of cancer on a racial basis and provide information only on whites and African Americans. In addition, information is not routinely collected on the basis of medically underserved status, but some information regarding these populations is available based on special studies in limited regions.
These and other problems related to cancer surveillance must be addressed in order to fully understand the burden of cancer among all segments of the U.S. population. The remainder of this chapter is therefore dedicated to illustrating and addressing significant conceptual and methodological issues that NIH (and other federal agencies) should consider in its cancer surveillance and other population-based research. In general, these issues are related to:
- the accurate enumeration of population groups, and collection and reporting of important indicators of cancer;
- the appropriate conceptualization of human diversity; and,
- consideration of the full range of cancer risk factors that should be studied among diverse populations, including socioeconomic factors, environmental factors, behavioral risk, and other factors.
Each of these issues is reviewed in greater detail below.
To its credit, NCI has already begun the process of reevaluating and improving its research and surveillance activities in each of these areas. Recent and ongoing evaluations of these programs include the report of the NCI Cancer Control Review Group (National Cancer Institute, 1997a), recommendations from which have already been implemented to improve the NCI's activities related to behavioral research and the study of ethnic minority populations; the NCI Special Action Committee Report (National Cancer Institute, 1996a), which called for improved assessment and conceptualization of the cancer research needs of ethnic minority and medically underserved groups; and the Surveillance Implementation Review Group, which is on-going and is charged with recommending improvements in NCI's cancer surveillance activities. These activities are described in greater detail below.
Enumeration of Population Groups, and Collection and Reporting of Important Indicators of Cancer
Improving SEER Program Coverage of High-Risk Populations
As discussed earlier in this chapter, the SEER program currently provides the best approximation of a national cancer database. However, its geographic coverage of minorities and medically underserved individuals must be improved. Based on findings and recommendations of the previously cited reviews of the SEER programs, coverage of high-risk populations should be improved to include lower-income or poverty-level whites, particularly those living in rural areas such as Appalachia; Hispanics of all national origins; African Americans living in rural communities, particularly in the South; and American Indian populations. The expansion of the SEER program would permit better analyses of the differences which exist among individuals within the same ethnic group, but who reside in different geographic regions of the country, such as Native Americans, African Americans, Hispanics, and non-Hispanic whites. Including states such as Florida and Texas, Appalachia, and the rural South, which have a high prevalence of poverty and large rural areas, would broaden the representation
of many ethnic minority and low-income white populations in the SEER program. Hispanics, for example, represent a diverse cultural group with varying places of origin. Including other states with significant Hispanic populations would increase the representativeness of this population in the registry, as the Hispanic population in SEER reside predominantly in California. The inclusion of border areas of Texas would improve Hispanic representation in the SEER program, as would areas of the northeast such as New York or New Jersey, both of which have significant Hispanic and Asian populations. Likewise, inclusion of tribes in Oklahoma and Montana would begin to address the diversity within the American Indian population and provide a more complete assessment of the cancer experience of this population. It is not expected that a national registry will compensate for small numbers if the population under study is small.
Expansion of the SEER program can be accomplished through existing mechanisms. Standards for data collection and reporting, and a uniform data set have been established by the North American Association of Central Cancer Registries (NAACCR) for use by all of its members, including both SEER and non-SEER population-based registries. Inclusion in the SEER program of selected state registries meeting these standards might be one means of facilitating expansion of SEER coverage to areas or populations not currently covered.
Recommendation 2-2a: To further enhance the excellent data provided in the SEER program database, adequate resources should be provided to expand SEER program coverage beyond the existing sites to include high-risk populations for which SEER program coverage is lacking. This expansion should address a wider range of demographic and social characteristics by using consistent nomenclature and a uniform data set and by reflecting the diverse characteristics of the current U.S. population.
In addition to the SEER program, the federal government assists in the support of the National Program of Cancer Registries (NPCR). These non-SEER program registries are currently funded by the individual states with additional financial and technical support from the CDC through the NPCR. Some of these registries are currently only collecting data concerning incidence, stage at diagnosis, and first course of treatment. The Veterans Administration Hospital system and others are also collecting information regarding course of disease, other treatment(s) and survival. Greater collaboration and coordination of data collection efforts among these registries will ultimately provide tremendous benefits in the form of a national cancer data set.
Currently, collaborative efforts among the five SEER registries and the
45 non-SEER state registries are effectively facilitated by the NAACCR. Each of these registries has accepted NAACCR's comprehensive three-volume Standards for Data Exchange Records, Data Variable Definitions, and Completeness, Quality, and Timeliness of central registry operations. In addition, several NAACCR committees dealing with uniform data standards, data exchange, publication, certification, education, and other important issues include members from SEER, as well as from CDC and from state registries. NCI also offers significant leadership support to NAACCR, as Dr. Brenda Edwards of SEER serves as Secretary of the organization and sits on the Board of Directors. In addition, data from all SEER and non-SEER state registries are currently aggregated and published by NAACCR. Continued support for this activity should be assured.
In addition to these efforts, the National Coordinating Council for Cancer Surveillance (NCCCS), which was organized in 1995 and is currently comprised of representatives from SEER, CDC, NAACCR, NCHS, the American Cancer Society, the American College of Surgeons, and the National Cancer Registrars Association is also working to facilitate collaboration among the several surveillance agencies. As noted above, NCI should continue to support NCCCS activities.
Recommendation 2-2b: NCI should continue to work with the North American Association of Central Cancer Registries and other organizations to expand the coverage and enhance the quality of the 45 non-SEER program state cancer registries with the intent of ultimately achieving—together with the SEER program state registries—two goals: (1) a truly national data set through a system of longitudinal population-based cancer registries covering the entire country, and (2) a reliable database for each state to serve as the basis for both the development and evaluation of cancer control efforts in that state.
Medically Underserved Individuals
As discussed earlier in this chapter, medically underserved populations may be defined in many ways, including on the basis of income, insurance status, access to cancer services, or some combination of factors, such as those related to SES. The committee urges NCI to establish a consistent definition, and regularly report cancer surveillance data related to this population.
It is important that studies be undertaken to clarify whether differences in the burden of cancer are due to "racial-ethnic" or to socioeconomic factors, and the data collected on the medically underserved could help to resolve this issue. Because of the large overlap between medically underserved
and ethnic minority populations, data should be cross-tabulated to reveal information on "medically underserved" and "non-medically underserved" populations within each ethnic group. Improving data collection and obtaining the necessary information can be obtained by collecting data on several indicators of SES, along with the respondent's ethnic self-identification, native language, and information on the birthplace of the respondent's parents and their ethnic identities, where possible. This more comprehensive information is especially needed for clinical and epidemiologic work. Perhaps the simplest way to begin would be to focus on access to health services (both treatment and prevention) as a data element in surveillance.
Linkage of Cancer Prevention, Screening, and Surveillance Data
One of the important pieces of information lacking in the current cancer surveillance system is the linkage of screening data or related information on cancer prevention activities to cancer incidence. Such data include access to care, which can be defined as the timely use of personal health care services to achieve the best possible health outcome. This definition relies on both the use of health care services and successful outcomes as a measure of access to care, a key aspect of cancer control among ethnic minorities and medically underserved individuals. This issue has recently been addressed by the Surveillance Implementation Group, formed by NCI in March 1998. The purpose of this group is to provide advice on proposed implementation plans, research directions, and priorities for expanding the NCI Surveillance Research Program and to recommend such plans, directions, and priorities. Defining the needed databases and surveillance systems is one of the many activities to be performed by this group in the near future.
An example of a group that links screening data to outcomes in the Breast Cancer Surveillance Consortium, which links national mammography screening data to an outcomes database (Ballard-Barbash et al., 1997). By standardizing data collection and linkage mechanisms for mammography and cancer registry data, this program will assess and improve the effectiveness of screening mammography. This important work should be continued and should serve as a model for additional programs.
Survival Data for Ethnic Groups
As noted earlier in this chapter, information on survival rates of cancer patients can help in the identification of potential problems in either access to or quality of cancer screening and treatment services. The most
recently published survival data for minorities other than African Americans is from the 1978 to 1981 SEER program registry and is therefore nearly 20 years old. These data suggest that the rate of survival from cancer is much poorer among minorities and that additional follow-up is needed. The most recent SEER program monograph to address racial and ethnic patterns of cancer (1988 to 1992) evaluates survival rates only among African Americans and whites. In addition, the reported SEER program data do not adequately address patterns of cancer survival among medically underserved white populations.
Recommendation 2-3: Annual reporting of cancer surveillance data and population-based research needs to be expanded to include survival data for all ethnic groups, as well as for medically underserved populations.
Human Diversity, Population Groups, and Cancer
As noted earlier in this chapter, NCI's population-based data collection efforts are shaped by Directive No. 15 of the OMB, which stipulates that the U.S. population be classified according to one of four basic "racial" categories (American Indian or Alaska Native, Asian or Pacific Islander, black or African American, or white) and one of two ethnic groups (Hispanic or non-Hispanic). Although these classifications carry important historical, social and political significance in the United States, they are of limited utility for purposes of health research because the concept of race rests upon unfounded assumptions that there are fundamental biological and behavioral differences among racial groups (Cooper, 1984; Williams, Lavizzo-Mourey, and Warren, 1994; President's Cancer Panel, 1997; American Anthropological Association, 1998). In reality, human diversity cannot be adequately summarized according to the broad, presumably discrete categories assumed by a racial taxonomy. Furthermore, "racial" groups as defined by OMB are not discernible on the basis of genetic information (President's Cancer Panel, 1997; American Anthropological Association, 1998).
Although the four racial groups defined by OMB are broad and imprecise, and greater genetic heterogeneity exists within groups than between groups, health researchers may nonetheless benefit from understanding differences in health status between these groups. Health differences between "racial" groups may be due to many factors, including discrimination in the health care system, limited access to prevention and treatment services, poverty and socioeconomic factors, exposure to environmental toxins, and cultural factors, such as attitudes about health, beliefs, diet, and lifestyle patterns. Health is therefore a biological response
to all of these conditions—conditions that are more accurately emphasized when groups are defined on the basis of ethnic background.
Ethnic groups include individuals who share a unique history different from that of other groups, in addition to other attributes, such as language, customs, ancestry, and religion. Usually, a combination of these features identifies an ethnic group. In the U.S., many groups commonly referred to as "racial groups" may be more accurately referred to as "macro-ethnic" groups. These include "white" Americans of European descent, African Americans, Asian Americans, Hispanics, and Native Americans. It is important to recognize, however, that there is considerable cultural and biological heterogeneity within these groups, and therefore the precision of population-based research can be enhanced by referring to specific subgroups. For example, within the Asian American population, there are many ethnic subgroups, including individuals of Southeast Asian, Korean, Japanese, Chinese, and Indian descent.
Distinguishing many ethnic groups from one another is therefore useful in medical and epidemiologic research, provided that researchers are clear on the nature and source of human variation (e.g., cultural and behavioral patterns, environmental influences, and genetic variation) and their relationship to health outcomes. Researchers must therefore use caution in interpreting the sources of observed differences between these groups. Ultimately, greater precision in understanding and describing human diversity is needed to distinguish genetic and environmental contributions to cancer risk and the complex effects of the gene-environment interaction. This precision can be improved with greater clarity in the conceptualization and definition of population groups.
The views of AAA are pertinent to this approach. AAA recognizes that classical racial terms may be useful for many people who prefer to use such terms about themselves with pride, but it recommends phasing out the term "race" and recommends that it be replaced with more correct terms related to ethnicity, such as "ethnic origin," which would be less prone to misunderstanding (American Anthropological Association, 1997).
Recommendation 2-4: The committee recommends an emphasis on ethnic groups rather than on race in NIH's cancer surveillance and other population research. This implies a conceptual shift away from the emphasis on fundamental biological differences among "racial" groups to an appreciation of the range of cultural and behavioral attitudes, beliefs, lifestyle patterns, diet, environmental living conditions, and other factors that may affect cancer risk.
This change should not be difficult because, under the present arrangements,
the aggregations which are called "races" are really macro-ethnic groups. Scientifically speaking, there is only one race, Homo sapiens , but many ethnic groups and the entire population can be described within the five macro-ethnic groups we have indicated. This arrangement recognizes both the unity of the human race and the diversity of the ethnic groups, without any major disturbance in the data collection. Macro-ethnic groups can then be subdivided as indicated by the needs of cancer research to permit studies within such groups. The committee feels that it is important to study cancer within as well as across macro-ethnic groups. In this respect the diversity of the U.S. population offers an excellent opportunity to clarify issues relating to prevention and control. The study of several ethnic groups permit a better assessment of the factors contributing to cancer than studies based on "race," especially when these studies are limited to black-white differences. The racial emphasis is often associated with supposed genetic differences, but these assumptions are inconsistent with our current knowledge of the genetic diversity of the human race.
Cancer Risk Factor Research and Cancer Control
Cancer surveillance data are often used to measure the progress toward reducing the incidence of cancer that has already occurred, but the potential of those data is far greater than that. The differences in incidence, survival, and mortality rates for various ethnic groups raise critical questions about the causes of cancer and how it can best be prevented and controlled. The data suggest that many lives could be saved if more were understood about the role of behavior, the environment, socioeconomic factors, and genetic factors related to cancer and their interplay. To date, the research effort has failed to take adequate advantage of the increasing diversity of the U.S. population as a tool in understanding the interplay of cancer risk factors. Such an effort would benefit not only ethnic minorities and medically underserved individuals, but also the entire U.S. population. It requires, however, that the appropriate data be collected. This is the challenge facing the newly organized Division of Cancer Control and Population Science (DCCPS).
NCI's Cancer Control Review Group report (National Cancer Institute, 1997a) made recommendations regarding the pursuit of research opportunities most likely to accelerate reductions in the nation's cancer burden (see Appendix B for the Review Group's recommendations). One of the items highlighted in that report was the need for basic behavioral and social science research in NCI to enhance the focus on primary prevention efforts. Included in the scope of this recommendation was the
need to measure risk factors and screening behaviors, especially among medically underserved individuals.
The Review Group defined cancer control research as the conduct of basic and applied research in the behavioral, social, and population sciences that, independently or in combination with biomedical approaches, reduces cancer risk, incidence, morbidity, and mortality. Thus, optimum cancer prevention and control strategies are those that combine biomedical and public health research to address the process of carcinogenesis across the life span, from prevention to screening and treatment.
The surveillance data reviewed earlier in this chapter reveal considerable gaps in the understanding of cancer risk factors among ethnic minority and medically underserved populations. Greater research is needed to illuminate risk factors both within and across population groups. Such research should address the full range of cancer risk factors, as noted above, including cultural factors affecting health attitudes, behaviors, diet, and other factors, as discussed below.
The Role of Genetics
As in the case with many other diseases such as hypertension or diabetes, large disparities in cancer incidence, mortality, and survival rates are sometimes observed between "racial" groups. These differences are sometimes assumed to be due to genetically determined differences between "races." However, it is important to understand the true nature of genetic variability both within and among "racial" groups and how evolutionary and sociocultural forces have shaped human genetic diversity to understand the meaning of the observed differences.
As noted above, assumptions that differences are due to "race" or genetics may not be justified by the evidence. Behavioral factors (e.g., smoking), environmental factors (e.g., chemical and viral exposure), and socioeconomic factors (e.g., availability, affordability, and accessibility of diagnostic, therapeutic and preventive services) are likely to be the major links responsible for a higher (or lower) incidence or prevalence of cancer in ethnic minority and medically underserved populations (or in any population). The distribution of particular genetic polymorphisms in a population may be a significant factor, however, and must also be considered in comprehensive evaluations of cancer causation. In all comprehensive population-based research on carcinogenesis, the genetic constitutions of the study subjects must be taken into account.
In a small proportion of patients with cancers of various types, mutations in a single gene can be identified as a predominant cause. In such instances, cancers of specific types show a strong tendency to run in families. Examples of genes causing hereditary breast cancer are the BRCA1
gene on chromosome 17 and the BRCA2 gene on chromosome 13; another example is the p53 gene, some mutant forms of which lead to the Li-Fraumeni syndrome, which has breast cancer as one feature. These genes, however, account for no more than 3 to 5 percent of cases of breast cancer. As to the genetic factors involved in causation, most cancers are the consequence of an interplay between more than one gene collaborating with one or more environmental factors. The environmental factor may be of overwhelming importance, such as cigarette smoking in lung cancer and papillomavirus infection in cervical cancer; however, even in these instances the existence of genes that make some individuals more or less vulnerable to the environmental factors are suspected or such genes can be identified.
In general, genetic factors responsible for common disorders with multifactorial causes, such as cancers, are usually "susceptibility genes," and multiple genes are often responsible for the disorder. They represent a variable form (or allele) of a particular gene and have common variations, called polymorphic alleles. Alone, each variation has little effect, but in combination with other specific polymorphic alleles or nongenetic influences, these variations give rise to a particular disorder. Figure 2-1 diagrams the contrast between disorders caused by a mutation in a single gene, such as cystic fibrosis, Huntington disease, and Li-Fraumeni syndrome on the one hand and common disorders with multifactorial causation such as hypertension, manic-depressive illness, and lung cancer on the other. Each polymorphic allele occurs relatively frequently in the general "normal" population; it is present at a higher frequency (and usually in combination with other specific alleles) in people with a particular common disorder. The variable gene is a susceptibility factor, not a causative factor.
Genetic factors in common disorders with multifactorial etiology are usually investigated by allele association studies with DNA markers. These markers are sometimes variations in the sequences of specific genes that are investigated as candidate genes; because of the known functions of the genes, implication of their association in the pathogenesis of the given disorder is plausible. Alternatively, the DNA marker may be located in an "anonymous" section of the genome, that is, in a gene with an unknown function or in a noncoding region of the genome. A common variation, or "polymorphism," of a gene may alter the function of the gene product, thereby contributing to susceptibility to a disease. In such instances, the marker itself is the disease-related change. In the case of a common variation not involving the coding or gene-regulating sequence of DNA, linkage (in which genes are located close to each other on the same chromosome) is presumed to exist between the DNA variation and a specific allelic form of a susceptibility gene. Studies of associations between allelic variants
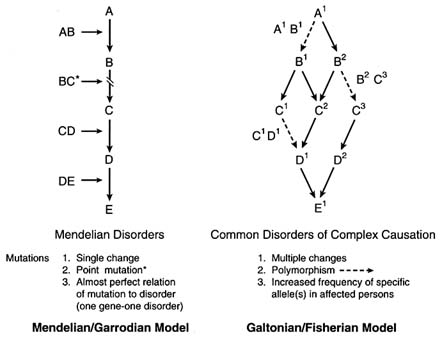
FIGURE 2-1 The contrast between disorders caused by a mutation in a single gene and common disorders with multifactorial etiology. SOURCE: Victor A. McKusick.
and common disorders are being undertaken with increasing frequency, in part under the stimulus of the Human Genome Project, which is identifying many genes and many polymorphisms. Caution in the interpretation of results in such studies is indicated for at least two reasons. First, population admixture, a conspicuous feature of the United States and other ethnically heterogeneous parts of the world, can cause an artifactual association if the study includes genetically distinct subpopulations, one of which coincidentally displays a higher frequency of both the disorder and the allelic variant. In such a situation, an observed association may be explained by differences in the genetic contributions of subpopulations to the case patient and control groups rather than by a physiologic effect of the genetic variant.
Consideration of the ethnic backgrounds of subjects and the study of multiple, independent populations can help avoid the subpopulation stratification problem. Also, family-based studies can provide a test of the validity of an association between an allelic variant and a disorder. In the transmission
disequilibrium test, for example, if a given allele contributes to a given disease, then the probability that an affected person has inherited the allele from a heterozygous parent should vary from the expected Mendelian ratio of 50:50; association with a neutral polymorphism due to population admixture displays no such deviation in family data (Spielman et al., 1993).
A second pitfall is that testing of multiple hypotheses, aggravated by publication bias, can lead to fallacious conclusions concerning associations. Researchers who test a single genetic change (mutation) for its association with a single disorder base their statistical conclusions on a single hypothesis. Many researchers, however, seek associations using multiple genetic variants. Each test represents an independent hypothesis, but there is a tendency to publish only positive results. In fact, these may merely represent those cases expected to fall outside the 95 percent confidence limits in tests with multiple genetic variants. Statistical correction for multiple testing is possible, but such corrections result, in a loss of statistical power (Altshuler et al., 1998).
The types of DNA markers used in association studies include restriction fragment length polymorphisms, variable-number tandem repeats, microsatellites (short tandem repeats), and single nucleotide polymorphisms (Collins et al., 1997). These markers are listed roughly in the order in which they have been used historically. NCI is initiating a research program to identify all variations in the human genome (Richard Klausner, Director, National Cancer Institute, personal communication, 1998). The Human Genome Diversity Project is a follow-up to the Human Genome Project. When the goals of the Human Genome Project—mapping of all human genes and determination of the sequences of all DNA in those genes—are achieved, it will still be unknown how the genes and the DNA vary among the 6 billion or 7 billion or more people who will inhabit the Earth at that time. The functions of all those genes will also still be unknown, as will how variations in the structure of the DNA and genes relate to variations in function, including variations in susceptibility to common disorders, including cancers.
The Human Genome Diversity Project proposes to identify the range of DNA variation that can be the basis for studies of genetic factors in common disorders. In the pursuit of the Human Genome Diversity Project or any DNA-based studies with special populations, including ethnic minorities and medically underserved individuals, concerns about the risks of discrimination and stigmatization have been raised. The ethical, legal, and societal implications of the project have been addressed by Knoppers et al., (1996, 1998) and by the report of a committee of the National Research Council.
The newly organized DCCPS recognizes that epidemiology and genetics
represent the foundations of cancer control research. Its Epidemiology and Genetics Program has studied the following:
- Interactions of genetic and metabolic factors with lifestyle, social and behavioral factors, diet and nutrition, hormones, and medications.
- Gene prevalence-associated metabolic markers and predictive value of identified genes and markers.
- Definitions of ethnicity using molecular genetics and; application of these definitions, as well as data on behavior and lifestyle choices, to studies of the effects of migration on the incidence of cancers.
- The genetic determinants, tumor markers, and cancer risk from immune function.
- Special populations with different patterns of cancer risk.
- Means of improving estimate of exposures by direct and indirect means.
Studies of Human Behavior
NCI research in the area of human behavior has not been strong in the past, but an expanded behavioral research program is planned in DCCPS, according to NCI officials (Barbara Rimer, National Cancer Institute, communication with the study committee, June 12, 1998). This program will place greater emphasis on the development of balanced behavioral research portfolios that include a range of research in all areas, spanning basic research, dissemination research, and policy development.
The literature from anthropology, psychology, sociology, behavioral medicine, and public health has shown that different ethnic groups vary in their attitudes, perceptions, and behaviors toward health. As noted earlier, macro-ethnic groups, such as Asian Americans, include many sub-groups, such as Chinese Americans, Japanese Americans, and Vietnamese Americans, to name only a few. For each ethnic group, culture influences their health, their attitudes toward health, and their health practices, although individual beliefs, attitudes, and behaviors may vary. Another factor is acculturation, the degree to which immigrants leave behind a culture of origin and assimilate aspects of their new culture. Some health behaviors may change within a few years of taking up residence in the U.S., while others may persist for generations. For example, newly arrived Mexican women are less likely to smoke than women of Mexican origin raised in the U.S. In addition, a study on Pap smear and mammogram screening in Mexican-American women found that the prevalence of these screenings increased with acculturation (Suarez, 1994). Given the diversity of health practices even within one ethnic group, it is essential to obtain accurate
and detailed ethnic histories of people to obtain a better understanding and knowledge of differences in health practices and possible risk.
Research on the different health care practices of various ethnic minority groups has described the existence of subcultures with different values, actions, and perceptions about health and illness (e.g., Saunders, 1954; Kleinman et al., 1978; Leslie, 1976; Good and DelVecchio, 1981; Hahn, 1995). These also include behaviors such as diet and exercise patterns, and interaction with the health care system (Salazar, 1996; Crane et al., 1996). For many of these groups the family and other social networks are important in providing support during illness in and health-seeking behaviors.
During the testimony heard by this committee from representatives of several ethnic minority and community groups (see Chapter 4 for a description of this testimony), two conflicting concerns about ethnicity were raised. One was that by identifying cultural habits that increase risk or reduce the likelihood of carrying out treatment, one is ''blaming the victim" by "blaming culture." In contrast, the concern was also expressed that not enough attention is paid to cultural norms, values, and concerns. Since all human beings are influenced by culture, these influences and their effects must be taken into account, but in ways which are sensitive to community concerns. It is understandable that many individuals in ethnic groups share common fears and distrust of both the medical care system and the research community, based on a history of disrespect and mistreatment of minorities by the research community. The Tuskegee syphilis experiment (summarized in greater detail in Chapter 5) is cited by African Americans and by Hispanics as a reason not to trust the government or researchers (Robinson et al., 1996). It is therefore important to understand the factual basis for this mistrust, and assess its impact on health care delivery and health behaviors among ethnic minority populations.
Summary of Cancer Risk Factor Research and Surveillance Needs
The committee finds that the newly reorganized DCCPS at NCI is well poised to address a wide range of challenges to improving our understanding of cancer risk among ethnic minority and medically underserved populations. Greater precision is needed in the definition and conceptualization of high-risk populations, and research must examine the diverse range of cancer risk both within and between ethnic groups. The committee is confident, however, that such research conducted under DCCPS's auspices will prove fruitful for the national cancer effort.
Recommendation 2-5: The committee commends the proposed NCI program of expanded behavioral and epidemiological research examining the relationship between cancer and cancer risk factors associated with various ethnic minority and medically underserved groups, and recommends that these studies be conducted both across and within these groups.
Summary
In this chapter, the committee has reviewed some of the difficulties associated with understanding and defining the problem of cancer among ethnic minorities and medically underserved individuals. In a large and diverse nation such as the United States, with its many overlapping population groups that may experience differences in cancer risk as a result of a complex interplay of environmental, cultural, socioeconomic, behavioral, and other factors, the use of clear and consistent definitions of populations is imperative to understanding how cancer differentially burdens various groups among the overall population. Depending on how populations are defined, cancer incidence, mortality, and survival rates vary considerably. Some ethnic minority groups, for example, may experience lower rates of some forms of cancer relative to the white majority; others, such as African Americans, experience higher rates of cancer incidence and mortality, and lower cancer survival rates. Groups of lower SES experience cancer incidence and mortality rates that are, in many instances, as high as the highest of any ethnic minority group. Understanding why cancer differentially affects these groups offers important clues to cancer etiology and control research.
Because cancer surveillance is critical to this effort, the committee finds that greater resources must be committed to expanding upon the existing, high-quality SEER program data. Additional data must be collected to understand cancer among medically underserved groups, and SEER program coverage of other important population groups should be improved. Because the problem of defining populations is complex, the committee offers recommendations on how population groups may be conceptualized, but recognizes that the NIH has been constrained in its data collection efforts by current federal guidelines.
The following recommendations were offered:
Recommendation 2-1: NIH should develop and implement across all institutes a uniform definition of "special populations" with cancer. This definition should be flexible but should be based on disproportionate or insufficiently studied burdens of cancer, as measured by cancer incidence, morbidity, mortality, and survival statistics.
Recommendation 2-2a: To further enhance the excellent data provided in the SEER program database, adequate resources should be provided to expand SEER program coverage beyond the existing sites to include high-risk populations for which SEER program coverage is lacking. This expansion should address a wider range of demographic and social characteristics by using consistent nomenclature and a uniform data set and by reflecting the diverse characteristics of the current U.S. population.
Recommendation 2-2b: NCI should continue to work with the North American Association of Central Cancer Registries and other organizations to expand the coverage and enhance the quality of the 45 non-SEER program state cancer registries with the intent of ultimately achieving—together with the SEER program state registries—two goals: (1) a truly national data set through a system of longitudinal population-based cancer registries covering the entire country, and (2) a reliable database for each state to serve as the basis for both the development and evaluation of cancer control efforts in that state.
Recommendation 2-3: Annual reporting of cancer surveillance data and population-based research needs to be expanded to include survival data for all ethnic groups, as well as for medically underserved populations.
Recommendation 2-4: The committee recommends an emphasis on ethnic groups rather than on race in NIH's cancer surveillance and other population research. This implies a conceptual shift away from the emphasis on fundamental biological differences among "racial" groups to an appreciation of the range of cultural and behavioral attitudes, beliefs, lifestyle patterns, diet, environmental living conditions, and other factors that may affect cancer risk.
Recommendation 2-5: The committee commends the proposed NCI program of expanded behavioral and epidemiological research examining the relationship between cancer and cancer risk factors associated with various ethnic minority and medically underserved groups, and recommends that these studies be conducted both across and within these groups.


