
3
Data Collection, Techniques Development, and Research
The U.S. Geological Survey (USGS) performs critical functions in relation to hydrologic hazards and extreme hydrologic events (see Figure 3.1). These functions encompass broad areas of data collection, techniques development, and research. Routinely, or ''prior'' to a major event, such as a flood or drought, the USGS collects and manages baseline data; constructs predictive models; develops new modeling, data analysis, and instrumentation methods; and helps communicate hazard information to user groups through maps, reports, public contacts, and other means. During an extreme event the USGS has a critical role in real-time data collection, data management, and communication of hazard information. After an event, the USGS documents what happened with the goal of understanding why the event occurred and identifying problems in modeling, data collection, and understanding of the physical processes. The information and experience gained through these functions should enhance and improve the understanding of extreme events.
Research, technique, and data needs relative to hydrologic hazards fall under two main categories—floods and droughts. Aquatic ecosystems rely on water, in the appropriate balance, for their well-being. Hydrologic hazards such as flooding and drought can upset the balance needed for some aquatic ecosystem while providing necessary periodic events to maintain other systems. Analytical difficulties that encompass most of hydrology and require added research are problems associated with the stationarity of hydrologic processes, the spatial and temporal variability of hydrologic processes, and issues related to the scaling of hydrologic processes. These three universal needs are discussed in detail in other reports of the National Research Council (NRC) (1988, 1991) and remain valid
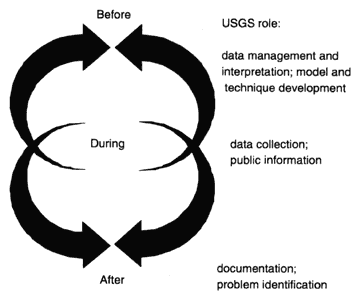
Figure 3.1
Roles of the USGS in extreme hydrologic events.
today. The collection of reliable, relevant datasets will continue to be a critical component of the hydrologic hazards program. Finally, there is a vital need to find better ways of communicating the consequences of hydrologic hazards to the public. The USGS is poised to take the lead in the development and application of improved visualization techniques that exploit the agency's expertise in long-term monitoring, mapping, and process modeling.
Floods
Floods are the most visible and immediately destructive extreme hydrologic events. Floods create hazards in several ways:
- loss of life, property, and services and other social impacts associated with flood flows;
- scour and deposition in natural channels, including scour around bridge piers and other structures located in the floodway;
- erosion of channel banks and beds and deposition of sediments in channels, impoundments, and other areas;
- possible transport of large quantities of pollutants;
- landslides and debris flows; and
- alteration of hydrologic characteristics of basins.
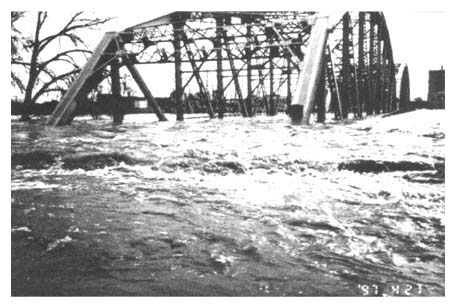
Flood overtopping Sorlie Bridge, Grand Forks, ND, during spring of 1997.
Photo courtesy of U.S. Geological Survey.
In addition to their human impacts, floods can have severe effects on natural ecosystems. During floods, destruction of natural habitat occurs through channel erosion and excessive sediment deposition, typically exacerbated by increased peak flood flows associated with urbanization and by increased erosion associated with some agricultural practices, water management, construction activities, and other earth-moving operations.
Adverse water quality conditions can result from stormwater runoff, both within and downstream of urban, agricultural, silvicultural, and mining areas. Constituents of concern include high sediment loads, metals, nutrients, pesticides and herbicides, and other organic contaminants.
Assessing the potential impacts of floods requires good estimates of the magnitude and frequency of flood flows. A 1988 report of the NRC, Estimating Probabilities of Extreme Floods: Methods and Recommended Research, is devoted entirely to this issue. The recommendations set forth in the concluding chapter of that report remain valid. The report indicates that the theoretical basis for estimating flood probabilities needs improvement, possibly through the application of regional statistical analyses of streamflow, consideration of paleohydrologic data, development of a comprehensive statistical model, and the use of rainfall-runoff models driven by synthetically derived precipitation inputs. Advances have been made in all of these areas since the 1988 report, but much remains to be done and the recommendations remain valid.
Regional estimates of flood magnitudes and frequencies have become standard tools for flood analysis. Political boundaries often influence the definition of "regions." Such limitations are artificial and can be overcome through management of already available data. The concept of defining regions based on geographic location has advantages in terms of selecting the regional hydrologic relationship to use in a particular analysis but may not be optimal in terms of reducing the standard error of the estimates of flood peaks. The definition of regions based on hydrologically related similarity criteria may offer improvements in terms of reduced standard errors (Tasker et al., 1996). Such regional definitions related to the hydrologic responses of watersheds should be continued and expanded to include hydrologic characteristics such as climatic variables and soil and geologic variables in addition to the commonly used physical characteristics of watersheds.
Human activity has altered the magnitude and frequency of rare events. Constructing dams and levees, altering drainage characteristics, and changing land use all can introduce nonstationarity into hydrologic records. Currently, we do not know the potential for an extreme hydrologic event to override human control of rivers and/or channels and thus result in a disaster of a magnitude far beyond what would have occurred under less managed conditions.
Data Needs Related to Floods
Data and network design questions, with an emphasis on real-time data collection, are key issues in understanding, predicting, and documenting floods. All predictions and models must be grounded in appropriate and reliable field data, and the USGS should give data collection the highest priority in hydrologic hazards programs. In particular, the agency should collect data that capture the variability of high-flow hydrologic events in space and time. An adequate national stream-gaging network must provide data for hydrologic warning in real time, for analysis of historic events, and for documentation of rare extreme events. Detailed studies of extreme flood events are essential for predicting future events of a similar nature. An adequate database to support such studies requires sufficient site specific information to elucidate the critical hydrologic, hydraulic, geomorphic, and hydroclimatic factors that shaped each extreme event. Data needs, therefore, transcend traditional gaging (and agency) activities. The greatest value will result from the synthesis of land use, hydraulic modification, river regulation, meteorology and climate conditions, with gage data and flow measurements. Such a synthesis may be readily achievable by coordinating the activities of the Corps of Engineers, NOAA, USDA, and USGS through a refocused concentration on hydrologic hazards.
Improved understanding of extreme events may require new approaches to collection of streamflow data. The traditional USGS paradigm for stream gaging has been to collect highly accurate information at a few distinct geographic sites.
One weakness of the present streamflow monitoring system is a lack of streamflow and water-level data in the areas of highest hydrologic variability, such as steep mountain basins and arid arroyos of the Southwest. Also, more emphasis should be given to obtaining data in urban areas, and data to better understand the impacts of water project operations would be instructive. Another current weakness is the program's emphasis on measuring of average flows rather than the rare extreme event. This is a daunting problem because it will be difficult for the USGS to justify data collection efforts (e.g., the installation of gaging equipment far above the usual high-water stage) that are used only rarely, yet collection of data during extreme events is critical to improved understanding, prediction, and warnings. It may be appropriate for the USGS to evaluate the role of peak stage recorders as part of an alternative data collection paradigm of collecting slightly less accurate information at more geographic sites.
Networks designed for characterizing regional hydrology may not be optimal for providing real-time data for hazard warning systems such as flood warnings. Added rain gages with the ability to transmit data in real time to a receiving location may be needed as real-time flood warning systems begin to rely on radar rainfall estimates. A growing infrastructure of real-time streamflow and precipitation data collected by state and municipal agencies may valuably augment the Survey's core data collection programs. Interagency cooperation to establish common formatting and quality control standards may be a cost effective means to expand the utility of regional hydrometeorological databases for diverse applications such as ground truthing and calibration of weather radars. The raingages are required to provide data that can be used to calibrate the radar echoes.
Flood research and forecasting requires both streamflow and water quality data for developing and testing hydrologic analysis techniques and for estimating parameters required in hydrologic and water quality models. Major runoff events can introduce large quantities of pollutants into surface waters. Because of the cost of collecting and analyzing water quality samples, there are far fewer locations collecting time series of water quality data than there are for streamflow data. Improving the database of water quality data will require less costly methods of data collection and analysis.
Technique Development Related to Floods
Many opportunities exist for development of techniques related to the measurement, forecasting, and simulation of floods. The most basic of these is the actual measurement of flood discharge and water stage. At high-flow rates, channel cross-sections, especially the bottoms of natural channels, can become unstable, resulting in scour and/or deposition of sediments that alter the relationship between flow rate and flow depth. Channel instability is especially acute in arid and semiarid regions. Extreme events are also difficult to measure because of the adverse conditions that exist and the hazards presented to personnel mak-
ing the measurements. Once water levels overtop normal banks, it may no longer be feasible to actually measure the flow. For example, bridges are often used as platforms from which actual streamflow measurements are made. Extreme flows may overtop the roadway on either side of a bridge or even on the bridge itself, making the bridge inaccessible and inadequate for making measurements over the total width of the flow. Improved methods of streamflow measurement are needed that are less labor intensive and can be carried out quickly without the need to repeatedly physically lower instruments on a cable into the water. Instruments are difficult to position in high flows and are subject to entanglement in debris. Semiarid and arid regions present other challenges in that flow rates may go from near zero to record-high levels in a matter of minutes. Current manual streamflow measuring techniques are not suited to making measurements under these conditions.
Techniques should also be improved for the construction of stream rating curves, which are often quite uncertain for extreme events. Generally, such rating curves are extrapolations of rating curves developed from more normal flows.
As greater dependence is placed on real-time data, reliability and redundancy will need to be improved to ensure that hazard warning systems remain operational at critical times. If a key stream gage becomes inoperative during a major flood event, a flood warning system could be rendered ineffective, resulting in more damages and losses than might have occurred using older technologies.
Research Needs Related to Floods
Data on relatively frequent peak flows are naturally far more readily available than data on extreme events, which by definition occur infrequently and likely are not represented in commonly available records of length. Statistically derived flood flow estimates assume stationarity and homogeneity, meaning that extreme event are from the same statistical population as the more frequent events and thus their magnitude and frequencies are imprinted in these more frequent events. However, flood flows are probably not statistically stationary (Klemes, 1986). Can the magnitude and frequency of extreme events be predicted based on a statistical analysis of frequent but relatively small flood flows thought to have return periods of a few years? Hydrologists seldom have adequate data for a statistical treatment of floods in the more normal range of return periods (<100 years). There are few, if any, records that can be used to directly estimate 1,000-year events via standard flood frequency analysis.
How do mixed-population statistical techniques apply to flood frequency analysis? Traditional flood frequency analysis relies on the assumption that all flood peaks are from the same population. Yet we know that in many areas flood events may arise from two or more hydrometeorological conditions. For example, in the southeastern United States, flood flows might arise as the result of
frontal systems or hurricane systems. The magnitudes and frequencies of flows from these two sources may be quite different, indicating that combining them into a single peak flow sequence may be inappropriate.
Continued research is needed to develop and improve techniques for extrapolation of hydrologic data and predictions to extreme events. The use of stochastically generated rainfall events implicitly relies on the same assumption inherent in statistical flood frequency analysis—that extreme rainfalls follow the same statistical patterns as the more frequent rainfalls that are the basis for estimating the parameters of stochastic models. Routing statistically generated rainfall through a rainfall-runoff model to estimate extreme hydrologic events also contains the assumption that the hydrologic response to extreme rainfalls can be modeled in the same way as the response to the more frequent rainfalls used to calibrate the model.
Improved modeling may be one solution to better understanding and prediction of flood events and will requires a mix of real-time dynamic modeling and retrospective deterministic and stochastic modeling. Is there any pattern to hydrologic events such that events preceding a hazardous event can be recognized and thus aid in the prediction of a major hydrologic event? Can we identify signatures in hydrologic signals that when combined in certain ways lead to potentially hazardous situations? This would require detailed analyses of past hazardous events. It also requires data adequate to characterize an actual event and the conditions leading up to it.
Research is also needed to improve network design. What are the data needs for real-time flood forecasting? How can gaging programs be optimally designed to provide these needed data? Possibly the examination of geologic records can be used to determine the magnitude and frequency of rare events. We know there have been dramatic climatic shifts over geologic time. How did these shifts impact hydrology? How can past climatic changes be factored into extreme flood event estimation using paleofloods?
Understanding the causes and consequences of floods requires continued research on the geomorphology of stream systems. Relationships between bank stability and bank erosion, depositional patterns, scour patterns, and meander characteristics need to be studied as a function of stream geology and hydrology and hydraulics and how changes in these factors induce changes in the stream. Such problems are particularly severe in urban areas, where formerly stable channels become unstable as a result of increased flood peaks and/or flow volumes and reduced sediment loads. A wealth of information on geomorphology could be extracted from the USGS's vast discharge measurement file.
It is often unclear how to evaluate the significance of impacts from stormwater runoff on aquatic ecosystems, including environmental indicators as well as traditional water quality parameters. For instance, the Center for Watershed Protection (a nonprofit organization in Maryland) recently released a proposed methodology for applying environmental indicators to the assessment of storm-
water quality control programs, because chemical parameters are insufficient. Twenty-six indicators are proposed, within several categories, including water quality (toxicity testing and chemical conditions); physical and hydrologic (e.g., physical habitat, flooding frequency, and dry weather flows); biological (e.g., fish and macroinvertebrate assessments); social (e.g., public surveys); programmatic (e.g., Best Management Practices installed); and site-specific (e.g., BMP performance). The potential for the Biological Resources Division of the USGS to get involved in the evaluation of stormwater impacts could be considered.
Droughts
Droughts can be thought of as creeping disasters, and often the public is not convinced that a drought exists until it reaches its most severe stages (Matalas, 1991; Grigg, 1993, 1996). The nation's 1988 drought cost an estimated $40 billion in damages and 5,000 to 10,000 deaths (includes heat-related deaths) (NDMC, 1997). The losses resulted from reduced crop yields, severely disrupted barge traffic, and critically low municipal water supplies (Kunkel and Angel, 1989). Environmental impacts of drought also are of great concern. Plants with shallow root systems are damaged or killed and at best have zero growth. There were also major reductions during 1988 in wildlife populations, such as pheasant, ducks, and fish. Because of the lack of surface runoff and low in-stream flows, nutrient fluxes ceased in the riparian corridors. Lack of nutrients and above-normal temperatures combined to cause high mortality of aquatic life. On a global scale, the occurrence of droughts historically has had great impact on the political stability of affected regions, as drought has led to food shortages, starvation, and the mass migration of peoples.
Dracup et al. (1980) proposed the following set of criteria to be considered when defining drought: (1) Is the primary interest in precipitation (meteorological drought), streamflow (hydrologic drought), or soil moisture (agricultural drought)? (2) What is the fundamental averaging period of the time series to be studied (e.g., months, seasons, or years)? (3) How are drought events distinguished analytically from other events in the time series? (4) How are the regional aspects of droughts to be considered? Once the nature of the water deficit has been selected, the time or duration to be used as an averaging period must be chosen for the meteorological and hydrologic variables under consideration. For the study of drought, this can range from months to seasons and years. The period chosen will directly impact the data's sample sizes, which will impact the number and type of drought events. For a given hydrologic record, a shorter averaging period results in a larger number of drought events, while a longer averaging period results in a smaller number of drought events. In this context the regionalization of drought is extremely important. Droughts are inherently regional in nature, and thus their areal extent is an important characteristic to be considered (Karl, 1983). Another important factor is that due to the small sample
size of drought events, drought analysis may be hampered; regionalization on the other hand, provides a means for increasing the sample size.
Drought is also strongly related to the climatological and geological characteristics of a region, and a general drought definition can be considered to be a water shortage with reference to a specified need for water in a conceptual supply and demand relationship (Dracup et al., 1980). The occurrence and persistence of droughts is linked ubiquitously to high surface temperature anomalies. Over the last century, the driest periods in the central United States have consistently occurred during some of the warmest periods of the century. The 1988 drought is a prime example: it ranked sixth in dryness and first in warmth for the central region of the United States over the past 100 years (McNab, 1989).
Atmospheric circulation also plays a major role in drought severity. The occurrence or absence of precipitation on any individual day can be related to daily atmospheric circulation patterns. Days with little or no precipitation during both drought and nondrought periods can be attributed to the absence of destabilizing temperature or velocity gradients or to widespread descending vertical motion (McNab, 1989). These precipitation-inhibiting circulations recur more frequently or persist longer during drought periods than nondrought periods. It is the persistence or frequently recurring character of these circulation patterns that is unique to droughts (Namias, 1985). Prolonged droughts occur when large-scale anomalies, such as those associated with ENSO, in atmospheric circulation patterns persist for months, seasons, or years (NDMC, 1995, 1997). Hydroclimatological features, which describe the spatial and temporal connections between atmospheric circulations and the hydrological cycle at the regional scale, can be used to assess the predictability of drought severity and duration. Regional anomalies of precipitation, temperature and evapotranspiration, and their time evolution are prime candidates for such studies. One complicating factor is natural climate variability and the lack of sufficiently long datasets to be able to separate stationary, nonstationary, and random components in hydrological time series.
The amount and duration of the deficit influence the severity of the drought (Changnon, 1989). In 1965 Palmer developed an index to measure the departure of the moisture supply. To date, the Palmer Drought Severity Index (PDSI) is the most commonly used drought severity indicator (Hrezo et al., 1986). The main objective of the index was to provide a standardized measurement of soil moisture conditions, so that comparisons using the index could be made between different locations and different months. The PDSI is a "meteorological" drought index that responds to weather conditions that have been abnormally wet or dry. An index value of +4.0 indicates an extremely wet period, while an index value of-4.0 indicates an extremely dry period. Values usually fall somewhere in between. The PDSI is determined monthly for the 344 climatic divisions of the United States. Each climatic region is supposed to exhibit locally homogeneous climate and geographic characteristics. The PDSI is a commonly used tool
because it provides policymakers with a measure of the abnormality of a region's recent weather patterns. It allows current conditions to be viewed in a historical perspective, in addition to providing spatial and temporal representations of historical droughts. Nonetheless, the widespread application of the PDSI has been the target of much scientific discussion, especially with regard to its transportability from one region to another (Alley, 1984). Some of the index's shortcomings are that (1) it does not apply to the definitions of hydrologic or agricultural drought; (2) the values quantifying the intensity and timing of drought were arbitrarily based on Palmer's study of Iowa and Kansas and may not be adequate for other regions of the country; (3) it is sensitive to the available water content as a function of soil texture, and therefore use of the PDSI for an entire climatic division may not be appropriate; (4) snowfall and snow accumulations are not included in the index; and (5) the natural lag between rainfall and runoff response is not considered (NDMC, 1996). For these reasons the PDSI cannot be used to predict the onset of drought, and it is useful only in determining the stage or severity of a drought episode.
On the other hand, a strong need exists to establish a robust paradigm to evaluate the risk of drought. A probabilistic approach to drought analysis as used in flood frequency analysis does not exist. While low-flow analysis is a meaningful measure of drought, it is not a sufficient definition.
Data Needs Related to Drought
Currently, a scarcity of comprehensive datasets limits scientific understanding of the causes, onset, and effects of droughts. Unlike floods, droughts evolve slowly and may not be recognized until they are almost over and the opportunity for data collection is lost. The USGS should develop coordinated plans for data collection related to droughts in order to provide a comprehensive picture of how a drought develops and evolves. Coordination of such data collection programs with NOAA's climate data collection programs and NASA's large-scale remote sensing activities offers a timely opportunity to enrich the integrated databases supporting research, analysis and management of drought. Key data collected by the USGS that are relevant to drought include low-flow measurements and flow duration measurements in surface water and long-term ground water-level fluctuations. Long-term water-level measurements in lakes and wetlands also are essential to document the effects of drought and to provide data to construct hydrologic models. Monitoring of ground water levels and soil moisture also is extremely important during drought periods, and long-term fluctuations in ground water levels are often an excellent indicator of overall climatic patterns. These measurements need to be combined with climatological measurements of precipitation, temperature, wind, soil moisture, and other parameters in order to create a complete picture of droughts as extreme hydrologic events.
Technique Development Related to Droughts
Drought research and technique development should be undertaken together in order to collect relevant datasets for drought monitoring and prediction. As with high-flow events, understanding droughts may require a shift away from the collection of very high-quality data at few sites to the collection of lower-quality data at more sites. Improved data collection can result from advances in instrumentation for low-flow measurement and soil moisture measurement at remote sites to acquire a regional perspective. Better ability to predict drought periods could be applied to improve water management systems, enabling better planning by water users (e.g., municipalities and agriculture) and better protection of drought-intolerant aquatic systems.
A fundamental aspect of hydrologic drought is the regional character of surface-ground water interactions in different landscapes, especially with regard to lake and stream recharge. Such interactions are natural processes that are strongly affected by regional physiographic, geomorphologic, and climatic attributes, and they typically exhibit slow responses to meteorological forcing. Therefore, the development of objective measures to describe the magnitude and seasonality of the interaction between surface and ground water systems is needed to improve drought forecasting skill on a regional basis for water resources applications.
Research Needs Related to Droughts
Predicting the onset of a drought is the major challenge in drought-related research (Matalas, 1991). Critical science issues underlying this challenge include the need for specific, objective criteria to define the initiation of drought, and the need for quantitative forecasts of drought attributes such as duration, severity, and spatial variability. Since public perception of drought is intimately associated with the specific water needs of different users, it is important to research and develop forecast models that can be used operationally to support existing decision-making procedures.
Since hydrologic drought is normally associated with the effects of precipitation deficits on streamflows, reservoir and lake levels, and ground water supplies, there is a phase lag between hydrologic and meteorological droughts. This improves the potential hydrologic predictability. Research focusing on the linkages between the land and atmospheric processes of the hydrologic cycle should therefore lead to a better understanding of drought phenomena and their predictability.
Research is also needed on appropriate minimal streamflows for ecological health. Water quality-based permit limits for dischargers throughout the United States are based on 7-day, 10-year low flows (7Q10). Many are questioning the appropriateness of this flow statistic to protect aquatic life and our ability to estimate the 7Q10 accurately, particularly for ungaged sites.


