Mobility between science and engineering fields was evident among certain groups of doctorates.
-
Among both health and agricultural/environmental sciences doctorates, between 16 and 17 percent were employed in biological sciences. Conversely, a high proportion (14 percent) of biological sciences doctorates was employed in health sciences.
-
The other fields with notable proportions working in another science/engineering specialty were mathematical sciences where 13 percent worked as computer scientists and physics/astronomy where 12 percent worked as engineers.
Primary Work Activity
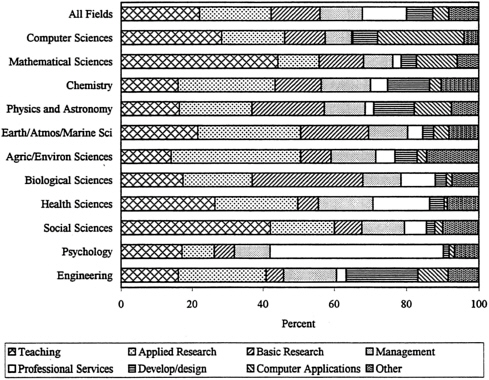
As distinguished from occupation, primary work activity was defined as the activity on which the most hours were spent during a typical week on the job. In 1995, 22 percent of science and engineering doctorates listed teaching as their primary work activity. Applied research was listed by 20 percent and basic research by 14 percent. These activities were followed in frequency by professional services and managing/ supervising, each at 12 percent, and development/design at 7 percent (see Table 12 ).
-
Mathematical sciences and social sciences had the highest proportions of doctorates with teaching as their primary work activity (44 and 42 percent, respectively). These were also the fields with the highest proportions employed in educational institutions.
-
Doctorates in biological sciences and earth/atmospheric/marine sciences were most likely to be engaged in applied or basic research (51 and 48 percent, respectively). Psychology Ph.D.s were least likely to be engaged primarily in research (15 percent).
-
Managing/supervising as a primary work activity ranged from a high of 15 percent for health science and engineering doctorates to a low of 7 percent for computer sciences doctorates.
-
As expected, some activities were concentrated in certain fields: 48 percent of psychology doctorates were primarily engaged in professional services; computer applications was the primary activity for 24 percent of computer sciences Ph.D.s; and 20 percent of engineers were primarily doing development/design.
-
The proportion reporting applied research as the primary work activity declined as years since the doctorate increased, from 26 percent for recent Ph.D.s (those with 5 years or less since the doctorate) to 16 percent for those more than 15 years since doctorate award (see Table 13 ).
-
On the other hand, the proportion primarily teaching grew as time since the Ph.D. increased, from 19 percent for recent Ph.D.s to 29 percent for those with more than 25 years since the degree.
-
The proportion primarily engaged in managing/supervising also increased, from 4 percent of recent Ph.D.s to between 16 and 17 percent of those with more than 15 years since the degree.
FIGURE 6. Employed science and engineering Ph.D.s, by primary work activity and field, 1995.