
Page 58
9—
Trend Comparisons
Comparisons Between MSU and Radiosonde Data Sets
One means of assessing the accuracy of the MSU data set is to compare its results with those of other independent measurement systems. Strictly speaking, it is impossible to compare time series of global-mean tropospheric temperature anomalies based on satellite data with radiosonde measurements, because the radiosonde network does not provide global coverage (see the discussion in the Radiosonde Observations chapter). To illustrate this point, Figure 9.1 compares two global-mean tropospheric time series based on the same MSU measurements. The red curve represents full global coverage, while the pink curve is based on just a limited sampling of grid points designed to mimic the existing distribution of radiosonde stations. The least squares trend of the global coverage time series is 0.06 ±0.11 °C/decade, compared with 0.14 ±0.10 °C/decade for the sub-sampled time series. The differences between these two curves indicate that the radiosonde network may not be sufficiently dense to provide reliable estimates of global-mean temperature anomalies.
Although one cannot compare MSU and radiosonde-based time series of complete global-mean tropospheric temperature anomalies, it is nonetheless possible to compare the sub-sampled MSU time series in Figure 9.1 with the corresponding radiosonde-based time series. Incontinue
Page 59
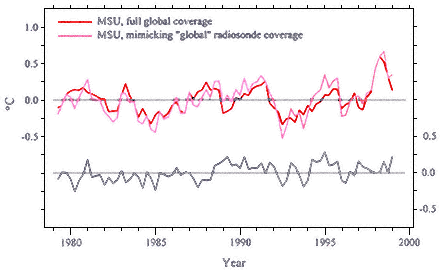
Figure 9.1
Global-mean seasonally averaged tropospheric time series based on the same
MSU 2LT measurements (Christy et al., 2000). The red curve represents full
global coverage, while the pink curve is based on a limited sampling of grid points
designed to mimic the existing distribution of radiosonde stations. The dark gray
curve (bottom) represents the difference between the sampled and full data sets.
The light gray lines represent the means of each time series. The first season is March–
May 1979 and the last season is December 1998–February 1999. The sub-sampled
MSU data were supplied by the U.K. Meteorological Office (UKMO).
principle, a close match constitutes an independent verification of the MSU data. The two curves, shown in Figure 9.2, exhibit a number of common features and rather similar trends.
Uncertainties exist in assigning confidence levels to trends because of persistence in the data, which may or may not be due to the trend itself. There is no unique set of confidence intervals for the relatively short atmospheric temperature time series considered here. The estimated confidence intervals depend on the underlying statistical model that is used to describe the data, as well as on the exact period considered and the sampling interval (i.e., whether one uses monthly, seasonal, or annual means). One approach, following Cryer (1986), yields trends of 0.14 ±0.10 °C/decade for the subsampled MSU data and 0.04 ±0.07continue
Page 60
°C/decade for the radiosonde data (see Hurrell et al., in review). Other approaches suggest even larger confidence intervals (Santer et al., 2000).
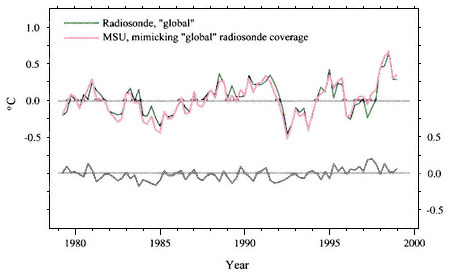
Figure 9.2
Equivalent 'global-mean' MSU 2LT and radiosonde tropospheric time series.
The pink curve in this figure is identical to the pink curve in Figure 9.1 and represents
MSU data from those grid points from which long-term radiosonde observations are
available. The green curve in this figure is the average of the radiosonde data (Parker
et al., 1997) at the same grid points. The dark gray curve (bottom) represents the difference
between the MSU and radiosonde data sets shown in this figure. The axes are the same as in
Figure 9.1. Both data sets were supplied by the UKMO.
Some of the discrepancies between the MSU- and radiosonde-based time series are a consequence of changes in radiosonde instrumentation that have not been corrected. Christy et al. (2000) performed a comparison analogous to the one shown in Figure 9.2, but for a subset of 97 radiosonde stations operated by the United States, whose records are believed to be free of such artificial discontinuities for a specific period of time (Figure 9.3). The level of agreement between the radiosonde data and the MSU data was moderately improved by restricting the comparison to this more limited selection of stations. High, middle, and low latitude subsets of these stations (not shown) exhibited a comparably high level of agreement with the MSU data. For the 97 stations as acontinue
Page 61
whole over the 16-year period from 1979 to 1994, the station-by-station root mean squared (RMS) difference in monthly anomalies averaged 0.45 °C (ranging from 0.18 to 0.78 °C), and the RMS of station-by-station trend differences was 0.11 °C/decade. When averaged over the 97 stations, as well as into the three regional subsets, the RMS of annual anomaly differences ranged from 0.05 to 0.11 °C, and the trends were virtually identical.
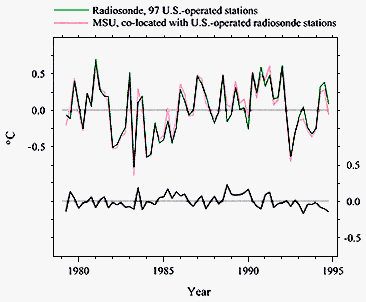
Figure 9.3.
Time series average of radiosonde data from 97 U.S.-operated stations, believed
to be free of artificial discontinuities (green curve). MSU 2LT data are from co-located
grid boxes (pink curve). The dark gray curve (bottom) represents the difference between
the MSU and radiosonde data sets shown in this figure. The axes are the same as in Figure
9.1, except that the data extend only through 1994.
Hurrell et al. (in review) and Santer et al. (2000) performed similar subsampling studies, but over a considerably larger geographical area. The work by Hurrell et al. compared the MSU data to a somewhat different radiosonde data set that included more radiosonde stations, but did not correct for some of the changes in radiosonde instrumentation. Incontinue
Page 62
the temperate latitudes of North America, the RMS of grid-point monthly anomaly differences ranged from 0.4 to 0.8 °C. In addition, Hurrell et al. examined the impact of spatial averaging methods on trends and concluded that given the spatial coherence of the troposphere, especially in the tropics, the temperature variations are mostly captured by the present sparse distribution of stations if they are latitudinally averaged. Hurrell et al. found that global trends for 1979–1998 were +0.06 (±0.11) °C/decade for MSU 2LT and +0.04 (±0.07) °C/decade for radiosondes. Santer et al. (2000) examined alternative methods of computing global-scale trends in which spatial averaging procedures and trend fitting methods were varied, giving results with larger trend differences and error bars over shorter time scales.
Among the factors that need to be considered in accounting for the differences between the results of Christy et al. (2000), Hurrell et al. (in review), and Santer et al. (2000) are: (a) differences in the size of the grid boxes over which radiosonde data are averaged before comparing them with the satellite data, (b) the different quality control criteria used for determining which stations should and should not be included in the analysis, (c) the use of daily versus monthly radiosonde reports, (d) the treatment of missing data, and (e) how the emissions from the surface that influence MSU values are handled. Further work will be required to determine the relative importance of each of these factors. In addition, given the multiplicity of decisions involved in the design of algorithms for converting satellite radiances into temperatures, the comparison of satellite and radiosonde trends should be revisited following independent verification of these data sets. Efforts to produce such data sets are already under way.
Evidence Concerning Surface Versus Tropospheric Temperature Trends
Figure 2.3 shows time series of surface and tropospheric global-mean temperature anomalies. The former are based on surface station and ship observations interpolated onto a global grid, and the latter are based on the latest version (version D) of the MSU data that have been corrected for the orbital decay problems pointed out by Wentz and Schabel (1998). A difference in the trend over this 20-year period is clearly apparent. Surface temperature has been increasing at a rate ofcontinue
Page 63
about 0.1–0.2 °C/decade, whereas tropospheric temperature has changed so little that a different sign for the trend is obtained, depending on whether or not the final year of the record is included—a year that was extraordinarily warm in the wake of the exceptionally strong 1997–98 El Niño. Spatial averages of surface and tropospheric temperature trends over the tropics/extratropics, Northern Hemisphere/Southern Hemisphere, and land/ocean exhibit qualitatively similar differences.
Direct comparison of surface and tropospheric temperature changes is feasible with radiosonde observations, because they include both surface and upper-air data. For 1979–98, Angell (1999) found the surface to have warmed more than the mid-troposphere (850 to 300 hPa layer) globally, in qualitative agreement with the results from the surface network and MSU. However, the difference was not statistically significant because of the large confidence intervals of the trends, due to the relatively short data period and small radiosonde network used. In selected high latitude regions in the Northern Hemisphere, Ross et al. (1996) found evidence of decreasing temperature trends with height from the surface through the troposphere for the period 1973–93. Using longer radiosonde data records extending back approximately forty years, Angell (1999) found less pronounced (but still noticeable) differences between surface and tropospheric temperature trends than during the satellite period, consistent with Jones's (1994) comparison of Angell's mid-tropospheric (850 to 300 hPa) radiosonde data with independent surface observations.
There is independent evidence that bears on the question of how temperature at various levels of the tropical troposphere has changed during the past 20 years. Even though the radiosonde data do not appear to show evidence of a rise in the mean freezing level in the tropics during this period (Gaffen et al., in review), tropical glaciers in the Andes and in the high mountains of Africa and Indonesia have retreated dramatically during this 20-year period (Diaz and Graham, 1996; Thompson et al., 1995; Thompson, 1999). Another indication that tropospheric temperature has increased is the fact that satellite and radiosonde measurements indicate that the water vapor loading of the tropical troposphere has increased (Wentz and Schabel, in press; Gaffen et al., 1992; Gutzler, 1992, 1996).
Although the above findings are both suggestive of a warming of the tropical troposphere, neither can be regarded as a definitive indicator of how tropospheric temperature has changed during this period. Thecontinue
Page 64
number of tropical glaciers is quite limited, and cloudiness, precipitation, and wind speed, as well as temperature, could be factors in their mass balance. With regard to the finding that tropospheric water vapor is increasing, it should be noted that most of the water vapor loading of the tropical atmosphere tends to be concentrated within the lowest one to two kilometers of the layer sampled by the MSU measurements, and may therefore be more representative of surface temperature than tropospheric temperature.
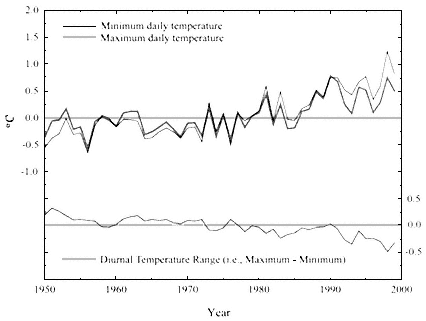
Figure 9.4.
Time series of average daily maximum (gray curve) and minimum (black curve)
land-surface air temperature anomalies, and their difference, the diurnal temperature
range (maximum minus minimum; dark gray curve at the bottom). This figure, which
encompasses the period 1950–99, illustrates a tendency toward a greater increase in
minimum than in maximum temperature. The annual anomalies are computed as differences
from the 1961–90 mean and use data from Peterson and Vose (1997).
Over many land areas, the range between daily maximum and minimum temperatures (see Figure 9.4) has been decreasing in recent decades, apparently largely in response to an increase in cloud cover (Daicontinue
Page 65
et al., 1999). Daily maximum temperatures better reflect the temperature of the air mass as a whole (i.e., the tropospheric temperature), whereas the minimum temperatures often bear little relation to temperatures aloft because they are strongly influenced by the presence or absence of inversion layers close to the ground (Dai et al., 1999; Hurrell et al., in review). The fact that daily minimum temperatures have been rising at a more rapid rate than daily maximum temperatures supports the notion that surface temperature may actually be rising more rapidly than tropospheric temperature.
Interpretation of the Differences between Observed Surface and Tropospheric Temperature Trends
The warming trend of approximately 0.1–0.2 °C/decade that has been observed at the earth's surface during the past 20 years clearly exceeds the observational uncertainties, including the effects of urbanization (Hansen et al. 1995; Hurrell and Trenberth, 1998). It is evident from Figure 6.2 that warming is evident in both hemispheres, at most latitudes, over most of the oceans, and over most land areas. It is also evident during all seasons of the year.
There is more of a diversity of views among panel members with respect to the degree of confidence that can be attached to the absence of a warming trend in the MSU measurements. Those more inclined to take the MSU measurements at face value cite the high degree of consistency with radiosonde measurements (Figures 2.3, 9.2, and 9.3), whereas those less inclined to do so note the retreat of the tropical glaciers and the increasing burden of water vapor (Wentz and Schabel, in press). The seasonal and interannual changes in the MSU temperature, sea surface temperature (see Figure 9.5), and atmospheric water vapor are closely coupled in the tropics according to a relatively simple thermodynamic model (Wentz and Schabel, in press). However, on decadal time scales, the trends of sea surface temperature and water vapor continue to exhibit the same close coupling, whereas the MSU and radiosonde temperature trends are less correlated. Some panel members are concerned that the satellite measurements may contain spurious discontinuities resulting from changes in the times of day (i.e., diurnal sampling) at which the satellites carrying the MSU instruments pass overhead and the influence of radiation emitted from the underlying land surface.break
Page 66
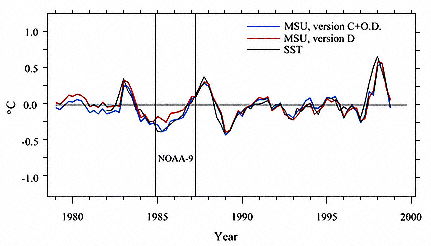
Figure 9.5.
Lower to mid-tropospheric temperature time series from MSU version C with orbital decay
corrections (C+O.D.) (aqua curve; Wentz and Schabel, 1998), version D (red curve; Christy
et al., 2000), and, for reference, sea surface temperature (black curve; updated from Reynolds
and Smith, 1994). The period of the NOAA-9 MSU observations is also indicated. The data are
seasonal averages over the tropics (20 °N to 20 °S). The MSU data are from the period 1979–1998,
and the SST data are from November 1981 through December 1998. The MSU data have been divided
by 1.6 to normalize the amplitude of the tropospheric temperature variations to that of the SST data.
Some of these concerns were recently addressed with a reissuing of the MSU data set in a form in which adjustments have been made to account for orbital changes, instrument heating, and changes in diurnal sampling (see chapter 7). This adjusted version is referred to as version D. Santer et al. (in review), Christy et al. (2000), and Hurrell et al. (in review) have performed an analysis of the differences between versions C (the previous version) and D. An example of how the recent adjustments can affect the MSU temperature trend is shown in Figure 9.5. Three anomaly time series of the tropics are shown: MSU version C with the orbital decay correction (C+O.D.) of Wentz and Schabel (1998), the more recent MSU version D (Christy et al., 2000), and, for reference, the sea surface temperature data set of Reynolds and Smith (1994). A comparison of versions C+O.D. and D clearly shows a discrepancy between the two versions for the periods of the NOAA-7, -9, and -12continue
Page 67
satellites. During the NOAA-9 period, version C+O.D. more closely tracks the SST data than version D, although version D tracks the radiosondes more closely in this same period. As mentioned above, the treatment of NOAA-9 was particularly problematic due to a relatively small inter-satellite overlap period and gain drift. In version D, a relatively large correction for gain drift is applied to NOAA-9, equivalent to 0.17 °C over two years, bringing its temperature data into closer agreement with the observations of NOAA-6 and NOAA-8, which were also observing during that period. However, the changes to the NOAA-7 and NOAA-12 data are actually greater and in the opposite direction than the adjustments to the NOAA-9 data.
Part of the observed difference between global-mean trends in surface temperature and tropospheric temperature may be a reflection of the incomplete coverage of surface data, which are sparse over the higher latitudes of the Southern Hemisphere. Recent calculations of Santer et al. (in review), based on the sub-sampling methodology described earlier, indicate that perhaps as much as one-third of the difference may be due to this effect. However, the panel views it as highly unlikely that incomplete spatial coverage of the surface data could be the primary reason for the disparity in the trends.
It seems more likely that at least part of the observed disparity is a reflection of real differences between temperature trends at the two levels. Temperatures near the earth's surface and temperatures aloft are subject to different influences, and they are often de-coupled from one another because of the presence of a temperature inversion within the atmosphere's lowest 1–2 km (Trenberth et al., 1992). Year-to-year variations in the temperature of the tropics that occur in association with El Niño tend to be about 30% greater in the middle troposphere than at the earth's surface (Hurrell and Trenberth, 1998; Wentz and Schabel, in press). In contrast, variations in. circulation over the high northern latitudes exert a stronger influence on global-mean temperature at the earth's surface than in the middle troposphere (Hurrell and Trenberth, 1996). The emissions from volcanic eruptions are believed to produce stronger cooling of the troposphere than at the earth's surface (Bengtsson et al., 1999; Hansen et al., 1997).
Within a given sampling interval like the past 20-years, any changes in the temperature structure of the atmosphere that might be occurring in response to a long-term increase in atmospheric concentrations of greenhouse gases and aerosols may be masked by internal variability ofcontinue
Page 68
the climate system (e.g., phenomena like El Niño), or variability forced by volcanic eruptions, fluctuating solar emissions, or even by short-term, naturally occurring variations in greenhouse gas concentrations themselves. For example, if the eruption of Mt. Pinatubo in 1991 were stronger and longer lasting than that of El Chichon in 1982, this would have contributed to the disparity between surface and tropospheric temperature trends of the past two decades. The longer the period of record considered, the stronger the likelihood that these naturally occurring short-term fluctuations will average out so that the observed trends are representative of the atmospheric response to longer term trends in atmospheric composition.
The modeling evidence discussed in the following section indicates that a 20-year record is subject to considerable ''sampling variability" due to the presence of the short-term fluctuations in global-mean temperature discussed in the previous paragraph. As further evidence, the panel notes that according to the radiosonde record, the lower to mid troposphere warmed by a few tenths of a degree C during the late 1970s (Jones, 1994; Santer et al., 1999). Hence, the radiosonde record, to the extent that it can be believed, serves to illustrate the sensitivity of the trends to the particular choice of the period of record over which they are computed, and it suggests that the apparent lack of agreement between surface and upper air temperature trends during the past 20 years may not be representative of the longer term behavior of the climate system.
Insights Derived from Model Simulations
Much of our physical understanding of the climate system is encapsulated in models. Climate models are capable of simulating many of the processes that contribute to the observed differences between variations in surface temperature and tropospheric temperature, and they realistically represent the vertical structure of El Niño-related temperature fluctuations and the thermal signature of time-varying circulation patterns over higher latitudes. Unlike the climate models of a decade ago, the models used in recent simulations have enough horizontal resolution and strong enough coupling with ocean and land to realistically simulate not only the patterns of natural variability on interannual time scales, but also the amplitudes of these internal modes of variability of the climate system. Extended control runs of suchcontinue
Page 69
models with no external forcing have been used as a basis for estimating the likelihood that the natural variability of the atmosphere-ocean system is responsible for the differing trend in surface temperature and upper air temperature (Hansen et al., 1995; Hurrell and Trenberth, 1998; Santer et al., in review). The models indicate that natural variability may indeed have contributed to the observed discrepancy, but unless the models are seriously underestimating the natural variability, it is highly unlikely that a differential trend as large as the one observed during the past 20 years could be entirely due to the internal variability of the climate system.
Models provide one way to relate observed atmospheric changes to those at the surface. This is typically done by forcing a climate model with estimates of past changes in carbon dioxide, methane, ozone, and other greenhouse gases, as well as solar variations and volcanic and anthropogenic aerosols. The types of models used to do this are either atmospheric general circulation models (GCM) coupled to oceanic GCMs, or atmospheric GCMs driven by observed SSTs. Both approaches have their relative advantages. Hansen et al. (1993, 1997), and Bengtsson et al. (1999) have explored the former approach. Bengtsson et al. note that the natural variability in globally averaged temperature time series—which typically have a standard deviation of 0.2 to 0.3 °C for a 20-year interval—makes it difficult to establish long-term temperature trends using a 20-year period. The coupled atmosphere-ocean GCM simulations of Hansen et al. (1997) suggest that dynamic coupling of the atmosphere and ocean tends to increase the variability of the troposphere-surface temperature trend difference. These studies, and those of Tett et al. (1996), highlight the importance of including the decrease in stratospheric ozone during the past 20 years, as it substantially reduces upper tropospheric warming and results in cooling in the lower stratosphere. In a series of fully coupled ocean-atmosphere and uncoupled (specified SST) climate model experiments with a range of natural and anthropogenic forcings, Hansen et al. (1997) found that different forcing mechanisms in the model simulations have different characteristic vertical temperature signatures.
Some of the forcing combinations explored by Hansen et al. (1997) yielded surface-troposphere trend differences similar to those found in the observations. Folland et al. (1998) used an atmospheric GCM forced by observed SSTs, greenhouse gases (including stratospheric and tropospheric ozone), and tropospheric sulfate aerosols for the period from 1950 to 1994, and similarly noted much improved agreement withcontinue
Page 70
observed temperature profile changes. They were not, however, able to reproduce the well-established strength of the observed surface warming over land. These changes have been linked in part to changes in atmospheric circulation (Hurrell, 1996), which have to be simulated to correctly reproduce the observations. In addition, it is quite possible that model-observation differences arise as a result of errors in the greenhouse gas and aerosol forcings that are applied. Thus, although climate models indicate that changes in greenhouse gases (including tropospheric and stratospheric ozone) and aerosols play a significant role in defining the vertical structure of the observed atmospheric temperature changes, model-observation discrepancies indicate that the definitive model experiments have not yet been done.
To reduce model-based discrepancies, we need better information on the changes in radiative forcings as a function of height, especially tropospheric aerosols and ozone, as well as water vapor changes and cloud changes caused by aerosols. In addition, it is likely that further work will be needed to improve model representations of the atmospheric boundary layer, clouds, and vertical heat transport in order to fully represent the observed temperature changes. Finally, models need to include more realistic representation and coupling of the stratosphere, troposphere, and ocean to fully capture the vertical structure of temperature change.
Concluding Remarks
The various kinds of evidence examined by the panel led it to conclude that the observed disparity between the surface and lower to mid-tropospheric temperature trends during this particular 20-year period is probably at least partially real. Just as the different factors that control daily maximum and minimum temperatures are evidently giving rise to a trend in the diurnal range of temperature, the different factors that control temperatures at different levels of the atmosphere are capable of altering the vertical profile of global-mean temperature. Human induced forcings (e.g., increasing concentrations of well-mixed greenhouse gases and stratospheric ozone depletion) give rise to long term changes in the vertical profile, while natural forcings such as volcanic eruptions and 'unforced' natural modes of climate variability such as El Niño give rise to large year-to-year changes which can alsocontinue
Page 71
contribute substantially to the trends observed during a period of record as short as 20 years. The presence of these sampling variations, together with the remaining uncertainties inherent in the temperature measurements themselves, preclude the possibility of drawing more definitive conclusions concerning the cause of the observed disparity in the trends.
It is clear from the foregoing that reconciling the discrepancy between the global-mean trends in temperature is not simply a matter of deciding which one of them is correct, or determining the ideal "compromise" between them. In the long term, it will require major advances in the ability to interpret and model the subtle variations in the vertical temperature profile of the lower atmosphere that occur in association with the internal variability of the climate system in response to volcanic eruptions and solar forcing, and in connection with changes in atmospheric composition due to human activities. It will also require more precise and extensive satellite- and ground-based observations for monitoring climate change, and changes in the way these observations are implemented and processed. A detailed consideration of these issues is beyond the scope of the panel's charge (see Preface). However, the panel does offer a number of recommendations (see chapter 4) for short-term actions that it views as steps in the right direction.break


