
1
Issues and Considerations in the Assessment of Mission Size Trade-offs in the Earth and Space Sciences
The concept of small, short-duration missions has existed virtually since the dawn of the space age. The Explorer series comprised NASA’s first missions and was devoted to focused science objectives. This approach shifted in the late 1970s, when larger programs aimed at exploring the solar system (such as Viking) and programs being conceived to observe the universe in the visible spectrum (such as Hubble) and study Earth’s upper atmosphere (such as the Upper Atmosphere Research Satellite (UARS)) became a focus of NASA science programs.
The space research community questioned the wholesale shift from smaller missions,1 and there were efforts to restore a broader, more flexible approach. In 1988, the Small Explorer (SMEX) initiative harkened back to the early Explorers. It emphasized shorter programs that would allow students to participate in the development of flight instrumentation and that offered opportunities for high-priority, focused science investigations and opportunities for a principal investigator to propose and manage an entire mission.2 Shortly thereafter, a faster-better-cheaper (FBC) approach emerged that embodied many of the practices established for SMEX and the early Explorers. Now the question is asked whether the pendulum has swung too far in the other direction, toward small, focused missions at the expense of a more mixed portfolio of small, medium, and large platforms.
This chapter outlines factors that can influence mission size and scope: (1) the laws of physics, which can impose inherent constraints for some space-based observations and measurements, (2) the scientific benefits of missions, which also entail large investments beforehand and afterwards (for example, calibration and data analysis), (3) the implementation of new management practices, (4) the role of education, (5) the need for technology development, (6) the access to space and its concomitant costs and timeliness, and (7) approaches to handling risk when implementing new management and spacecraft development practices. In addition, it reviews briefly some of the lessons learned from unsuccessful FBC missions, including the Wide-Field Infrared Explorer (WIRE), Lewis and Clark, the Tomographic Experiment Using Radiative Recombinative Ionospheric Extreme Ultraviolet and Radio Sources (TERRIERS), Mars Climate Observer, and Mars Polar Lander.
It is important to remember at the outset that the basic goal of space-based science is to answer fundamental questions about Earth and its place in the universe. It is the task of the sensing systems to gather the data required to respond to those questions. Findings are arrived at through data analysis and evaluation, are combined with other data and tools available to the investigators, and are then communicated in scientific reports. A science mission is shaped by its goals, and it is incomplete without a thorough process of data analysis.
FUNDAMENTAL SCIENCE LIMITS
Because the Earth and space sciences that utilize observations from space encompass diverse scientific disciplines, the goals for space missions are diverse as well. The scientific goals may call, for instance, for substantially different mission time horizons, orbit requirements, and size and complexity of instrumentation, and the measurements may exploit different segments of the electromagnetic spectrum. The scientific goals of a mission will also dictate measurement and instrument parameters—resolution, wavelength, repetition cycle, and area coverage, among others. The wide variety of goals and the associated instrumentation leads to a wide variety of mission complexities and spacecraft sizes. In many situations, scientific return is enhanced if the measurements from different instruments are temporally and geographically coincident, at least to within the tolerance allowed by the rate of change of the process being observed. The instruments that collect the desired data can be placed on a single large spacecraft or on separate smaller spacecraft, with the choice being guided by the scientific requirements, the cost constraints of the program, and the availability of technology for the instruments and spacecraft.
Context
Space-based instruments provide a means of collecting scientific data. These instruments are part of a larger dynamic system, shown in Figure 1.1. The observable properties3 of a body in space or of a physical region are typically known (at least approximately). This knowledge is used during the early stages of mission design to establish data requirements that are both scientifically sound and physically feasible. One output of mission design is a set of requirements for a suite of sensors and the supporting satellite. Technological improvements, especially during the past decade or so, now enable smaller and more innovative ways to build portions of the system. However, engineering and process improvements are only part of the story. Design options for a satellite system and its sensing instruments must respect the laws of physics. In the spirit of FBC, a good mission takes advantage of the realizable design space within these limits to achieve its scientific objectives in a cost-effective manner. Mission planners must ensure that a focus on speed or cost does not obscure the subtleties and deeper issues that surround the science system paradigm.
The size and complexity of a science mission are determined to a large degree by the scope of its goals. A comprehensive set of measurements necessitates a more capable spacecraft and instrument suite than would a more limited and focused set of measurements. Examples of missions with goals both broad and narrow abound in this report.4
The laws of physics set fundamental limits for scientific satellite systems, thereby presenting challenges, often major ones, for any space-based science enterprise. These limits depend on the phenomena to be observed (which of course conform to the laws of physics) and the observing systems themselves (whose design must also respect these laws). The limits that dominate this design space are summarized in the following paragraphs.
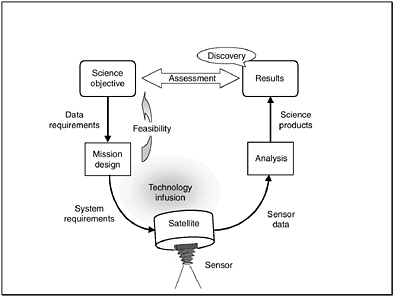
FIGURE 1.1 Conceptual model of the space science paradigm, starting from a science objective and progressing through the design of a suitable space-based measurement system to the flow of instrument data, which are transformed by thought and processing into results. Sensor and satellite implementation may take advantage of suitable technology advances. Many missions uncover new or unexpected results beyond those in the original science plan.
The Observable Phenomena
The goal(s) of a science mission establish the requirements for measurements or observations. These requirements are specific to the phenomena being measured or observed. Observing ozone depletion over Antarctica, for example, presents a very different situation (or set of physical circumstances) than measuring the gamma ray background of the universe or probing the depth of Europa’s icy mantle. Each process, phenomena, or variable to be observed behaves according to its own nature. Although this statement may appear at first to be obvious, its implications are profound. There is an immense diversity among the various phenomena open to observation from space. This diversity leads to substantial differences in the size, design, and cost of the missions to observe and measure those phenomena.
The attributes of the observable phenomena that have the greatest impact on mission design and, accordingly, on mission cost can be captured by asking four questions. First, where is the measurement site? In general, greater distances mean higher costs. Deep space missions require more launch and spacecraft capability than low-Earth-orbit missions, all else being equal. Powerful rockets are needed to escape Earth’s gravity, and fuel must be carried aboard the spacecraft to provide thrust for mid-course corrections and to assure insertion into the desired orbit at the final destination. Communications, both to and from the spacecraft, become more demanding as the distance from Earth becomes greater. Likewise, solar energy flux weakens as the distance from the Sun increases: this places greater demands on a satellite’s power and thermal control subsystems.
Satellite design also must account for the environmental conditions in transit and on orbit. Extra mass and more complex subsystems are necessary to build a spacecraft that is able to withstand the Sun’s heat at Mercury or
to survive the charged-particle radiation surrounding Jupiter, to cite but two examples. Even in near-Earth orbit, a change in altitude of only 200 km or so may double the intensity of a satellite’s radiation environment. Clusters of small spacecraft, required to separate the interlocking spatial and temporal phenomena in near-Earth space plasmas, for example, may result in a more complex, more costly, and more data-intensive mission than a single, simple spacecraft like the ones that performed the initial reconnaissance of the near-Earth space environment some 40 years ago. A space-based scientific mission thus depends critically on the location of the target site and the physical environment to be found there.
Next, when must measurements be made? This question raises two related aspects of data collection: timeliness and duration. Timeliness refers to the rate at which measurement opportunities occur, whereas duration refers to the length of time over which the measurements must be made. Both aspects are driven by the physics of the phenomena of interest.5 In short, the rate of change of the observed process determines the timeliness required of the observing platform.
The duration of a measurement program is another matter.6 Any observable phenomenon that might give rise to a cyclic signal must be observed over several complete cycles to provide enough data to characterize the underlying process.7 Often the signal of interest, especially if it shows a long-term trend, may be deeply obscured by natural short-term variations. Attempts to gather evidence of trends in the Earth’s climate are a case in point. If the mass of the polar ice sheets is increasing or shrinking, for example, this fact can be established only after accumulating a measurement time series of sufficient length that the seasonal and year-to-year weather effects can be averaged out.
Then, what is to be measured? The primary objective of a measurement program is to increase understanding of the observed phenomena. Often, however, the phenomena can be observed only indirectly. Most sensing instruments collect energetic particles or electromagnetic energy (such as light or radio waves). The reflective or emissive properties of each observation opportunity limit the instrumentation options.8
Lastly, how are the measurements to be transformed into scientific products? The objective of any science mission is to increase knowledge. Data collection is an essential step along the way, but it is not sufficient unto itself. For the science product to have value, generally the data need careful processing. This processing includes, at a minimum, removing artifacts and characteristics imposed on the data by the instrument and converting the engineering numbers represented by the sensor data into quantities that have physical utility. Transforming data into science products is necessarily a more complicated process if the primary data are only indirect or subtle indicators of the underlying phenomena of interest. Tighter constraints on data quantity and quality usually imply greater emphasis on the data analysis phase of a mission.
The issues raised by the last question are well illustrated by the topic of global warming. It is generally accepted that an average warming trend of only a few degrees Celsius over 100 years would induce substantial and perhaps catastrophic changes in our environment. Is there evidence for such a trend? Regardless of the answer, the question itself sets requirements for the scientific systems that would collect the necessary data. The original data must have sufficient accuracy, precision, and duration to expose the significant trends. To bolster confidence in the results, similar findings should be obtained by different means. This implies the need for several (statistically independent) observation methodologies, which in turn implies cross-calibration and a thorough understanding of the underlying physics in each case. Spatial and temporal differences between observations have to be folded in. The lessons of this example may be generalized to adapt to virtually all science questions that can be investigated
with satellite systems. Generating science products that respond to the original questions is an essential part of the science paradigm.
The Observing System
It would be nice if science satellites, with sufficient infusion of time and money, would shrink in cost and size and grow in capability as has digital computing hardware. Moore’s law,9 which has been borne out in practice for the past 20 years or so, states that computer chip size will shrink by a factor of two every 18 months. Unfortunately, there is no equivalent of Moore’s law for the many nondigital components required by space-based sensing systems. Indeed, the lower limit on physical size of certain satellite subsystems is determined by wavelength and therefore may be dictated indirectly by the physics of the phenomena to be observed. Likewise, the limits on power, data rate, or mission duration may be dictated primarily by the observing distance. No absolute guidelines exist. However, it is unrealistic to expect that all measurement requirements could be satisfied by small instruments on small satellites having missions of short duration.
Several recurring and well-established physical principles constrain the design and performance of a satellite and its sensing systems. Five fundamental physical limits are reviewed in the following paragraphs.10
Kepler’s laws (ca. 1620)—which are consequences of Newton’s laws (1687)—elegantly describe the motion of a body subject to gravitational forces and thus describe a satellite in orbit about the Sun, a moon, or a planet. For a satellite in near-circular Earth orbit, the time required to complete one revolution is determined primarily by its altitude.11 A satellite in Sun-synchronous Earth orbit—tuned to cross the equator always at the same local time—may be required if the science objectives for a mission require a constant angle of solar illumination, for example. Several candidate instruments may share that requirement. In such a case, there may be good reasons to mount these instruments on the same platform, resulting in a relatively large satellite.
The laws of orbital mechanics often demand a space–time trade-off: a shorter revisit interval implies less dense spatial coverage.12 Under such constraints, it may not be possible with only one satellite to achieve the simultaneity required for fine spatial coverage and short revisit intervals. The space–time trade-off may make a constellation of satellites an appealing way to meet the science objectives of a given mission, an option that can be cost-effective only thanks to the availability of technology for smaller, more capable satellites and sensors.
Newton’s laws of motion (1687) also describe the response of an individual body to its own inertia and to forces applied from internal or external sources. Both sorts of forces impact all spacecraft. Consider, for example, internally generated forces. Spacecraft that depend on solar panels for generation of electrical power may have to contend with rotations of their solar panels to keep them facing the Sun. Since every action has a corresponding reaction, this change in momentum must be compensated for.13 The reactive force becomes larger as the moving component becomes larger or more massive, as is often true with certain remote sensing instruments. These
unwanted reactive movements have to be offset either by larger spacecraft mass or by active subsystems such as reaction wheels designed to compensate for the inertial reactive movements. Mass and complexity, of course, usually add to the cost. In general, instruments that must provide very fine angular resolution require in turn that their host spacecraft satisfy very stringent angular stability requirements.
Consider also an example of externally generated forces. All spacecraft must be launched from Earth. Newton’s laws and the characteristics of available propulsion systems impose strict limits on the payload that can be lofted to Earth orbit or beyond. These limits are compactly expressed in the special form of Newton’s second law of motion, known as the rocket equation. In short, flights out of Earth orbit to distant planets require substantial energy and take a long time.14 The liftoff mass must include the extra propulsion fuel required for the spacecraft and its instrument payload to get into interplanetary transfer and final orbit insertion. Shorter transit times to planetary targets for a given payload can be achieved only if the propulsion systems are more capable, hence more massive. Larger liftoff mass requires a larger launch vehicle and more fuel. As a direct consequence, planetary missions must be more expensive than otherwise comparable Earth-observing missions.
Maxwell equations (1873) describe the behavior of electromagnetic waves as they propagate. Portions of the electromagnetic spectrum are used by all space missions. Satellite sensing and communication subsystems must be designed within the constraints of the Maxwell equations. The first and most obvious constraint is that radio waves travel at the speed of light. Even at this great speed, light travel time imposes substantial delays on all communications between Earth and satellites, especially deep space probes. Propagation time delays of 30 minutes and more are not unusual for the latter. Near-instantaneous round-trip communication is not possible. This means that planetary or deep space satellites must be designed with more control autonomy than their near-Earth counterparts. The second consequence of the Maxwell equations is that radio and light waves get weaker in proportion to the square of the distance between the radiation source and the observer.15 This means that very distant photon sources become very faint and therefore require much larger viewing apertures.
The same physical principle impacts a satellite’s electrical power subsystem. Whether intended for space physics, astronomical, or planetary missions, proportionately larger solar panels or more capable solar concentrators are required for far-ranging spacecraft if the Sun’s energy is to be the main source of their onboard power. In general, solar energy is not sufficient for missions that would go to the outer planets or beyond our solar system, although developments in advanced solar arrays or concentrators might enable some outer solar system missions. For missions traveling beyond our solar system, alternative means of power generation must be found. The energy options currently available may increase the overall mission cost.
Airy diffraction (ca. 1835) enforces a lower limit on the resolution (or beam width) of any device that radiates or receives electromagnetic energy. For example, the Very Large Array (VLA) distributed-aperture radio telescope spans several kilometers of ground surface area to achieve high-resolution imagery of distant celestial radio sources. The same principle applies to spacecraft instruments, such as an optical system that is designed to image a certain level of detail on a planet’s surface. The diffraction limit requires that the optical aperture diameter must be directly proportional to the satellite’s distance from the surface.16 The sensor’s internal optical path length also has to grow in proportion to aperture diameter if similar performance is expected, requiring the whole instrument to be much larger.
The diffraction limit on aperture size has deeper implications as well. For any device that sends or receives energy, the size of the aperture must be proportional to the wavelength it uses. The wavelength of visible light is
very short, approximately one-hundredth the thickness of a human hair. For the much longer wavelengths used by radar systems, the diffraction limit requires apertures to be much larger than their optical counterparts.17 To meet a given level of performance, an instrument’s minimum aperture size is dictated by wavelength and distance; it cannot be reduced by technology, although distributed apertures may under some circumstances be feasible, albeit at the price of added complexity.18
The Nyquist frequency (ca. 1928) dictates the minimum number of digital samples per second, or sample frequency, required to transport a given amount of message detail over a communication channel. The sample frequency is also determined by how often a point on the surface must be sampled to resolve the variations in the physical processes over time. In general, more information implies more detail and more data. If those data have to be transferred rapidly, then the data rate must increase in proportion. Large amounts of data cannot be forced rapidly through low-capacity channels, as users of the Internet know only too well. Data rate requirements can drive mission costs. Sensor requirements that stipulate both large area coverage and high resolution (in time, space, and/or frequency) tend to be data-greedy. Broadly speaking, data volume and hence data rates grow in proportion to the number of instruments, to the number of channels in each instrument, to the number of resolved sample points in each channel, and to the number of digital bits required for each sample. Researchers must avoid the temptation to collect more data than are actually required to address the science issues.
The data rate required for a spacecraft communication link to the ground can be reduced if more time is allotted to transferring a given amount of onboard data. Good mission design takes advantage of this relationship.19 Likewise, the rate required for a given signal stream can be reduced by application of data compression techniques, under suitable conditions.20 Most deep-space missions would not be feasible without such clever mission designs. In all cases, however, the final design for the communication channel must satisfy the fundamental data rate limits.
Summary
Science objectives, seen through their attributes of where, when, what, and how, establish the data requirements. The satellite system together with its sensors has to provide those data. System design is subject to the fundamental limits imposed by the laws of physics, especially those formulated by Kepler, Newton, Maxwell, Airy, and Nyquist. The implied consequences usually emerge as lower bounds, such as limits on the energy needed to perform the mission, limits on the size of certain components central to the system, and limits on the time required to satisfy both the observation requirements and data transfers through communication links (see Figure 1.2).
There are further implications. Consider the issue of spacecraft size. Large structures such as solar panels or antennas often have to be folded if they are to fit inside the payload fairing of a launch vehicle. Larger structures,
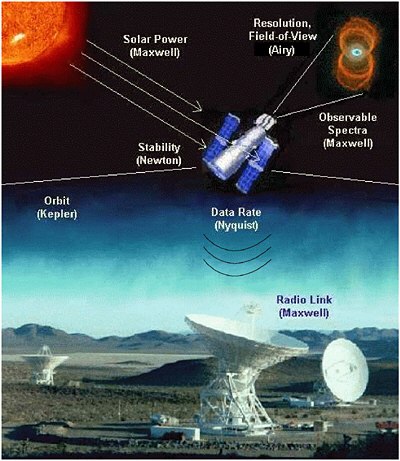
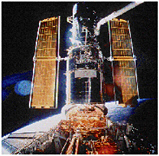
FIGURE 1.2 Depiction of the Hubble Space Telescope annotated to show critical system aspects that are subject to the principal physical limits described in the text. Hubble’s size (and ancillary physical characteristics such as pointing stability and maneuverability) and relative complexity are a direct consequence of its mission, which is to provide high-quality images and spectra of very faint, distant, and finely structured features in the universe. IMAGE SOURCES: <http://www.stsci.edu>; <http://www.jpl.nasa.gov/pictures/dsn/goldstone.html>; and <http://nssdc.gsfc.nasa.gov/photo_gallery/>. CREDITS: Raghvendra Sahai and John Trauger (Jet Propulsion Laboratory), the Wide Field and Planetary Camera Science Team 2, and NASA for the Hourglass Nebula (MyCn18) shown in the upper right-hand corner.
even if folded, may dictate a larger fairing. Folded structures are meant to deploy before use, which imposes added cost and risk on any program. Much more than a relatively simple rigid assembly, a large folded structure requires special attention to its survivability in the launch environment and more extensive analysis, test, and qualification. Consider also the issue of data rate. Data collected with space-based instruments are worth little unless and until they are transferred by the data downlink subsystem to the ground. High-rate downlinks are more costly because they require more power and larger (higher-gain) antennas. High-rate links may be infeasible for planetary or deep space missions. Instrument costs can become unreasonable if the amount of data they produce is very large, as has been proven more than once.21
Once there is agreement on science objectives, a cost-effective system should evolve through a thoughtful mission design process. Since legitimate science objectives vary widely, well-designed science missions likewise vary in size and complexity. Absolute criteria are not appropriate when deciding on mission size. Advanced lightweight materials and fabrication techniques may reduce the mass and risk of a particular spacecraft and its systems relative to related predecessors, but there is no way to circumvent the limits imposed by basic physical principles. The role of advanced technology is to fit more technological performance and capability into a spacecraft, given the fundamental limits that govern the phenomena to be measured or observed. In the final analysis, the lower bound on the cost of a given mission is determined, directly and indirectly, by the convolution of scientific objectives with the fundamental laws of physics.
MEASURING AND ENHANCING THE SCIENTIFIC RETURN ON INVESTMENT
An important question is how small missions compare with larger, more complex missions from the point of view of scientific accomplishments; that is, what are the results for each dollar spent? This section attempts to show how the scientific return of missions of different sizes can be assessed.
Data Analysis
To recover the full scientific return on investment in space missions requires sufficient resources for calibrating (pre- and in-flight) scientific instruments, processing and archiving data in a database, analyzing and interpreting results, and publishing the findings. The issue of balance between funding for the design and development of flight hardware on the one hand and for data analysis on the other is not new and has been addressed before by the Space Studies Board and other advisory bodies.22 It is vital that adequate funding be reserved for data calibration and analysis. In many missions, the cost margin for the project may become depleted in the early stages of the mission process, which later reduces the funds available for data analysis if the mission costs are rigidly capped. This issue is not confined to small missions; rather it is symptomatic of tighter mission budgets generally and of the fact that data analysis comes at the end of a mission, when cost overruns have consumed budget margins. There is a tendency to push data analysis into already stressed research and analysis programs. Applying faster-better-cheaper principles in ways that curtail data analysis would compromise the scientific returns from a mission.23
Loss of data analysis funding can have a qualitatively different impact on smaller missions compared with large missions. When the RAND Corporation analyzed a set of small science missions, it found that on average (mean statistic), the resources devoted to scientific analysis represented 1.6 percent of the total mission cost.24 The set of missions used in the RAND study does not include several small missions currently operating or under development, but the small proportion of resources devoted to science is striking.
Inadequate analysis of the data from a mission may also introduce information gaps that impair the science investigations planned for subsequent missions. Even before a spacecraft is launched, tight schedules and reduced budgets can lead to insufficient calibration of scientific instruments. Without proper calibration, any data obtained during the missions are severely degraded and limited in value.25 In addition, the data may have to be reprocessed as corrections and/or calibrations are obtained.26
Smaller missions generally have more restricted goals and address a more limited range of scientific issues than do larger missions. Their data products may be relatively specialized, and in many cases means can be designed to process, analyze, and disseminate the data efficiently.27 For larger missions, the resources available for scientific analysis may be greater. At the same time, these larger missions may also generate larger and more complex data products that place correspondingly large demands on the data analysis systems. Missions at the larger end of the mission size scale are more costly to implement, but a number of benefits may accrue—for example, the development of more powerful database and visualization tools—from having to serve a larger number of scientists.
Such tools, whether created for small or large missions, enhance the scientific impact by encouraging the wider and more timely distribution of data and the science products derived from them. “Wider distribution” means distribution beyond the core research team to other professional researchers and even other constituencies (e.g., the commercial and educational communities). Increasingly, data are analyzed or correlated with data from other missions or ground-based efforts. (One example is the Advanced Satellite for Cosmology and Astrophysics (ASCA), which developed a software system for analyzing the X-ray astronomy data that have been collected from a number of different X-ray astronomy satellites.)28 Databases are becoming less mission-specific and better integrated into larger archives (e.g. the Planetary Data System) or, in solar and space physics, better able to meet the needs of agencies other than NASA (e.g., NOAA and the Department of Defense) for databases on the geospace environment. New insights emerge from juxtaposing separate data sets, and new ideas come from enlarging the group of people working with the data. In this way, smaller and larger missions enhance each other in terms of overall impact, justifying a mixed portfolio of mission sizes.
Similarly, the development of more powerful database tools can enhance the timeliness with which results are disseminated. This is important because even in optimal circumstances several years may be needed to recognize and follow up on patterns identified in the data sets. It is not unusual for journal articles to follow mission observations by several years owing to the need to apply improved calibrations (this need is intensified by more sophisticated databases), the need to understand subtleties in the data, and the protocols of review and publication. As an example, publications pertaining to the International Sun-Earth Explorer (ISEE) mission first peaked 4 years after the primary mission ended and then again 9 years later.29
Measuring the Scientific Return on Investment
Analysts have proposed a variety of methodologies to compare the amount of scientific data per dollar produced by smaller and larger missions. However, determining the volume of data collected from a research satellite as a way to measure the quantity and quality of the scientific output of a particular research mission is problematic because instruments differ so greatly, as do the missions themselves, and simple formulas are liable to give misleading results. Evaluating a mission’s scientific productivity needs to reflect any special features or limitations of the mission acknowledged at the time the mission proposal was approved.
Figure 1.3 shows the role of scientific analysis in the end-to-end process of space-based research. As an illustration, an instrument on UARS was designed to measure the integrated solar irradiance—essentially a single number—whose absolute value and variation over the 11-year solar cycle are of extraordinary importance. It would be absurd to apply the same data-rate metric for this UARS instrument as for, say, an HST camera that takes multispectral images of distant galaxies.
There are, however, other ways to evaluate the scientific impact of a mission and to determine whether that impact is in some sense proportional to the size of the mission. Some criteria are listed here, but different weightings would be appropriate in different instances. For example, an Earth sciences mission like the Total Ozone Mapping Spectrometer (TOMS) has the potential to affect public policy, but it would be inappropriate to apply this criterion to astrophysics missions. The following are suggested as examples of criteria, not prioritized, by which the scientific impact of a mission might be judged:
-
Answers fundamental questions in a scientific field, e.g., questions as outlined in NRC strategy documents;
-
Leads to discoveries or other advances in knowledge that were not foreseen in the initial project proposal;
-
Provides guidance or insight for the design of subsequent missions;
-
Puts to effective use a guest observer (GO) program, thereby expanding the research utility of the mission. This could be measured by, for instance, the number of GOs or the configurability of the instruments and hence their attractiveness to GOs;
-
Demonstrates breadth of applicability and longevity for its data products. These could be measured by, for example, the number of papers authored by scientists outside the proposing team and the number and history of file transfers from the data archives;
-
Leads to a number of Ph.D. dissertations or has other substantial training impacts from its results;
-
Stimulates articles in the popular press;
-
Shows long-lasting legacies, e.g., textbook and encyclopedia entries; and
-
Influences societal and economic issues and leads to better-informed policies.
IMPLEMENTATION
This section discusses some aspects of program implementation, including how space missions are managed, the extent of international cooperation, and the educational components of the missions.
Management
The move to apply FBC principles to NASA’s Earth and space science missions has encouraged important changes in the ways NASA missions are managed. These changes have moved programs towards management practices that emphasize empowerment, leadership, and accountability.30 In some cases, the changes have moved management into the hands of the lead scientist, making leadership by a principal investigator (PI) one mode of implementation. In the two other implementation modes currently being used by NASA—institution-led missions and PI/institution team missions—responsibility and authority are delegated to scientists and/or institutions.
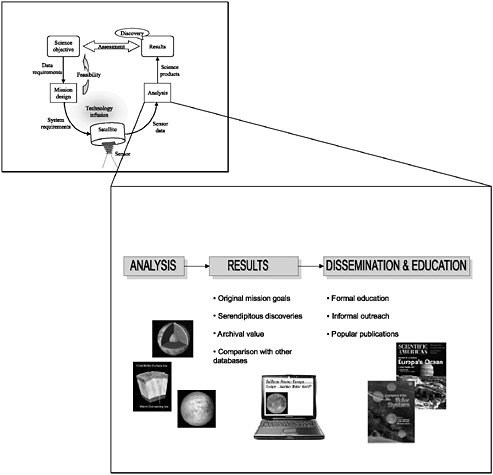
FIGURE 1.3 The raw data from a mission can have a broader impact than the originally proposed science goals. New discoveries can be made by juxtaposing data sets from different missions (e.g., observations of the same source taken at different frequencies, for example) or by taking advantage of archives to look for changes with time. The results of such analyses can be used directly in a variety of ways to promote science education, thus also enhancing the scientific impact. SOURCE: Images available at <http://galileo.jpl.nasa.gov/jupiter/jupiter.html>; cover image of Scientific American accessed from <http://www.sciam.com>, reproduced with permission from Scientific American, Inc.
Some missions, such as the Discovery, Medium Explorer (MIDEX), SMEX, and Earth System Science Pathfinder (ESSP) programs, have embraced the PI-led approach.31 In this approach, “one principal investigator proposes an entire mission and its experiments. The idea is to have the principal investigator firmly in charge of the entire mission, with the instruments being built by the PI and his or her team of coinvestigators. The team usually includes scientists at a variety of institutions who have worked together closely in the past. The result is an efficient, highly cohesive research effort.”32 On programs such as the Student Nitric Oxide Experiment (SNOE), the PI handled mission management at the resident institution.33 If handled properly, the PI-led approach can assure that the best FBC management practices are utilized because the close connections of the PIs with the scientific community tend to increase mission flexibility while also enhancing scientific returns.
Another approach to implementing missions of all sizes is to have a single institution such as a federal laboratory or NASA field center in charge (institution-led). This traditional approach to mission management involves a primary team consisting of a program manager to oversee the development of the mission and to manage the budget and a program scientist to ensure the scientific capability of the mission during development. In addition, a project manager and project scientist, usually from a NASA center, deal with all project development issues (such as schedules, costs, and scientific trade-offs) in close liaison with headquarters. The institution-led approach can provide continuity of management and a corporate memory from mission to mission. Other benefits include access to the resources and infrastructure required for handling larger, more complex missions, the ability to bring in expertise to resolve a technical crisis, and efficiency in employing technical staff and managers. Missions such as Mars Pathfinder and Magellan (both JPL missions) and the Earth Observing System (Goddard Space Flight Center) exemplify the institution-led mode.
The third implementation mode, the PI/institution team approach, involves a PI-led mission that partners with an institution such as a NASA center. In this case, the PI may choose not to lead the mission independently, may require management support, or may wish to incorporate contributions such as management expertise, infrastructure, or facilities for mission development from partnering institutions. Stardust, a mission collecting samples of interstellar dust, is an example of the PI/institution-team approach. Stardust involves a PI at the University of Washington who oversees the mission; JPL, which provides the project management team; and Lockheed Martin Astronautics, which built the spacecraft.34
FBC principles and streamlined management practices can and should be applied in all three implementation modes, regardless of the size of a mission, to achieve shorter development periods, cost-effectiveness, accountability, and empowered decision-making. For example, FBC principles are being applied in developing the Space Infrared Telescope Facility (SIRTF) mission, which offers the chance of monitoring the application of such principles to larger missions. In addition, pursuing efficient contractor practices, low-overhead management techniques, concurrent engineering, integrated product development teams, and fewer formal reviews as well as coordinating with rather than overseeing the contractor, can enhance management effectiveness.35
The foregoing suggests that FBC principles applied wisely are beneficial for all management approaches and implementation modes. In addition, the diversity of modes for executing missions, coupled with the increasing frequency of spaceflights under the FBC approach, is critical for encouraging industry, universities, NASA centers, and government laboratories to participate actively in the space research program. Each player offers assets (e.g. innovation, infrastructure, intellectual capital, engineering capabilities, management expertise, development experience) that when taken together with those of the other players, strengthen the health and development of the space research program. The modes for managing missions (the PI mode, the institution-led mode, and
|
31 |
Several Space Studies Board reports have pointed to the attributes of management approaches adopted for smaller, shorter-duration missions. See Space Studies Board, National Research Council, Scientific Assessment of NASA’s SMEX-MIDEX Space Physics Mission Selections, National Academy Press, Washington, D.C., 1997. See also SSB, Clementine, 1997; SSB, Small Missions, 1995; SSB, Small Satellites in NASA and NOAA Earth Observation, 2000. |
|
32 |
Baker et al., “NASA’s Small Explorer Program,” pp. 44-51. |
|
33 |
See <http://lasp.colorado.edu/snoe> and <http://cass.jsc.nasa.gov/stedi/overview.html>. |
|
34 |
|
|
35 |
SSB, Small Satellites in NASA and NOAA Earth Observation, 2000. |
the PI/institution team mode) capitalize on these various strengths. For instance, the PI mode focuses on the university and science community, while the institution mode focuses on government laboratories or NASA centers and the resources and skills they offer. Approaches and mixes of players for implementing missions are changing and may continue to incorporate traditional and FBC management practices.
There are, however, limitations and caveats for all the management modes. As an example, experience from the Lewis and Mars Climate Observer (MCO) missions (see section “Problems with Past Missions”) has shown that streamlined management methods must receive sufficient oversight and attention to avoid pitfalls.36 As one moves up the scale of mission size, the engineering “tail” can begin to “wag the scientific dog,” and sometimes costly attention to engineering details is required to contain risks. The Lewis and MCO failure investigations showed that the cost and schedule constraints associated with the FBC approach created stresses that resulted in poor management decisions. A management team of appropriate size and experience is needed to reduce the probability of mission failure caused by such problems as too few technical checks, poor communications, or inappropriate workload allocation.37 Other concerns are the effectiveness of the PI mode for medium-scale missions and the need for instrument hardware to support PI-led missions. The PI mode has not yet been evaluated for MIDEX-class missions38 and has so far been applied at a time when PIs have had access to the scientific instruments they need to conduct smaller, shorter-duration missions. Much of the cost of developing these instruments has already been expended and is not included in the PI’s mission budget. The effectiveness of the PI mode may change when new instruments must be conceived, developed, and tested.39
International Collaboration and FBC Principles
The mission portfolios of NASA’s Earth science and space science programs can benefit substantially when opportunities for international collaboration are taken advantage of. This section discusses the selection and planning processes for international cooperative missions, the risks in conducting such missions, and opportunities to facilitate them.
The planning processes for missions influence the ease with which countries and agencies can collaborate on space research. Other factors, such as the process for selecting missions, the ability to launch them, and the availability of resources for collaborating in foreign-led missions, are also important in conducting international collaborations. The trend in the United States towards using smaller, shorter-duration missions may be impairing the ability of international partners to participate in U.S.-led missions because of the shortened planning and selection periods.
In the case of larger missions, the planning process is likely to be relatively long and to follow a well-defined procedure. Planning can occur at the agency level and can be timed to fit the planning and funding cycles of potential international partners, although it does not always proceed in this fashion.40 Furthermore, collaborations even on large missions can be simpler if only two countries rather than many are involved, such as on the German-U.S.-U.K. Roentgen Satellite (ROSAT) mission or on the U.S.-French Ocean Topography Experiment (TOPEX)/ Poseidon mission (see Box 1.1).
Some smaller NASA missions can incorporate collaboration with a single foreign country more simply than large missions, which typically involve cooperation between large agencies such as NASA and the European
|
BOX 1.1 Ocean Topography Experiment  A bilateral mission between France and the United States, the Ocean Topography Experiment (TOPEX/Poseidon) is dedicated to observing Earth’s oceans and to providing global sea-level measurements of unprecedented accuracy. TOPEX/Poseidon, launched on August 10, 1992, weighed some 2,500 kg. NASA’s share of the cost for the large-scale, bilateral mission is approximately $450 million (life-cycle costs). NASA contributed the satellite bus, five scientific instruments, and the development of the data system, and the French Space Agency contributed the launch and the associated ground processing infrastructure. TOPEX/Poseidon is considered both a collaborative and a scientific success. Its data are used to help scientists determine global ocean circulation and understand how the oceans interact with the atmosphere. This interaction is essential to improving our understanding of global climate and other aspects of global environmental variability and change.1 Other uses of the ocean altimetry data include monitoring large-scale ocean circulation and investigating subtle signals from tidal energy as it moves around the globe. Moreover, TOPEX/Poseidon data have been used to study the sea-level changes associated with El Niño events: the data help researchers to analyze the interaction between swirling eddies and the ocean currents that give rise to El Niño phenomena and to better understand how heat storage in the ocean changes from season to season.2 TOPEX/Poseidon is continuing to provide ocean altimetry data and will be succeeded by a follow-up U.S.-French mission, Jason-1, to be launched in 2001. Advanced Satellite for Cosmology and Astrophysics 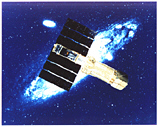 How are stellar magnetic fields generated? What physical processes determine the mass functions of single and binary stars, from their formation to their demise as compact stellar remnants such as white dwarfs, neutron stars, and black holes? What elements are ejected in novae and supernovae? The Advanced Satellite for Cosmology and Astrophysics (ASCA) is helping scientists better understand high-priority questions on stellar evolution and the origin of elements identified by astronomers and astrophysicists. Led by the Institute of Space and Astronautical Science of Japan, with contributions from the United States, ASCA was launched on February 20, 1993, to perform spectroscopic imaging of cosmic, high-energy phenomena in the 0.5 to 10 keV band. Japan provided the spacecraft, launch, management, and operations; the United States cooperated on scientific payloads. ASCA builds on observations made by a much smaller mission, the EUVE, and has revealed dense coronal structures and reconnection and flaring of magnetic fields in young stars. In addition, ASCA, the first true imaging spectrometer in the X-ray band, directly imaged supernovae remnants of individual atomic transitions of recently expelled elements. These data, combined with higher-resolution imaging being conducted by the Satellite per Astronomia in Raggi X (SAX), are providing, for the first time, an opportunity to determine the composition of material ejected from the cores of massive stars.3 |
Space Agency (ESA). Smaller missions are generally chosen through open announcements of opportunity (AOs)41 in which numerous missions are considered but only a few are actually selected for flight. In this situation, international arrangements are informal, and because the response time to an AO is usually short (e.g., less than 4 months), a preexisting relationship with one’s collaborators is generally required. The proposing PI arranges with scientists in other countries for an instrument or detector contribution, for example, and the scientists in those countries, in turn, approach a national funding agency for support if their team is selected.42
The AO process for small missions may have an impact on international cooperation for some missions owing to the disciplinary breadth of the announcements, which results in a large number of proposals being submitted. The odds of any one proposed mission being selected can be discouragingly small,43 which may make discussions between foreign scientists and their national funding agencies problematic. Furthermore, whether or not international collaboration is encouraged or discouraged during mission selection seems to vary across NASA’s science program offices. In some cases having a foreign partner is considered as a way to enhance the capabilities of the mission at little cost to NASA (e.g., TOPEX/Poseidon for Earth sciences or ASCA for astrophysics) (see Box 1.1). In other cases, international collaboration might be considered detrimental by some at NASA because it could bring added complexity and potential delays to a mission, because it is perceived to give a mission an unfair advantage, or because it increases NASA’s financial risk.
Despite the potential benefits of cost-sharing and increased scientific opportunities, contributions from foreign partners can introduce risk into collaborative ventures. A partner could, for example, lose funding or fail to meet mission schedules, or its contributed hardware or software might not perform according to requirements or expectations. These potential risks can be incorporated into management plans and be handled with appropriate contingency plans.
International participation in NASA missions is only one side of this issue. There are also opportunities for U.S. scientists to participate in missions mounted by other nations, usually by providing spacecraft subsystems, detectors, or instruments. In general, such participation involves a relatively small funding requirement from the United States that is offered as a mission of opportunity (MoO) line in Explorer AOs. MoOs apply to satellites mounted by industry, the military, or foreign countries. While the MoO line provides opportunities for cooperation, it falls short of enabling the scientific community to integrate cooperative activities into the strategic planning process.
The international payload line that NASA used in the past offered a more systematic approach to encouraging international cooperation on foreign-led missions and to integrating such activities into NASA’s planning process. NASA issued AOs to the science community for European- and Japanese-led missions (at present, researchers must locate opportunities on foreign-led missions on their own). The international payload line44 facilitated science planning, proposal preparation, and the development and integration of instruments for the scientists who were selected for such opportunities in return for scientific data from the mission. The cooperative venture could then be integrated into NASA’s strategic planning process as a way to meet certain scientific objectives in a field.
International cooperation at a variety of levels is important. A mix of mission sizes can be achieved not only by the missions in NASA’s portfolio but also by U.S. participation in international missions. The ESA astronomy mission Planck is a good example. Its cost to NASA is small but its science is comparable to that of a medium or large mission.
Education
NASA science missions provide opportunities for a wide variety of educational activities. These activities take forms that range from formal education at schools and colleges to informal life-long learning, through the
mass media, science museums, and the Web. Educators with strong scientific backgrounds coordinate activities on both large and small missions with local schoolteachers. The educators bring the space missions into classrooms, public libraries, and museums using electronic media and audiovisual materials and organize school visits to witness the development and construction of a spacecraft and the operation of a mission center. At the college level, undergraduate and graduate students can become more directly involved in missions, working with scientists and engineers on the design, construction, and operation of spacecraft as well as on analyzing the scientific data returned.
Larger missions such as Voyager, Hubble, Galileo, Cassini, and the Earth Observing System (EOS) mission Terra have generated considerable public interest and inspired extensive educational activities. The presence in a community of an institution such as the Space Telescope Science Institute, the Jet Propulsion Laboratory, or a NASA center allows for substantial, formal links to the community’s schools and educational networks. While the longer duration of large program missions might preclude a student from experiencing the whole sequence, it could offer more opportunity for him or her to become involved in data analysis, as long as such analysis is fully funded.
Previous Space Studies Board reports raised expectations that the FBC approach would enhance the educational role of NASA science missions because small missions need not be done exclusively at large contractors or government facilities: “Small missions provide a variety of opportunities for education at K-12 levels. The involvement of universities in small missions is also an excellent chance to excite and inspire students in various disciplines at both undergraduate and graduate levels and to provide technical, scientific, and managerial experiences that might be extremely valuable for a wide variety of careers. The most desirable missions for student participation are those that are completed in at most a few years, so that students can be a part of the entire mission—not just analyze data obtained a decade earlier.”45,46 Examples of successful student involvement in small missions (see Box 1.2) are provided by the Solar Mesosphere Explorer and SNOE at the University of Colorado and the Extreme Ultraviolet Explorer (EUVE) at the University of California at Berkeley. On an even smaller scale, the NRC report Supporting Research and Data Analysis in NASA’s Science Programs cites the special educational opportunities that are provided by suborbital balloon or rocket flights.47
The committee is not aware of any assessments to date of the relative impact of educational activities associated with missions of different sizes. Furthermore, it has not seen any evaluations of whether the stipulation in an AO of an educational component for smaller, shorter-duration missions (generally at the level of one to a few percent of the total mission budget) has enhanced student involvement or educational value. There are examples of excellent education programs associated with both large (e.g. Hubble) and small (e.g. SNOE) missions, but generalizations about the overall educational benefit of large vs. small missions in aggregate are anecdotal. Comparisons are complicated by the fact that different missions have concentrated on different areas of education. Some have specialized in K-12 education (e.g., Cassini), teacher training (e.g., Kuiper Airborne Observatory), college students (e.g., Cooperative Astrophysics and Technology Satellite (CATSAT)), science museums (e.g., International Solar-Terrestrial Physics program), or the mass media (e.g., Hubble). In some cases, efforts labeled “education” are little more than public relations.
In other cases, mission management may wish to involve more students in smaller, shorter-duration missions but may not be able to do so because of the start-up costs or concerns about perceived added risk. In the drive to cut mission costs, the later parts of the mission (data analysis and synthesis) are often severely curtailed. If such
|
BOX 1.2 Student Explorer Demonstration Initiative The Student Explorer Demonstration Initiative (STEDI) is designed to involve students intensively in the design, building, and operation of small spacecraft. At a cost of less than $10 million each, STEDI missions are the smallest in the Explorer program and the next step up in mission capability from a sounding rocket. They were nominally to be launched on Pegasus vehicles.1 Funded by NASA and managed by the Universities Space Research Association (USRA), the program aims to demonstrate the potential for university-led teams to successfully carry out high-quality space science and technology missions at a relatively low cost on a time scale of 2 years from go-ahead to ready-for-launch.2 The three missions selected were (1) the University of Colorado’s SNOE, (2) Boston University’s TERRIERS, and (3) the University of New Hampshire’s CATSAT:3 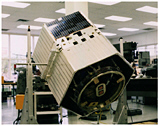
As the Space Studies Board noted in its report Scientific Assessment of NASA’s SMEX-MIDEX Space Physics Mission Selections, “STEDI appears successful in providing hands-on educational opportunities for both graduate and undergraduate students in engineering and software development which makes students highly marketable after graduation.”4 Indeed, SNOE involved over 150 students, including some 80 paid positions for undergraduates and graduates and 70 other positions, including 10 high school students. Student responsibilities ranged from project responsibilities (mechanical and electrical designs, software development, provision of ground support equipment), mission operations (real-time command operations, orbital tracking), and data analysis (database management, data reduction, model development).5 Space Telescope Science Institute The Space Telescope Science Institute (STScI) is responsible for the scientific operation of the Hubble Space Telescope (HST), including the selection and support of telescope users, the scheduling of telescope observations, the archiving of data, and planning for new telescope instruments. |
 The educational and outreach charge for STScI is to conduct a national program that brings the scientific results and technology of HST to teachers, students, and the general public. Additional educational activities include development of a suite of classroom tools for use in hands-on science and mathematics education and pilot programs to encourage the partnership of research astronomers and technologists with teachers in grades K-12.6 In addition, STScI coordinates programs for approximately 50 undergraduate, graduate, and postdoctoral students that provide financial support and/ or research mentoring each year.7 The Hubble Space Telescope was launched on April 24, 1990. It is capable of imaging objects up to 14 billion light-years away and is the largest on-orbit observatory ever built. Hubble was a joint venture between the European Space Agency and NASA. The observatory has “revolutionized observation astronomy by providing crisp images of objects ranging from protoplanetary disks and exploding stars to images of the most distant galaxies ever observed.”8
|
cuts occur, they affect the translation of raw scientific data into user-friendly databases, which are accessed widely via the Web by scientists, students, and the general public. Loss of data analysis resources not only reduces the scientific return from the mission but also eliminates the area (data analysis) in which graduate students are most extensively involved.
TECHNOLOGY
Technologies Enhance Instrument and Bus Capabilities
Scientific research using spaceborne instrumentation has been characterized by a continuing, almost explosive improvement in the capabilities of the instrumentation as well as in the capabilities of the spacecraft bus carrying the instruments. The performance of today’s instrumentation and spacecraft greatly surpasses the performance of those of only a decade ago. This growth in performance is based on a continuing investment in technology development: to prepare for the future it is essential to push even further the limits of current technology.
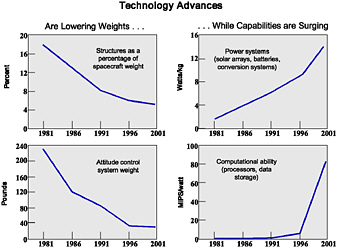
FIGURE 1.4 Advances in spacecraft capability, 1981 to 2001. MIPS, million instructions per second. SOURCE: Pedro Rustan, Aviation Week and Space Technology, January 25, 1999. Reprinted with permission from Aviation Week and Space Technology.
There is a synergism between the development of spacecraft bus technologies and technologies that improve the scientific instrumentation that enables novel space missions and greatly improves the scientific return. Advances in spacecraft technologies, such as energy-efficient electronics, more powerful solar panels, more accurate pointing capabilities, higher rates of data transmission, and onboard autonomy, increase the capabilities of instrumentation. In turn, improved instrumentation that can take advantage of the characteristics of advanced spacecraft enhances the scientific productivity of space missions.
Figure 1.4 illustrates the growth in spacecraft technology capability in the last two decades. A similar rate of progress is occurring in many of the technologies associated with scientific instrumentation, such as more capable processors and more sensitive receivers of electromagnetic radiation. In the future we will probably see the use of micromechanical systems aboard spacecraft, the deployment of large, inflatable structures and antennas, and the ability to fly many small spacecraft in formation. These technologies will lead to new research opportunities and enable novel space missions. The time scales of continuing technology improvement in some instances are relatively short, a few years or less. Space mission development and execution time scales should be comparable to the time scale of technology improvement, since space missions are expected to fly the best technology available.
Two Approaches to Infusing New Technology
The process of infusing new technology into Earth and space science missions has changed dramatically over the course of the space program. In the rush to establish the U.S. space program in the late 1950s, government and industry were willing to use any technology that was available in these early spacecraft, because technology developed specifically for space applications was scarce. Considerations of risk and cost were secondary, and speed of execution was essential. This venturesome approach to space exploration was responsible for the very successful U.S. civil space program of the 1960s and the early 1970s.
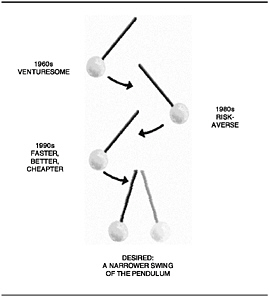
FIGURE 1.5 The pendulum of space and Earth science technology application.
As space technology evolved and space systems became more complex, program managers became more cautious about the flight qualification status of the technology being used in spacecraft. Standards for qualification tests emerged as a result of mission failures. Testing became extensive—and expensive—and the community started to demand flight “heritage” for all technology systems selected for flights. The trend to bigger, more capable satellites using flight heritage technologies became the norm in the 1980s, when the country was still enjoying an increase in the government space budget, driven by the Cold War. The U.S. budget for NASA and the Department of Defense space activities in the late 1980s was considerably larger than a decade before, and new technologies were developed for a wide variety of space applications.48
The confluence of long technology development times, increasing complexity, and growing costs of space systems led to an interest in cutting the time elapsed between the ground qualification of a new technology and its subsequent integration into space missions. Opportunities also arose to take advantage of the increased performance capabilities and lower masses inherent in the new technologies and to develop very capable, relatively small spacecraft. The contributions of the Clementine, the Solar Anomalous and Magnetospheric Particle Explorer (SAMPEX), the Submillimeter Wave Astronomy Satellite (SWAS), Mars Pathfinder, and Mars Global Surveyor missions, all of which used these new technologies, caused the technology pendulum to swing back in the other direction (see Figure 1.5), toward rapid mission execution, which had been the philosophy in the early days of the space program. Today, in light of the Lewis, MCO, and Mars Polar Lander failures, described in the section “Problems with Past Missions,” the committee believes the pendulum has swung too far in that direction, toward practices that rate speed and cost over risk and sound management.
ACCESS TO SPACE
Both U.S. (e.g., Pegasus, Athena, Titan-4) and foreign (e.g., Ariane) launch vehicles have experienced significant problems during the last several years. New launch systems have always been plagued by low reliability levels when they are first used. Therefore, any assessment of launch vehicle risk must take system maturity into account. The Space Studies Board recently noted as follows in its report The Role of Small Satellites in NASA and NOAA Earth Observation Programs: “… early experience with the new small launch vehicles has included a number of failures, and the present paucity of reliable options is of great concern. This is likely due in part to the relative newness of these systems and a desire to minimize development costs for these commercial ventures. Continued development should overcome the difficulties and yield a suitable balance between cost and reliability.” In addition, the report noted that “present launch vehicle performance capabilities do not effectively span the range of potential payloads. For example, there is a significant gap in capability between the Pegasus-Athena-Taurus launch vehicles and Delta II.”49
The issue of access to space is a matter of continuing concern in planning an effective, balanced, and cost-effective program for space and Earth science. Whether NASA provides access by an appropriately priced, expendable launch vehicle dedicated to a single science mission or by a secondary payload opportunity, the agency must deal effectively with launch issues. The high cost, lack of options in vehicle size and capability, and the sometimes poor reliability of launch vehicles are the principal impediments to using the optimum mix of spacecraft sizes. For example, while smaller spacecraft might seem to be the right technical approach to answering many scientific questions, present launch vehicle costs and availability discourage this approach from an overall program resource standpoint.
Even for large missions (e.g., major planetary spacecraft), the cost of launch vehicles severely constrains the science program. With launch vehicles costing many tens to hundreds of millions of dollars, exciting mission ideas face daunting obstacles. It is as true now as ever that the costs of access to space, however defined, must come down to permit an effective science program. This problem is not unique to space and Earth science; it applies as well to commercial efforts.
Finally, the ad hoc committee notes that national space transportation policy requires all U.S. government payloads to be launched on vehicles manufactured in the United States.50 Moreover, U.S. commercial spacecraft requirements are driving the market towards larger launch vehicles, and there is little industry interest in providing opportunities for science missions to fly as secondary payloads on large commercial launchers. The ban on foreign launchers restricts the access to space of U.S. scientific payloads and prevents the science community from taking advantage of economical access offered by foreign launchers. These two factors combine to unnecessarily handicap the FBC approach.
RISK
Traditional approaches to developing missions reduced risk by using flight-qualified hardware, internally redundant subsystems, and redundant spacecraft (e.g., Viking 1 and 2 and Voyager 1 and 2). The budgets for missions conducted under the FBC approach do not afford such redundancy and therefore introduce higher risks. In addition, FBC principles, including streamlined management and the use of advanced technologies (discussed in the subsections on management and technology), make risk a bigger challenge in developing science missions. The four most important risks to consider are the following:
-
Risk in technology selection—Missions using state-of-the-art technologies in new applications tend to have higher failure rates because the technologies have not yet been flight-qualified. Regardless of the extensive simulation and ground testing performed to qualify new technologies, the space environment is not benign, and it
-
is impossible to simulate all space conditions (e.g., thermal, vacuum, radiation, and electromagnetic interference) and launch conditions (e.g., shock and vibration) in tests alone. Advanced technology that lacks a flight heritage will carry an inherently higher risk. As an example, the decreased size of modern microelectronics may make these technologies more susceptible to some types of space radiation.51
-
Risk in payload configuration—When spacecraft size and complexity grow in response to more ambitious science goals, additional risks are incurred by having to integrate complex, multi-instrument payloads. Program managers have tended to underestimate the time required for integrating complex payloads and the risks to the payloads and spacecraft. The operation of multi-instrument payloads is also likely to be complex and therefore increases risk.
-
Management risk—A principal investigator or project manager who is not experienced in satellite engineering and technology can pose a significant risk to the mission. A principal investigator might offer an outstanding scientific mission using low-risk technologies, but he or she might not have the experience to manage the mission properly. Moreover, small teams can introduce risk into the program if there are insufficient checks built into the management approach, if testing is sacrificed, or if the team becomes overworked and burned out. Institution-led and larger programs can experience similar management risks; the failure of the Mars Climate Observer mission may be an example of this. On the other hand, the severe downsizing in recent years of NASA’s personnel in technical areas has also significantly diminished its ability to provide the management skills, incisive reviews, and guidance required by current missions.
-
Risk in mission operations—The large number of current and planned science missions is not well matched to the declining financial support for the Deep Space Network and thus imposes risk on mission operations.52
PROBLEMS WITH PAST MISSIONS
While the committee has noted several benefits of the FBC approach and linked improvements to this approach, not all missions using it have been successful. A short review of the failures may uncover lessons that will help to ensure the success of future missions.
The failures among missions using the FBC approach include the Mars Polar Lander (MPL), MCO, WIRE, the Lewis and Clark missions, and TERRIERS. Although FBC was not necessarily the main cause of any of these failures, it may have been a significant contributing factor in several cases.
The Lewis mission, launched on August 23, 1997, was intended to demonstrate advanced science instruments and spacecraft technologies for measuring changes in Earth’s land surface. Shortly after launch, the spacecraft entered a flat spin that resulted in a loss of solar power and a fatal battery discharge. The Lewis Spacecraft Mission Failure Investigation Board found that the spacecraft was lost as a direct result of the implementation of a technically flawed safe mode in the attitude control system, compounded by the limited control and monitoring of the spacecraft after launch, a decision apparently made to “avoid exhausting the crew.”53 The board also found several contributing indirect causes. More complete documentation, engineering model development, and program reviews might have prevented the failure.
The roles of government and industry have changed significantly in the new FBC era. The Lewis Spacecraft Mission Failure Investigation Board endorsed the concept of FBC in space programs and believed that the new paradigm could be implemented with “sound engineering, and attentive, and effective, management.” It noted that the changing roles of government and industry must be planned for and maintained. The Clark mission was terminated in February 1998 owing to escalating mission costs, launch schedule delays, and concerns about the capabilities of the satellite. Originally scheduled for launch in mid-1996, it was part of NASA’s Small Satellite
|
51 |
Sarsfield, Cosmos, 1999, Appendix D. |
|
52 |
Space Studies Board, National Research Council, A Scientific Rationale for Mobility in Planetary Environments, National Academy Press, Washington, D.C., 1999, p. 55. |
|
53 |
“Faster, Cheaper Strategy on Trial,” Science, 278 (November 14, 1997), p. 1216. |
Technology Initiative program. The spacecraft was to include a high-resolution optical element with stereo imaging capabilities that would gather useful environmental data. The instrument development costs and schedule grew unacceptably large.
WIRE was launched March 4, 1999, aboard a Pegasus XL launch vehicle. WIRE’s mission was to conduct infrared observations of astronomical objects. WIRE failed because an incorrectly designed electronics box prematurely fired explosive devices, causing early ejection of the instrument’s telescope cover.54 The WIRE cryogen was subsequently quickly expended. The electronics box design had not been peer-reviewed and other system reviews did not focus on analyzing it.
TERRIERS, a part of the Student Explorer Demonstration Initiative (STEDI), was launched in May 1999 to study how the ionosphere affects global telecommunications systems. The satellite was built and launched in 4 years for approximately $4 million. A wiring error caused the spacecraft’s attitude control to malfunction and its solar arrays to point away from the Sun. Without solar energy, the spacecraft lost battery power and its ability to operate. The problem, which was not identified during testing, resulted from a design or human error.
The Mars Climate Observer, one of several missions in a series aimed at exploring the planet Mars and its climate history, was lost on September 23, 1999. This occurred as the spacecraft was about to go into orbit around the planet. The Mars Climate Observer Mishap Investigation Board concluded that “the root cause for the loss of the MCO spacecraft was the failure to use metric units in the coding of a ground software file.”55 This problem caused the orbiter to fire its thrusters at levels that put it on an inaccurate trajectory toward the planet. However, the report revealed other underlying errors and problems that led to the failure, including “inattention, miscommunication, and overconfidence,” as well as insufficient staffing for the MCO navigation team and other management problems at the Jet Propulsion Laboratory, which managed the project, and at its industrial partner.56 Although the Investigation Board did not specifically review the impact of FBC practices on the failure, the MCO loss revealed that the processes for ensuring mission success were stressed by the attempts to meet schedule and cost. In addition, “the overall mission stayed within the budget constraints of NASA’s ‘better, faster, cheaper’ mandate … but only by using up contingency funds that could have been devoted to other tasks.”57
More recently, on December 3, 1999, the Mars Polar Lander mission failed to successfully land and deploy on the Martian surface. Because telemetry was purposely planned to be interrupted during the last stage of the landing sequence, very little is currently known about how or why the MPL (and the two separate penetrator probes) failed to function properly from the surface. The failure review board has yet to report on this latest mission failure, but the MPL problem is having a profound effect on the Mars exploration program, its future direction, and, indeed, on how the entire FBC approach is viewed.
In addition to responding to the results of the MPL failure review whenever they are reported, NASA may benefit from further exploring the implications of the Mars mission failures for the direction of the program. Is the Mars program committed to a technology path that is proving to be riskier than its proponents originally anticipated? Are recent losses skewing the program toward sample return missions that lack the critical precursors recommended in planetary science strategy reports? How seriously have the scientific rationale and robustness of the Mars program been affected by the information gaps introduced by recent mission failures? Do current and future mission programs have ample time and budgets to integrate lessons learned from previous failures? Other consequences of the MCO and MPL failures are the additional review processes that missions being developed under FBC principles may be required to heed.58 The costs of completing these reviews may have to be paid for by reducing the scope of the science, which would be an unfortunate result.
While it may not be possible to attribute any of these failures directly to the faster-better-cheaper paradigm, the Lewis, MCO, MPL, and WIRE cases, in particular, raise questions about whether the risks of FBC and the misapplication of its principles played a significant role. An in-depth, independent investigation of the Mars program failures is under way. It will provide further insight into and analysis of FBC principles and will show where the paradigm needs to be modified. The failures of some missions conducted under the FBC approach can be countered by the successes of others, so it will be important to strengthen effective practices while carefully making corrections, where necessary, in how the approach is administered.


