
6
Vitamin E
SUMMARY
Vitamin E is thought to function primarily as a chain-breaking antioxidant that prevents the propagation of lipid peroxidation. Overt deficiency is very rare, seen only in individuals unable to absorb the vitamin or with inherited abnormalities that prevent the maintenance of normal blood concentrations. Thus, current dietary patterns appear to provide sufficient vitamin E to prevent deficiency symptoms such as peripheral neuropathy. Estimates of vitamin E intake are underreported, due in part to underreporting of amounts of dietary fat consumed and lack of specificity of sources in the diet. Data on human experimental vitamin E deficiency are very limited but provide some guidance as to the appropriate Recommended Dietary Allowance (RDA). The values recommended here are based largely on induced vitamin E deficiency in humans and the correlation between hydrogen peroxide-induced erythrocyte lysis and plasma α-tocopherol concentrations. The RDA for both men and women is 15 mg (35 µmol)/day of α-tocopherol. Vitamin E activity of α-tocopherol as defined in this report is limited to that available from the naturally occuring form (RRR-) and the other three synthetic 2R-stereoisomer forms (RSR-, RRS-, and RSS-) of α-tocopherol for purposes of establishing the human requirement for vitamin E. Other naturally occurring forms of vitamin E (β-, γ-, and δ-tocopherols and the tocotrienols) do not contribute toward meeting the vitamin E requirement because (although absorbed) they are not converted to α-tocopherol by humans and are recognized poorly by the α-tocopherol transfer protein (α-TTP) in the liver. Therefore, the RDA is based only on the α-tocopherol form of vitamin E which represents a change
from most recent recommendations. A large and growing body of experimental evidence suggests that high intakes of vitamin E may lower the risk of some chronic diseases, especially heart disease. However, the limited and discordant clinical trial evidence available precludes recommendations at this time of higher vitamin E intakes to reduce chronic disease risk. The Tolerable Upper Intake Level (UL) for adults is set at 1,000 mg (2,325 µmol)/day of any form of supplemental α-tocopherol based on the adverse effect of increased tendency to hemorrhage.
BACKGROUND INFORMATION
Definition of Vitamin E
Of the eight naturally occurring forms of vitamin E (see section on “Naturally Occurring Forms” and Figure 6-1) only the α-tocopherol form of the vitamin is maintained in human plasma (Traber, 1999). Furthermore, the only forms of α-tocopherol that are maintained in plasma are RRR-α-tocopherol [2,5,7,8-tetramethyl-2R-(4′R, 8′R, 12′ trimethyltridecyl)-6-chromanol], the form of α-tocopherol that occurs naturally in foods, and the 2R-stereoisomeric forms of α-tocopherol (RRR-, RSR-, RRS-, and RSS-α-tocopherol) present in synthetic all racemic- (all rac-) α-tocopherol [2,5,7,8-tetramethyl-2RS-(4′RS, 8′RS, 12′ trimethyltridecyl)-6-chromanol (Traber, 1999) (Figure 6-2). Since the 2S-stereoisomers of α-tocopherol (SRR-, SSR-, SRS-, and SSS-α-tocopherol), part of the synthetic all rac-α-tocopherol, are not maintained in human plasma (Acuff et al., 1994; Kiyose et al., 1997; Traber, 1999) or tissues (Burton et al., 1998), they are not included in the definition of active components of vitamin E for humans. Therefore, vitamin E is defined in this report as limited to the 2R-stereoisomeric forms of α-tocopherol to establish recommended intakes. All forms of supplemental α-tocopherol are used as the basis of establishing the Tolerable Upper Intake Level (UL) for vitamin E. These recommended intakes and ULs are at variance with past definitions and recommendations for vitamin E (NRC, 1989).
Structure
Naturally Occurring Forms
Naturally occurring structures (Figure 6-1) classified in the past as having vitamin E antioxidant activity include 4 tocopherols (α-tocopherol, trimethyl [3 methyl groups on the chromanol ring]; β-
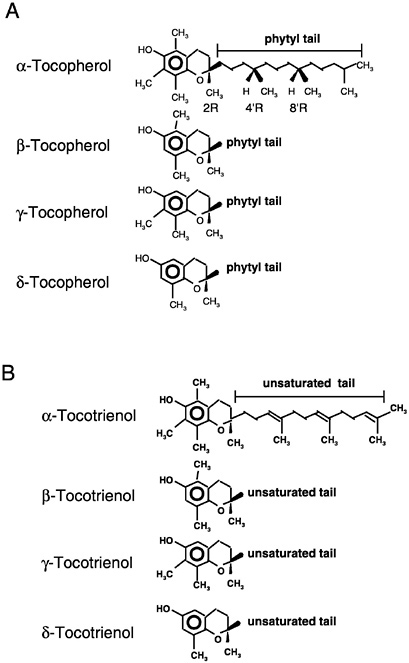
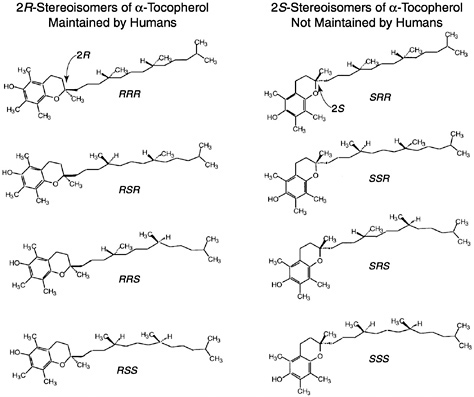
FIGURE 6-2 all rac-α-Tocopherol structures. Shown are the eight different stereoisomers in synthetic vitamin E (all rac-α-tocopherol): RRR-, RSR-, RRS-, RSS-, SRR-, SSR-, SRS-, and SSS-. All eight stereoisomers are formed in equal amounts. One stereoisomer, RRR-α-tocopherol, is also naturally present in food. The structure differences occur in the side chain and most importantly at the ring/tail junction.
or γ-tocopherols, dimethyl [2 methyl groups on the chromanol ring at different positions]; and δ-tocopherol, monomethyl [1 methyl group on the chromanol ring]) and 4 tocotrienols (α-tocotrienol, trimethyl; β- or γ-tocotrienols, dimethyl; and δ-tocotrienol, monomethyl) (IUPAC-IUB Joint Commission on Biochemical Nomenclature, 1974). The tocopherols are characterized by a substituted, hydroxylated ring system (chromanol ring) with a long, saturated (phytyl) side chain (Figure 6-1). Tocotrienols differ from tocopherols only in that they have an unsaturated side chain. All tocopherols that occur naturally in foods have the RRR stereochemistry in the side chain. However, the various forms of vitamin E are not inter-
convertible in the human and thus do not behave the same metabolically.
Synthetic Vitamin E
Synthetic forms of α-tocopherol are present in fortified foods and in vitamin supplements. Vitamin E supplements are sold as esters of either the natural RRR- or the synthetic mixture (all rac-) forms of α-tocopherol. Because α-tocopherol has three asymmetric carbon atoms, it has eight possible stereoisomers, seven of which are only found in synthetic preparations. Synthetic vitamin E, all rac-α-tocopherol (historically and incorrectly labeled dl-α-tocopherol) (Horwitt, 1976),1 is produced by coupling trimethylhydroquinone with isophytol; it contains all eight stereoisomers in equal amounts (Figure 6-2). Four of the stereoisomers are in the 2R-stereoisomeric form (RRR-, RSR-, RRS-, and RSS-α-tocopherol) and four are in the 2S-stereoisomeric form (SRR- SSR-, SRS-, and SSS-α-tocopherol). Although RRR-α-tocopherol is the most biologically active of the eight stereoisomers in rats, the other 2R-stereoisomers generally have a higher activity than the 2S stereoisomers (Weiser and Vecchi, 1982; Weiser et al., 1986).
The naturally occurring stereoisomer is RRR-α-tocopherol (historically and incorrectly labeled d-α-tocopherol) (Horwitt, 1976). RRR-α-Tocopherol can be derived by methylating γ-tocopherol isolated from vegetable oil. This is labeled “natural source” vitamin E when marketed.
Esterification of the labile hydroxyl (OH) group on the chromanol ring of vitamin E prevents its oxidation and extends its shelf life. This is why esters of α-tocopherol are often used in vitamin E supplements and in fortified foods. In apparently healthy humans,
|
1 |
The original international standard for vitamin E, dl-α-tocopheryl acetate (one asymmetric carbon atom in the 2 position on the chromal ring, ambo-α-tocopheryl acetate) is no longer commercially available. It was synthesized from natural phytol and was a mixture of two stereoisomers of α-tocopherols, RRR-α-tocopheryl acetate and SRR-α-tocopheryl acetate (Horwitt, 1976). For practical purposes at the time, the activity of 1 mg of dl-α-tocopheryl acetate was defined as equivalent to one IU of vitamin E. The dl-α-tocopheryl acetate of commerce currently available is synthesized from synthetic isophytol, has eight stereoisomers, and is labeled as dl-α-tocopheryl acetate. However, it is more accurately called all rac-α-tocopheryl acetate (AIN, 1990; IUPAC, 1974) because it contains three asymmetric carbon atoms in the 2, 4', and 8' positions (2RS, 4'RS, 8'RS-α-tocopherol). The all rac and ambo-α-tocopheryl acetates were shown to have the same biological activity in rats (Weiser et al., 1986). |
the esters (e.g., α-tocopheryl acetate or α-tocopheryl succinate) are hydrolyzed and absorbed as efficiently as α-tocopherol (Cheeseman et al., 1995).
Interconversion of Vitamin E Units
Before 1980, for pharmacological uses, one international unit (IU) of vitamin E activity was defined as 1 mg of all rac-α-tocopheryl acetate by the United States Pharmacopeia (USP) (USP, 1979). Using the rat fetal resorption assay, 1 mg of RRR-α-tocopherol was calculated to be equivalent to 1.49 IU of vitamin E (Weiser and Vecchi, 1981).
After 1980, the IU was changed to the USP unit where one USP unit of vitamin E was still defined as having the activity of 1 mg of all rac-α-tocopheryl acetate, 0.67 mg RRR-α-tocopherol, or 0.74 mg RRR-α-tocopheryl acetate (USP, 1980). Although IUs are no longer recognized, many fortified foods and supplements still retain this terminology while USP units are now generally used by the pharmaceutical industry in labeling vitamin E supplements. Both systems are based on the same equivalency.
Since the USP unit was defined before studies were published indicating that the 2S-stereoisomers of all rac-α-tocopherol were not maintained in human plasma (Acuff et al., 1994; Kiyose et al., 1997: Traber, 1999) or in tissues (Burton et al., 1998), it is recommended that the present equivalency used in the USP system be redefined based on the definition presented in this report of what contributes to the active form of vitamin E in humans. Vitamin E is defined here as limited to the 2R-stereoisomeric forms of α-tocopherol (RRR-, RSR-, RRS-, and RSS-α-tocopherol) to establish recommended intakes. Based on this definition, all rac-α-tocopherol has one-half the activity of RRR-α-tocopherol found in foods or present with the other 2R stereoisomeric forms (RSR-, RRS- and RSS-) of α-tocopherol in fortified foods and supplements. Thus to achieve the RDA recommended in this report of 15 mg/day of α-tocopherol, a person can consume 15 mg/day of RRR-α-tocopherol or 15 mg/day of the 2R-stereoisomeric forms of α-tocopherol (e.g., 30 mg/day of all rac-α-tocopherol) or a combination of the two. The factors necessary to convert RRR- and all rac-α-tocopherol and their esters based on this new definition of vitamin E to USP units (IUs) are shown in Table 6-1.
TABLE 6-1 Factors for Converting International Units of Vitamin Ea to α-Tocopherolb (mg) to Meet Recommended Intake
|
USP Conversion Factorsc |
Molar Conversion Factorsd |
α-Tocopherol Conversion Factorse |
||
|
IU/mg |
mg/IU |
µmol/IU |
mg/IU |
|
|
Synthetic Vitamin E and Esters |
||||
|
dl-α-Tocopheryl acetate |
1.00 |
1.00 |
2.12 |
0.45 |
|
dl-α- Tocopheryl succinate |
0.89 |
1.12 |
2.12 |
0.45 |
|
dl-α-Tocopherolf |
1.10 |
0.91 |
2.12 |
0.45 |
|
Natural Vitamin E and Esters |
||||
|
d-α-Tocopheryl acetate |
1.36 |
0.74 |
1.56 |
0.67 |
|
d-α-Tocopheryl succinate |
1.21 |
0.83 |
1.56 |
0.67 |
|
d-α-Tocopherolg |
1.49 |
0.67 |
1.56 |
0.67 |
|
a Vitamin E supplements are historically and incorrectly labeled d- or dl-α-tocopherol. Vitamin E compounds include the all racemic (all rac)-α-tocopherol (dl-α-tocopherol [RRR-, RRS-, RSR-, RSS-, SSS-, SRS-, SSR-, and SRR-] or synthetic) form and its esters and the RRR-α-tocopherol (d-α-tocopherol or natural) form and its esters. All of these compounds of vitamin E may be present in fortified foods and multivitamins. Not all stereoisomers function to meet vitamin E requirements in humans. b α-Tocopherol as defined in this report to meet recommended intakes includes RRR-α-tocopherol (historically and incorrectly labeled d-α-tocopherol) the only form of α-tocopherol that occurs naturally in foods, and the other 2R-stereoisomeric forms of α-tocopherol (RSR-, RRS-, and RSS-α-tocopherol) that are synthesized chemically and thus are found in fortified foods and supplements (Figure 6-2). c Official United States Pharmacopeia (USP) conversions where one IU is defined as 1 mg of all rac-α-tocopheryl acetate (USP, 1979, 1999). All of the conversions are based on rat fetal resorption assays that were conducted in the 1940s. The amounts of the free and succinate forms have been adjusted for their different molecular weights relative to the all rac-α-tocopheryl acetate (incorrectly labeled dl-α-tocopheryl acetate). d To convert mg to µmol divide the mg by the molecular weight of the vitamin E compound (α-tocopheryl acetate = 472; α-tocopheryl succinate = 530; α-tocopherol = 430) and multiply by 1,000. Because the amount of free and succinate compounds are adjusted for their different molecular weights relative to α-tocopheryl acetate, these forms have the same conversion factors as the corresponding tocopherol compounds. e To convert the µmol of the vitamin E compound to mg of α-tocopherol, multiply the µmol by the molecular weight of α-tocopherol (430) and divide by 1,000. The activities of the three synthetic α-tocopherol compounds have been divided by 2 because the 2S-stereoisomers contained in synthetic-α-tocopherol are not maintained in the blood. fdl-α-Tocopherol = all rac-(racemic) α-tocopherol = synthetic vitamin E; all rac-α-tocopherol = RRR-, RRS-, RSR-, RSS-, SSS-, SRS-, SSR-, and SRR-α-tocopherol isomers. gd-α-Tocopherol = RRR-α-tocopherol = natural vitamin E. |
||||
Units of Vitamin E Activity
It is now known that vitamin E forms are not interconvertible in the human and that their plasma concentrations are dependent on the affinity of hepatic α-tocopherol transfer protein (α-TTP) for them (see section on “Hepatic α-Tocopherol Transfer Protein”). Kinetic studies have shown that while RRR-α-tocopherol concentrations are maintained in human plasma, the same is not true for either synthetic SRR-α-tocopherol or natural γ-tocopherol (Traber et al., 1990a, 1992). These compounds are efficiently absorbed and delivered to the liver in chylomicrons but are packaged poorly into newly secreted lipoproteins for delivery to peripheral tissues (see section on “Preferential Secretion of α-Tocopherol from the Liver”). In light of these new findings in humans, it becomes necessary to reevaluate the relative biological potencies of different forms of vitamin E. Therefore, it is best to measure and report the actual concentrations of each of the various vitamin E forms in food and biological samples.
Current information suggests that the number of methyl groups and the stereochemistry of the phytyl tail at the point where it meets the chromanol ring (2 position) determine the affinity of the α-TTP for the vitamin E form and that this protein in turn determines the effective vitamin E biological activity (Hosomi et al., 1997). Since the 2S-stereoisomers (Figure 6-2) are not maintained in human plasma or in tissues, the difference in relative activity of all rac-α-tocopherol compared to RRR-α-tocopherol is 50 percent as demonstrated in Figure 6-3.
Vitamin E activity in food is often reported as α-tocopherol equivalents (α-TE) (Bieri and Evarts, 1973, 1974; Eitenmiller and Landen, 1995) as have been dietary recommendations (NRC, 1989). Previously, factors for the conversion of the tocopherols and tocotrienols to α-TE units were based on the biological activity of the various forms as determined using the rat fetal resorption assay (Bieri and McKenna, 1981). α-TEs were defined as α-tocopherol, mg × 1.0; β-tocopherol, mg × 0.5; γ-tocopherol, mg × 0.1; δ-tocopherol, mg × 0.03; α-tocotrienol, mg × 0.3; and β-tocotrienol, mg × 0.05 (NRC, 1989). The biological activities of γ- and δ-tocotrienol were below detection.
Based on a review of the data, the 2R-stereoisomeric forms of α-tocopherol (RRR-, RSR-, RRS-, and RSS-α-tocopherol) are now used to estimate the vitamin E requirement. The 2S-stereoisomeric forms of α-tocopherol and the other tocopherols (β-, γ-,and δ-tocopherol) and the tocotrienols are not used to estimate the vitamin E require-
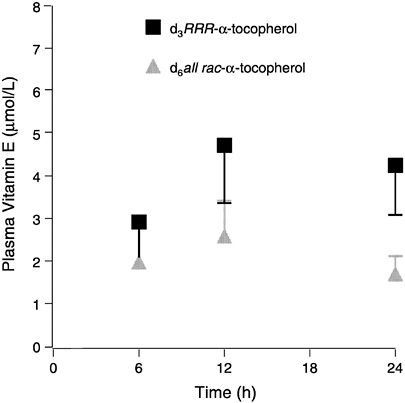
FIGURE 6-3 Plasma labeled (d3 and d6) α-tocopherols (means ± standard error, n = 6) following administration of a single dose containing 150 mg each d3RRR-α-and d6all rac-α-tocopherol acetates.
SOURCE: Adapted from Traber et al. (1998).
ment because of their failure to bind with the α-TTP. Thus, the Estimated Average Requirements (EARs), Recommended Dietary Allowances (RDAs), and Adequate Intakes (AIs) that follow apply only to intake of the 2R-stereoisomeric forms of α-tocopherol from food, fortified food, and multivitamins. The ULs apply to any forms of supplemental α-tocopherol.
Currently, most nutrient databases, as well as nutrition labels, do not distinguish between the different tocopherols in food. They often present the data as α-tocopherol equivalents and include the contribution of all eight naturally occurring forms of vitamin E (Figure 6-1), after adjustment for bioavailability of the various forms (see above). Because these other forms of vitamin E occur naturally in foods (e.g., γ-tocopherol is present in widely consumed oils such
as soybean and corn oils), the intake of α-tocopherol equivalents is greater than the intake of α-tocopherol (2R-stereoisomeric forms) alone (see later section “Intake of Vitamin E” for suggested conversion factor).
Function
Unlike most nutrients, a specific role for vitamin E in a required metabolic function has not been found. Vitamin E's major function appears to be as a non-specific chain-breaking antioxidant.
Antioxidant Activity
Vitamin E is a chain-breaking antioxidant that prevents the propagation of free-radical reactions (Burton and Ingold, 1986; Burton et al., 1983; Ingold et al., 1987; Kamal-Eldin and Appelqvist, 1996; Packer, 1994; Tappel, 1962). The vitamin is a peroxyl radical scavenger and especially protects polyunsaturated fatty acids (PUFAs) within membrane phospholipids and in plasma lipoproteins (Burton et al., 1983). Peroxyl radicals (abbreviated ROO•) react with vitamin E (abbreviated Vit E-OH) 1,000 times more rapidly than they do with PUFA (abbreviated RH) (Packer, 1994). The phenolic hydroxyl group of tocopherol reacts with an organic peroxyl radical to form the corresponding organic hydroperoxide and the tocopheroxyl radical (Vit E-O•) (Burton et al., 1985):
In the presence of vitamin E: ROO•+Vit E-OH → ROOH + Vit E-O•
In the absence of vitamin E: ROO•+RH → ROOH+R•R•+ O2 → ROO•
The tocopheroxyl radical can then undergo several possible fates. It can (1) be reduced by other antioxidants to tocopherol (see section on “ Antioxidant Interactions ”), (2) react with another tocopheroxyl radical to form non-reactive products such as tocopherol dimers, (3) undergo further oxidation to tocopheryl quinone (see section on “ Metabolism ”), and (4) act as a prooxidant and oxidize other lipids (see section on “ Antioxidant Interactions ”).
Biochemical and Molecular Biologic Activities
In addition to its direct antioxidant function, α-tocopherol reportedly has specific molecular functions, α-Tocopherol inhibits
protein kinase C activity, which is involved in cell proliferation and differentiation, in smooth muscle cells (Boscoboinik et al., 1991; Chatelain et al., 1993; Clement et al., 1997; Stauble et al., 1994; Tasinato et al., 1995), human platelets (Freedman et al., 1996), and monocytes (Cachia et al., 1998; Devaraj et al., 1996). Protein kinase C inhibition by α-tocopherol is in part attributable to its attenuating effect on the generation of membrane-derived diacylglycerol, a lipid that facilitates protein kinase C translocation, thus increasing its activity (Kunisaki et al., 1994; Tran et al., 1994).
Vitamin E enrichment of endothelial cells downregulates the expression of intercellular cell adhesion molecule (ICAM-1) and vascular cell adhesion molecule-1 (VCAM-1), thereby decreasing the adhesion of blood cell components to the endothelium (Cominacini et al., 1997). Vitamin E also upregulates the expression of cytosolic phospholipase A2 (Chan et al., 1998a; Tran et al., 1996) and cyclooxygenase-1 (Chan et al., 1998b). The enhanced expression of these two rate-limiting enzymes in the arachidonic acid cascade explains the observation that vitamin E, in a dose-dependent fashion, enhanced the release of prostacyclin, a potent vasodilator and inhibitor of platelet aggregation in humans (Szczeklik et al., 1985; Tran and Chan, 1990).
Physiology of Absorption, Metabolism, and Excretion
Absorption and Transport
Intestinal Absorption. While the efficiency of vitamin E absorption is low in humans, the precise rate of absorption is not known with certainty. In the early 1970s, vitamin E absorption was estimated to be 51 to 86 percent, measured as fecal radioactivity following ingestion of α-tocopherol (Kelleher and Losowsky, 1970; MacMahon and Neale, 1970). However, when Blomstrand and Forsgren (1968) measured vitamin E absorption in two individuals with gastric carcinoma and lymphatic leukemia, respectively, they found fractional absorption in the lymphatics to be only 21 and 29 percent of label from meals containing α-tocopherol and α-tocopheryl acetate, respectively.
Vitamin E absorption from the intestinal lumen is dependent upon biliary and pancreatic secretions, micelle formation, uptake into enterocytes, and chylomicron secretion. Defects at any step lead to impaired absorption (Gallo-Torres, 1970; Harries and Muller, 1971; Sokol, 1993; Sokol et al., 1983, 1989). Chylomicron
secretion is required for vitamin E absorption and was suggested by Muller et al. (1974) to be the most important factor for efficient vitamin E absorption. All of the various vitamin E forms studied, including α- and γ-tocopherols (Meydani et al., 1989; Traber and Kayden, 1989; Traber et al., 1992), RRR- and SRR-α-tocopherols (Kiyose et al., 1997; Traber et al., 1990a, 1992), or RRR- and all racα-tocopherols (Traber et al., 1994a), showed similar apparent efficiencies of intestinal absorption and subsequent secretion in chylomicrons. During chylomicron catabolism, some vitamin E is distributed to all of the circulating lipoproteins (Figure 6-4).
Preferential Secretion of α-Tocopherol from the Liver. Chylomicron remnants, containing newly absorbed vitamin E, are taken up by the liver. Vitamin E is secreted from the liver in very low density lipoproteins (VLDLs), as demonstrated in rats (Cohn et al., 1988), isolated rat hepatocytes (Bjørneboe et al., 1987; Cohn et al., 1988), and perfused monkey livers (Traber et al., 1990b). Plasma vitamin E concentrations depend upon the secretion of vitamin E from the liver, and only one form of vitamin E, α-tocopherol, is preferentially resecreted by the liver (Figure 6-5) (Traber, 1999). Thus, the liver, not the intestine, discriminates between tocopherols and is responsible for the preferential plasma enrichment with α-tocopherol, α-TTP is a likely candidate for this discriminatory function (see below).
Hepatic α-Tocopherol Transfer Protein (α-TTP). α-TTP was first identified (Catignani and Bieri, 1977), purified, and characterized from rat liver cytosol (Sato et al., 1991; Yoshida et al., 1992). It has also been isolated from human liver cytosol (Kuhlenkamp et al., 1993), and the human complementary deoxyribonucleic acid (cDNA) sequence has been reported (Arita et al., 1995). The human cDNA sequence (encoding 238 amino acids) has 94 percent homology to the rat sequence, and the some similarity to sequences for the retinaldehyde binding protein in the retina and to sec14, a phospholipid transfer protein (Arita et al., 1995).
In vitro, α-TTP transfers α-tocopherol between liposomes and microsomes (Hosomi et al., 1997; Sato et al., 1991). The relative affinities of α-TTP toward the various forms of vitamin E (calculated from the degree of competition with RRR-α-tocopherol) are RRR-α-tocopherol = 100 percent; RRR-β-tocopherol = 38 percent; RRR-γ-tocopherol = 9 percent; RRR-δ-tocopherol = 2 percent; α-tocopheryl acetate = 2 percent; α-tocopheryl quinone = 2 percent; SRR-α-tocopherol = 11 percent; α-tocotrienol = 12 percent; and Trolox = 9
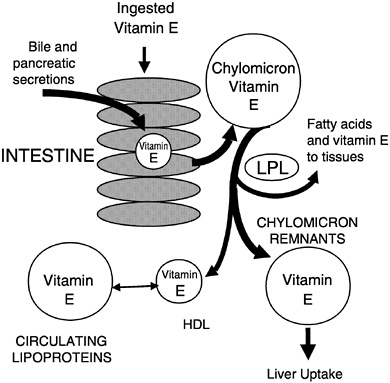
FIGURE 6-4 Vitamin E secretion in chylomicrons and distribution to circulating lipoproteins.
percent (Hosomi et al., 1997). Data on the affinity of α-TTP for the other 2R-stereoisomers (RSR-, RRS-, and RSS-) of α-tocopherol has not been reported.
NOTE: HDL = high-density lipoprotein; LPL = lipoprotein lipase.
SOURCE: Adapted from Traber (1999).
Plasma Vitamin E Kinetics. A kinetic model of vitamin E transport in human plasma has been developed using data from studies with deuterium-labeled stereoisomers of α-tocopherol (RRR and SRR) (Traber et al., 1994b). The apparent half-life of RRR-α-tocopherol in normal subjects was approximately 48 hours, consistent with the “slow” disappearance of RRR-α-tocopherol from the plasma, whereas the half-life for SRR-α-tocopherol was approximately 13 hours. The half-life of γ-tocopherol in normal subjects has been estimated to be approximately 15 hours (Acuff et al., 1997).
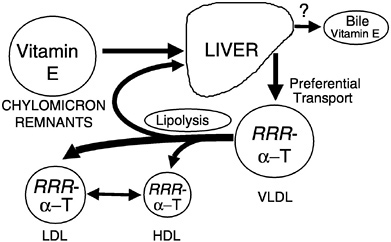
FIGURE 6-5 RRR-α-Tocopherol is preferentially resecreted by the liver and distributed to circulating lipoproteins. NOTE: HDL = high-density lipoprotein; LDL = low-density lipoprotein; VLDL = very low-density lipoprotein.
SOURCE: Adapted from Traber (1999).
In three people with ataxia and vitamin E deficiency (AVED) secondary to a defect in the α-TTP gene (Cavalier et al., 1998), the half-lives for both RRR- and SRR-α-tocopherols were approximately 13 hours (Traber et al., 1994b). These studies demonstrate that RRR- and SRR-α-tocopherols in the AVED patients disappear at the same rate as SRR-α-tocopherol in the control subjects. This suggests that α-TTP, which is defective in the AVED patients, is responsible for the longer half-life of RRR-α-tocopherol in the control subjects. It was estimated that resecretion of RRR-α-tocopherol by the liver in the control subjects resulted in the daily replacement of nearly all of the circulating RRR-α-tocopherol. Thus, the liver maintains plasma RRR-α-tocopherol concentrations by a continuous resecretion process. In contrast, other forms of vitamin E (e.g., SRR-α- and γ-tocopherols) are not resecreted into the plasma.
Metabolism
Oxidation Products. α-Tocopherol can be oxidized to the tocopheroxyl radical—one-electron oxidation product—which can be reduced back to the unoxidized form by reducing agents such as vitamin C. Further oxidation of the tocopheroxyl radical forms
tocopheryl quinone, the two-election oxidation product. The tocopheryl quinone is not converted in any physiologically significant amounts back to tocopherol (Moore and Ingold, 1997). Other oxidation products, including dimers and trimers as well as adducts (Kamal-Eldin and Appelqvist, 1996), are formed during in vitro oxidation; their importance in vivo is unknown.
Other Metabolites. Vitamin E metabolites in human urine include both 2,5,7,8-tetramethyl-2-(2 ′-carboxyethyl)-6-hydroxychroman (α-CEHC) derived from α-tocopherol (Schultz et al., 1995, 1997) and 2,7,8-trimethyl-2- (2 ′-carboxyethyl)-6-hydroxychroman (γ-CEHC) derived from γ-tocopherol (Murray et al., 1997; Wechter et al., 1996). These metabolites result from degradation of the phytyl tail; the chromanol ring is unchanged and thus they are not oxidation products of vitamin E. It is unknown where these metabolites are formed.
Excretion
Urinary Excretion. Increasing doses of supplemental vitamin E in humans result in increasing urinary excretion of the α-CEHC metabolite (Schultz et al., 1995). Interestingly, three times as much all rac-α-tocopherol as compared with RRR-α-tocopherol is excreted as α-CEHC, while twice as much RRR-α-tocopherol is found in the plasma (Traber et al., 1998), suggesting that these urinary metabolites may be indicators of nonpreferentially utilized vitamin E forms. Indeed, Swanson et al. (1998, 1999) showed that about half of the ingested γ-tocopherol is metabolized and excreted as γ-CEHC. This metabolite has been reported to inhibit the potassium channel and increase urinary sodium excretion (Kantoci et al., 1997; Murray et al., 1997; Wechter et al., 1996). Thus, urinary excretion of CEHC may indicate excess vitamin E intake. However, this has yet to be definitively demonstrated, and no physiological role for the in vivo effects of γ-CEHC have been established.
Fecal Excretion. The major route of excretion of ingested vitamin E is fecal elimination because of its relatively low intestinal absorption. Excess α-tocopherol, as well as forms of vitamin E not preferentially used, are probably excreted unchanged in bile (Traber and Kayden, 1989). Leo et al. (1995) report α-tocopherol concentrations in human bile of 8.4 ± 0.9 (SD) µmol/L (361 ± 38.7 µg/dL) compared with 23.2 ± 1.7 (SD) µmol/L (998 ± 73 µg/dL) in plasma.
Storage
Tissues are dependent upon uptake of vitamin E from plasma (Traber, 1999). No specific plasma transport proteins have been described; therefore, it is likely that the mechanisms of lipoprotein metabolism determine the delivery of vitamin E to tissues. Tissues probably acquire vitamin E by several major routes: (1) during lipoprotein lipase mediated triglyceride-rich lipoprotein catabolism; (2) during low-density lipoprotein (LDL) uptake via the LDL receptor; (3) via high-density lipoprotein (HDL)-mediated delivery systems; and (4) by nonspecific transfers between lipoproteins and tissues. Vitamin E rapidly transfers between various lipoproteins and also between lipoproteins and membranes, which may enrich membranes with vitamin E. The human plasma phospholipid transfer protein accelerates this process (Kostner et al., 1995).
Human tissue vitamin E contents have been reported mostly from relatively easy-to-sample tissues (e.g., adipose tissue and buccal mucosal cells) (Handelman et al., 1994; Kayden et al., 1983; Parker, 1988; Peng et al., 1994; Traber and Kayden, 1987; Traber et al., 1987). To obtain a variety of human tissues, Burton et al. (1998) enlisted two terminally ill subjects who agreed to daily supplementation with deuterated (d3-RRR- and d6-all rac) α-tocopherols. At death, an autopsy was performed to obtain various tissues. One subject took 15 mg (32 µmol) d3-RRR- and 15 mg (32 µmol) d6-all rac-α-tocopheryl acetate for 361 days, while the other took 150 mg (320 µmol) d3-RRR- plus 150 mg (320 µmol) d6-all rac-α-tocopheryl acetates for 615 days. Tissue unlabeled α-tocopherol concentrations were generally similar in both patients. In the patient who consumed 30 mg (64 µmol)/day labeled vitamin E for 1 year, about 5.9 ± 2.2 (SD) percent of the tissue vitamin E was labeled, while about 65 ± 10 (SD) percent was labeled in the patient who consumed a total of 300 mg (640 µmol) daily for 2 years. The RRR/all rac ratios in plasma and tissues at autopsy were similar in both patients (2.06 and 1.71 ± 0.24 (SD), respectively, on the lower dose and 2.11 and 2.01 ± 0.17 (SD), respectively, on the higher dose).
The results indicate that the RRR-stereoisomer has roughly twice the availability of the all rac forms. The effect of 300 mg vitamin E supplementation was to increase plasma α-tocopherol concentrations threefold and to at least double most tissue concentrations, while supplementation with 30 mg had little effect on either plasma or tissue α-tocopherol concentrations. These data suggest that tissue α-tocopherol concentrations largely reflect changes in plasma concentrations of α-tocopherol and that larger doses increase tissue
α-tocopherol concentrations, including those in the nervous tissues (Burton et al., 1998). Importantly, the lower dose, even though given for more than a year and a half, did not increase tissue tocopherol concentrations.
Clinical Effects of Inadequate Intake
Prevalence of Vitamin E Deficiency
Vitamin E deficiency occurs only rarely in humans, and overt deficiency symptoms in normal individuals consuming diets low in vitamin E have never been described. Vitamin E deficiency occurs only as a result of genetic abnormalities in α-TTP, as a result of various fat malabsorption syndromes (Rader and Brewer, 1993; Sokol, 1993), or as a result of protein-energy malnutrition (Kalra et al., 1998; Laditan and Ette, 1982).
Only a handful of families with clinically evident vitamin E deficiency due to a mutation of the α-TTP have been described (Cavalier et al., 1998). The prevalence of less drastic abnormalities in TTP, or the occurrence of heterozygotes for α-TTP gene defects, is not known. It is important to note that symptoms associated with TTP defects and malabsorption syndromes can be reversed by vitamin E supplementation if it is provided before irreversible neurological injury occurs (Kohlschütter et al., 1988; Muller et al., 1985; Schuelke et al., 1999; Sokol et al., 1985, 1988).
Clinical Signs of Deficiency
The primary human vitamin E deficiency symptom is a peripheral neuropathy characterized by the degeneration of the large-caliber axons in the sensory neurons (Sokol, 1988). Other vitamin E deficiency symptoms observed in humans include spinocerebellar ataxia, skeletal myopathy, and pigmented retinopathy (Sokol, 1993). Typical symptoms of vitamin E deficiency are given in Table 6-2.
A distinct pattern in the progression of neurologic symptoms resulting from vitamin E deficiency in humans has been described (Sokol, 1993). By the end of the first decade of life untreated patients with chronic cholestatic hepatobiliary disease have a combination of spinocerebellar ataxia, neuropathy, and ophthalmoplegia. However, the progression of neurological symptoms is slower in children with cystic fibrosis and abetalipoproteinemia. The symptomatology of vitamin E deficiency in AVED is similar to that found in these latter patients (Amiel et al., 1995; Sokol et al., 1988). These
observations suggest that in patients with cholestatic liver disease, there is increased oxidative stress, perhaps as a result of copper accumulation in the liver (Bayliss et al., 1995).
Hemolysis, using hydrogen peroxide or other oxidants added in vitro, has been used as a test for vitamin E adequacy in subjects thought to be at risk for vitamin E deficiency (Boda et al., 1998; Farrell et al., 1977). These tests suggest that plasma α-tocopherol concentrations of 14 µmol/L (600 µg/dL) are sufficient to prevent hemolysis (Farrell et al., 1977).
SELECTION OF INDICATORS FOR ESTIMATING THE REQUIREMENT FOR α-TOCOPHEROL
Lipid Peroxidation Markers
Several biomarkers measured in plasma, urine, or breath have been used to reflect the degree of lipid peroxidation in vivo. These include thiobarbituric acid reactive substances (TBARS), malondialdehyde, conjugated dienes, pentane, ethane, and the F2-isoprostanes.
Quantification of F2-isoprostanes, isomers of prostaglandin F2, has been suggested by a number of investigators as the most reliable index of in vivo free-radical generation and oxidative lipid damage (Morrow et al., 1999). The F2-isoprostanes are formed in membranes from arachidonyl-containing lipids largely as a result of free radical-catalyzed lipid peroxidation (Klein et al., 1997; Moore and Roberts, 1998). The F2-isoprostanes are increased in vitamin E-deficient rats (Awad et al., 1994). Importantly, their excretion was depressed in humans by consuming antioxidant vitamin supplements (Delanty et al., 1996; Reilly et al., 1996). Furthermore, in an animal atherosclerosis model, the apoE-deficient mouse, vitamin E supplementation not only suppressed F2-isoprostane production but also decreased atherosclerotic lesion formation (Pratico et al., 1998).
In general, lipid peroxidation markers are elevated during vitamin E depletion and their levels can be normalized upon vitamin E repletion. However, these markers are not necessarily specific to vitamin E, since changes in intake of other antioxidants can also change the levels of these markers. At present, there is no evidence that lowering lipid peroxidation marker levels is associated with health benefits. Therefore, estimates of lipid peroxidation products have not been used for establishing α-tocopherol requirements.
TABLE 6-2 Vitamin E Deficiency Symptoms in Subjects with Ataxia with Vitamin E Deficiency
|
Reference |
Country |
Subjects |
Clinical Features |
|
Burck et al., 1981 |
Germany |
n = 1 male; aged 12 |
Ataxia Sensory neuropathy Muscle hypertrophy |
|
Laplante et al., 1984 |
Canada |
n = 1 male; aged 10 |
Areflexia Gait and limb ataxia Muscle weakness Decreased vibration sense Decreased proprioception Limb dysmetria Babinski sign |
|
Harding et al., 1985 |
United Kingdom |
n = 1 female; aged 23 (aged 13 at onset) |
Head titubation Reduced muscle tone Ataxia Areflexia Romberg sign Defective or absent vibration sense Impaired proprioception |
|
Krendel et al., 1987 |
United States |
n = 1 male; aged 19 |
Severe dysarthria Unintelligible speech Bradykinesia Absent tendon reflexes |
|
Stumpf et al., 1987 |
Italy |
n = 1 female; aged 30 (aged 4 at onset) |
Dysarthria Dystonic smile Absent position sensation in leg and hands Absent tendon reflexes Mildly dysmetric Extensor plantar responses Moderately ataxic heel to shin movements Romberg sign |
|
Genetic Abnormalities in α-TPPa Gene |
Histological/Biochemical Features |
|
530AG→6/530AG→6 mutation |
Low serum vitamin E concentration: <2.3 µmol/L (1.0 µg/mL) (normal: 20.2 µmol/L [8.7 µg/mL]) |
|
R134X mutation |
Low blood vitamin E concentration: <2.3 µmol/L (1.0 µg/mL) (normal: 12–28 µmol/L [5–12 µg/mL]) |
|
NDb |
No detectable vitamin E in serum (normal: 12–35 µmol/L [5–15 µg/mL]) All other histologic and biochemical measurements were normal |
|
ND |
Low serum vitamin E concentration: 1.6 µmol/L (0.7 µg/mL) (normal: >12 µmol/L [5 µg/mL]) |
|
ND |
Reduced sensory nerve amplitudes Low serum vitamin E concentration: <2.3 µmol/L (1.0 µg/mL) (normal: 12–46 µmol/L [5–20 µg/mL]) Low serum vitamin E to total serum lipids ratio: <0.15 mg/g (normal: >0.8 mg/g) Skeletal muscle changes characteristic of vitamin E deficiency (fiber size variation, coarse intramyofibrillar network, fiber-type grouping, and lysosomal inclusions) Normal fat excretion, mitochondria function, cytochrome c oxidase activity, and ADPc:Od ratios |
TABLE 6-2 continued
|
Reference |
Country |
Subjects |
Clinical Features |
|
Gotoda et al., 1995 |
Japan |
n = 1 male; aged 62 (aged 52 at onset) |
Unsteadiness in the dark Slurred and scanning speech Moderate ataxia in all extremities Flexor plantar responses Reduced reaction to touch and pinprick No joint position sense in toes Broad-based and ataxic gait Romberg sign No knee or ankle reflexes Numbness in fingers and toes |
|
Kohlschütter et al., 1988 |
Germany |
n = 1 male; aged 19 |
Ataxia Sensory neuropathy Lipopigment deposition |
|
Sokol et al., 1988 |
United States |
n = 1 male and 3 females; aged 21–30 |
Head titubation Intention tremor in hand Difficulty walking Progressive ataxia Dysarthria Vibratory and sensory loss Incontinence Pes cavus Position sense loss |
|
Trabert et al., 1989 |
Germany |
n = 1 male; aged 26 |
Cerebellar ataxia No tendon reflexes in lower limbs Vibration sense disturbances Babinsky sign Head titubation |
|
Ben Hamida et al., 1993 |
Tunisia |
n = 7 Friedreich's ataxia patients; aged 21–34 |
Severe cerebellar ataxia Severe dysarthria Slight deep sensory loss Slight Babinski signs Slight Pes cavus Slight kyphoscoliosis Absent to moderate cardiomyopathyf |
|
Genetic Abnormalities in α-TPPa Gene |
Histological/Biochemical Features |
|
Homozygous for His101Gln point mutation |
Low serum vitamin E concentration: 2.6 µmol/L (1.1 µg/mL) (normal: 12–46 µmol/L [5–20 µg/mL]) Low muscle vitamin E: 1.6 µg/g (normal: 10.5–25.7 µg/g) Low serum vitamin E to total lipid ratio: 0.19 mg/g (normal: >0.80 mg/g) Low vitamin E in erythrocytes: 0.5 µmol/L (0.2 µg/mL) (normal: 3.9–12.5 µmol/L [1.7–5.4 µg/mL]) Normal serum cholesterol and serum triglycerides |
|
530AG→6/530AG→6 mutation |
Subnormal serum vitamin E concentration: <2.3 µmol/L (1.0 µg/mL) (normal: 7–32 µmol/L [3–14 µg/mL]) Elevated TBARSe |
|
R192H/513insTT mutation |
Low serum vitamin E: 2.3–4.2 µmol/L (1.0–1.8 µg/mL) (normal: 10.9–47.1 µmol/L [4.7–20.3 µg/mL]) Low serum E to total lipids ratio: 0.13–0.38 mg/g (normal: >0.80 mg/g) Abnormal hydrogen peroxide hemolysis: 38–50% (normal: <10%) Low to reduced adipose tissue vitamin E content: 28–143 ng/mg (normal: 150–400 ng/mg) Low sural nerve vitamin E content: 0.8–2.9 ng/µg (normal: 2.1–62.5 ng/µg) |
|
744delA mutation |
Low vitamin E concentration: <2.3 µmol/L (1.0 µg/mL) (normal: 20.2 µmol/L [8.7 µg/mL]) |
|
744delA mutation |
Very low serum vitamin E concentration: 0.72–2.02 µmol/L (0.31–0.87 µg/mL) (normal: 20.2 µmol/L [8.7 µg/mL]) |
TABLE 6-2 continued
Oxidation Products of DNA or Proteins
Vitamin E has not been shown to directly protect deoxyribonucleic acid (DNA) or proteins against oxidative damage (Halliwell, 1999). Therefore, DNA adducts or protein carbonyls were not used to assess α-tocopherol requirements.
Vitamin E Metabolite Excretion
Excretion of vitamin E metabolites have been shown in one study to increase with increasing vitamin E intake in humans (Schultz et al., 1995). Increasing amounts of 2,5,7,8-tetramethyl-2-(2′-carboxy-
|
Genetic Abnormalities in α-TPPa Gene |
Histological/Biochemical Features |
|
Found no mutations or polymorphisms in the α-TTP gene |
Low serum vitamin E concentration: 0.05–1.18 µmol/L (0.02–0.51 µg/mL) (normal: 12–46 µmol/L [5–20 µg/mL]) |
|
Found no mutations in the frataxin gene |
Low serum vitamin E concentration: 2.8 and 5.3 µmol/L (1.2 and 2.3 µg/mL) (normal: 12–37 µmol/L [5–16 µg/mL]) Slightly low sensory action potentials |
|
Homozygous for 513insTT mutation |
Low serum vitamin E concentration: <5 µmol/L (2 µg/mL) (normal: 10–42 µmol/L [4–18 µg/mL]) |
c ADP = adenosine diphosphate.
d O = oxygen.
e TBARS = thiobarbituric acid reactive substances.
f This was the only report of any cardiomyopathy.
ethyl)-6-hydroxychroman (α-CEHC) were excreted in the urine when a plasma threshold of 30 µmol/L (1,290 µg/dL) of α-tocopherol was exceeded. However, the α-CEHC metabolite represents only a small fraction of the α-tocopherol consumed daily, and there are few data concerning its formation. Therefore, α-CEHC excretion has not been used as a basis for assessing the α-tocopherol requirement.
Vitamin E Biokinetics
Vitamin E kinetics, metabolism, and pool size determinations in humans have been limited. Therefore, insufficient data exist for
assessing human requirements for the amounts needed to maintain body pools. Almost no data exist on pool sizes or tissue concentrations of vitamin E, especially the various forms of vitamin E. Studies using isotope-labeled vitamin E may provide kinetic data that can be used to determine daily α-tocopherol requirements in the future.
Vitamin E Deficiency Symptoms
Overt vitamin E deficiency is so rare in humans that signs of deficiency (e.g., neurological abnormalities) and comparisons of deficiency signs with dietary intakes are simply not available to serve as a basis for estimating requirements.
Plasma α-Tocopherol Concentration
Several studies have reported the determinants of plasma α-tocopherol, as measured by high-performance liquid chromatography methods, and provided mathematical models that attempted to correlate usual vitamin E intakes with normal plasma concentrations (Ascherio et al., 1992; Gascón-Vila et al., 1997; Kardinaal et al., 1995; Stryker et al., 1988). Kardinaal et al. (1995) reported that plasma α-tocopherol concentrations were not associated with dietary intake, whereas others (Ascherio et al., 1992; Stryker et al., 1988) report that associations seen were largely due to vitamin E supplement intake. Recently, Ford and Sowell (1999) reported that plasma α-tocopherol concentrations in the Third National Health and Nutrition Examination Survey (NHANES III) did not correlate with the 24-hour dietary recall data. In any case, the correlation between intake and normal vitamin E plasma concentrations (greater than 16 µmol/L [688 µg/dL]) is not strong and could not be used as the basis for estimating the α-tocopherol requirement. However, in vitamin E-depleted subjects a linear increase in plasma α-tocopherol concentration was found with increasing vitamin E intake up to 17 mg (39.5 µmol)/day (Horwitt, 1960).
Hydrogen Peroxide-Induced Hemolysis
Studies in children with cystic fibrosis and in vitamin E-depleted adults provide evidence for the relationship between vitamin E status, plasma α-tocopherol concentrations, and erythrocyte susceptibility to hydrogen peroxide-induced lysis (Farrell et al., 1977; Horwitt, 1960). The children become vitamin E deficient because the impaired secretion of pancreatic digestive enzymes causes steatorrhea and vitamin E malabsorption, even when pancreatic
enzyme supplements are administered orally. More severe vitamin E deficiency symptoms, including neurological abnormalities, occur if bile secretion is also impaired in the children (Cynamon et al., 1988; Elias et al., 1981; Farrell et al., 1977; Sokol et al., 1989; Stead et al., 1986; Winklhofer-Roob et al., 1996a,b). Breath ethane, a lipid peroxidation marker, and erythrocyte susceptibility to in vitro hydrogen peroxide lysis have been inversely correlated with plasma α-tocopherol concentrations in children and adults with vitamin E deficiency as defined by low plasma vitamin E concentrations (Refat et al., 1991). Moreover, both the markers (breath ethane concentrations and erythrocyte lysis) and the symptoms of neurological abnormality can be corrected with supplemental vitamin E.
Relationship of Vitamin E Intake to Chronic Diseases
Cardiovascular Disease
The hypothesis that oxidized low-density lipoprotein (oxLDL) is a causative agent in the development of cardiovascular disease (Steinberg et al., 1989) continues to dominate experimental protocols aimed at understanding the cause, and potentially the prevention, of cardiovascular disease.
Vitamin E does inhibit LDL oxidation whether induced by cells in culture (Steinbrecher et al., 1984) or by copper ion in vitro (Dieber-Rotheneder et al., 1991; Jialal et al., 1995; Reaven et al., 1993). In addition, vitamin E could affect atherogenesis at a number of steps, based on the following in vitro observations:
-
Vitamin E inhibits smooth muscle cell proliferation through the inhibition of protein kinase C (Azzi et al., 1995; Boscoboinik et al., 1991; Chatelain et al., 1993).
-
Vitamin E inhibits platelet adhesion, aggregation, and platelet release reactions (Freedman et al., 1996; Higashi and Kikuchi, 1974; Ishizuka et al., 1998; Steiner and Anastasi, 1976).
-
Vitamin E inhibits plasma generation of thrombin, a potent endogenous hormone that binds to platelet receptors and induces aggregation (Rota et al., 1998).
-
Vitamin E decreases monocyte adhesion to the endothelium by downregulating expression of adhesion molecules (Devaraj et al., 1996; Faruqi et al., 1994; Islam et al., 1998; Martin et al., 1997; Molenaar et al., 1989) and decreasing monocyte superoxide production (Cachia et al., 1998; Islam et al., 1998).
-
In human endothelial cells, vitamin E potentiates synthesis of prostacyclin, a potent vasodilator and inhibitor of platelet aggregation (Chan and Leith, 1981; Szczeklik et al., 1985; Thorin et al., 1994; Tran and Chan, 1990).
-
Vitamin E mediates upregulation of the expression of cytosolic phospholipase A2 and cyclo-oxygenase (Chan et al., 1998a,b; Tran et al., 1996).
-
Vitamin E enrichment of endothelial cells in culture inhibits the expression of intracellular cell adhesion molecule (ICAM-1) and vascular cell adhesion molecule (VCAM-1) induced by exposure to ox LDL (Cominacini et al., 1997).
Inhibition of Atherogenesis in Animal Models. Studies of antioxidants and atherosclerosis have been conducted using LDL receptor-deficient rabbits, cholesterol-fed rabbits, cholesterol-fed monkeys, cholesterol-fed hamsters, apoE-deficient mice, and LDL receptor-deficient mice (see Steinberg, 1997, for list). It can be concluded that the antioxidant hypothesis of atherosclerosis is strongly supported by a large body of evidence in animal models (Parker et al., 1995; Pratico et al., 1999; Sparrow et al., 1992).
Observational Epidemiological Studies. As shown in Table 6-3, three large prospective cohort studies involving both men and women found an inverse association between estimated dietary intake of vitamin E and coronary heart disease (CHD) risk (Kushi et al., 1996; Rimm et al., 1993; Stampfer et al., 1993). One study (Rimm et al., 1993) included 39,910 male health professionals and found a nonsignificant reduction in CHD risk for both total vitamin E intake and intake of vitamin E from supplements. A second study (Stampfer et al., 1993) included 87,245 female nurses and found the reduction in CHD risk primarily for intake of vitamin E from supplements. In contrast, the third study, which was carried out among 34,486 postmenopausal women (Kushi et al., 1996), found the decrease in risk only for vitamin E intake from foods (not from supplements). Few women in the latter study took high doses of supplemental vitamin E, which may account for the difference in findings from the other two studies. Risk reductions of 30 to 60 percent were found for the highest, relative to the lowest, quintile of intake in these studies.
In a smaller cohort study in Finland (2,748 men, 2,385 women), a statistically significant inverse association between dietary intake of vitamin E and coronary mortality was found in both sexes (Knekt et al., 1994). Although the use of vitamin supplements was
very low in this population, there was a suggested inverse association with supplemental vitamin E, as well.
Losonczy et al. (1996) examined vitamin E and vitamin C supplement use in 11,178 subjects (aged 67 to 105 years) who participated in the Established Populations for Epidemiological Studies of the Elderly. Vitamin E supplement use reduced the risk of all-cause mortality (relative risk [RR] = 0.66; 95 percent confidence interval [CI] 0.53 to 0.83) and risk of coronary disease mortality (RR = 0.53; 95 percent CI 0.34 to 0.84).
Additional data on the correlation between vitamin E and atherosclerosis were reported in the subjects who participated in the Cholesterol Lowering Atherosclerosis Study (CLAS), which was a randomized, placebo-controlled trial in men who had undergone coronary bypass surgery (Azen et al., 1996a,b; Hodis et al., 1995). Subjects were intensively treated with colestipol-niacin and advised to follow a cholesterol-lowering diet, or were given dietary counseling alone. Vitamin E intakes, obtained by dietary questionnaires, were inversely correlated with progression of atherosclerosis in coronary and carotid arteries. All subjects combined, those with supplementary vitamin E (100 IU/day or more) demonstrated significantly less coronary artery lesion progression than did subjects with lower vitamin E intakes from supplements (Hodis et al., 1995). Within the colestipol-niacin treated group, there was less coronary artery lesion progression among those taking vitamin E supplements (100 IU/day or more), but subjects in the placebo group showed no benefit of supplementary vitamin E (Hodis et al., 1995). A similar analysis was done on the progression of carotid artery atherosclerosis using ultrasound. Here there was no effect of vitamin E supplements in the drug-treated group, but there was an effect in the placebo group (i.e., opposite findings with respect to drug treatment and vitamin E interactions in the carotid artery from those in the coronary artery; Azen et al., 1996b).
Intervention Trials. Four large-scale, double-blind, randomized intervention trials using vitamin E have been reported. The first, the Alpha-Tocopherol Beta-Carotene (ATBC) Cancer Prevention Study (ATBC Cancer Prevention Study Group, 1994), was designed to determine whether α-tocopherol (50 mg/day of all rac-α-tocopherol acetate) and β-carotene (20 mg/day), alone or in combination, would reduce the incidence of lung cancer in a high-risk group of male smokers in Finland. Although vitamin E had no effect on the primary endpoint (lung cancer), the men taking α-tocopherol had a lower incidence of prostate cancer (see later sec-
TABLE 6-3 Vitamin E Intake and Risk of Coronary Heart Disease in Men and Women
|
Reference |
Variable |
|
Rimm et al., 1993 |
Intake from food (IUa /d) Relative risk of CHDb 95% CIc Intake from supplements (IU/d) Relative risk of CHD 95% CI |
|
Stampfer et al., 1993 |
Intake from food (IU/d) Relative risk of CHD 95% CI Intake from food and supplements (IU/d) Relative risk of CHD 95% CI |
|
Knekt et al., 1994 |
Intake from food (mg/d) Relative risk of CHD 95% CI |
|
Kushi et al., 1996 |
Intake from food (IU/d) Relative risk of CHD 95% CI |
|
a IU = international unit. b CHD = coronary heart disease. |
|
tion “ Cancer ”). The men who received α-tocopherol also had 50 percent higher mortality from hemorrhagic stroke (but 5 percent lower mortality from ischemic heart disease and 16 percent lower mortality from ischemic stroke) than the men who did not receive this supplement. In a subsequent analysis of individuals with previous myocardial infarction, vitamin E supplementation appeared to decrease the risk of nonfatal myocardial infarction by a nonstatistically significant 38 percent (Rapola et al., 1997).
In a trial in Great Britain, the Cambridge Heart Antioxidant Study (CHAOS), patients with angiographically proven coronary artery disease were randomized to receive either 400 or 800 international units (IU) (268 or 567 mg)/day of RRR-α-tocopherol or placebo (Stephens et al., 1996). The study was terminated early because there were statistically significant decreases in the occurrence of nonfatal myocardial infarctions (77 percent) and in total
|
Quintile/Tertile |
|||||
|
1 |
2 |
3 |
4 |
5 |
p Value for Trend |
|
1.6–6.9 |
7.0–8.1 |
8.2–9.3 |
9.4–11.0 |
11.1 |
|
|
1.0 |
1.10 |
1.17 |
0.97 |
0.79 |
|
|
– |
0.80–1.51 |
0.84–1.62 |
0.69–1.37 |
0.54–1.15 |
NSd |
|
0 |
<25 |
25–99 |
100–249 |
≥250 |
|
|
1.0 |
0.85 |
0.78 |
0.54 |
0.70 |
|
|
– |
0.69–1.05 |
0.59–1.08 |
0.33–0.88 |
0.55–0.89 |
NS |
|
0.3–3.1 |
3.2–3.9 |
4.0–4.8 |
4.9–6.2 |
6.3–100 |
|
|
1 |
1.04 |
0.77 |
1.14 |
0.95 |
|
|
– |
0.8–1.35 |
0.66–1.14 |
0.89–1.47 |
0.72–1.23 |
NS |
|
1.2–3.5 |
3.6–4.9 |
5.0–8.0 |
8.1–21.5 |
21.6–1,000 |
|
|
1 |
1 |
1.15 |
0.74 |
0.66 |
|
|
– |
0.78–1.28 |
0.9–1.48 |
0.57–0.98 |
0.5–0.87 |
<0.001 |
|
≤5.3 |
5.4–7.1 |
>7.1 |
|||
|
1 |
0.73 |
0.35 |
|||
|
– |
0.38–1.39 |
0.14–0.88 |
<0.01 |
||
|
≤4.91 |
4.92–6.24 |
6.25–7.62 |
7.63–9.63 |
≥9.64 |
|
|
1 |
0.70 |
0.76 |
0.32 |
0.38 |
|
|
– |
0.41–1.18 |
0.44–1.29 |
0.17–0.63 |
0.18–0.80 |
<0.004 |
|
c CI = confidence interval. d NS = not significant. |
|||||
(fatal plus nonfatal) myocardial infarctions (47 percent). However, there was a nonstatistically significant increase in fatal myocardial infarctions and no decrease in overall mortality. There were no differences reported between the two doses in the effects noted.
The third trial (GISSI-Prevenzione Investigators, 1999) was designed to determine whether 300 mg/day of all rac-α-tocopherol and 1 g/day of ω-3 polyunsaturated fatty acids (PUFA), alone or in combination, would reduce the risk of death, nonfatal myocardial infarction, and stroke in Italian patients surviving a recent myocardial infarction. After 3.5 years of supplementation, vitamin E had no benefit. Although ω-3 PUFA significantly decreased the rate of death, myocardial infarction, and stroke in these patients, the benefit was the same when the ω-3 PUFA was fed alone or in combination with vitamin E.
A study conducted in 19 countries, the Heart Outcomes Prevention Evaluation (HOPE) Study, evaluated more than 9,000 patients older than 55 years of age with a history of previous ischemic heart disease, stroke, or peripheral artery disease (HOPE Study Investigators, 2000). Similar to the GISSI-Prevenzione Trial, after 4.5 years of supplementation with either 400 IU (268 mg)/day of RRR-α-tocopherol or a placebo, vitamin E had a neutral effect on total mortality, cardiovascular death, myocardial infarction, or stroke. This study is continuing to determine whether any benefit of vitamin E in preventing cardiovascular disease outcomes or cancer will emerge after a longer duration of follow-up.
The discordant results of these four trials may be related to the different doses of vitamin E that were used, as it has been demonstrated that the effectiveness of vitamin E in protecting circulating LDL against ex vivo oxidation depends on both dose and experimental design. Some protection has been observed at doses as low as 25 IU/day (Princen et al., 1995), but a maximum degree of protection requires dosages greater than 200 IU/day (Jialal et al., 1995). At the ATBC Study dose of 50 mg/day, there is some protection, but it is minimal. However, at the GISSI Prevenzione trial dose of 300 mg/day and the HOPE Study dose of 400 IU (268 mg)/day, protection was neutral. Another possible difference between the four trials is that the coronary artery lesions in the Finnish smokers, Italians, and HOPE participants may have been much further advanced than those in the British population studied.
A smaller trial examined the effects of all rac-α-tocopherol supplementation (1,200 IU/day) for 4 months on re-stenosis after angioplasty (DeMaio et al., 1992) and found a small nonstatistically significant reduction in the treated group.
Summary. The hypothesis that reactive oxygen species (ROS) and reactive nitrogen species (RNS) play a role in atherosclerosis rests on a solid basic science foundation and is strongly supported by studies in animal models. At the clinical level, a variety of correlational studies and studies of biochemical markers are consistent with the hypothesis. However, only four published, large-scale, randomized, double-blind clinical intervention studies have tested the ability of vitamin E to prevent myocardial infarction. One of these, a secondary prevention trial supplementing with 400 or 800 IU (268 or 567 mg)/day of RRR-α-tocopherol, was strongly positive (Stephens et al., 1996). The other three, one carried out in a group of high-risk cigarette smokers using 50 mg/day of all rac-α-tocopherol (ATBC Cancer Prevention Study Group, 1994) and two carried out
in high-risk cardiovascular patients supplemented with 300 mg/day of all rac-α-tocopherol (GISSI-Prevenzione Investigators, 1999) and 400 IU (268 mg)/day of RRR-α-tocopherol (HOPE Study Investigators, 2000), were neutral. As of this date there are insufficient data on which to base a recommendation of supplemental vitamin E as a heart disease preventative for the general population.
Diabetes Mellitus
Since cardiovascular complications account for the major causes of death in diabetes mellitus, it has been suggested that similar oxidative processes associated with cardiovascular disease may play a role in this chronic disease.
Oxidative Stress. It has been proposed that the development of the complications of diabetes mellitus may be linked to oxidative stress and therefore might be amenable to treatment with anti-oxidants (Baynes, 1991; Mullarkey et al., 1990; Semenkovich and Heinecke, 1997). Supplementation of either diabetic or nondiabetic subjects with α-tocopherol decreases the susceptibility of their LDL to ex vivo oxidation (Fuller et al., 1996; Reaven et al., 1995), but this treatment does not change blood glucose levels. Ceriello et al. (1991), using 600 and 1,200 mg/day of α-tocopherol, also observed decreases in labile hemoglobin Al (HbAl) and plasma glycosylated proteins. While Jain et al. (1996a) found a decrease in glycosylated hemoglobin with α-tocopherol supplementation at a relatively low dose (100 IU/day), Reaven et al. (1995) using a much larger dose (1,600 IU/day of α-tocopherol) found no effects on glycosylated hemoglobin or other glycosylated plasma proteins. Paolisso et al. (1993), using 900 mg/day of α-tocopherol, reported minimal, but statistically significant, improvements in control of blood glucose. The reason for the above discordance in results is not apparent.
Vitamin E treatment has been reported to decrease TBARS reactivity in plasma of patients with diabetes, but this reaction is not highly specific to vitamin E (Jain et al., 1996b). Davi et al. (1999) did a comprehensive study using the urinary excretion of F2-isoprostanes (8-iso-prostaglandin F2) as an indicator of oxidative stress. They found a highly significant increase in F2-isoprostane excretion in diabetic subjects, and the level of excretion correlated inversely with the degree of control of blood glucose. When the subjects were supplemented with α-tocopherol acetate (600 mg/day for 14 days), they reported a statistically significant reduction (37 percent) in F2-isoprostane excretion and also in the urinary
excretion of 11-dehydrothromboxane B2, the latter being an indicator of platelet activation.
Platelet Hyperactivity. Several studies have confirmed an increased tendency for aggregation of platelets from diabetic subjects, linking the tendency to increased thromboxane production and showing that prior treatment with α-tocopherol can ameliorate the increased tendency for platelet aggregation (Colette et al., 1988; Gisinger et al., 1988; Jain et al., 1998; Kunisaki et al., 1990). However, no clinical intervention trials have tested directly whether antioxidants can decrease the incidence of thrombosis in vivo.
Diabetic Neuropathy. Tutuncu et al. (1998) studied 21 subjects with type II diabetes and neuropathy, who were randomly assigned to receive either 900 mg/day of α-tocopherol or a placebo for 6 months. Although fasting and postprandial glucose were unchanged, nerve conduction velocity in the median motor nerve fibers and tibial motor nerve distal latency improved significantly with vitamin E treatment. The authors concluded that further studies with a larger number of patients for longer periods of time are needed.
Summary. The available data strongly suggest that individuals with diabetes are subject to increased oxidative stress. However, no clinical intervention trials have tested directly whether vitamin E can ameliorate the complications of diabetes mellitus. A gap remains between the effects of vitamin E treatment on biochemical markers of oxidative stress, clinical efficacy, and validation of a relationship between biomarkers and clinical outcomes. Studies in humans show that lipid and lipoprotein oxidation proceed more rapidly in patients with diabetes than in nondiabetic people and that treatment with vitamin E can partially reverse this process (Reaven, 1995; Yoshida et al., 1997). In theory then, intervention with vitamin E therapy to inhibit atherogenesis might be more effective in individual diabetics than in nondiabetics. However, as of this date there are insufficient data on which to base a recommendation of supplemental vitamin E in diabetics.
Cancer
Cancer is believed to develop as the result of an accumulation of mutations that are unrepaired. DNA is constantly undergoing damage due to interaction with free radicals, and therefore one mecha-
nism by which vitamin E might inhibit cancer formation is by quenching these free radicals. An additional vitamin E chemoprevention mechanism that has been proposed is an effect on the immune system. Many compounds, including vitamin E, have been proposed as anticarcinogens (Ames et al., 1995). Observational Epidemiological Studies. Epidemiological evidence for an association between vitamin E and cancer risk is limited. An analysis of vitamin E intake and lung cancer in the NHANES I Epidemiological Follow-up Study (Yong et al., 1997) showed a significant inverse association among current smokers in the lowest tertile of pack-years of smoking. A follow-up prospective cohort study found a weak inverse association between prediagnostic serum vitamin E levels and the incidence of lung cancer (Comstock et al., 1997).
A prospective cohort study in the Netherlands found no association between vitamin E intake and the incidence of breast cancer (Verhoeven et al., 1997). Similarly, a recent analysis from the Breast Cancer Serum Bank cohort study found no association of serum vitamin E with breast cancer risk (Dorgan et al., 1998). A multi-centered European case-control study of postmenopausal breast cancer found no relation between subcutaneous adipose tissue α-tocopherol levels and breast cancer risk (van ‘t Veer et al., 1996).
No association between dietary vitamin E and prostate cancer was found in a large case-control study in Sweden (Andersson et al., 1996). An inverse association between serum vitamin E levels in smokers and prostate cancer was found in a prospective cohort study in Switzerland (Eichholzer et al., 1996); however, earlier cohort studies reported no association of vitamin E with this cancer (Comstock et al., 1992; Knekt et al., 1988).
Intervention Trials. In an intervention trial in Finland among men who were heavy smokers, α-tocopherol supplements (50 mg/day) had no effect on risk for lung cancer, the primary endpoint of the study. However, a significant 34 percent lower incidence of prostate cancer was seen in the men who received this supplement (ATBC Cancer Prevention Study Group, 1994; Heinonen et al., 1998). Two small, short-term intervention trials found no effect of α-tocopherol supplementation on mammary dysplasia (London et al., 1985) or benign breast disease (Ernster et al., 1985). Several trials with vitamin E to prevent the recurrence of colorectal adenomatous polyps have been reported, but none found a beneficial effect (Chen et al.,
1988; DeCosse et al., 1989; Greenberg et al., 1994; Hofstad et al., 1998; McKeown-Eyssen et al., 1988).
Summary. Overall, the epidemiological evidence for an effect of vitamin E on cancer risk is weaker than that for vitamin E and cardiovascular disease. Observational epidemiological studies provide only limited evidence for a protective association and only for some cancer sites. At present, the data from intervention trials are most suggestive for the ability of vitamin E to prevent prostate cancer, but only a single trial has yet been reported, and prostate cancer was not the primary endpoint of that study.
Immune Function
It has been established that several aspects of immune function decline with increasing age (Bendich, 1994). Moreover, supplementation with vitamin E is able to reverse these deficits in some individuals. Meydani et al. (1997) studied a total of 88 free-living, apparently healthy subjects at least 65 years of age, who were randomly assigned to a placebo group or to groups consuming 60, 200, or 800 mg/day of vitamin E for 235 days. Subjects in the upper tertile of serum α-tocopherol concentrations (greater than 48.4 µmol/L [2.08 mg/dL] or approximately twice normal values) after supplementation with 200 or 800 mg/day of vitamin E had higher antibody responses to hepatitis B vaccine and delayed-type hypersensitivity (DTH) skin response. The 200-mg/day group also had a significant increase in antibody titer to tetanus vaccine. Recently, Pallast et al. (1999) reported that supplementation with 100 mg/day of vitamin E for 6 months may improve cellular immune function in apparently healthy elderly, but that the effect may be more pronounced in certain subgroups such as those who were physically less active or those with low baseline DTH reactivity.
Five subjects with tropical sprue for 8 to 10 years were found to have an abnormal delayed hypersensitivity response as well (Ghalaut al., 1995). Moreover, their plasma vitamin E concentrations were approximately one-tenth of normal, and the subjects had a sensory neuropathy characteristic of vitamin E deficiency. Parenteral vitamin E therapy increased serum vitamin E concentrations to normal and improved neurological responses and response to the immune function skin test, suggesting that vitamin E may be important in immune function.
Whether or not increases in vitamin E intake have any effect on immune function in younger populations remains uncertain. How-
ever, the evidence is strong enough to warrant continued investigation.
Cataracts
There is a sound biochemical basis for the notion that the accumulation of damaged proteins in the lens leads to cataract formation and that free-radical damage contributes to this protein damage (Taylor, 1993). Studies in experimental animals show that antioxidant vitamins, including vitamin E, can protect against lens damage (Jacques et al., 1994).
At the epidemiological level, there have been nine studies relating vitamin E status to risk of at least one type of cataract. Five reported a protective association (Jacques and Chylack, 1991; Knekt et al., 1992; Leske et al., 1991; Robertson et al., 1989; Vitale et al., 1993), while four reported no association (Hankinson et al., 1992; Mares-Perlman et al, 1994a,b; Mohan et al., 1989).
Only one intervention study has been carried out to test the effects of α-tocopherol alone on the prevalence of cataracts (Teikari et al., 1998). A subgroup of men participating in the Finnish ATBC study were examined at the end of that study for cataracts. There were no differences in the prevalence of nuclear, cortical, or posterior subcapsular cataracts between control subjects and those taking 50 mg/day of α-tocopherol.
Central Nervous System Disorders
The most characteristic manifestation of vitamin E deficiency in humans is neuropathy affecting both the central and the peripheral nervous systems, particularly sensory axons (Sokol, 1988). The neuropathology associated with frank vitamin E deficiency has been discussed above. The discussion that follows focuses on neurological diseases in which free-radical damage has been proposed to play a role and in which vitamin E might therefore play a protective role.
Parkinson's Disease. Parkinson's disease is characterized by dopaminergic cell death in the substantia nigra. Reported local changes in the substantia nigra compatible with a role for oxidative stress in Parkinson's disease include signs of increases in lipid peroxidation, increases in iron concentration, and decreases in some of the antioxidant defense mechanisms (Muller, 1994). However, a placebo-controlled, double-blind study of 800 patients given 2,000 IU/day of all rac-α-tocopherol failed to show any beneficial effect (Parkin-
son Study Group, 1993). Follow-up publications reported again that α-tocopherol had no benefit (Shoulson, 1998) and had no effect on mortality (Parkinson Study Group, 1998). This did not appear to be a result of poor compliance because increases in vitamin E in cerebrospinal fluid in response to the supplement were reported (Vatassery et al., 1998).
Alzheimer's Disease and Down's Syndrome. Alzheimer's disease is a neurodegenerative disorder that appears to have an oxidative stress component; it is not clear if this is a cause or a consequence of the disease. The disease may be potentiated by an accumulation of redox-active metals (Cornett et al., 1998), especially iron (Smith et al., 1997). Additionally, amyloid β-peptide is a key factor in the neurotoxicity of Alzheimer's disease because it can initiate protein oxidation and lipid peroxidation (Keller et al., 1997), eventually leading to neuronal cell death. The free-radical dependence of β-amyloid-associated toxicity was confirmed by the ability of vitamin E to prevent the toxic effects of amyloid β-peptide in vitro (Subramaniam et al., 1998). These data are compatible with an etiology that includes oxidative damage, but other hypotheses are possible.
In a 2-year, double-blind, placebo-controlled, randomized, multi-center trial in 341 patients with moderately severe impairment from Alzheimer 's disease, treatment with all rac-α-tocopherol (2,000 IU/day) significantly slowed the progression of disease (Sano et al., 1997).
A case can be made for a link between oxidative stress and neuropathology in Alzheimer's disease and Down's syndrome (Muller, 1994). In individuals dying from either disease, abnormalities in brain histology are remarkably similar. Down's syndrome is due to trisomy of chromosome 21, which carries the gene for superoxide dismutase (SOD). Interestingly, overexpression of human SOD in transgenic mice is associated with increased lipid peroxidation in the brain (Ceballos-Picot et al., 1991), perhaps secondary to SOD-induced conversion of the superoxide anion to hydrogen peroxide and water. Although these results are promising, it is still too early to draw any conclusions about the usefulness of vitamin E in Alzheimer's disease and Down's syndrome.
Tardive Dyskinesia (TD). TD is a neurologic disorder that develops in about 20 percent of patients treated long term with neuroleptic drugs. These drugs increase the turnover of brain catecholamines, particularly the neurotransmitter dopamine, and these are compounds that can give rise to ROS. TD is characterized by a
variety of involuntary movements, especially of the face. It has been reported that the cerebrospinal fluid of patients with TD contains higher-than-normal concentrations of lipid peroxidation products (Lohr et al., 1990), and more recently, plasma also was found to have lipid peroxidation products (Brown et al., 1998). However, a causal relationship between these indicators of oxidative stress and the incidence or severity of tardive dyskinesia has not been established.
Some have reported short-term supplementation of TD patients with vitamin E (Egan et al., 1992; Elkashef et al., 1990; Lohr et al., 1987). The beneficial effects were minor, mostly limited to patients with recent onset of the disease, and the number of subjects was very small. Recently, in 40 patients who were supplemented with 1,600 IU/day of α-tocopherol or placebo for up to 36 weeks, there was a significant difference in mean Abnormal Involuntary Movements Scale scores, in those receiving vitamin E after 10 weeks of treatment (Adler et al., 1998).
Summary
A large number of studies have been carried out in the past decade that directly or indirectly concern the relationship between vitamin E intake and chronic disease. Among the effects of vitamin E intakes from supplements are inhibition of LDL oxidation both in vitro and in vivo; inhibition of smooth muscle cell proliferation through inhibition of protein kinase C; inhibition of platelet adhesion, aggregation, and platelet release reactions; and inhibition of plasma generation of thrombin. In addition, supplemental intakes of vitamin E decrease monocyte adhesion to endothelium, decrease monocyte superoxide production, potentiate the synthesis of prostacyclin, upregulate the expression of phospholipase A2 and cyclooxygenase, and inhibit the expression of ICAM-1 and VCAM-1 induced by exposure to ox LDL. Many of these effects have been shown only in tissue culture and have not been studied in vivo. All of these actions could have an influence on health and the development of chronic disease. Some of these effects appear to be independent of the antioxidant properties of vitamin E. Thus, it must be recognized that consumption of large quantities of vitamin E will lead to multiple metabolic and cellular changes in humans. An important question is whether the net result of these changes will be beneficial when large amounts of vitamin E are consumed on a long-term basis.
Clinical trials are currently under way to determine whether high
intakes of vitamin E will reduce the risk for certain diseases. Still, even a positive outcome of these trials may not necessarily lead to a change in recommended individual intakes for the whole population. These trials generally are targeting groups at high risk for particular diseases. If the results of these studies are positive, it is likely that initial recommendations for higher intakes will be limited in their application to high-risk populations. Because of the myriad of actions of high doses of vitamin E, recommendations of higher intakes for the general population undoubtedly will require extensive investigation of the long-term consequences of the multiple metabolic and cellular modifications.
FACTORS AFFECTING THE VITAMIN E REQUIREMENT
Bioavailability
Most dietary vitamin E is found in food that contains fat. It is clear that vitamin E absorption requires micelle formation and chylomicron secretion by the intestine (Muller et al, 1974), although the optimal amount of fat to enhance vitamin E absorption has not been reported. This is probably a more important issue for vitamin E supplement users than for nonsupplement users where all of the vitamin E is in a dietary fat-rich environment.
Nutrient-Nutrient Interactions
Antioxidant Interactions
When vitamin E intercepts a radical, a tocopheroxyl radical is formed (Burton and Ingold, 1981). This radical can be reduced by ascorbic acid or other reducing agents (Doba et al., 1985; Niki et al., 1982), thereby oxidizing the latter and returning vitamin E to its reduced state.
The ability of one antioxidant to regenerate another oxidized species is dependent on the redox potential of the antioxidant (Buettner, 1993). Biologically relevant electron donors that have been shown to regenerate α-tocopherol effectively from the α-tocopheroxyl radical include vitamin C (McCay, 1985), glutathione (Niki, 1987), and ubiquinols (Stoyanovsky et al., 1995). (For further information see “Nutrient-Nutrient Interactions” in Chapter 5.) Cellular redox cycling is coupled with the energy status of the organism. Thus, it can be expected that during prolonged energy deficit or inadequate production of nicotinamide adenine dinucleotide
(NADH), nicotinamide adenine dinucleotide phosphate (NADPH) or glutathione [GSSG] reductase due to dietary deficiencies of niacin (component of NADP or NADPH) or riboflavin (cofactor for GSSG reductase), the ability of the organism to produce sufficient reducing equivalents for recycling oxidized products will be compromised. Conversely, intakes of plant phenolic compounds and flavonoids may add to the total antioxidant pool (de Vries et al., 1998; Manach et al., 1998). The extent, involvement, and contribution of these newer compounds which may be acting as antioxidants to the redox cycling reactions in vitro and in vivo remain to be determined.
The regeneration of α-tocopherol from the α-tocopheroxyl radical may be faster than the further oxidation of the α-tocopheroxyl radical. The extent to which vitamin E is recycled in humans and which antioxidant species are preferentially used for recycling are not known. In human platelet homogenates, distinct chemical and enzymatic pathways for the regeneration of oxidized tocopherol, afforded by vitamin C and glutathione, have been identified (Chan et al., 1991). A metabolic study in humans designed to demonstrate the occurrence of vitamin E recycling by vitamin C had limitations since the body pools of vitamin C and E cannot be totally depleted (Jacob et al., 1996). Although the data were inconclusive, the authors did comment that there is “a trend towards sparing of tissue tocopherol by vitamin C” and that more study was warranted. This is an important area of investigation because the tocopheroxyl radical has been shown in vitro to increase lipid peroxidation in the absence of water-soluble antioxidants, and it has been proposed that this mechanism may be an important factor in potentiating in vivo atherogenesis (Stocker, 1999; Upston et al., 1999). However, there are still no data to determine whether this mechanism is operative in vivo.
Dietary Polyunsaturated Fat
Vitamin E requirements have been reported to increase when intakes of polyunsaturated fatty acids (PUFAs) are increased (Dam, 1962; Horwitt, 1962). Based on these data it was suggested that a ratio of at least 0.4 mg (1 µmol) α-tocopherol per gram of PUFA should be consumed by adults (Bieri and Evarts, 1973; Horwitt, 1974; Witting and Lee, 1975). However, the method of determining the vitamin E requirement generated by PUFA intakes is not universally accepted because the amount of vitamin E required to stabilize PUFAs in tissues is influenced to a greater extent by their degree of
unsaturation than by their mass (Draper, 1993). Moreover, PUFAs are not deposited in the tissues in the same proportions that they occur in the diet. Finally, dietary PUFAs are modified by elongation and desaturation and are catabolized to various degrees depending on energy status (Jones and Kubow, 1999).
There are also data to suggest that low-density lipoprotein (LDL) oxidation susceptibility in vitro is dependent upon its PUFA content. A 10 percent PUFA diet with 34 percent of calories from fat increased LDL oxidation susceptibility compared to a 19 percent monosaturated fatty acid (MUFA) diet with 40 percent of the calories from fat, without changing the α-tocopherol content of the LDL (Schwab et al., 1998a). In a double-blind crossover trial in 48 postmenopausal women, supplementation with fish oil increased LDL oxidation susceptibility, while supplementation with both fish oil and α-tocopheryl acetate significantly decreased it (Wander et al., 1996).
The effect of the fatty acid composition of reduced-fat diets on the in vitro oxidation of LDL was also examined in 14 moderately hypercholesterolemic (LDL greater than 3.36 mmol/L) female and male subjects (aged 44 to 78 years). Each subject consumed each of five reduced-fat diets (30 percent of energy from total fat, 17 percent from protein, and 53 percent from carbohydrate) which included 20 percent of energy from beef tallow, canola oil, corn oil, olive oil, or rice bran oil for a period of 32 days. When the data from all dietary phases were pooled, LDL α-tocopherol levels and plasma 18:1/18:2 ratios were positively related to LDL oxidation resistance (Schwab et al., 1998b).
Although it is clear that the relationship between dietary PUFA and vitamin E needs is not simple, high PUFA intakes should certainly be accompanied by increased vitamin E intakes.
FINDINGS BY LIFE STAGE AND GENDER GROUP
Infants Ages 0 through 12 Months
Method Used to Set the Adequate Intake
No functional criteria of vitamin E status have been demonstrated which reflect response to dietary intake in infants. Thus recommended intakes of vitamin E are based on an Adequate Intake (AI) that reflects a calculated mean vitamin E intake of infants fed principally with human milk.
Human Milk. Human milk is recognized as the optimal milk source for infants throughout at least the first year of life and is recommended as the sole nutritional milk source for infants during the first 4 to 6 months of life (IOM, 1991). Therefore, determination of the AI for vitamin E for infants is based on data from infants fed human milk as the principal fluid during the periods 0 through 6 and 7 through 12 months of age. The AI is set for ages 0 through 6 months at the mean value calculated from studies in which the intake of human milk was measured by test weighing volume, and the average concentration of the nutrient in human milk was determined using average values from several reported studies.
In general, the total vitamin E content of colostrum is high (average content ranges from 6.8–23 mg/L) (Ali et al., 1986; Boersma et al., 1991; Chappell et al., 1985; Jansson et al., 1981; Kobayashi et al., 1975; Thomas et al., 1981); the concentration decreases in transitional milk, sampled at 6–10 days, and further decreases in mature milk, as shown in Table 6-4. The range of vitamin E concentrations in mature human milk after approximately 30 days of lactation varies from 1.8 mg/L (Kobayashi et al., 1975) to approximately 9 mg/L (Thomas et al., 1981).
Vitamin E concentrations are most accurately analyzed by high-performance liquid chromatography (HPLC). Therefore, reports of vitamin E concentrations in human milk utilizing non-HPLC methods (Ali et al., 1986; Kobayashi et al., 1975; and Thomas et al., 1981) are not used in this assessment. HPLC measurements of the average α-tocopherol content of mature human milk have yielded values of 2.3 (Lammi-Keefe et al., 1990), 3.5 (Chappell et al., 1985), 3.7 ± 0.6 (SD) (Lammi-Keefe et al., 1985), 7.2 ± 3.9 (SD) (Jansson et al., 1981), and 8 ± 5 mg/L (SD) (Boersma et al., 1991). The latter authors reported that the α-tocopherol amounts in human milk were nearly identical to the α-tocopherol equivalent amounts.
Data suggest that there is no difference in milk vitamin E content between mothers with preterm and term births (Lammi-Keefe et al., 1985; Thomas et al., 1981). In addition, there is no significant diurnal variation in the vitamin E content of human milk (Chappell et al., 1985).
Ages 0 through 6 Months. This recommendation is based on the mean volume of human milk intake of 0.78 L/day (Allen et al., 1991; Butte et al., 1984; Heinig et al., 1993), consumed by infants ages 0 through 6 months. The average concentration of α-tocopherol in human milk is approximately 4.9 mg/L as assessed by HPLC in the five studies cited above. If this amount is multiplied by the aver-
TABLE 6-4 Vitamin E Content in Human Milk
|
Reference |
Vitamin E Content in Milk (mg/L ± SDa) |
Stage of Lactation |
|
Kobayashi et al., 1975 |
7.8 (total tocopherol) 2.0 (total tocopherol) 1.8 (total tocopherol) |
Days 2–7 Days 10–15 Days 30–39 |
|
Jansson et al., 1981 |
23.0 ± 12.6 (α-tocopherol) 10.4 ± 4.2 (α-tocopherol) 7.2 ± 3.9 (α-tocopherol) |
Day 4 Days 6–10 Day 12–5th mo |
|
Thomas et al., 1981c |
20.4 ± 7.9 13.4 ± 3.9 10.2 ± 3.4 8.8 ± 2.2 9.5 ± 3.6 8.5 ± 3.6 |
Day 3 Day 9 Day 15 Day 21 Day 27 Day 33 |
|
Chappell et al., 1985c |
15 7 5 3.5 3 |
Days 1–6 Day 7 2 wk 4 wk 5 wk |
|
Lammi-Keefe et al., 1985 |
6.7 ± 0.5 (α-tocopherol) 4.0 ± 0.6 (α-tocopherol) 3.7 ± 0.5 (α-tocopherol) 3.7 ± 0.6 (α-tocopherol) |
2 wk 6 wk 12 wk 16 wk |
|
Ali et al., 1986 |
6.8 6.5 1.0–5.8 |
Day 1 Day 12 Days 1–12 |
|
Lammi-Keefe et al., 1990 |
2.3 (α-tocopherol) 0.85 (γ-tocopherol) |
8 wk |
|
Boersma et al., 1991 |
22 ± 14 (α-TEd) 14 ± 8 (α-TE) 8 ± 5 (α-TE) |
Colostrum (0–4 d) Transitional (5–9 d) Mature (10 and 30 d) |
|
a SD = standard deviation. b HPLC = high-performance liquid chromatography. |
||
|
Maternal Vitamin E Intake (mg/d) |
Methods |
|
Not reported |
n = 18 samples Different individuals were sampled at each stage of lactation Thin-layer chromatography methods |
|
Not reported |
n = 34 donors Different individuals were sampled at each stage of lactation Milk was collected and stored at donor's home HPLCb methods |
|
17.5 |
n = 10 mothers with term births Same individuals were sampled at each stage of lactation |
|
19.2 |
Non-HPLC methods Used diet records Found no difference in milk vitamin E content between mothers with preterm and term births |
|
16.7 |
Found that supplement use had no effect on milk content |
|
15 |
n = 12 women with term births Same individuals were sampled at each stage of lactation HPLC methods Values are approximated from graph |
|
Not reported |
No description of the study population Same individuals were sampled at each stage of lactation HPLC methods |
|
Not reported |
n = 1,034 Malaysian women Non-HPLC methods Found that the ratio of milk vitamin E to total lipids dropped steadily over the 12-d period |
|
Not reported |
HPLC methods n = 6 breast-feeding mothers 5 samples from each woman were taken in a single day at different times. Found no significant variation in vitamin E content during the day. There was considerable yet nonsignificant variation in the total lipid content attributed to individuality and within-day variation |
|
Not reported |
n = 13 well-nourished, healthy, breast-feeding mothers in St. Lucia, West Indies and their term infants Same individuals were sampled at each stage of lactation HPLC methods Also measured α-, β-, and γ-tocopherol; α-tocopherol levels were nearly identical to α-TE levels |
|
c Lack of correlation between maternal intake and human milk concentration. d TE = tocopherol equivalent. |
|
age intake of human milk at 0 through 6 months, the AI would be 4.9 mg/L × 0.78 L/day = 3.8 mg/day of α-tocopherol. The AI is rounded up to 4 mg (9.3 µmol)/day of α-tocopherol.
This value is in the lower range of the Third National Health and Nutrition Examination Survey (NHANES III) data for intakes in this age group as shown in Appendix Table C-3. The mean of the reported intakes of infants 0 through 6 months of age was 12.3 mg (28.6 µmol)/day of α-tocopherol equivalents. The range of the 5th to the 95th percentile was 8.8–16.1 mg (20.5–37.4 µmol)/day. The mean reported intake is probably higher than that calculated for infants receiving solely human milk, because the NHANES III data include milk from infants fed formula which has a vitamin E content of approximately 7 mg/L of α-tocopherol (Thomas et al., 1981). However, this AI is comparable to vitamin E intakes from human milk-fed German infants whose median intakes of vitamin E were 2 mg/day at 3 months of age and 3 mg/day at 6 months of age (Alexy et al., 1999). Based on data from Boersma et al. (1991), it can be assumed that almost all of the α-tocopherol equivalents in human milk are from α-tocopherol.
Ages 7 through 12 Months. When the method described in Chapter 3 is used to extrapolate from the AI for infants ages 0 through 6 months receiving human milk and rounding, the AI for the older infants is rounded up to 5 mg (11.6 µmol)/day α-tocopherol.
The NHANES III data for infants 7 through 12 months of age range from 4.1 to 14.8 mg (11.2 to 34.4 µmol)/day, mean 8.5 mg (19.8 µmol)/day α-tocopherol equivalents (Appendix Table C-3).
Vitamin E AI Summary, Ages 0 through 12 Months
|
AI for Infants |
||
|
0–6 months |
4 mg (9.3 µmol)/day of α-tocopherol |
≈0.6 mg/kg |
|
7–12 months |
5 mg (11.6 µmol)/day of α-tocopherol |
≈0.6 mg/kg |
Children and Adolescents Ages 1 through 18 Years
Evidence Considered in Estimating the Average Requirement
No data were found on which to base an Estimated Average Requirement (EAR) for vitamin E for apparently healthy children or adolescents. In the absence of additional information, EARs and Recommended Dietary Allowances (RDAs) for children and adolescents have been estimated using the metabolic formulas described
in Chapter 3, which are extrapolated from adult values based on lean body mass and need for growth.
Vitamin E EAR and RDA Summary, Ages 1 through 18 Years
|
EAR for Children |
|
|
1–3 years |
5 mg (11.6 µmol)/day of α-tocopherol |
|
4–8 years |
6 mg (14.0 µmol)/day of α-tocopherol |
|
EAR for Boys |
|
|
9–13 years |
9 mg (20.9 µmol)/day of α-tocopherol |
|
14–18 years |
12 mg (27.9 µmol)/day of α-tocopherol |
|
EAR for Girls |
|
|
9–13 years |
9 mg (20.9 µmol)/day of α-tocopherol |
|
14–18 years |
12 mg (27.9 µmol)/day of α-tocopherol |
The RDA for vitamin E is set by assuming a coefficient of variation (CV) of 10 percent (see Chapter 1) because information is not available on the standard deviation of the requirement for vitamin E; the RDA is defined as equal to the EAR plus twice the assumed CV to cover the needs of 97 to 98 percent of the individuals in the group (therefore, for vitamin E the RDA is 120 percent of the EAR). The calculated RDA in milligrams is rounded.
|
RDA for Children |
|
|
1–3 years |
6 mg (13.9 µmol)/day of α-tocopherol |
|
4–8 years |
7 mg (16.3 µmol)/day of α-tocopherol |
|
RDA for Boys |
|
|
9–13 years |
11 mg (25.6 µmol)/day of α-tocopherol |
|
14–18 years |
15 mg (34.9 µmol)/day of α-tocopherol |
|
RDA for Girls |
|
|
9–13 years |
11mg (25.6 µmol)/day of α-tocopherol |
|
14–18 years |
15 mg (34.9 µmol)/day of α-tocopherol |
Adults Ages 19 through 50 Years
Evidence Considered in Estimating the Average Requirement
As stated earlier, although it is known that humans require vitamin E (Cavalier et al., 1998; Hassan et al., 1966; Oski and Barness, 1967; Sokol et al., 1984), overt vitamin E deficiency (characterized by sensory neuropathy, increased erythrocyte fragility, and increased ethane and pentane production) is rare in the United States and
Canada. Thus, current dietary patterns appear to provide sufficient vitamin E to prevent deficiency symptoms such as peripheral neuropathy. However, since vitamin E intakes are underestimated, particularly with respect to estimates of intake associated with fats (see later section “ Underreporting in Dietary Surveys ”), an AI could not be reliably determined from the available data on intakes.
Data on human experimental vitamin E deficiency are very limited but do provide some guidance in estimating a requirement. The values recommended here are based largely on studies of induced vitamin E deficiency in humans and the correlation with hydrogen peroxide-induced erythrocyte lysis and plasma α-tocopherol concentrations.
Only one study has been carried out in apparently healthy human adults who were depleted of vitamin E over 6 years and then repleted (Horwitt, 1960, 1962; Horwitt et al., 1956). In response to vitamin E deficiency, increased erythrocyte fragility (as assessed by an in vitro test of hydrogen peroxide-induced hemolysis) was observed, which was reversed by vitamin E supplementation.
The hydrogen peroxide-induced hemolysis test has drawbacks in that it is critically dependent upon the concentration of hydrogen peroxide used, the erythrocyte content of catalase and antioxidants, and the precise incubation conditions. Nonetheless, it is one of the few tests in which the marker (erythrocyte lysis) has been correlated with a health deficit (decreased erythrocyte survival) that has been shown to be corrected by supplemental vitamin E. Therefore, the data from this study were used to estimate intakes for α-tocopherol requirements.
It is recognized that there are great uncertainties in the data utilized to set the α-tocopherol requirements. However, in the absence of other scientifically sound data, hydrogen peroxide-induced hemolysis is the best marker at the present time. It should be emphasized that research is urgently needed to explore the use of other biomarkers to assess vitamin E requirements.
Plasma α-Tocopherol Concentrations and Hydrogen Peroxide-Induced Hemolysis
The requirements for vitamin E intakes are therefore based primarily on studies in which plasma α-tocopherol concentrations and corresponding hydrogen peroxide-induced erythrocyte lysis were determined (Horwitt, 1960, 1962, 1974; Horwitt et al., 1956, 1963, 1972). Vitamin E depletion in 19 normal, adult men was studied by feeding them a 2,200-kcal diet containing 3 mg (7 µmol)/day (range
2 to 4 mg [4.7 to 9.3 µmol]) of α-tocopherol and 55 g/day of fat (30 g from vitamin E-free lard) for 2.5 years. After the first 2.5 years, serum α-tocopherol levels decreased further when thermally oxidized corn oil with the α-tocopherol removed was substituted for lard. By replacing lard with corn oil, the total intake of polyunsaturated fatty acids (PUFAs) was increased, thereby increasing the oxidant burden on the available vitamin E stores. Subjects were followed on the vitamin E-depleted diet for more than 6 years.
To establish a criterion for estimating the EAR, the biomarker selected was the plasma α-tocopherol concentration that limited hydrogen peroxide-induced hemolysis to 12 percent or less. Differences up to this amount are not significant unless special precautions are taken to age and standardize the hydrogen peroxide solutions (Horwitt et al., 1963). The data in Figure 6-6 comparing long-term vitamin E-depletion in four subjects (depleted for more than 72 months) with six control subjects (Horwitt et al., 1963) show that at some concentration of plasma α-tocopherol between 6 µmol/L (258 µg/dL) and 12 µmol/L (516 µg/dL), an increase in hydrogen peroxide-induced hemolysis above 12 percent was observed in vitro. Averaging the α-tocopherol concentrations in the six subjects with hemolysis values of 12 percent or less in Figure 6-6 results in an average α-tocopherol concentration of 16.2 µmol/L (697 µg/dL). This is higher than the results of Farrell et al. (1977), who suggested that plasma α-tocopherol concentrations of 14 µmol/L (600 µg/dL) are sufficient to prevent hydrogen peroxide-induced hemolysis. Although the exact plasma α-tocopherol concentration that allows hemolysis to take place is unknown, it appeared to be prudent to estimate the lowest known plasma α-tocopherol concentration as that cutoff point where hemolysis would take place in 50 percent of the population. Thus, a plasma concentration of 12 µmol/L (516 µg/dL) was chosen as the concentration of plasma tocopherol associated with normal in vitro hydrogen peroxide-induced hemolysis. Based on NHANES III data (Appendix Table F-2), more than 95 percent of the population surveyed would have plasma concentrations greater than 12 µmol/L (516 µg/dL), thus indicating that the American public is not vitamin E deficient by this criterion.
Plasma α-Tocopherol Repletion
The effect of vitamin E repletion of depleted subjects has been studied. Horwitt (1960) conducted a study in which each subject received a different amount of vitamin E supplement, ranging from
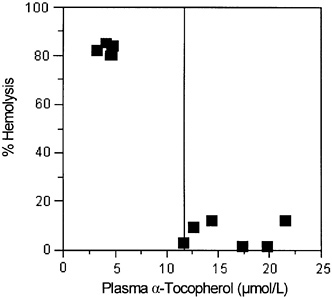
FIGURE 6-6 Relationship of plasma α-tocopherol concentrations and hemolysis in extensively vitamin E-depleted (>72 months) and control subjects.
0 to 320 mg (0 to 744 µmol)/day, for up to 138 days. For the purpose of keeping the various supplemental forms of vitamin E administered in the study equivalent, the amounts of all rac-α-tocopheryl acetate and RRR-α-tocopheryl acetate administered were converted to amounts of 2R-α-tocopherol forms for this analysis (see Table 6-1 for conversions). The criterion for vitamin E adequacy was defined as an intake sufficient to increase plasma α-tocopherol concentration to or above 12 µmol/L (516 µg/dL).
SOURCE: Adapted from Horwitt et al. (1963).
As shown in Figure 6-7 using the data for intakes generated above (Table 6-5), plasma α-tocopherol concentrations were linearly (r2 = 0.947) related to α-tocopherol intakes at intakes below 17 mg (40 µmol)/day. Using the limit of 12 µmol/L (516 µg/dL) plasma α-tocopherol as the criterion for the estimated vitamin E requirement generates a intake of 12 mg (28.2 µmol)/day α-tocopherol as the EAR.
Circulating Lipid Levels
Based on studies in normal and vitamin E-deficient children and adults, Horwitt et al. (1956), Farrell et al. (1982), and Sokol et al.
(1984) concluded that plasma tocopherol concentrations alone may be misleading in assessing human vitamin E status because their data have indicated a dependence of plasma tocopherol concentrations on the amount of circulating lipids. Moreover, Winklhofer-Roob et al. (1997) found that age was a significant predictor of plasma α-tocopherol concentrations in 208 Swiss subjects aged 0.4 to 38.7 years. This apparent relationship was attributed to an age-related increase in serum cholesterol concentrations. Sokol et al. (1993) reported that, because of the extremely high serum lipids in children with cholestasis, a ratio of serum α-tocopherol to serum total lipids of less than 0.6 mg/g indicated vitamin E deficiency, regardless of serum α-tocopherol concentrations.
When evaluating the vitamin E status of an individual, plasma lipid levels should be taken into account because all of the plasma vitamin E is transported in plasma lipoproteins (Traber et al., 1993). In subjects with normal serum lipid concentrations (328 to 573 mg/dL) (Sokol et al., 1984), corrections are not necessary to assess whether α-tocopherol concentrations are within the normal range.
PUFA Intake
As described earlier, high intakes of PUFAs are typically accompanied by increased vitamin E intakes. Using data from NHANES II, Murphy et al. (1990) reported that the mean PUFA intake in the United States was 16.3 g/day for men and 10.8 g/day for women. Based on a ratio of at least 1 µmol (0.4 mg) α-tocopherol per gram of PUFA when the primary dietary PUFA is linoleic acid, as in most U.S. diets (Bieri and Evarts, 1973; Horwitt, 1974; Witting and Lee, 1975), and a mean intake of 16.3 g PUFA, the lower boundary of required α-tocopherol intake is estimated to be 7 mg (16 µmol)/day. Thus, the amount of α-tocopherol required daily based on PUFA intakes would be met by the EAR of 12 mg (28.2 µmol)/day of α-tocopherol.
Vitamin E EAR and RDA Summary, Ages 19 through 50 Years
Based on the criterion of vitamin E intakes sufficient to prevent hydrogen peroxide-induced hemolysis, the data of Horwitt (1960) support an EAR of 12 mg (27.9 µmol) of α-tocopherol. The data were derived from studies in men only, and no similar data are available for women. However, there is no scientific basis for assuming different requirements for men and women, and although body
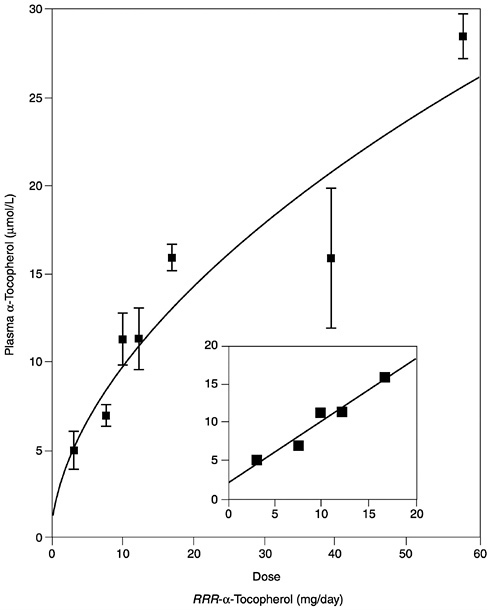
TABLE 6-5 Effect of Vitamin E Supplements on Subjects Who Had Been on Basal Diet for 54 Months
|
Subject |
α-Tocopherol Intake (mg/d) |
Plasma Tocopherol ± Standard Deviationb (µmol/L) |
|
1 |
3.0 |
5.1 ± 1.1 |
|
2 |
7.6a |
7.0 ± 0.6 |
|
3 |
9.8a |
11.4 ± 1.5 |
|
4 |
12.1a |
11.4 ± 1.7 |
|
5 |
16.7a |
16.0 ± 0.7 |
|
6 |
39.4a |
15.9 ± 4.0 |
|
7 |
57.7a |
28.6 ± 1.2 |
|
a Intake was estimated from food and vitamin E supplements using conversion factors from Table 6-1. b Plasma α-tocopherol concentrations were estimated for each individual by averaging the values on days 13, 21, 30, and 138. SOURCE: Adapted from Horwitt (1960). |
||
weights may be greater in men, women have larger fat masses as a percent of body weight, and thus may have similar requirements.
|
EAR for Men |
|
|
19–30 years |
12 mg (27.9 µmol)/day of α-tocopherol |
|
31–50 years |
12 mg (27.9 µmol)/day of α-tocopherol |
|
EAR for Women |
|
|
19–30 years |
12 mg (27.9 µmol)/day of α-tocopherol |
|
31–50 years |
12 mg (27.9 µmol)/day of α-tocopherol |
The RDA for vitamin E is set by assuming a coefficient of variation (CV) of 10 percent (see Chapter 1) because information is not available on the standard deviation of the requirement for vitamin E; the RDA is defined as equal to the EAR plus twice the CV to cover the needs of 97 to 98 percent of the individuals in the group (therefore, for vitamin E the RDA is 120 percent of the EAR). The calculated RDA in milligrams is rounded up.
|
RDA for Men |
|
|
19–30 years |
15 mg (34.9 µmol)/day of α-tocopherol |
|
31–50 years |
15 mg (34.9 µmol)/day of α-tocopherol |
|
RDA for Women |
|
|
19–30 years |
15 mg (34.9 µmol)/day of α-tocopherol |
|
31–50 years |
15 mg (34.9 µmol)/day of α-tocopherol |
Adults Ages 51 Years and Older
Evidence Considered in Estimating the Average Requirement
As discussed earlier, although vitamin E has been hypothesized to prevent myocardial infarction at the clinical level, only one of the four published large-scale, randomized, double-blind clinical secondary intervention studies that tested the ability of vitamin E to do this has been supportive of that hypothesis. This secondary prevention trial using 400 or 800 international units (IU) (268 or 567 mg)/day of RRR-α-tocopherol, was strongly positive (Stephens et al., 1996). The other three, one carried out in a group of high-risk cigarette smokers and using 50 mg/day of all-rac-α-tocopherol (ATBC Cancer Prevention Study Group, 1994) and two carried with groups of high-risk cardiovascular disease patients and using 300 mg/day of all rac-α-tocopherol (GISSI-Prevenzione Investigators, 1999) or 400 IU (268 mg)/day of RRR-α-tocopherol (HOPE Study Investigators, 2000), were neutral, with respect to coronary heart disease.
The limited clinical trial evidence precludes recommendations for higher vitamin E intakes at this time. Thus, adults ages 51 years and older appear to have the same vitamin E requirement as younger adults.
Vitamin E EAR and RDA Summary, Ages 51 Years and Older
There is no evidence that the aging process impairs vitamin E absorption or utilization. Therefore, for the age group 51 years and older an EAR of 12 mg (27.9 µmol)/day of α-tocopherol, the same as younger adults, is warranted.
|
EAR for Men |
|
|
51–70 years |
12 mg (27.9 µmol)/day of α-tocopherol |
|
>70 years |
12 mg (27.9 µmol)/day of α-tocopherol |
|
EAR for Women |
|
|
51-70 years |
12 mg (27.9 µmol)/day of α-tocopherol |
|
>70 years |
12 mg (27.9 µmol)/day of α-tocopherol |
The RDA for vitamin E is set by assuming a coefficient of variation (CV) of 10 percent (see Chapter 1) because information is not available on the standard deviation of the requirement for vitamin E. The RDA is defined as equal to the EAR plus twice the assumed CV to cover the needs of 97 to 98 percent of the individuals in the
group (therefore, for vitamin E the RDA is 120 percent of the EAR). The calculated RDA in milligrams is rounded up.
|
RDA for Men |
|
|
51–70 years |
15 mg (34.9 µmol)/day of α-tocopherol |
|
>70 years |
15 mg (34.9 µmol)/day of α-tocopherol |
|
RDA for Women |
|
|
51–70 years |
15 mg (34.9 µmol)/day of α-tocopherol |
|
>70 years |
15 mg (34.9 µmol)/day of α-tocopherol |
Pregnancy
Evidence Considered in Estimating the Average Requirement
In contrast to the case for most nutrients, the blood concentration of α-tocopherol increases during pregnancy, in parallel with an increase in total lipids (Horwitt et al., 1972). Placental transfer of vitamin E from mother to fetus appears to be relatively constant as pregnancy progresses (Abbasi et al., 1990). Although vitamin E deficiency can occur in premature newborns, precipitating a hemolytic anemia (Oski and Barness, 1967; Ritchie et al., 1968), there are no reports of vitamin E deficiency during pregnancy and no evidence that maternal supplementation with vitamin E would prevent deficiency symptoms in premature offspring. Given the absence of data, it would appear that vitamin E supplementation of pregnant females is unwarranted.
Vitamin E EAR and RDA Summary, Pregnancy
Since there is no evidence at this time that the EAR for women during pregnancy should be increased above the level recommended for women in the nonpregnant state, the EAR for pregnancy is assumed to be the same and thus is 12 mg (27.9 µmol)/day of tocopherol.
|
EAR for Pregnancy |
|
|
14–18 years |
12 mg (27.9 µmol)/day of α-tocopherol |
|
19–30 years |
12 mg (27.9 µmol)/day of α-tocopherol |
|
31–50 years |
12 mg (27.9 µmol)/day of α-tocopherol |
The RDA for vitamin E is set by assuming a coefficient of variation (CV) of 10 percent (see Chapter 1) because information is not available on the standard deviation of the requirement for vitamin E; the RDA is defined as equal to the EAR plus twice the assumed CV
to cover the needs of 97 to 98 percent of the individuals in the group (therefore, for vitamin E the RDA is 120 percent of the EAR). The calculated RDA in milligrams is rounded up.
|
RDA for Pregnancy |
|
|
14–18 years |
15 mg (34.9 µmol)/day of α-tocopherol |
|
19–30 years |
15 mg (34.9 µmol)/day of α-tocopherol |
|
31–50 years |
15 mg (34.9 µmol)/day of α-tocopherol |
Lactation
Evidence Considered in Estimating the Average Requirement
As indicated earlier in the section on infants, the estimated average amount of α-tocopherol secreted daily in human milk in the first 6 months of life is 4 mg (9.3 µmol). Thus, addition of this figure to the EAR for α-tocopherol for women, 12 mg (28.2 µmol)/day, would provide an EAR of 16 mg (37.5 µmol)/day of α-tocopherol in a lactating female.
The EAR is in excess of the median intake of 8.4 mg (19.5 µmol)/day for lactating women reported in the U.S. Department of Agriculture Continuing Survey of Food Intake by Individuals (CSFII) (Appendix Table D-2). Because estimates of vitamin E intake are underreported and vitamin E deficiency in infants receiving human milk is extremely rare, it is logical to postulate that lactating women are consuming more vitamin E than reported and that ingestion of supplements is unnecessary during lactation.
Vitamin E EAR and RDA Summary, Lactation
To estimate the EAR for lactation, the average vitamin E secreted in human milk, 4 mg (9.3 µmol) of α-tocopherol, is added to the EAR for the nonlactating woman, giving an EAR of 16 mg (37.2 µmol)/day of α-tocopherol.
|
EAR for Lactation |
|
|
14–18 years |
16 mg (37.2 µmol)/day of α-tocopherol |
|
19–30 years |
16 mg (37.2 µmol)/day of α-tocopherol |
|
31–50 years |
16 mg (37.2 µmol)/day of α-tocopherol |
The RDA for vitamin E is set by assuming a coefficient of variation (CV) of 10 percent (see Chapter 1) because information is not available on the standard deviation of the requirement for vitamin E; the RDA is defined as equal to the EAR plus twice the assumed CV to cover the needs of 97 to 98 percent of the individuals in the
group (therefore, for vitamin E the RDA is 120 percent of the EAR). The calculated RDA in milligrams is rounded down.
|
RDA for Lactation |
|
|
14–18 years |
19 mg (44.2 µmol)/day of α-tocopherol |
|
19–30 years |
19 mg (44.2 µmol)/day of α-tocopherol |
|
31–50 years |
19 mg (44.2 µmol)/day of α-tocopherol |
Special Considerations
Chronic Diseases
Data related to the effects of vitamin E on morbidity and mortality from chronic disease in the United States and Canada are limited. The evidence is strongest for prevention of coronary heart disease (CHD). However, even for this outcome, four double-blind, place-bo-controlled trials have been reported, and only one of four, the Cambridge Heart Antioxidant Study (CHAOS) (Stephens et al., 1996), with prevention of heart disease as its primary aim, had a positive outcome. Two of the other trials, the GISSI-Prevenzione Trial and the Heart Outcomes Prevention Evaluation (HOPE) Study (GISSI-Prevenzione Investigators, 1999; HOPE Study Investigators, 2000), with prevention of heart disease as their primary aim, had neutral results. Similarly, the fourth trial, the Alpha-Tocopherol Beta-Carotene (ATBC) Cancer Prevention Study (ATBC Cancer Prevention Study Group, 1994), which had lung cancer as its primary outcome, reported no beneficial effect of vitamin E on myocardial infarction rates. Thus, a recommendation of high vitamin E intakes for the general population to decrease CHD risk is considered premature.
Some physicians caring for patients with coronary artery disease are already prescribing vitamin E at doses used in the CHAOS study, 400 or 800 IU (268 or 567 mg)/day of RRR-α-tocopherol. Precisely how vitamin E works at these high doses is not known but could include both antioxidant and nonantioxidant mechanisms. This is an active research area at both the molecular and the clinical levels, and further research is needed.
Currently, a number of other double-blind, placebo-controlled intervention trials of the efficacy of vitamin E to prevent or ameliorate CHD are in progress. If these studies result in positive outcomes, it may become necessary to review the recommendations for vitamin E intakes in some subgroups of the adult populations, especially those in the groups over 50 years of age because increasing age is an important risk factor for heart disease. Although there is a
large and growing body of experimental evidence suggesting that vitamin E supplementation may reduce the risk of some chronic diseases, especially heart disease, the results of the GISSI Prevenzione Trial (GISSI-Prevenzione Investigators, 1999), the Heart Outcomes Prevention Evaluation (HOPE) study (HOPE Study Investigators, 2000), and the Alpha-Tocopherol Beta-Carotene (ATBC) Cancer Prevention Study (ATBC Cancer Prevention Study Group, 1994) preclude recommendations for higher vitamin E intakes at this time.
Exercise
High levels of physical activity and sports might increase oxidative damage and thus increase needs for antioxidants. It is unknown whether or the extent to which increased oxidative damage occurs in physical exercise. However, the Boston Nutritional Status Survey reported that plasma vitamin E concentrations increased slightly with regular exercise in adults 60 years of age and older (Hartz et al., 1992). It is, therefore, not known if any adjustment in vitamin E requirements is needed in response to strenuous or regular exercise.
Extreme Body Size and Composition
Given the minimal data available to develop the EAR, adjusting any recommendations for vitamin E requirements to meet expected needs for individuals with extreme variation for reference body size or composition must await additional data.
Cigarette Smokers
Potentially injurious free radicals are present in cigarette tar and smoke (Church and Pryor, 1985; Pryor and Stone, 1993). In addition, cigarette smokers have increased phagocyte activities (Eiserich et al., 1997). Smokers are therefore under a high and sustained free-radical load, both from cigarette smoke itself and from oxidants produced by activated phagocytes (Cross et al., 1997; Duthie et al., 1991; Eiserich et al., 1995).
Exposure to cigarette smoke damages antioxidant defenses. Low blood levels of vitamin C are a characteristic feature of heavy smokers (Duthie et al., 1995, 1996; Mezzetti et al., 1995; Ross et al., 1995). Cigarette smoke also damages low molecular weight thiols and especially thiol-containing proteins in human plasma (O'Neill et al.,
1994) and white blood cells (Tsuchiya et al., 1992). Plasma vitamin E is not routinely depleted in cigarette smokers relative to nonsmokers. However, vitamin E supplementation of smokers has been shown to reduce indicators of lipid peroxidation (Mezzetti et al., 1995; Morrow et al., 1995; Pratico et al., 1998; Reilly et al., 1996), suggesting that plasma vitamin E may not be indicative of tissue stores.
It is unknown if any adjustment in vitamin E requirements is needed in those who smoke or are routinely exposed to smoke.
INTAKE OF VITAMIN E
As stated earlier, the Dietary Reference Intakes (DRIs) for vitamin E are based on α-tocopherol only and do not include amounts obtained from the other seven naturally occurring forms historically called vitamin E (β-, γ-, δ-tocopherol and the four tocotrienols). Because the different forms of vitamin E cannot be interconverted in the human, the Estimated Average Requirements (EARs), Recommended Dietary Allowances (RDAs), and Adequate Intakes (AIs) apply only to the intake of RRR-α-tocopherol from food and the 2R-stereoisomeric forms of α-tocopherol (RRR-, RSR-, RRS-, and RSS-α-tocopherol) that occur in fortified foods and supplements. Although both α- and γ-tocopherols are absorbed, only α-tocopherol is preferentially secreted by the liver into the plasma (because α-tocopherol transfer protein [α-TTP] recognizes only α-tocopherol) for transport to tissues while γ-tocopherol is preferentially metabolized and excreted. This implies that the body requires α-tocopherol for some special (as yet undefined) need and other forms of vitamin E do not qualify.
Currently, most nutrient databases, as well as nutrition labels, do not distinguish among the different tocopherols in food. Thus, the data below on intakes from surveys and nutrient content of foods are presented as α-tocopherol equivalents (α-TE) and thus include the contribution of all eight naturally occurring forms of vitamin E, after adjustment for bioavailability using previously determined equivalency (e.g., γ-tocopherol was assumed to have only 10 percent of the availability of α-tocopherol) based on fetal resorption assays (see earlier section on “ Units of Vitamin E Activity ”). Because other forms of vitamin E occur in foods (e.g., γ-tocopherol is present in widely consumed oils such as soybean and corn oils), the intake of α-TE is greater than the intake of α-tocopherol alone.
Vitamin E Conversion Factors
Food Sources of Vitamin E
The reported median vitamin E intake in the United States of all individuals surveyed in 1988 to 1994 in the Third National Health and Nutrition Examination Survey (NHANES III) was 9 mg (21 µmol)/day of α-TE (see Appendix Table C-3). Additional data from the NHANES III database indicate that α-tocopherol from food as defined in this report (the RRR-form) contributed approximately 7 mg/day of the 9 mg/day median intake of total α-TE (see Appendix Table C-4). Thus, based on NHANES III, approximately 80 percent of the α-TE from foods in the survey are reported to be contributed by foods containing α-tocopherol. Thus, to estimate the α-tocopherol intake from food surveys in the United States in which food intake data are presented as α-TE, the α-TE should be multiplied by 0.8:
mg of α-tocopherol in a meal = mg of α-tocopherol equivalents in a meal × 0.8.
If diets vary considerably from what might be considered typical in the United States and Canada, other factors may be more appropriate to use in place of 0.8.
Vitamin E Supplements
To determine the number of milligrams of α-tocopherol in a multiple-vitamin supplement labeled in international units (IUs), one of two conversion factors is used. If the form of the supplement is “natural” or RRR-α-tocopherol (historically and incorrectly labeled d-α-tocopherol) (Horwitt, 1976), the correct factor is 0.67 mg/IU (USP, 1999). Thus, 30 IUs of RRR-α-tocopherol (labeled as d-α-tocopherol) in a multivitamin supplement would equate to 20 mg of α-tocopherol (30 × 0.67). The same factor would be used for 30 IUs of either RRR-α-tocopherol acetate or RRR-α-tocopherol succinate, because the amount in grams of these forms in a capsule has been adjusted based on their molecular weight. If the form of the supplement is all rac-α-tocopherol (historically and incorrectly labeled dl-α-tocopherol) (Horwitt, 1976), the appropriate factor is 0.45 mg/IU, reflecting the inactivity of the 2S-stereoisomers. Thus, 30-IU of all rac-α-tocopherol (labeled as dl-α-tocopherol) in a multi-vitamin supplement would equate to 13.5 mg of α-tocopherol (30 ×
0.45). The same factor would be used for the all rac-α-tocopherol acetate and succinate forms as well. See Table 6-1 for more information on the derivation of these conversion factors to be used when estimating intake from these forms of α-tocopherol to meet requirements.
mg of α-tocopherol in food, fortified food, or multivitamin = IU of the RRR-α-tocopherol compound × 0.67.
or
= IU of the all rac-α-tocopherol compound × 0.45.
Food Sources
The various vitamin E forms occur in different proportions in foods. The main dietary sources of vitamin E are edible vegetable oils (Dial and Eitenmiller, 1995; McLaughlin and Weihrauch, 1979; Sheppard et al., 1993) (Figure 6-8). At least half of the tocopherol content of wheat germ oil, sunflower oil, cottonseed oil, safflower oil, canola oil, and olive oil is in the form of α-tocopherol. Soybean and corn oils contain about 10 times as much γ-tocopherol as tocopherol. Palm and rice bran oils contain high proportions of tocopherol, as well as various tocotrienols (Dial and Eitenmiller, 1995). Other foods providing vitamin E include unprocessed cereal grains, nuts, fruits, vegetables, and meats, especially the fatty portion. As stated previously, all of the α-tocopherol present in these unfortified foods would be in the natural form, RRR-α-tocopherol and would contribute toward meeting the recommended dietary allowance. The other non-α-tocopherol forms of vitamin E present in food would not.
Dietary Intake
Dietary Surveys
According to the 1994 to 1996 Continuing Survey of Food Intakes by Individuals (CSFII) (Appendix Table D-2), the median reported dietary intakes of men and women aged 31 through 50 years are 9.3 mg (21.6 µmol)/day and 6.8 mg (15.8 µmol)/day, respectively, of α-TE. Using the factor (0.8) derived from NHANES III data to determine α-tocopherol intake from α-TE, the adjusted intakes would be 7.5 mg (17.4 µmol)/day for men (9.3 × 0.8) and 5.4 mg (12.6 µmol)/day for women (6.8 × 0.8).
Data from NHANES III (Appendix Table C-3 and Table C-5) indicate a
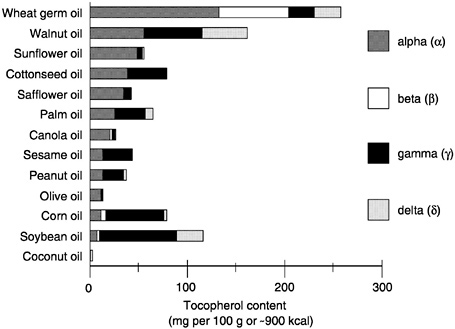
FIGURE 6-8 The various vitamin E forms in edible vegetable oils.
median total intake (including supplements) of 12.9 mg (30.0 µmol)/day of α-TE (10.3 mg [24.0 µmol]/day of α-tocopherol) and a median dietary intake from food alone of 11.7 mg (27.2 µmol)/day of α-TE (9.4 mg [21.9 µmol]/day of α-tocopherol) among men 31 through 50 years of age. Thus, these men are consuming 0.9 mg (10.3 minus 9.4 mg/day) of α-tocopherol from supplements. If the form of the supplement is all rac-α-tocopherol, the 0.9 mg (2.1 µmol)/day would be divided by 2 (see section on “ Interconversion of Vitamin E Units ”), which would result in an adjusted supplement intake of 0.4 mg (0.9 µmol)/day of α-tocopherol. Thus, the adjusted estimate for total intake from food (9.4 mg) and supplements (0.4 mg) is 9.8 mg (22.8 µmol)/day of α-tocopherol. If the form of the supplement is RRR-α-tocopherol, all of the 0.9 mg (2.1 µmol)/day of α-tocopherol in the multivitamin supplement contributes to meeting the requirement, and the total intake is 10.3 mg (24.0 µmol)/day of α-tocopherol. For women in this age range, the median total intake (including supplements) is 9.1 mg (21.2 µmol)/day of α-TE (7.3 mg [17.0 µmol] of α-tocopherol) and the median dietary intake is 8.0 mg (18.6 µmol)/day of α-TE (6.4 mg [14.9 µmol]/
SOURCE: Data obtained from Dial and Eitenmiller (1995).
day of α-tocopherol) from food alone. Thus, the adjusted median reported intake for these women would be 0.9 mg (7.3 minus 6.4 mg/day) of α-tocopherol from supplements. If the supplement is all rac-α-tocopherol, the 0.9 mg (2.1 µmol)/day would be divided by 2 (see section on “ Interconversion of Vitamin E Units ”), resulting in an adjusted median intake from supplements of 0.4 mg (0.9 µmol)/day of α-tocopherol. Thus, the total adjusted median intake reported from food (6.4 mg) and supplements (0.4 mg) is 6.8 mg (15.8 µmol)/day of α-tocopherol. Again, if the form of the supplement is RRR-α-tocopherol, all of the 0.9 mg (2.1 µmol)/day of α-tocopherol from the multivitamin supplement would contribute to meeting the requirement, and the total intake from diet and supplements remains 7.3 mg (17.0 µmol)/day of α-tocopherol.
Underreporting in Dietary Surveys
The above CSFII and NHANES III intake estimates may be low due to four sources of measurement error that are important with regard to vitamin E intake: (1) energy intake is underreported in the national surveys (Mertz et al., 1991), and fat intake (which serves as a major carrier for vitamin E) is likely to be more underreported than energy intake in the NHANES III survey (Briefel et al., 1997); (2) the amount of fats and oils added during food preparation (and absorbed into the cooked product) is difficult to assess using diet recall methodologies, yet contributes substantially to vitamin E intake; (3) uncertainties about the particular fats or oils consumed, particularly when food labels do not provide the specific fat or oil in the product (e.g., “this product may contain partially hydrogenated soybean and/or cottonseed oil or vegetable oil”) necessitate a reliance on default selections (and thus assumptions about the relative content of α- and γ-tocopherols); and (4) because of the small number of samples, the vitamin E content of food sources in the CSFII and NHANES III databases are very variable (J. Holden, Agricultural Research Service, USDA, personal communication, April 13, 1999).
Recently, Haddad et al. (1999) reported vitamin E intakes of 25 vegans (defined as those who excluded all animal products from their diets) and 20 nonvegans between the ages of 20 and 60 years. The reported vitamin E intakes, based on 4-day food records, were 17 to 23 mg (40 to 53 µmol)/day of α-tocopherol equivalents. Using the factor (0.8) from NHANES III data to adjust for α-tocopherol equivalents, the above estimated intakes would equate to 13.6 to 18.4 mg (31.6 to 42.8 µmol)/day of α-tocopherol. Van het Hof et al. (1999) reported that conventional Dutch menus contained 20.9 mg
(48.7 µmol)/day of α-tocopherol when these diets were analyzed chemically. These two studies indicate that vitamin E intakes from the CSFII and NHANES III surveys are probably underestimated even with the adjustment factor (0.8) and suggest that mean intakes of apparently healthy adults in the United States and Canada are likely to be above the RDA of 15 mg (34.9 µmol)/day of α-tocopherol.
Most dietary vitamin E is present in fats and its oils (Sheppard et al., 1993); therefore, changes in dietary habits to decrease fat intake may have deleterious effects on vitamin E intake (Adam et al., 1995; Bae et al., 1993; Retzlaff et al., 1991; Sarkkinen et al., 1993; Velthuiste Wierik et al., 1996). Patients with coronary artery disease, who did not take vitamin supplements, had average dietary vitamin E intakes of 5.8 mg (13.4 µmol)/day of α-tocopherol equivalents (adjusted to 4.6 mg [10.8 µmol]/day of α-tocopherol) in a 25 percent fat diet containing 2,058 kcal (Mandel et al., 1997). This example demonstrates that low-fat diets can substantially decrease vitamin E intakes if food choices are not carefully made to enhance α-tocopherol intakes.
Dietary Vitamin E Sources
Murphy et al. (1990) evaluated vitamin E intakes from NHANES II. Fats and oils used as spreads, etc. contributed 20.2 percent of the total vitamin E; vegetables, 15.1 percent; meat, poultry, and fish, 12.6 percent; desserts, 9.9 percent; breakfast cereals, 9.3 percent; fruit, 5.3 percent; bread and grain products, 5.3 percent; dairy products, 4.5 percent; mixed main dishes, 4.0 percent; nuts and seeds, 3.8 percent; eggs, 3.2 percent; salty snacks, 3 percent; legumes, 2.1 percent; and soups, sauces, and gravies, 1.7 percent.
As indicated previously, estimation of dietary vitamin E intake is difficult because the source of oil is often not known with certainty. Lehmann et al. (1986) analyzed the foods used in a human diet study for vitamin E content. Each menu was designed to contain 2,400 kcal with 35 percent fat calories and included either 10 or 30 g/day of linoleic acid and 500 mg/day of cholesterol; the high linoleic acid diet contained 10 g of safflower oil. As shown in Figure 6-9, substituting various oils for the 10 g of safflower oil resulted in vitamin E intakes that varied from 6.9 to 13.8 mg (16 to 32 µ mol)/day of α-TE depending on the source of the vegetable oil (vitamin E contents were estimated from Lehmann et al., 1986, and Dial and Eitenmiller, 1995).
Intake from Supplements
Vitamin E supplement use is high in the U.S. population (Hartz et al., 1988; Slesinski et al., 1996). Information from the Boston Nutritional Status Survey on use of supplemental vitamin E by a free-living population, 60 years of age and older, indicated that 38 percent of the men took a nutritional supplement and 68 percent of these users took a vitamin E supplement. Of the women, 49 percent used supplements with 73 percent of them taking a vitamin E supplement (Hartz et al., 1992). In the earlier 1986 National Health Interview Survey, 26 percent of all adults reported use of supplements containing vitamin E (Moss et al., 1989). Slesinski et al. (1996) examined supplement usage in over 11,000 adults who participated in the 1992 National Health Interview Survey Epidemiology Supplement and reported that diets of women utilizing supplements that contained vitamin E were higher in vitamin E compared with those of nonsupplement users. No differences in vitamin E intake were found in the men participating in the survey.
TOLERABLE UPPER INTAKE LEVELS
The Tolerable Upper Intake Level (UL) is the highest level of daily nutrient intake that is likely to pose no risk of adverse health effects in almost all individuals. Although members of the general population should be advised not to exceed the UL for vitamin E routinely, intake above the UL may be appropriate for investigation within well-controlled clinical trials. In light of evaluating possible benefits to health, clinical trials of doses above the UL should not be discouraged, as long as subjects participating in these trials have signed informed consent documents regarding possible toxicity, and as long as these trials employ appropriate safety monitoring of trial subjects. Also, the UL is not meant to apply to individuals who are receiving vitamin E under medical supervision.
Hazard Identification
Adverse Effects
There is no evidence of adverse effects from the consumption of vitamin E naturally occurring in foods. Therefore, this review is limited to evidence concerning intake of α-tocopherol as a supplement, food fortificant, or pharmacological agent. RRR-α-tocopheryl acetate (historically and incorrectly labeled d-α-tocopheryl acetate)
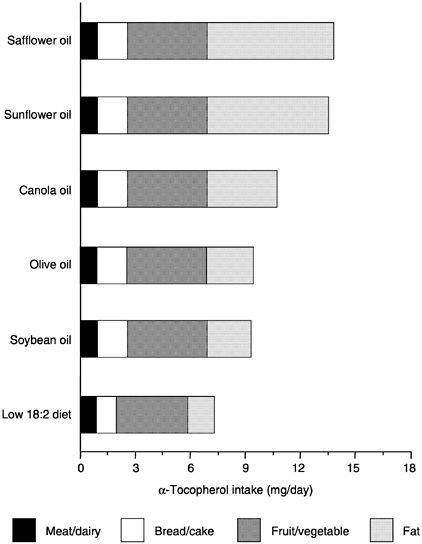
FIGURE 6-9 Variations in α-tocopherol content of diets containing different oils. A sample diet contained 2,400 kcal with 35 percent fat calories including either 10 or 30 g/day of linoleic acid (18:2) and 500 mg/day cholesterol; the high linoleic acid diet contained 10 g safflower oil. When various oils were substituted for the 10 g safflower oil, vitamin E intakes varied from 7 to 14 mg (16 to 33 µmol)/day of α-tocopherol depending on the source of the vegetable oil.
SOURCE: Lehmann et al. (1986) and Dial and Eitenmiller (1995).
(Horwitt, 1976) and all rac-α-tocopheryl acetate (historically and incorrectly labeled dl-α-tocopheryl acetate) (Horwitt, 1976) are the forms of synthetic vitamin E used almost exclusively in supplements, food fortification, and pharmacologic agents.
Animal studies show that α-tocopherol is not mutagenic, carcinogenic, or teratogenic (Abdo et al., 1986; Dysmsza and Park, 1975; Krasavage and Terhaar, 1977). Animals fed extremely high doses of α-tocopherol or α-tocopheryl acetate have been shown to experience a variety of adverse effects, but the relevance of some of this information to the human situation is questionable.
Little information exists on the adverse effects to humans that might result from ingestion of other forms of tocopherol, such as γ- or β-tocopherol, in amounts exceeding the levels normally found in foods. One study in humans given supplements of either all rac-α-tocopherol, RRR-α-tocopherol, or mixed tocopherols (α, β, and γ-tocopherol) demonstrated that all supplements yielded the same plasma α- and γ-tocopherol concentrations (Chopra and Bhagavan, 1999). Some data are available from animal studies, however. Clement and Bourre (1997) found that rats fed large amounts of γ-tocopherol had increased concentrations of α-tocopherol in plasma and tissues. Although the fractional absorption of α-tocopherol was decreased when α-tocopherol supplements were given to thoracic ductcannulated rats, no decrease was seen in γ-tocopherol absorption (Traber et al., 1986). Thus, it appears that absorption of the various forms of vitamin E is independent and unaffected by the presence of large amounts of the other forms.
Plasma α-tocopherol concentrations are not informative for assessing adverse effects because plasma concentrations reach a similar plateau (approximately 3 to 4 times unsupplemented concentrations) when humans consume supplements containing at least 200 mg (465 µmol)/day of either RRR- or all rac-α-tocopherol (Chopra and Bhagavan, 1999; Devaraj et al., 1997; Dimitrov et al., 1991, 1996; Jialal et al., 1995; Meydani et al., 1998; Princen et al., 1995). However, since all forms of vitamin E are absorbed, although are not maintained in the plasma (as discussed in the earlier section “Absorption and Transport” [Kiyose et al., 1997; Meydani et al., 1989; Traber and Kayden, 1989a; Traber et al., 1992, 1994a]), they all could contribute to vitamin E toxicity. These observations suggest that at doses at which adverse effects are observed, all the stereoisomers of α-tocopherol should be considered equivalent. A review of vitamin E toxicity studies concluded that humans show few side effects following supplemental doses below 2,100 mg (4,885 µmol)/day of RRR-α-tocopherol (Kappus and Diplock, 1992). However, most
studies of the possible effects of supplemental α-tocopherol (all forms) on human health have been conducted over periods of a few weeks to a few months, so the possible chronic effects of lifetime exposures to high supplemental levels of α-tocopherol remain uncertain.
Hemorrhagic Toxicity—Humans. Three large-scale intervention trials, one supplementing with 400 or 800 IU (268 or 567 mg)/day of RRR-α-tocopherol for 1.4 years (Stephens et al., 1996), another supplementing with 300 mg/day of all rac-α-tocopherol for 3.5 years (GISSI-Prevenzione Investigators, 1999), and the third supplementing with 400 IU (268 mg)/day of RRR-α-tocopherol for 4.5 years (HOPE Study Investigators, 2000), reported no increased risk of stroke. However, another large-scale randomized trial, the Alpha-Tocopherol, Beta Carotene (ATBC) Cancer Prevention Study, in Finnish male smokers consuming 50 mg/day of all rac-α-tocopherol for 6 years, reported a significant 50 percent increase in mortality from hemorrhagic stroke (66 versus 44 strokes in the supplemented versus the control group) (ATBC Cancer Prevention Study Group, 1994). An increase in hemorrhagic strokes was not observed in another study that was designed to evaluate neurological function in 85 patients with Alzheimer's disease consuming 2,000 IU/day of supplemental all rac-α-tocopherol for 2 years (Sano et al., 1997). The number of subjects in this trial or the length of the trial may have been insufficient to detect an effect. The unexpected result in the ATBC study requires confirmation or additional refutation from several other ongoing, large-scale trials including the Women's Health Study, the Physicians ' Health Study II, and the Women's Antioxidant Cardiovascular Study. If most of the evidence that develops from these ongoing randomized trials indicates an increased risk of hemorrhagic stroke from α-tocopherol, the recommended UL for α-tocopherol will have to be revised.
Hemorrhagic Toxicity—Animals. α-Tocopherol can cause hemorrhage, increase prothrombin time, and interrupt blood coagulation in experimental animals, but very high doses are required. The hemorrhagic toxicity of α-tocopherol has been observed in chicks (March et al., 1973) and rats (Abdo et al., 1986; Mellette and Leone, 1960; Takahashi et al., 1990; Wheldon et al., 1983; Yang and Desai, 1977). However, in both species, high doses of 500 mg/kg/day or more of RRR-α-tocopheryl acetate were necessary to induce the effects. Also, the hemorrhagic effects could be reversed by the administration of supplemental vitamin K (Abdo et al., 1986; March
et al., 1973; Wheldon et al., 1983). Presumably, these hemorrhagic effects seen in experimental animals are relevant to humans, because similar abnormal blood coagulation has been observed in a patient receiving chronic warfarin therapy, which would interfere with vitamin K status (Corrigan and Marcus, 1974).
Platelet Effects. Evidence suggests that α-tocopherol inhibits platelet aggregation and adhesion in vitro (Calzada et al., 1997; Freedman et al., 1996; Higashi and Kikuchi, 1974; Steiner and Anastasi, 1976). However, it is not clear that these effects on platelet function are deleterious in normal healthy individuals at any dose. Oral administration of up to 600 mg/day of α-tocopherol up to three years did not result in any adverse blood coagulation effects in apparently healthy volunteers (Farrell and Bieri, 1975; Kitagawa and Mino, 1989). However, special consideration should be given to individuals who are deficient in vitamin K or who are on anticoagulant therapy. Administration of high doses of α-tocopherol may exacerbate the coagulation defects in these individuals (Corrigan and Marcus, 1974).
Other Adverse Effects in Humans. Uncontrolled studies have reported various other adverse effects associated with excess intake of α-tocopherol. These include fatigue, emotional disturbances, thrombophlebitis, breast soreness, creatinuria, altered serum lipid and lipoprotein levels, gastrointestinal disturbances, and thyroid effects (Anderson and Reid, 1974; Bendich and Machlin, 1988; Machlin, 1989; Tsai et al., 1978). However, none of these reported effects have been consistently observed or shown in controlled trials. Although side effects have been reported with extended intakes of 1,100 to 2,100 mg/day of RRR-α-tocopherol (Kappus and Diplock, 1992), these effects are not severe and subside rapidly upon reducing the dosage or discontinuing the administration of α-tocopherol. The lack of systematic observations of such effects in controlled clinical trails prevents any judgments regarding the risk of such effects in the normal healthy human population.
Adverse Effects in Premature Infants. In addition to the hemorrhagic effects described previously, an increased incidence of necrotizing enterocolitis (NEC) was observed in premature infants with birth weights of 1.5 kg or less who were given 200 mg/day of α-tocopheryl acetate (Finer et al., 1984). Johnson et al. (1985) also demonstrated an association between high serum vitamin E concentrations and increased incidence of sepsis and late-onset NEC in
infants of less than 1.5-kg birth weight who were supplemented with α-tocopheryl acetate.
The incidence of intracranial hemorrhage in premature infants receiving supplemental intravenous or oral α-tocopheryl acetate has been reported as increased (Phelps et al., 1987), unchanged (Speer et al., 1984), or decreased (Speer et al., 1984) depending on the severity of the hemorrhage. It may well be that the small premature infant is particularly vulnerable to the toxic effects of vitamin E and that intravenous vitamin E is more toxic than the oral preparation.
Other Adverse Effects Seen in Animals. Many other adverse effects have been noted in various animal studies. For example, Abdo et al. (1986) observed lung lesions (chronic interstitial inflammation and adenomatous hyperplasia) in Fischer 344 rats in all treatment groups receiving α-tocopheryl acetate by gavage at doses as low as 125 mg/kg/day for 13 weeks. It is possible that the lung lesions may be the result of infusions into the lung from the gavage, rather than a vitamin E effect. However, this toxic effect was considered less relevant than the hemorrhagic effects seen because similar effects in the lung have not been noted in human trials or other animal studies.
Summary
Based on considerations of causality, relevance, and the quality and completeness of the database, hemorrhagic effects were selected as the critical endpoint on which to base the UL for vitamin E for adults. There is some evidence of an increased incidence of hemorrhagic effects in premature infants receiving supplemental α-tocopherol. However, the human data fail to demonstrate consistently a causal association between excess α-tocopherol intake in normal, apparently healthy individuals and any adverse health outcome. The unexpected finding of an increase in hemorrhagic stroke in the ATBC study was considered preliminary and provocative, but not convincing until it can be corroborated or refuted in further large-scale clinical trials. The human data demonstrating the safety of supplemental α-tocopherol have been accumulated primarily in small groups of individuals receiving supplemental doses of 3,200 mg/day of α-tocopherol or less (usually less than 2,000 mg/day) for relatively short periods of time (weeks to a few months). Thus, some caution must be exercised in judgments regarding the safety of supplemental doses of α-tocopherol over multiyear periods.
The hemorrhagic effects seen in experimental animals are en-
countered only with very high doses of α-tocopherol and can be corrected by administration of supplemental vitamin K. Similarly, it appears that in vitamin K-deficient humans these effects could occur if sufficiently high doses were obtained to overwhelm the protective effects of vitamin K. However, there is no direct evidence regarding the doses that might put normal apparently healthy humans at risk for such effects; these data show that individuals who are deficient in vitamin K are at increased risk of coagulation defects.
Adults
Data Selection. In the absence of human data pertaining to dose-response relationships, the data sets used to identify a no-observed-adverse-effect level (NOAEL) for α-tocopherol include studies showing hemorrhagic toxicity in rats (Abdo et al., 1986; Takahashi et al., 1990; Wheldon et al., 1983).
Dose-Response Assessment
Identification of NOAEL and Lowest-Observed-Adverse-Effect Level (LOAEL). A LOAEL of 500 mg/kg body weight/day can be identified based on a critical evaluation by Wheldon et al. (1983). They fed all rac-α-tocopheryl acetate to Charles River CD strain rats at levels of 500, 1,000, or 2,000 mg/kg body weight/day for 104 weeks. Hemorrhages from the gut, the urinary tract, the orbit and meninges, and the claws were observed in male rats only by week 15 in the highest-dose group, by week 16 in the intermediate-dose group, and by week 18 in the low-dose group. Prothrombin times were prolonged in males of all three treatment groups by week 4. However, additional vitamin K supplementation of the diets was initiated at week 24 and prothrombin times returned to normal by week 26. Although this was a chronic, 104-week study, the correction of vitamin K levels in the diet at week 24 means that the combined vitamin E-vitamin K effect was evaluated only on a subchronic basis.
Takahashi et al. (1990) supplemented the diets of male Sprague-Dawley rats with 600 or 1,000 mg/kg body weight/day RRR-α-tocopheryl acetate for 7 days. Despite the short duration of the feeding trial, a dose-dependent increase in prothrombin time and partial thromboplastin time was noted in rats receiving 600 and 1,000 mg/kg/day. The number of animals with hemorrhages was similar in both dose groups. No supplementation of vitamin K was attempted in this experiment. This study would yield a LOAEL of
600 mg/kg/day but is compromised by its short duration and by the fact that lower doses were not utilized.
Abdo et al. (1986) conducted a 13-week study administering RRR-α-tocopheryl acetate in corn oil by gavage to Fischer 344 rats at doses of 125, 500, and 2,000 mg/kg body weight/day. In males, high levels of RRR-α-tocopheryl acetate (2,000 mg/kg/day) caused prolongation of both prothrombin time and activated partial thromboplastin time (APTT), reticulocytosis, and a decrease in hematocrit values and hemoglobin concentrations. APTT was also lengthened in females at this dose level. Hemorrhagic diathesis was observed in both males and females at the highest dosage level (2,000 mg/kg/day). However, no adverse hemorrhagic effects, other than a minimal increase in activated partial thromboplastin time, were observed at a dose of 500 mg/kg/day.
While some differences were encountered among the results of these three key studies, they could be attributed to the dosage approach (gavage versus diet), the time period of dosing, the strain of rats, and possibly the level of vitamin K supplementation. The data of Wheldon et al. (1983) demonstrate that the hazard posed by excessive dietary intake of all rac-α-tocopheryl acetate can be overcome by administration of additional vitamin K. The Wheldon et al. (1983) study is considered the most definitive estimate because of the long exposure period of the dosage via diet. The LOAEL in this study was 500 mg/kg/day, the lowest dose tested. Thus, a precise NOAEL cannot be determined from the experiment. However, this LOAEL is consistent with the results of the shorter-term feeding study of Takahashi et al. (1990) with a LOAEL at 600 mg/kg/day, the lowest dose tested, and the gavage study of Abdo et al. (1986) with no adverse hemorrhagic effects at 125 mg/kg/day and only a minimal increase in activated partial thromboplastin time at 500 mg/kg/day of RRR-α-tocopherol acetate.
Uncertainty Assessment. When determining an uncertainty factor (UF) for α-tocopherol, several sources of uncertainty were considered and combined into the final UF (Table 6-6). A UF of 2 was used to extrapolate the LOAEL to a NOAEL. The severity of hemorrhagic effects justifies a UF greater than 1; however, the results of Abdo et al. (1986) showing no adverse effects at 125 mg/kg/day for hemorrhagic effects justify a UF of 2 to extrapolate from the LOAEL of 500 mg/kg body weight/day to the NOAEL of 250 mg/kg body weight/day. A UF of 2 was selected to extrapolate from subchronic to chronic intake, and a UF of 3 was selected to extrapolate from experimental animals to humans because of data showing
TABLE 6-6 Sources of Uncertainty Used to Determine UL for Vitamin E
|
UF |
|
|
LOAEL to NOAEL |
2 |
|
Subchronic to chronic intake |
2 |
|
Experimental animal to human |
3 |
|
Interindividual variation in sensitivity |
3 |
|
Final UF = 2 × 2 × 3 × 3 = |
36 |
some similarities between the animal and human responses. Another UF of 3 was selected to account for interindividual variation in sensitivity. This value was deemed appropriate based on pharmacokinetic data showing plasma saturation of α-tocopherol concentrations with increasingly higher intakes in humans (Dimitrov et al., 1991, 1996; Jialal et al., 1995; Losowsky et al., 1972; Meydani et al., 1998; Princen et al., 1995). The various UFs are combined to yield an overall UF of 36 to extrapolate from the LOAEL in animals to derive a UL for humans.
Derivation of a UL. The LOAEL of 500 mg/kg/day was divided by the overall UF of 36 to obtain a UL value of 14 mg/kg/day for adult humans. The value of 14 mg/kg/day was multiplied by the average of the reference body weights for male and female adults, 68.5 kg, from Chapter 1 (Table 1-1). The resulting UL for adults is 959 mg/day (which was rounded to 1,000 mg/day):
![]()
= 14 / mg / kg / day × 68.5 kg ≈ 1,000 mg /day.
Although adult males and females have different reference body weights, the uncertainties in the estimation of the UL were considerable, and distinction of separate ULs for male and female adults was therefore not attempted. This UL is consistent with the review by Kappus and Diplock (1992) that in humans, side effects occurred at doses of 1,100 to 2,100 mg (2,559 to 4,885 µmol)/day of RRR-α-tocopherol. At high doses all of the stereoisomers of α-tocopherol are considered equivalent given that all forms of vitamin E are absorbed (Kiyose et al., 1997; Meydani et al., 1989; Traber and Kayden, 1989a; Traber et al., 1992, 1994a). Thus, the UL applies to all eight stereoisomers of α-tocopherol.
Vitamin E UL Summary, Ages 19 Years and Older
|
UL for Adults |
|
|
19 years and older |
1,000 mg (2,326 µmol)/day of any form of supplementary α-tocopherol |
Other Life Stage Groups
Infants. For infants, the UL was judged not determinable because of insufficient data on adverse effects in this age group and concern about the infant 's ability to handle excess amounts. To prevent high levels of intake, the only source of intake for infants should be from food and formula.
Children and Adolescents. There are no reports of vitamin E toxicity in children and adolescents. Given the dearth of information, the UL values for children and adolescents are extrapolated from those established for adults. Thus, the adult UL of 1,000 mg (2,326 µmol)/day of α-tocopheryl was adjusted for children and adolescents on the basis of relative body weight as described in Chapter 4 using reference weights from Chapter 1 (Table 1-1). Values have been rounded.
Pregnancy and Lactation. There are no reports of vitamin E toxicity in pregnant or lactating women. One woman consumed 27 mg/day of α-tocopherol from the diet and 1,455 mg/day from supplements (Anderson and Pittard, 1985). Her milk α-tocopherol concentrations were more than three times normal, which might in theory be dangerous for the infant, but the mother had no adverse effects. Given the dearth of information, it is recommended that the UL for pregnant and lactating females be the same as that for the nonpregnant and nonlactating female.
Vitamin E UL Summary, Ages 1 through 18 Years, Pregnancy, Lactation
|
UL for Infants |
|
|
0–12 months |
Not possible to establish; source of intake should be from food and formula only |
|
UL for Children |
|
|
1–3 years |
200 mg (465 µmol)/day of any form of supplementary α-tocopherol |
|
4–8 years |
300 mg (698 µmol)/day of any form of supplementary α-tocopherol |
|
9–13 years |
600 mg (1,395 µmol)/day of any form of supplementary α-tocopherol |
|
UL for Adolescents |
|
|
14–18 years |
800 mg (1,860 µmol)/day of any form of supplementary α-tocopherol |
|
UL for Pregnancy |
|
|
14–18 years |
800 mg (1,860 µmol)/day of any form of supplementary α-tocopherol |
|
19 years and older |
1,000 mg (2,326 µmol)/day of any form of supplementary α-tocopherol |
|
UL for Lactation |
|
|
14–18 years |
800 mg (1,860 µmol)/day of any form of supplementary α-tocopherol |
|
19 years and older |
1,000 mg (2,326 µmol)/day of any form of supplementary α-tocopherol |
Special Considerations
Vitamin K Deficiency or Anticoagulant Therapy. The UL derived above pertains to individuals in the general population with adequate vitamin K intake. Individuals who are deficient in vitamin K or who are on anticoagulant therapy are at increased risk of coagulation defects. Patients on anticoagulant therapy should be monitored when taking vitamin E supplements as described by Kim and White (1996).
Premature Infants. As discussed above, the small premature infant is particularly vulnerable to the toxic effects of α-tocopherol. For premature infants, the UL of 14 mg/kg/day for adults would be equivalent to a UL of 21 mg/day for infants with birth weights of 1.5 kg. This UL seems prudent and appropriately conservative based on the observation by Phelps et al. (1987). Furthermore, the American Academy of Pediatrics states that “pharmacologic doses of vitamin E for the prevention or treatment of retinopathy of prematurity, bronchopulmonary dysplasia, and intraventricular hemorrhage are not recommended” (AAP, 1998). While it is recognized that hemolytic anemia due to vitamin E deficiency is frequently of concern in premature infants, its management via vitamin E supplementation must be carefully controlled.
Intake Assessment
Based on distribution data from the 1988 to 1994 Third National Health and Nutrition Examination Survey (NHANES III) (Appendix Table C-5), the highest mean reported intake of vitamin E from food and supplements for all life stage and gender groups was
around 45 mg (104.7 µmol)/day of α-tocopherol equivalents. This was the mean intake reported by women 51 through 70 years of age. However, the intake distribution from food and supplements is extremely skewed because the median intake of these women was about 9 mg (20.9 µmol)/day in comparison with a mean intake of 45 mg (104.7 µmol)/day. This group also had the highest reported intake at the ninety-ninth percentile of 508 mg (1,181 µmol)/day of α-tocopherol equivalents, which is well below the UL of 1,000 mg/day of any form of α-tocopherol. Vitamin E supplement use is high in the U.S. population (Hartz et al., 1988; Slesinski et al., 1996). In the 1986 National Health Interview Survey, supplements containing vitamin E were used by 37 percent of young children, 23 percent of men, and 29 percent of all women in the United States (Moss et al., 1989).
Risk Characterization
The risk of adverse effects resulting from excess intake of α-tocopherol from food and supplements appears to be very low at the highest intakes noted above. Although members of the general population should be advised not to exceed the UL routinely, intakes above the UL for vitamin E may be appropriate for investigation within well-controlled clinical trials. In light of evaluating possible benefits to health, clinical trials of doses of α-tocopherol above the UL should not be discouraged, as long as subjects participating in these trials have signed informed consent documents regarding possible toxicity and as long as these trials employ appropriate safety monitoring of trial subjects. Also, the UL is not meant to apply to individuals who are receiving vitamin E under medical supervision.
RESEARCH RECOMMENDATIONS FOR VITAMIN E
-
Biomarkers are needed for use in assessment of vitamin E intake and vitamin E status. What are the determinants of plasma concentrations of α-tocopherol, and are these concentrations regulated? Are plasma α-tocopherol concentrations the best parameter for assessing adequate plasma vitamin E status in apparently healthy individuals? Does an α-tocopherol/lipid (e.g., total lipid, triglyceride, or cholesterol) ratio better reflect optimal plasma vitamin E status?
-
Since the Recommended Dietary Allowances (RDAs) for children ages 1 through 18 years are extrapolated from the adult RDAs,
-
it is critically important to conduct large-scale studies with children using state-of-the-art biomarkers to assess their vitamin E requirements.
-
Valid estimates are needed of vitamin E intakes. These estimates require identification of the specific fats and oils consumed, in addition to careful tabulation of all of the foods consumed, because the vitamin E content of various fats and oils differs widely and because vitamin E is widely distributed in many foods. Most individual foodstuffs consumed account for less than 1 percent of the daily intake of α-tocopherol. Calories are frequently underreported, as is dietary fat, and the form and quantity of fat consumed are unknown. Better methods for estimating vitamin E intakes are needed.
-
Information on the relationship between oxidative stress and vitamin E status is needed. Some information is available about the dosage of vitamin E needed to achieve plasma levels that protect circulating low-density lipoprotein (LDL) from ex vivo oxidation. However, there are scant data on tissue levels of vitamin E at different levels of intake. Do the large doses that confer protection of circulating LDL also confer protection within tissues against lipid peroxidation or other manifestations of reactive oxygen species generation? Are there markers of oxidative stress that can be related to vitamin E status?
-
Vitamin E kinetics and metabolism are promising areas of research. Can estimates of α-tocopherol requirements be made using stable isotopes? Are balance studies feasible that measure intake and output of stable isotope-labeled vitamin E? What is the turnover of α-tocopherol in various human tissues? In which tissues is it degraded and how rapidly? What are the major metabolic intermediates during degradation, and do they have biological function?
-
Determination of the effects of vitamin E intake on the prevention of chronic disease is needed. There is a great deal of suggestive or indirect evidence that vitamin E intakes above those that can reasonably be obtained from foods may confer health benefits. Before clinical intervention trials can be interpreted properly, more knowledge about the relationship of vitamin E dosage to level of protection, or level of protection to plasma cholesterol or lipoprorein levels, is needed. Additional clinical trials to test directly whether or not supplementation with vitamin E can reduce the risk of coronary heart disease are needed. A number of trials already in progress are evaluating vitamin E effects in well over 100,000 individuals. However, whether the results are positive or negative, additional studies will be needed. For example, if the results are negative, the question will arise of whether treatment was instituted early
-
enough and whether even longer trials starting at an earlier age are necessary to test the hypothesis properly. If the results are positive, the issue of dosage will arise. Most of these studies are supplementing with more than 200 mg/day of α-tocopherol, but this may be unnecessarily high. Again, if the results are positive, indicating that vitamin E does indeed offer protection, it will be important to determine if combinations of antioxidants in various dosages can further increase the beneficial effect. Possible interactions between cholesterol-lowering and antioxidant treatments should be studied to find the best algorithm for preventive management.
-
More information is needed on the mechanisms of vitamin E function. It is unknown whether vitamin E functions solely as a relatively nonspecific antioxidant compound or whether it has some very specific modes of action, for which the precise structure of α-tocopherol is required. The mechanisms for regulation of tissue α-tocopherol are unknown. In fact, it is not known whether they are regulated at all. The relatively uniform concentrations in tissues from different individuals suggest that there may be regulation, but this may reflect differences in fat concentration. Additionally, the existence of α-tocopherol binding proteins in tissues other than the liver is being investigated. Do differences in depletion rates among various tissues reflect the functions of other tissue α-tocopherol binding proteins?
-
More information is needed on the other forms of vitamin E. What is the biological potency of forms of vitamin E other than α-tocopherol in humans? Does γ-tocopherol have a role in humans? Does it function to act as a nitric oxide scavenger? What is the metabolic fate of γ-tocopherol in humans?
REFERENCES
AAP (American Academy of Pediatrics). 1998. Pediatric Nutrition Handbook, 4th edition. Elk Grove Village, IL: AAP. P. 67.
Abbasi S, Ludomirski A, Bhutani VK, Weiner S, Johnson L. 1990. Maternal and fetal plasma vitamin E to total lipid ratio and fetal RBC antioxidant function during gestational development. J Am Coll Nutr 9:314–319.
Abdo KM, Rao G, Montgomery CA, Dinowitz M, Kanagalingam K. 1986. Thirteen-week toxicity study of d-alpha-tocopheryl acetate (vitamin E) in Fischer 344 rats. Food Chem Toxicol 24:1043–1050.
Acuff RV, Thedford SS, Hidiroglou NN, Papas AM, Odom TA. 1994. Relative bio-availability of RRR- and all-rac-alpha-tocopheryl acetate in humans: Studies using deuterated compounds . Am J Clin Nutr 60:397–402.
Acuff RV, Webb LW, Brooks LJ, Papas AM, Lane JR. 1997. Pharmacokinetics of RRR-gamma-tocopherol in humans after a single dose administration of deuterium-labeled gamma-tocopherol in humans. FASEB J 11:A449.
Adam O, Lemmen C, Kless T, Adam P, Denzlinger C, Hailer S. 1995. Low fat diet decreases alpha-tocopherol levels, and stimulates LDL oxidation and eicosanoid biosynthesis in man. Eur J Med Res 1:65–71.
Adler LA, Edson R, Lavori P, Peselow E, Duncan E, Rosenthal M, Rotrosen J. 1998. Long-term treatment effects of vitamin E for tardive dyskinesia. Biol Psychiatry 43:868–872.
AIN (American Institute of Nutrition). 1990. Nomenclature policy: Generic descriptors and trivial names for vitamins and related compounds. J Nutr 120:12–19.
Ali J, Kader HA, Hassan K, Arshat H. 1986. Changes in human milk vitamin E and total lipids during the first twelve days of lactation. Am J Clin Nutr 43:925–930.
Alexy U, Kersting M, Sichert-Hellert W, Manz F, Schöch G. 1999. Vitamin intake of 3- to 36-month-old German infants and children—Results of the DONALD-study. Int J Vitam Nutr Res 69:285–291.
Allen JC, Keller RP, Archer P, Neville MC. 1991. Studies in human lactation: Milk composition and daily secretion rates of macronutrients in the first year of lactation. Am J Clin Nutr 54:69–80.
Ames BN, Gold LS, Willett WC. 1995. The causes and prevention of cancer. Proc Natl Acad Sci USA 92:5258–5265.
Amiel J, Maziere J, Beucler I, Koenig M, Reutenauer L, Loux N, Bonnefont D, Feo C, Landrieu P. 1995. Familial isolated vitamin E deficiency. Extensive study of a large family with a 5-year therapeutic follow-up. J Inherit Metab Dis 18:333–340.
Anderson DM, Pittard WB. 1985. Vitamin E and C concentrations in human milk with maternal megadosing. A case report. J Am Diet Assoc 85:715–717.
Anderson TW, Reid DB. 1974. A double-blind trial of vitamin E in angina pectoris. Am J Clin Nutr 27:1174–1178.
Andersson SO, Wolk A, Bergstrom R, Giovannucci E, Lindgren C, Baron J, Adami HO. 1996. Energy, nutrient intake and prostate cancer risk: A populationbased case-control study in Sweden. Int J Cancer 68:716–722.
Arita M, Sato Y, Miyata A, Tanabe T, Takahashi E, Kayden H, Arai H, Inoue K. 1995. Human alpha-tocopherol transfer protein: cDNA cloning, expression and chromosomal localization. Biochem J 306:437–443.
Ascherio A, Stampfer MJ, Colditz GA, Rimm EB, Litin L, Willett WC. 1992. Correlations of vitamin A and E intakes with the plasma concentrations of carotenoids and tocopherols among American men and women. J Nutr 122:1792–1801.
ATBC (Alpha-Tocopherol, Beta Carotene) Cancer Prevention Study Group . 1994. The effect of vitamin E and beta carotene on the incidence of lung cancer and other cancers in male smokers. N Engl J Med 330:1029–1035.
Awad JA, Morrow JD, Hill KE, Roberts LJ II, Burk RF. 1994. Detection and localization of lipid peroxidation in selenium- and vitamin E-deficient rats using F2-isoprostanes. J Nutr 124:810–816.
Azen SP, Mack WJ, Cashin-Hemphill L, LaBree L, Shircore AM, Selzer RH, Blankenhorn DH, Hodis HN. 1996a. Progression of coronary artery disease predicts clinical coronary events. Long-term follow-up from the Cholesterol Lowering Atherosclerosis Study. Circulation 93:34–41.
Azen SP, Qian D, Mack WJ, Sevanian A, Selzer RH, Liu CR, Liu CH, Hodis HN. 1996b. Effect of supplementary antioxidant vitamin intake on carotid arterial wall intima-media thickness in a controlled clinical trial of cholesterol lowering. Circulation 94:2369–2372.
Azzi A, Boscoboinik D, Marilley D, Ozer NK, Stauble B, Tasinato A. 1995. Vitamin E: A sensor and an information transducer of the cell oxidation state. Am J Clin Nutr 62:1337S–1346S.
Bae CY, Keenan JM, Fontaine P, Wenz J, Ripsin CM, McCaffrey DJ. 1993. Plasma lipid response and nutritional adequacy in hypercholesterolemic subjects on the American Heart Association Step-One Diet. Arch Fam Med 2:765–772.
Bayliss EA, Hambidge KM, Sokol RJ, Stewart B, Lilly JR. 1995. Hepatic concentrations of zinc, copper and manganese in infants with extrahepatic biliary atresia. J Trace Elem Med Biol 9:40–43.
Baynes JW. 1991. Role of oxidative stress in development of complications in diabetes . Diabetes 40:405–412.
Bendich A. 1994. Role of antioxidants in the maintenance of immune functions. In: Frei B, ed. Natural Antioxidants in Human Health and Disease. San Diego: Academic Press. Pp. 447–467.
Bendich A, Machlin LJ. 1988. Safety of oral intake of vitamin E. Am J Clin Nutr 48:612–619.
Ben Hamida M, Belal S, Sirugo G, Ben Hamida C, Panayides K, Ionannou P, Beckmann J, Mandel JL, Hentati F, Koenig M, Middleton L. 1993. Friedreich's ataxia phenotype not linked to chromosome 9 and associated with selective autosomal recessive vitamin E deficiency in two inbred Tunisian families. Neurology 43:2179–2183.
Bieri JG, Evarts RP. 1973. Tocopherols and fatty acids in American diets. The recommended allowance for vitamin E. J Am Diet Assoc 62:147–151.
Bieri JG, Evarts RP. 1974. Gamma-tocopherol: Metabolism, biological activity and significance in human vitamin E nutrition. Am J Clin Nutr 27:980–986.
Bieri JG, McKenna MC. 1981. Expressing dietary values for fat-soluble vitamins: Changes in concepts and terminology. Am J Clin Nutr 34:289–295.
Bjørneboe A, Bjørneboe GE, Hagen BF, Nossen JO, Drevon CA. 1987. Secretion of alpha-tocopherol from cultured rat hepatocytes. Biochim Biophys Acta 922:199–205.
Blomstrand R, Forsgren L. 1968. Labelled tocopherols in man. Intestinal absorption and thoracic-duct lymph transport of dl-alpha-tocopheryl-3,4-14C2 acetate dl-alpha-tocopheramine-3,4-14C2 dl-alpha-tocopherol-(5-methyl-3H) and N-(methyl-3H)-dl-gamma-tocopheramine. Z Vitaminforsch 38:328–344.
Boda V, Finckh B, Durken M, Commentz J, Hellwege HH, Kohlschutter A. 1998. Monitoring erythrocyte free radical resistance in neonatal blood microsamples using a peroxyl radical-mediated haemolysis test. Scand J Clin Lab Invest 58:317–322.
Boersma ER, Offringa PJ, Muskiet FA, Chase WM, Simmons IJ. 1991. Vitamin E, lipid fractions, and fatty acid composition of colostrum, transitional milk, and mature milk: An international comparative study. Am J Clin Nutr 53:1197–1204.
Boscoboinik D, Szewczyk A, Hensey C, Azzi A. 1991. Inhibition of cell proliferation by alpha-tocopherol. Role of protein kinase C. J Biol Chem 266:6188–6194.
Briefel RR, Sempos CT, McDowell MA, Chien S, Alaimo K. 1997. Dietary methods research in the Third National Health and Nutrition Examination Survey: Underreporting of energy intake. Am J Clin Nutr 65:1203S–1209S.
Brown K, Reid A, White T, Henderson T, Hukin S, Johnstone C, Glen A. 1998. Vitamin E, lipids, and lipid peroxidation products in tardive dyskinesia . Biol Psychiatry 43:863–867.
Buettner GR. 1993. The pecking order of free radicals and antioxidants: Lipid peroxidation, alpha-tocopherol, and ascorbate. Arch Biochem Biophys 300:535–543.
Burck U, Goebel HH, Kuhlendahl HD, Meier C, Goebel KM. 1981. Neuromyopathy and vitamin E deficiency in man. Neuropediatrics 12:267–278.
Burton GW, Ingold KU. 1981. Autoxidation of biological molecules. I. The antioxidant activity of vitamin E and related chain-breaking phenolic antioxidants in vitro. J Am Chem Soc 103:6472–6477.
Burton GW, Ingold KU. 1986. Vitamin E: Application of the principles of physical organic chemistry to the exploration of its structure and function. Acc Chem Res 19:194–201.
Burton GW, Joyce A, Ingold KU. 1983. Is vitamin E the only lipid-soluble, chainbreaking antioxidant in human blood plasma and erythrocyte membranes? Arch Biochem Biophys 221:281–290.
Burton GW, Doba T, Gabe EJ, Hughes L, Lee FL, Prasad L, Ingold KU. 1985. Autoxidation of biological molecules. 4. Maximizing the antioxidant activity of phenols. J Am Chem Soc 107:7053–7065.
Burton GW, Traber MG, Acuff RV, Walters DN, Kayden H, Hughes L, Ingold KU. 1998. Human plasma and tissue alpha-tocopherol concentrations in response to supplementation with deuterated natural and synthetic vitamin E. Am J Clin Nutr 67:669–684.
Butte NF, Garza C, Smith EO, Nichols BL. 1984. Human milk intake and growth in exclusively breast-fed infants. J Pediatr 104:187–195.
Cachia O, Benna JE, Pedruzzi E, Descomps B, Gougerot-Pocidalo MA, Leger CL. 1998. Alpha-tocopherol inhibits the respiratory burst in human monocytes. Attenuation of p47(phox) membrane translocation and phosphorylation . J Biol Chem 273:32801–32805.
Calzada C, Bruckdorfer R, Rice-Evans CA. 1997. The influence of antioxidant nutrients on platelet function in healthy volunteers. Atherosclerosis 128:97–105.
Catignani GL, Bieri JG. 1977. Rat liver alpha-tocopherol binding protein. Biochim Biophys Acta 497:349–357.
Cavalier L, Ouahchi K, Kayden HJ, DiDonato S, Reutenauer L, Mandel J-L, Koenig M. 1998. Ataxia with isolated vitamin E deficiency: Heterogeneity of mutations and phenotypic variability in a large number of families. Am J Hum Genet 62:301–310.
Ceballos-Picot I, Nicole A, Briand P, Grimber G, Delacourte A, Defossez A, Javoy-Agid F, Lafon M, Blouin JL, Sinet PM. 1991. Neuronal-specific expression of human copper-zinc superoxide dismutase gene in transgenic mice: Animal model of gene dosage effects in Down 's syndrome. Brain Res 552:198–214.
Ceriello A, Giugliano D, Quatraro A, Donzella C, Dipalo G, Lefebvre PJ. 1991. Vitamin E reduction of protein glycosylation in diabetes. New prospect for prevention of diabetic complications? Diabetes Care 14:68–72.
Chan AC, Leith MK. 1981. Decreased prostacyclin synthesis in vitamin E-deficient rabbit aorta . Am J Clin Nutr 34:2341–2347.
Chan AC, Tran K, Raynor T, Ganz PR, Chow CK. 1991. Regeneration of vitamin E in human platelets. J Biol Chem 266:17290–17295.
Chan AC, Wagner M, Kennedy C, Chen E, Lanuville O, Mezl VA, Tran K, Choy PC. 1998a. Vitamin E up-regulates arachidonic acid release and phospholipase A2 in megakaryocytes. Mol Cell Biochem 189:153–159.
Chan AC, Wagner M, Kennedy C, Mroske C, Proulx P, Laneuville O, Tran K, Choy PC. 1998b. Vitamin E up-regulates phospholipase A2, arachidonic acid release and cyclooxygenasein endothelial cells . Akt Ernahr-Med 23:1–8.
Chappell JE, Francis T, Clandinin MT. 1985. Vitamin A and E content of human milk at early stages of lactation . Early Hum Devel 11:157–167.
Chatelain E, Boscoboinik DO, Bartoli GM, Kagan VE, Gey F, Packer L, Azzi A. 1993. Inhibition of smooth muscle cell proliferation and protein kinase C activity by tocopherols and tocotrienols. Biochim Biophys Acta 1176:83–89.
Cheeseman KH, Holley AE, Kelly FJ, Wasil M, Hughes L, Burton G. 1995. Biokinetics in humans of RRR-alpha-tocopherol: The free phenol, acetate ester, and succinate ester forms of vitamin E. Free Radic Biol Med 19:591–598.
Chen LH, Boissonneault GA, Glauert HP. 1988. Vitamin C, vitamin E and cancer. Anticancer Res 8:739–748.
Chopra RK, Bhagavan HN. 1999. Relative bioavailabilities of natural and synthetic vitamin E formulations containing mixed tocopherols in human subjects. Int J Vitam Nutr Res 69:92–95.
Church DF, Pryor WA. 1985. Free-radical chemistry of cigarette smoke and its toxicological implications . Environ Hlth Perspect 64:111–126.
Clement M, Bourre JM. 1997. Graded dietary levels of RRR-gamma-tocopherol induce a marked increase in the concentrations of alpha- and gammatocopherol in nervous tissues, heart, liver and muscle of vitamin-E-deficient rats. Biochim Biophys Acta 1334:173–1781.
Clement S, Tasinato A, Boscoboinik D, Azzi A. 1997. The effect of alpha-tocopherol on the synthesis, phosphorylation and activity of protein kinase C in smooth muscle cells after phorbol 12-myristate 13-acetate down-regulation. Eur J Biochem 246:745–749.
Cohn W, Loechleiter F, Weber F. 1988. Alpha-tocopherol is secreted from rat liver in very low density lipoproteins . J Lipid Res 29:1359–1366.
Colette C, Pares-Herbute N, Monnier LH, Cartry E. 1988. Platelet function in type I diabetes: Effects of supplementation with large doses of vitamin E. Am J Clin Nutr 47:256–261.
Cominacini L, Garbin U, Pasini AF, Davoli A, Campagnola M, Contessi GB, Pastorino AM, Lo Cascio V. 1997. Antioxidants inhibit the expression of intercellular cell adhesion molecule-1 and vascular cell adhesion molecule-1 induced by oxidized LDL on human umbilical vein endothelial cells. Free Radic Biol Med 22:117–127.
Comstock GW, Bush TL, Helzlsouer K. 1992. Serum retinol, beta-carotene, vitamin E, and selenium as related to subsequent cancer of specific sites. Am J Epidemiol 135:115–121.
Comstock GW, Alberg AJ, Huang HY, Wu K, Burke AE, Hoffman SC, Norkus EP, Gross M, Cutler RG, Morris JS, Spate VL, Helzlsouer KJ. 1997. The risk of developing lung cancer associated with antioxidants in the blood: Ascorbic acid, carotenoids, alpha-tocopherol, selenium, and total peroxyl radical absorbing capacity. Cancer Epidemiol Biomarkers Prev 6:907–916.
Cornett CR, Markesbery WR, Ehmann WD. 1998. Imbalances of trace elements related to oxidative damage in Alzheimer 's disease brain. Neurotoxicology 19:339–345.
Corrigan JJ Jr, Marcus FI. 1974. Coagulopathy associated with vitamin E ingestion. J Am Med Assoc 230:1300–1301.
Cross CE, Eiserich JP, Halliwell B. 1997. General biological consequences of inhaled environmental toxicants . In: Crystal RG, West JB, Barnes PJ, Weibel ER, eds. The Lung: Scientific Foundations, 2nd edition. Philadelphia: LippincottRaven. Pp. 2421–2437.
Cynamon HA, Milov DE, Valenstein E, Wagner M. 1988. Effect of vitamin E deficiency on neurologic function in patients with cystic fibrosis. J Pediatr 113:637–640.
Dam H. 1962. Interrelations between vitamin E and polyunsaturated fatty acids in animals. Vitam Horm 20:527–540.
Davi G, Ciabattoni G, Consoli A, Mezzetti A, Falco A, Santarone S, Pennese E, Vitacolonna E, Bucciarelli T, Costantini F, Capani F, Patrono C. 1999. In vivo formation of 8-iso-prostaglandin F2a and platelet activation in diabetes mellitus. Effects of improved metabolic control and vitamin E supplementation. Circulation 99:224–229.
DeCosse JJ, Miller HH, Lesser ML. 1989. Effect of wheat fiber and vitamins C and E on rectal polyps in patients with familial adenomatous polyposis. J Natl Cancer Inst 81:1290–1297.
Delanty N, Reilly M, Pratico D, FitzGerald DJ, Lawson JA, FitzGerald GA. 1996. 8-Epi PGF2 alpha: Specific analysis of an isoeicosanoid as an index of oxidant stress in vivo. Br J Clin Pharmacol 42:15–19.
DeMaio SJ, King SB 3rd, Lembo NJ, Roubin GS, Hearn JA, Bhagavan HN, Sgoutas DS. 1992. Vitamin E supplementation, plasma lipids and incidence of restenosis after percutaneous transluminal coronary angioplasty (PTCA). J Am Coll Nutr 11:68–73.
Devaraj S, Li D, Jialal I. 1996. The effects of alpha tocopherol supplementation on monocyte function. Decreased lipid oxidation, interleukin 1b secretion, and monocyte adhesion to endothelium. J Clin Invest 98:756–763.
Devaraj S, Adams-Huet B, Fuller CJ, Jialal I. 1997. Dose-response comparison of RRR-alpha-tocopherol and all-racemic alpha-tocopherol on LDL oxidation . Arterioscler Thromb Vasc Biol 17:2273–2279.
de Vries JH, Hollman PC, Meyboom S, Buysman MN, Zock PL, van Staveren WA, Katan MB. 1998. Plasma concentrations and urinary excretion of the antiox dant flavonols quercetin and kaempferol as biomarkers for dietary intake. Am J Clin Nutr 68:60–65.
Dial S, Eitenmiller RR. 1995. Tocopherols and tocotrienols in key foods in the U.S. diet. In: Ong ASH, Niki E, Packer L, eds. Nutrition, Lipids, Health, and Disease. Champaign, IL: AOCS Press. Pp. 327–342.
Dieber-Rotheneder M, Puhl H, Waeg G, Striegl G, Esterbauer H. 1991. Effect of oral supplementation with d-alpha-tocopherol on the vitamin E content of human low density lipoproteins and resistance to oxidation. J Lipid Res 32:1325–1332.
Dimitrov NV, Meyer C, Gilliland D, Ruppenthal M, Chenoweth W, Malone W. 1991. Plasma tocopherol concentrations in response to supplemental vitamin E. Am J Clin Nutr 53:723–729.
Dimitrov NV, Meyer-Leece C, McMillan J, Gilliland D, Perloff M, Malone W. 1996. Plasma alpha-tocopherol concentrations after supplementation with water- and fat-soluble vitamin E. Am J Clin Nutr 64:329–335.
Doba T, Burton GW, Ingold KU. 1985. Antioxidant and co-antioxidant activity of vitamin C. The effect of vitamin C, either alone or in the presence of vitamin E or a water-soluble vitamin E analogue, upon the peroxidation of aqueous multilamellar phospholipid liposomes. Biochim Biophys Acta 835:298–303.
Dorgan JF, Sowell A, Swanson CA, Potischman N, Miller R, Schussler N, Stephenson HE. 1998. Relationships of serum carotenoids, retinol, alpha-tocopherol, and selenium with breast cancer risk: Results from a prospective study in Columbia, Missouri (United States). Cancer Causes Control 9:89–97.
Draper HH. 1993. Interrelationships of vitamin E with other nutrients. In: Packer L, Fuchs J, eds. Vitamin E in Health and Disease. New York: Marcel Dekker. Pp. 53–61.
Duthie GG, Arthur JR, James WP. 1991. Effects of smoking and vitamin E on blood antioxidant status. Am J Clin Nutr 53:1061S–1063S.
Duthie SJ, Ross M, Collins AR. 1995. The influence of smoking and diet on the hypoxanthine phosphoribosyltransferase (hprt) mutant frequency in circulating T lymphocytes from a normal human population. Mutat Res 331:55–64.
Duthie SJ, Ma A, Ross MA, Collins AR. 1996. Antioxidant supplementation d creases oxidative DNA damage in human lymphocytes. Cancer Res 56:1291–1295.
Dysmsza HA, Park J. 1975. Excess dietary vitamin E in rats. Fed Am Soc Exp Biol 34:912.
Egan MF, Hyde TM, Albers GW, Elkashef A, Alexander RC, Reeve A, Blum A, Saenz RE, Wyatt RJ. 1992. Treatment of tardive dyskinesia with vitamin E. Am J Psychiatry 149:773–777.
Eichholzer M, Stahelin HB, Gey KF, Ludin E, Bernasconi F. 1996. Prediction of male cancer mortality by plasma levels of interacting vitamins: 17-year follow-up of the prospective Basel study. Int J Cancer 66:145–150.
Eiserich JP, van der Vliet A, Handelman GJ, Halliwell B, Cross CE. 1995. Dietary antioxidants and cigarette smoke-induced biomolecular damage: A complex interaction. Am J Clin Nutr 62:1490S–1500S.
Eiserich JP, Cross CE, Van der Vliet A. 1997. Nitrogen oxides are important co tributors to cigarette smoke-induced ascorbate oxidation. In: Packer L, Fuchs J, eds. Vitamin C in Health and Disease. New York: Marcel Dekker. Pp. 399–412.
Eitenmiller RR, Landen WO Jr. 1995. Vitamins. In: Jeon IJ, Ikins WG, eds. Analyzing Food for Nutrition Labeling and Hazardous Contaminants. New York: Marcel Dekker. Pp. 195–281.
Elias E, Muller DP, Scott J. 1981. Association of spinocerebellar disorders with cystic fibrosis or chronic childhood cholestasis and very low serum vitamin E. Lancet 2:1319–1321.
Elkashef AM, Ruskin PE, Bacher N, Barrett D. 1990. Vitamin E in the treatment of tardive dyskinesia. Am J Psychiatry 147:505–506.
Ernster VL, Goodson WH, Hunt TK, Petrakis NL, Sickles EA, Miike R. 1985. Vitamin E and benign breast “disease”: A double-blind, randomized clinical trial. Surgery 97:490–494.
Farrell PM, Bieri JG. 1975. Megavitamin E supplementation in man. Am J Clin Nutr 28:1381–1386.
Farrell PM, Bieri JG, Fratantoni JF, Wood RE, Di Sant'Agnese PA. 1977. The occurrence and effects of human vitamin E deficiency. A study in patients with cystic fibrosis. J Clin Invest 60:233–241.
Farrell PM, Mischler EH, Gutcher GR. 1982. Evaluation of vitamin E deficiency in children with lung disease. Ann NY Acad Sci 393:96–108.
Faruqi R, de la Motte C, DiCorleto PE. 1994. Alpha-tocopherol inhibits agonist-induced monocytic cell adhesion to cultured human endothelial cells. J Clin Invest 94:592–600.
Finer, NN, Peters, KL, Hayek, Z, Merkel, CL. 1984. Vitamin E and necrotizing enterocolitis. Pediatrics 73:387-93.
Ford ES, Sowell A. 1999. Serum alpha-tocopherol status in the United States population: Findings from the Third National Health and Nutrition Examination Survey. Am J Epidemiol 150:290–300.
Freedman JE, Farhat JH, Loscalzo J, Keaney JF Jr. 1996. Alpha-tocopherol inhibits aggregation of human platelets by a protein kinase C-dependent mechanism. Circulation 94:2434–2440.
Fuller CJ, Chandalia M, Garg A, Grundy SM, Jialal I. 1996. RRR-alpha-Tocopheryl acetate supplementation at pharmacologic doses decreases low-density-lipoprotein oxidative susceptibility but not protein glycation in patients with diabetes mellitus. Am J Clin Nutr 63:753–759.
Gallo-Torres HE. 1970. Obligatory role of bile for the intestinal absorption of vitamin E. Lipids 5:379–384.
Gascón-Vila P, Garcia-Closas R, Serra-Majem L, Pastor MC, Ribas L, Ramon JM, Marine-Font A, Salleras L. 1997. Determinants of the nutritional status of vitamin E in a non-smoking Mediterranean population. Analysis of the effect of vitamin E intake, alcohol consumption and body mass index on the serum alpha-tocopherol concentration. Eur J Clin Nutr 51:723–728.
Ghalaut VS, Ghalaut PS, Kharb S, Singh GP. 1995. Vitamin E in intestinal fat malabsorption. Ann Nutr Metab 39:296–301.
Gisinger C, Jeremy J, Speiser P, Mikhailidis D, Dandona P, Schernthaner G. 1988. Effect of vitamin E supplementation on platelet thromboxane A2 production in type I diabetic patients. Double-blind crossover trial. Diabetes 37:1260–1264.
GISSI-Prevenzione Investigators. 1999. Dietary supplementation with n-3 polyu saturated fatty acids and vitamin E after myocardial infarction: Results of the GISSI-Prevenzione Trial. Lancet 354:447–455.
Gotoda T, Arita M, Arai H, Inoue K, Yokota T, Fukuo Y, Yazaki Y, Yamada N. 1995. Adult-onset spinocerebellar dysfunction caused by a mutation in the gene for the alpha-tocopherol-transfer protein. N Engl J Med 333:1313–1318.
Greenberg ER, Baron JA, Tosteson TD, Freeman DH, Beck GJ, Bond JH, Colacchio TA, Coller JA, Frankl HD, Haile RW, Mandel JS, Nierenberg DW, Rothstein R, Snover DC, Stevens MM, Summers RW, van Stolk RU. 1994. A clinical trial of antioxidant vitamins to prevent colorectal adenoma . N Engl J Med 331:141–147.
Haddad EH, Berk LS, Kettering JD, Hubbard RW, Peters WR. 1999. Dietary intake and biochemical, hematologic, and immune status of vegans compared with nonvegetarians. Am J Clin Nutr 70:586S–593S.
Halliwell B. 1999. Establishing the significance and optimal intake of dietary anti oxidants: The biomarker concept. Nutr Rev 57:104–113.
Hammans SR, Kennedy CR. 1998. Ataxia with isolated vitamin E deficiency presenting as mutation negative Friedreich's ataxia. J Neurol Neurosurg Psychiatry 64:368–370.
Handelman GJ, Epstein WL, Peerson J, Spiegelman D, Machlin LJ, Dratz EA. 1994. Human adipose alpha-tocopherol and gamma-tocopherol kinetics during and after 1 y of alpha-tocopherol supplementation. Am J Clin Nutr 59:1025–1032.
Hankinson SE, Stampfer MJ, Seddon JM, Colditz GA, Rosner B, Speizer FE, Willett WC. 1992. Nutrient intake and cataract extraction in women: A prospective study . Br Med J 305:335–339.
Harding AE, Matthews S, Jones S, Ellis CJ, Booth IW, Muller DP. 1985. Spinocerebellar degeneration associated with a selective defect of vitamin E absorption. N Engl J Med 313:32–35.
Harries JT, Muller DP. 1971. Absorption of different doses of fat soluble and water miscible preparations of vitamin E in children with cystic fibrosis. Arch Dis Child 46:341–344.
Hartz SC, Otradovec CL, McGandy RB, Russell RM, Jacob RA, Sahyoun N, Peters H, Abrams D, Scura LA, Whinston-Perry RA. 1988. Nutrient supplement use by healthy elderly. J Am Coll Nutr 7:119–128.
Hartz SC, Russell RM, Rosenberg IH. 1992. Nutrition in the Elderly. The Boston Nutritional Status Survey. London: Smith-Gordon. P. 106–108.
Hassan H, Hashim SA, Van Itallie TB, Sebrell WH. 1966. Syndrome in premature infants associated with low plasma vitamin E levels and high polyunsaturated fatty acid diet. Am J Clin Nutr 19:147–157.
Heinig MJ, Nommsen LA, Peerson JM, Lonnerdal B, Dewey KG. 1993. Energy and protein intakes of breast-fed and formula-fed infants during the first year of life and their association with growth velocity: The DARLING Study. Am J Clin Nutr 58:152–161.
Heinonen OP, Albanes D, Virtamo J, Taylor PR, Huttunen JK, Hartman AM, Haapakoski J, Malila N, Rautalahti M, Ripatti S, Mäenpää H, Teerenhovi L, Koss L, Virolainen M, Edwards BK. 1998. Prostate cancer and supplementation with alpha-tocopherol and beta-carotene: Incidence and mortality in a controlled trial. J Natl Cancer Inst 90:440–446.
Higashi O, Kikuchi Y. 1974. Effects of vitamin E on the aggregation and the lipid peroxidation of platelets exposed to hydrogen peroxide. Tohoku J Exp Med 112:271–278.
Hodis HN, Mack WJ, LaBree L, Cashin-Hemphill L, Sevanian A, Johnson R, Azen SP. 1995. Serial coronary angiographic evidence that antioxidant vitamin i take reduces progression of coronary artery atherosclerosis. J Am Med Assoc 273:1849–1854.
Hofstad B, Almendingen K, Vatn M, Andersen S, Owen R, Larsen S, Osnes M. 1998. Growth and recurrence of colorectal polyps: A double-blind 3-year inte vention with calcium and antioxidants. Digestion 59:148–156.
HOPE Study Investigators. 2000. Vitamin E supplementation and cardiovascular events in high-risk patients. N Engl J Med 342:154–160.
Horwitt MK. 1960. Vitamin E and lipid metabolism in man. Am J Clin Nutr 8:451–461.
Horwitt MIC 1962. Interrelations between vitamin E and polyunsaturated fatty a ids in adult men. Vitam Horm 20:541–558.
Horwitt MK. 1974. Status of human requirements for vitamin E. Am J Clin Nutr 27:1182–1193.
Horwitt MK. 1976. Vitamin E: A reexamination. Am J Clin Nutr 29:569–578.
Horwitt MK, Harvey CC, Duncan GD, Wilson WC. 1956. Effects of limited tocopherol intake in man with relationships to erythrocyte hemolysis and lipid oxidations. Am J Clin Nutr 4:408–419.
Horwitt MK, Century B, Zeman AA. 1963. Erythrocyte survival time and reticul cyte levels after tocopherol depletion in man. Am J Clin Nutr 12:99–106.
Horwitt MK, Harvey CC, Dahm CH, Searcy MT. 1972. Relationship between tocopherol and serum lipid levels for determination of nutritional adequacy. Ann NY Acad Sci 203:223–236.
Hosomi A, Arita M, Sato Y, Kiyose C, Ueda T, Igarashi O, Arai H, Inoue K. 1997. Affinity for alpha-tocopherol transfer protein as a determinant of the biological activities of vitamin E analogs. FEBS Lett 409:105–108.
Ingold KU, Webb AC, Witter D, Burton GW, Metcalfe TA, Muller DPR. 1987. Vitamin E remains the major lipid-soluble, chain-breaking antioxidant in h man plasma even in individuals suffering severe vitamin E deficiency . Arch Biochem Biophys 259:224–225.
IOM (Institute of Medicine). 1991. Nutrition During Lactation. Washington, DC: National Academy Press. P. 179.
Ishizuka T, Itaya S, Wada H, Ishizawa M, Kimura M, Kajita K, Kanoh Y, Miura A, Muto N, Yasuda K. 1998. Differential effect of the antidiabetic thiazolidined ones troglitazone and pioglitazone on human platelet aggregation mechanism. Diabetes 47:1494–1500.
Islam KN, Devaraj S, Jialal I. 1998. Alpha-tocopherol enrichment of monocytes decreases agonist-induced adhesion to human endothelial cells. Circulation 98:2255–2261.
IUPAC-IUB Commission on Biochemical Nomenclature. 1974. Nomenclature of tocopherols and related compounds. Recommendations 1973. Eur J Biochem 46:217–219.
Jacob RA, Kutnink MA, Csallany AS, Daroszewska M, Burton GW. 1996. Vitamin C nutriture has little short-term effect on vitamin E concentrations in healthy women. J Nutr 126:2268–2277.
Jacques PF, Chylack LT Jr. 1991. Epidemiologic evidence of a role for the antiox dant vitamins and carotenoids in cataract prevention. Am J Clin Nutr 53:352S–355S.
Jacques PF, Chylack LT Jr, Taylor A. 1994. Relationships between natural antiox dants and cataract formation . In: Frei B, ed. Natural Antioxidants in Human Health and Disease. San Diego: Academic Press. Pp. 515–529.
Jain SK, McVie R, Jaramillo JJ, Palmer M, Smith T. 1996a. Effect of modest vitamin E supplementation on blood glycated hemoglobin and triglyceride levels and red cell indices in type I diabetic patients . J Am Coll Nutr 15:458–461.
Jain SK, McVie R, Jaramillo JJ, Palmer M, Smith T, Meachum ZD, Little RL. 1996b. The effect of modest vitamin E supplementation on lipid peroxidation pro ucts and other cardiovascular risk factors in diabetic patients . Lipids 31:S87–S90.
Jain SK, Krueger KS, McVie R, Jaramillo JJ, Palmer M, Smith T. 1998. Relationship of blood thromboxane-B2 (TxB2) with lipid peroxides and effect of vitamin E and placebo supplementation on TxB2 and lipid peroxide levels in type 1 diabetic patients. Diabetes Care 21:1511–1516.
Jansson L, Akesson B, Holmberg L. 1981. Vitamin E and fatty acid composition of human milk. Am J Clin Nutr 34:8–13.
Jialal I, Fuller CJ, Huet BA. 1995. The effect of alpha-tocopherol supplementation on LDL oxidation. A dose-response study. Arterioscler Thromb Vasc Biol 15:190–198.
Johnson L, Bowen FW, Abbasi S, Herrmann N, Weston M, Sacks L, Porat R, Stahl G, Peckham G, Delivoria-Papadopoulos M, Quinn G, Schaffer D. 1985. Relationship of prolonged pharmacologic serum levels of vitamin E to incidence of sepsis and necrotizing enterocolitis in infants with birth weight 1,500 grams or less. Pediatrics 75:619–638.
Jones PJH, Kubow S. 1999. Lipids, sterols and their metabolism. In: Shils ME, Olson JA, Shike M, Ross AC, eds. Modern Nutrition in Health and Disease, 9th edition. Baltimore, MD: Williams & Wilkins. Pp. 347–362.
Kalra V, Grover J, Ahuja GK, Rathi S, Khurana DS. 1998. Vitamin E deficiency and associated neurological deficits in children with protein-energy malnutrition. J Trop Pediatr 44:291–295.
Kamal-Eldin A, Appelqvist LA. 1996. The chemistry and antioxidant properties of tocopherols and tocotrienols . Lipids 31:671–701.
Kantoci D, Wechter WJ, Murray ED Jr, Dewind SA, Borchardt D, Khan SI. 1997. Endogenous natriuretic factors 6: The stereochemistry of a natriuretic gamma-tocopherol metabolite LLU-alpha. J Pharmacol Exp Ther 282:648–656.
Kappus H, Diplock AT. 1992. Tolerance and safety of vitamin E: A toxicological position report . Free Radic Biol Med 13:55–74.
Kardinaal AF, van ‘t Veer P, Brants HA, van den Berg H, van Schoonhoven J, Hermus RJ. 1995. Relations between antioxidant vitamins in adipose tissue, plasma, and diet. Am J Epidemiol 141:440–450.
Kayden HJ, Hatam LJ, Traber MG. 1983. The measurement of nanograms of tocopherol from needle aspiration biopsies of adipose tissue: Normal and abetalipoproteinemic subjects . J Lipid Res 24:652–656.
Kelleher J, Losowsky MS. 1970. The absorption of alpha-tocopherol in man. Br J Nutr 24:1033–1047.
Keller JN, Pang Z, Geddes JW, Begley JG, Germeyer A, Waeg G, Mattson MP. 1997. Impairment of glucose and glutamate transport and induction of mitocho drial oxidative stress and dysfunction in synaptosomes by amyloid beta-peptide: Role of the lipid peroxidation product 4-hydroxynonenal . J Neurochem 69:273–284.
Kim JM, White RH. 1996. Effect of vitamin E on the anticoagulant response to warfarin. Am J Cardiol 77:545–546.
Kitagawa M, Mino M. 1989. Effects of elevated alpha (RRR)-tocopherol dosage in man. J Nutr Sci Vitaminol 35:133–142.
Kiyose C, Muramatsu R, Fujiyama-Fujiwara Y, Ueda T, Igarashi O. 1995. Biodiscrimination of alpha-tocopherol stereoisomers during intestinal absorption. Lipids 30:1015–1018.
Kiyose C, Muramatsu R, Kameyama Y, Ueda T, Igarashi O. 1997. Biodiscrimination of alpha-tocopherol stereoisomers in humans after oral administration. Am J Clin Nutr 65:785–789.
Klein T, Reutter F, Schweer H, Seyberth HW, Nusing RM. 1997. Generation of the isoprostane 8-epi-prostaglandin F2alpha in vitro and in vivo via the cyclooxygenases. J Pharmacol Exp Ther 282:1658–1665.
Knekt P, Aromaa A, Maatela J, Aaran RK, Nikkari T, Hakama M, Hakulinen T, Peto R, Saxen E, Teppo L. 1988. Serum vitamin E and risk of cancer among Finnish men during a 10-year follow-up. Am J Epidemiol 127:28–41.
Knekt P, Heliovaara M, Rissanen A, Aromaa A, Aaran RK. 1992. Serum antioxidant vitamins and risk of cataract. Br Med J 305:1392–1394.
Knekt P, Reunanen A, Jarvinen R, Seppanen R, Heliovaara M, Aromaa A. 1994. Antioxidant vitamin intake and coronary mortality in a longitudinal population study. Am J Epidemiol 139:1180–1189.
Kobayashi H, Kanno C, Yamauchi K, Tsugo T. 1975. Identification of alpha-, beta-, gamma-, and delta-tocopherols and their contents in human milk. Biochim Biophys Acta 380:282–290.
Kohlschütter A, Hubner C, Jansen W, Lindner SG. 1988. A treatable familial ne romyopathy with vitamin E deficiency, normal absorption, and evidence of increased consumption of vitamin E. J Inher Metab Dis 11:149–152.
Kostner GM, Oettl K, Jauhiainen M, Ehnholm C, Esterbauer H, Dieplinger H. 1995. Human plasma phospholipid transfer protein accelerates exchange/transfer of alpha-tocopherol between lipoproteins and cells. Biochem J 305:659–667.
Krasavage WJ, Terhaar CJ. 1977. d-alpha-Tocopheryl poly(ethylene glycol) 1000 succinate. Acute toxicity, subchronic feeding, reproduction, and teratologic studies in the rat. J Agric Food Chem 25:273–278.
Krendel DA, Gilchrist JM, Johnson AO, Bossen EH. 1987. Isolated deficiency of vitamin E with progressive neurologic deterioration . Neurology 37:538–540.
Kuhlenkamp J, Ronk M, Yusin M, Stolz A, Kaplowitz N. 1993. Identification and purification of a human liver cytosolic tocopherol binding protein. Protein Expr Purif 4:382–389.
Kunisaki M, Umeda F, Inoguchi T, Watanabe J, Nawata H. 1990. Effects of vitamin E administration on platelet function in diabetes mellitus. Diabetes Res 14:37–42.
Kunisaki M, Bursell SE, Umeda F, Nawata H, King GL. 1994. Normalization of diacylglycerol-protein kinase C activation by vitamin E in aorta of diabetic rats and cultured rat smooth muscle cells exposed to elevated glucose levels. Diab tes 43:1372–1377.
Kushi LH, Folsom AR, Prineas RJ, Mink PJ, Wu Y, Bostick RM. 1996. Dietary antioxidant vitamins and death from coronary heart disease in postmenopausal women. N Engl J Med 334:1156–1162.
Laditan AA, Ette SI. 1982. Plasma alpha-tocopherol (vitamin E) levels and tocopherol-lipid ratio among children with protein-energy malnutrition (PEM). Ann Trop Paediatr 2:85–88.
Lammi-Keefe CJ, Jensen RG, Clark RM, Ferris AM. 1985. Alpha tocopherol, total lipid and linoleic acid contents of human milk at 2, 6, 12, and 16 weeks. In: Schaub J, ed. Composition and Physiological Properties of Human Milk. New York: Elsevier Science. Pp. 241–245.
Lammi-Keefe CJ, Ferris AM, Jensen RG. 1990. Changes in human milk at 0600, 1000, 1400, 1800, and 2200 h. J Pediatr Gastroenterol Nutr 11:83–88.
Laplante P, Vanasse M, Michaud J, Geoffroy G, Brochu P. 1984. A progressive neurological syndrome associated with an isolated vitamin E deficiency. Can J Neurol Sci 11:561–564.
Lehmann J, Martin HL, Lashley EL, Marshall MW, Judd JT. 1986. Vitamin E in foods from high and low linoleic acid diets. J Am Diet Assoc 86:1208–1216.
Leo MA, Ahmed S, Aleynik SI, Siegel JH, Kasmin F, Lieber CS. 1995. Carotenoids and tocopherols in various hepatobiliary conditions. J Hepatol 23:550–556.
Leske MC, Chylack LT Jr, Wu SY. 1991. The Lens Opacities Case-Control Study. Risk factors for cataract. Arch Ophthalmol 109:244–251.
Lohr JB, Cadet JL, Lohr MA, Jeste DV, Wyatt RJ. 1987. Alpha-tocopherol in tardive dyskinesia. Lancet 1:913–914.
Lohr JB, Kuczenski R, Bracha HS, Moir M, Jeste DV. 1990. Increased indices of free radical activity in the cerebrospinal fluid of patients with tardive dyskinesia. Biol Psychiatry 28:535–539.
London RS, Sundaram GS, Murphy L, Manimekalai S, Reynolds M, Goldstein PJ. 1985. The effect of vitamin E on mammary dysplasia: A double-blind study . Obstet Gynecol 65:104–106.
Losonczy KG, Harris TB, Havlik RJ. 1996. Vitamin E and vitamin C supplement use and risk of all-cause and coronary heart disease mortality in older persons: The Established Populations for Epidemiologic Studies of the Elderly. Am J Clin Nutr 64:190–196.
Losowsky MS, Kelleher J, Walker BE, Davies T, Smith CL. 1972. Intake and absorption of tocopherol. Ann NY Acad Sci 203:212–222.
Machlin LJ. 1989. Use and safety of elevated dosages of vitamin E in adults. Int J Vitam Nutr Res 30:56–68.
MacMahon MT, Neale G. 1970. The absorption of alpha-tocopherol in control subjects and in patients with intestinal malabsorption. Clin Sci 38:197–210.
Manach C, Morand C, Crespy V, Demigne C, Texier O, Regerat F, Remesy C. 1998. Quercetin is recovered in human plasma as conjugated derivatives which retain antioxidant properties. FEBS Lett 426:331–336.
Mandel CH, Mosca L, Maimon E, Sievers J, Tsai A, Rock CL. 1997. Dietary intake and plasma concentrations of vitamin E, vitamin C, and beta carotene in patients with coronary artery disease. J Am Diet Assoc 97:655–657.
March BE, Wong E, Seier L, Sim J, Biely J. 1973. Hypervitaminosis E in the chick. J Nutr 103:371–377.
Mares-Perlman JA, Brady WE, Klein R, Klein BE, Palta M, Bowen P, Stacewicz-Sapuntzakis M. 1994a. Serum levels of carotenoids and tocopherols in people with age-related maculopathy. Invest Ophthalmol Vis Sci 35:2004.
Mares-Perlman JA, Klein BE, Klein R, Ritter LL. 1994b. Relation between lens opacities and vitamin and mineral supplement use. Ophthalmology 101:315–325.
Martin A, Foxall T, Blumberg JB, Meydani M. 1997. Vitamin E inhibits low-density lipoprotein-induced adhesion of monocytes to human aortic endothelial cells in vitro. Arterioscler Thromb Vasc Biol 17:429–436.
Martinello F, Fardin P, Ottina M, Ricchieri GL, Koenig M, Cavalier L, Trevisan CP. 1998. Supplemental therapy in isolated vitamin E deficiency improves the peripheral neuropathy and prevents the progression of ataxia. J Neurol Sci 156:177–179.
McCay PB. 1985. Vitamin E: Interactions with free radicals and ascorbate. Annu Rev Nutr 5:323–340.
McKeown-Eyssen G, Holloway C, Jazmaji V, Bright-See E, Dion P, Bruce WR. 1988. A randomized trial of vitamins C and E in the prevention of recurrence of colorectal polyps. Cancer Res 48:4701–4705.
McLaughlin PJ, Weihrauch JL. 1979. Vitamin E content of foods. J Am Diet Assoc 75:647–665.
Mellette SJ, Leone LA. 1960. Influence of age, sex, strain of rat and fat soluble vitamins on hemorrhagic syndromes in rats fed irradiated beef. New Aspects Nutr 19:1045–1049.
Mertz W, Tsui JC, Judd JT, Reiser S, Hallfrisch J, Morris ER, Steele PD, Lashley E. 1991. What are people really eating? The relation between energy intake d rived from estimated diet records and intake determined to maintain body weight. Am J Clin Nutr 54:291–295.
Meydani M, Cohn JS, Macauley JB, McNamara JR, Blumberg JB, Schaefer EJ. 1989. Postprandial changes in the plasma concentration of alpha- and gamma tocopherol in human subjects fed a fat-rich meal supplemented with fat-soluble vitamins. J Nutr 119:1252–1258.
Meydani SN, Meydani M, Blumberg JB, Leka LS, Siber G, Loszewski R, Thompson C, Pedrosa MC, Diamond RD, Stollar BD. 1997. Vitamin E supplementation and in vivo immune response in healthy elderly subjects. A randomized controlled trial. J Am Med Assoc 277:1380–1386.
Meydani SN, Meydani M, Blumberg JB, Leka LS, Pedrosa M, Diamond R, Schaefer EJ. 1998. Assessment of the safety of supplementation with different amounts of vitamin E in healthy older adults. Am J Clin Nutr 68:311–318.
Mezzetti A, Lapenna D, Pierdomenico SD, Calafiore AM, Costantini F, Riario-Sforza G, Imbastaro T, Neri M, Cuccurullo F. 1995. Vitamins E, C and lipid peroxidation in plasma and arterial tissue of smokers and non-smokers. Atherosclerosis 112:91–99.
Mohan M, Sperduto R, Angra S, Milton R, Mathur R, Underwood B, Jaffery N, Pandya C, Chhabra V, Vajpayee RB. 1989. India-US case-control study of agerelated cataracts. India-US Case-Control Study Group. Arch Ophthalmol 107:670–676.
Molenaar R, Visser WJ, Verkerk A, Koster JF, Jongkind JF. 1989. Peroxidative stress and in vitro ageing of endothelial cells increases the monocyte-endothelial cell adherence in a human in vitro system . Atherosclerosis 76:193–202.
Moore AN, Ingold KU. 1997. Alpha-tocopheryl quinone is converted into vitamin E in man. Free Radic Biol Med 22:931–934.
Moore K, Roberts LJ II. 1998. Measurement of lipid peroxidation. Free Radic Res 28:659–671.
Morrow JD, Frei B, Longmire AW, Gaziano JM, Lynch SM, Shyr Y, Strauss WE, Oates JA, Roberts LJ II. 1995. Increase in circulating products of lipid peroxidation (F2-isoprostanes) in smokers. N Engl J Med 332:1198–1203.
Morrow JD, Zackert WE, Yang JP, Kurhts EH, Callewaert D, Dworski R, Kanai K, Taber D, Moore K, Oates JA, Roberts LJ. 1999. Quantification of the major urinary metabolite of 15-F2t-isoprostane (8-iso-PGF2alpha) by a stable isotope dilution mass spectrometric assay. Anal Biochem 269:326–331.
Moss AJ, Levy AS, Kim I, Park YK. 1989. Use of Vitamin and Mineral Supplements in the United States: Current Users, Types of Products, and Nutrients. Advance Data, Vital and Health Statistics of the National Center for Health Statistics. Number 174. Hyattsville, MD: National Center for Health Statistics.
Mullarkey CJ, Edelstein D, Brownlee M. 1990. Free radical generation by early glycation products: A mechanism for accelerated atherogenesis in diabetes. Biochem Biophys Res Commun 173:932–939.
Muller DP. 1994. Vitamin E and other antioxidants in neurological function and disease . In: Frei B, ed. Natural Antioxidants in Human Health and Disease. San Diego: Academic Press. Pp. 535–565.
Muller DP, Harries JT, Lloyd JK. 1974. The relative importance of the factors involved in the absorption of vitamin E in children. Gut 15:966–971.
Muller DP, Lloyd JK, Wolff OH. 1985. The role of vitamin E in the treatment of the neurological features of abetalipoproteinaemia and other disorders of fat absorption. J Inherit Metab Dis 8:88–92.
Murphy SP, Subar AF, Block G. 1990. Vitamin E intakes and sources in the United States. Am J Clin Nutr 52:361–367.
Murray ED Jr, Wechter WJ, Kantoci D, Wang WH, Pham T, Quiggle DD, Gibson KM, Leipold D, Anner B. 1997. Endogenous natriuretic factors 7: Biospecificity of a natriuretic gamma-tocopherol metabolite LLU-alpha. J Pharmacol Exp Ther 282:657–662.
Niki E. 1987. Antioxidants in relation to lipid peroxidation. Chem Phys Lipids 44:227–253.
Niki E, Tsuchiya J, Tanimura R, Kamiya Y. 1982. Regeneration of vitamin E from alpha-chromanoxyl radical by glutathione and vitamin C. Chem Lett 6:789–792.
NRC (National Research Council). 1989. Recommended Dietary Allowances, 10th edition. Washington, DC: National Academy Press.
O'Neill CA, Halliwell B, van der Vliet A, Davis PA, Packer L, Tritschler H, Strohman WJ, Rieland T, Cross CE, Reznick AZ. 1994. Aldehyde-induced protein modifications in human plasma: Protection by glutathione and dihydrolipoic acid. J Lab Clin Med 124:359–370.
Oski FA, Barness LA. 1967. Vitamin E deficiency: A previously unrecognized cause of hemolytic anemia in the premature infant. J Pediatr 70:211–220.
Packer L. 1994. Vitamin E is nature's master antioxidant. Sci Am Sci Med 1:54–63.
Pallast EG, Schouten EG, de Waart FG, Fonk HC, Doekes G, von Blomberg BM, Kok FJ. 1999. Effect of 50- and 100-mg vitamin E supplements on cellular immune function in noninstitutionalized elderly persons. Am J Clin Nutr 69:1273–1281.
Paolisso G, D'Amore A, Galzerano D, Balbi V, Giugliano D, Varricchio M, D'Onofrio F. 1993. Daily vitamin E supplements improve metabolic control but not insulin secretion in elderly type II diabetic patients. Diabetes Care 16:1433–1437.
Parker RA, Sabrah T, Cap M, Gill BT. 1995. Relation of vascular oxidative stress, alpha-tocopherol, and hypercholesterolemia to early atherosclerosis in hamsters. Arterioscler Thromb Vasc Biol 15:349–358.
Parker RS. 1988. Carotenoid and tocopherol composition of human adipose tissue. Am J Clin Nutr 47:33–36.
Parkinson Study Group. 1993. Effects of tocopherol and deprenyl on the progre sion of disability in early Parkinson's disease. N Engl J Med 328:176–183.
Parkinson Study Group. 1998. Mortality in DATATOP: A multicenter trial in early Parkinson's disease. Ann Neurol 43:318–325.
Peng Y-S, Peng Y-M, McGee D, Alberts D. 1994. Carotenoids, tocopherols, and retinoids in human buccal mucosal cells: Intra- and interindividual variability and storage stability. Am J Clin Nutr 59:636–643.
Phelps DL, Rosenbaum AL, Isenberg SJ, Leake RD, Dorey FJ. 1987. Tocopherol efficacy and safety for preventing retinopathy of prematurity: A randomized, controlled, double-masked trial. Pediatrics 79:489–500.
Pratico D, Tangirala RK, Rader DJ, Rokach J, FitzGerald GA. 1998. Vitamin E suppresses isoprostane generation in vivo and reduces atherosclerosis in ApoE-deficient mice. Nat Med 4:1189–1192.
Pratico D, Rokach J, Tangirala RK, 1999. Brains of aged apolipoprotein E-deficient mice have increased levels of F2-isoprostanes, in vivo markers of lipid peroxidation. J Neurochem 73:736–741.
Princen HMG, van Duyvenvoorde W, Buytenhek R, van der Laarse A, van Poppel G, Gevers Leuven JA, van Hinsbergh VWM. 1995. Supplementation with low doses of vitamin E protects LDL from lipid peroxidation in men and women. Arterioscler Thromb Vasc Biol 15:325–333.
Pryor WA, Stone K. 1993. Oxidants in cigarette smoke. Radicals, hydrogen peroxide, peroxynitrate, and peroxynitrite. Ann NY Acad Sci 686:12–27.
Rader DJ, Brewer HB. 1993. Abetalipoproteinemia. New insights into lipoprotein assembly and vitamin E metabolism from a rare genetic disease. J Am Med Assoc 270:865–869.
Rapola JM, Virtamo J, Ripatti S, Huttunen JK, Albanes D, Taylor PR, Heinonen OP. 1997. Randomised trial of alpha-tocopherol and beta-carotene suppl ments on incidence of major coronary events in men with previous myocardial infarction. Lancet 349:1715–1720.
Reaven P. 1995. Dietary and pharmacologic regimens to reduce lipid peroxidation in non-insulin-dependent diabetes mellitus. Am J Clin Nutr 62:1483S–1489S.
Reaven PD, Khouw A, Beltz WF, Parthasarathy S, Witztum JL. 1993. Effect of d etary antioxidant combinations in humans. Protection of LDL by vitamin E but not by beta-carotene. Arterioscler Thromb 13:590–600.
Reaven PD, Herold DA, Barnett J, Edelman S. 1995. Effects of vitamin E on susce tibility of low-density lipoprotein and low-density lipoprotein subfractions to oxidation and on protein glycation in NIDDM. Diabetes Care 18:807–816.
Refat M, Moore TJ, Kazui M, Risby TH, Perman JA, Schwarz KB. 1991. Utility of breath ethane as a noninvasive biomarker of vitamin E status in children. Pediatr Res 30:396–403
Reilly M, Delanty N, Lawson JA, Fitzgerald GA. 1996. Modulation of oxidant stress in vivo in chronic cigarette smokers . Circulation 94:19–25.
Retzlaff BM, Dowdy AA, Walden CE, McCann BS, Gey G, Cooper M, Knopp RH. 1991. Changes in vitamin and mineral intakes and serum concentrations among free-living men on cholesterol-lowering diets: The Dietary Alternatives Study. Am J Clin Nutr 53:890–898.
Rimm EB, Stampfer MJ, Ascherio A, Giovannucci E, Colditz GA, Willett WC. 1993. Vitamin E consumption and the risk of coronary heart disease in men . N Engl J Med 328:1450–1456.
Ritchie JH, Fish MB, McMasters V, Grossman M. 1968. Edema and hemolytic anemia in premature infants. A vitamin E deficiency syndrome. N Engl J Med 279:1185–1190.
Robertson JM, Donner AP, Trevithick JR. 1989. Vitamin E intake and risk of cataracts in humans. Ann NY Acad Sci 570:372–382.
Ross MA, Crosley LK, Brown KM, Duthie SJ, Collins AC, Arthur JR, Duthie GG. 1995. Plasma concentrations of carotenoids and antioxidant vitamins in Sco tish males: Influences of smoking. Eur J Clin Nutr 49:861–865.
Rota S, McWilliam NA, Baglin TP, Byrne CD. 1998. Atherogenic lipoproteins su port assembly of the prothrombinase complex and thrombin generation: Modulation by oxidation and vitamin E. Blood 91:508–515.
Sano M, Ernesto C, Thomas RG, Klauber MR, Schafer K, Grundman M, Woodbury P, Growdon J, Cotman CW, Pfeiffer E, Schneider LS, Thal LJ. 1997. A controlled trial of selegiline, alpha-tocopherol, or both as treatment for Alzheimer's disease. The Alzheimer's Disease Cooperative Study. N Engl J Med 336:1216–1222.
Sarkkinen ES, Uusitupa MI, Nyyssonen K, Parviainen M, Penttila I, Salonen JT. 1993. Effects of two low-fat diets, high and low in polyunsaturated fatty acids, on plasma lipid peroxides and serum vitamin E levels in free-living hypercholesterolaemic men. Eur J Clin Nutr 47:623–630.
Sato Y, Hagiwara K, Arai H, Inoue K. 1991. Purification and characterization of the alpha-tocopherol transfer protein from rat liver. FEBS Lett 288:41–45.
Schuelke M, Mayatepek E, Inter M, Becker M, Pfeiffer E, Speer A, Hubner C, Finckh B. 1999. Treatment of ataxia in isolated vitamin E deficiency caused by alpha-tocopherol transfer protein deficiency. J Pediatr 134:240–244.
Schultz M, Leist M, Petrzika M, Gassmann B, Brigelius-Flohé R. 1995. Novel ur nary metabolite of alpha-tocopherol, 2,5,7,8-tetramethyl-2(2 ′-carboxyethyl)-6-hydroxychroman, as an indicator of an adequate vitamin E supply? Am J Clin Nutr 62:1527S–1534S.
Schultz M, Leist M, Elsner A, Brigelius-Flohé R. 1997. Alpha-carboxyethyl-6-h droxychroman as urinary metabolite of vitamin E. Methods Enzymol 282:297–310.
Schwab US, Sarkkinen ES, Lichtenstein AH, Li Z, Ordovas JM, Schaefer EJ, Uusitupa MI. 1998a. The effect of quality and amount of dietary fat on the suscept bility of low density lipoprotein to oxidation in subjects with impaired glucose tolerance. Eur J Clin Nutr 52:452–458.
Schwab US, Vogel S, Lammi-Keefe CJ, Ordovas JM, Schaefer EJ, Li Z, Ausman LM, Gualtieri L, Goldin BR, Furr HC, Lichtenstein AH. 1998b. Varying dietary fat type of reduced-fat diets has little effect on the susceptibility of LDL to oxidative modification in moderately hypercholesterolemic subjects. J Nutr 128:1703–1709.
Semenkovich CF, Heinecke JW. 1997. The mystery of diabetes and atherosclerosis: Time for a new plot. Diabetes 46:327–334.
Sheppard AJ, Pennington JAT, Weihrauch JL. 1993. Analysis and distribution of vitamin E in vegetable oils and foods . In: Packer L, Fuchs J, eds. Vitamin E in Health and Disease. New York: Marcel Dekker. Pp. 9–31.
Shorer Z, Parvari R, Bril G, Sela BA, Moses S. 1996. Ataxia with isolated vitamin E deficiency in four siblings. Pediatr Neurol 15:340–343.
Shoulson I. 1998. DATATOP: A decade of neuroprotective inquiry. Parkinson Study Group. Deprenyl and Tocopherol Antioxidative Therapy of Parkinsonism. Ann Neurol 44:S160–S166.
Slesinski MJ, Subar AF, Kahle LL. 1996. Dietary intake of fat, fiber and other nutrients is related to the use of vitamin and mineral supplements in the United States: The 1992 National Health Interview Survey. J Nutr 126:3001–3008.
Smith MA, Harris PL, Sayre LM, Perry G. 1997. Iron accumulation in Alzheimer disease is a source of redox-generated free radicals. Proc Natl Acad Sci USA 94:9866–9868.
Sokol RJ. 1988. Vitamin E deficiency and neurologic disease. Annu Rev Nutr 8:351–373.
Sokol RJ. 1993. Vitamin E deficiency and neurological disorders. In: Packer L, Fuchs J, eds. Vitamin E in Health and Disease. New York: Marcel Dekker. Pp. 815–849.
Sokol RJ, Heubi JE, Iannaccone S, Bove KE, Balistreri WF. 1983. Mechanism causing vitamin E deficiency during chronic childhood cholestasis . Gastroenterology 85:1172–1182.
Sokol RJ, Heubi JE, Iannaccone ST, Bove KE, Balistreri WF. 1984. Vitamin E def ciency with normal serum vitamin E concentrations in children with chronic cholestasis. N Engl J Med 310:1209–1212.
Sokol RJ, Guggenheim M, Iannaccone ST, Barkhaus PE, Miller C, Silverman A, Balistreri WF, Heubi JE. 1985. Improved neurologic function after long-term correction of vitamin E deficiency in children with chronic cholestasis. N Engl J Med 313:1580–1586.
Sokol RJ, Kayden HJ, Bettis DB, Traber MG, Neville H, Ringel S, Wilson WB, Stumpf DA. 1988. Isolated vitamin E deficiency in the absence of fat mala sorption —Familial and sporadic cases: Characterization and investigation of causes. J Lab Clin Med 111:548–559.
Sokol RJ, Reardon MC, Accurso FJ, Stall C, Narkewicz M, Abman SH, Hammond KB. 1989. Fat-soluble-vitamin status during the first year of life in infants with cystic fibrosis identified by screening of newborns. Am J Clin Nutr 50:1064–1071.
Sokol RJ, Butler-Simon N, Conner C, Heubi JE, Sinatra FR, Suchy FJ, Heyman MB, Perrault J, Rothbaum RJ, Levy J, Iannaccone ST, Shneider BL, Koch TK, Narkewicz MR. 1993. Multicenter trial of d-alpha-tocopheryl polyethylene gl col 1000 succinate for treatment of vitamin E deficiency in children with chronic cholestasis. Gastroenterology 104:1727–1735.
Sparrow CP, Doebber TW, Olszewski J, Wu MS, Ventre J, Stevens KA, Chao YS. 1992. Low density lipoprotein is protected from oxidation and the progre sion of atherosclerosis is slowed in cholesterol-fed rabbits by the antioxidant N,N'-diphenyl-phenylenediamine. J Clin Invest 89:1885–1891.
Speer ME, Blifeld C, Rudolph AJ, Chadda P, Holbein ME, Hittner HM. 1984. Intraventricular hemorrhage and vitamin E in the very low-birth-weight infant: Evidence for efficacy of early intramuscular vitamin E administration . Pediatrics 74:1107–1112.
Stampfer MJ, Hennekens CH, Manson JE, Colditz GA, Rosner B, Willett WC. 1993. Vitamin E consumption and the risk of coronary disease in women. N Engl J Med 328:1444–1449.
Stauble B, Boscoboinik D, Tasinato A, Azzi A. 1994. Modulation of activator pr tein-1 (AP-1) transcription factor and protein kinase C by hydrogen peroxide and d-alpha-tocopherol in vascular smooth muscle cells. Eur J Biochem 226:393–402.
Stead RJ, Muller DP, Matthews S, Hodson ME, Batten JC. 1986. Effect of abnormal liver function on vitamin E status and supplementation in adults with cystic fibrosis. Gut 27:714–718.
Steinberg D. 1997. Oxidative modification of LDL and atherogenesis. Circulation 95:1062–1071.
Steinberg D, Parthasarathy S, Carew TE, Khoo JC, Witztum JL. 1989. Beyond ch lesterol. Modifications of low-density lipoprotein that increase its atherogenicity. N Engl J Med 320:915–924.
Steinbrecher UP, Parthasarathy S, Leake DS, Witztum JL, Steinberg D. 1984. Mo ification of low density lipoprotein by endothelial cells involves lipid peroxidation and degradation of low density lipoprotein phospholipids . Proc Natl Acad Sci USA 81:3883–3887.
Steiner M, Anastasi J. 1976. Vitamin E. An inhibitor of the platelet release reaction. J Clin Invest 57:732–737.
Stephens NG, Parsons A, Schofield PM, Kelly F, Cheeseman K, Mitchinson MJ. 1996. Randomised controlled trial of vitamin E in patients with coronary disease: Cambridge Heart Antioxidant Study (CHAOS). Lancet 347:781–786.
Stocker R. 1999. The ambivalence of vitamin E in atherogenesis. Trends Biochem Sci 24:219–223.
Stoyanovsky DA, Osipov AN, Quinn PJ, Kagan VE. 1995. Ubiquinone-dependent recycling of vitamin E radicals by superoxide . Arch Biochem Biophys 323:343–351.
Stryker WS, Kaplan LA, Stein EA, Stampfer MJ, Sober A, Willett WC. 1988. The relation of diet, cigarette smoking, and alcohol consumption to plasma betacarotene and alpha-tocopherol levels. Am J Epidemiol 127:283–296.
Stumpf DA, Sokol R, Bettis D, Neville H, Ringel S, Angelini C, Bell R. 1987. Frie reich's disease: V. Variant form with vitamin E deficiency and normal fat absorption. Neurology 37:68–74.
Subramaniam R, Koppal T, Green M, Yatin S, Jordan B, Drake J, Butterfield DA. 1998. The free radical antioxidant vitamin E protects cortical synaptosomal membranes from amyloid beta-peptide(25–35) toxicity but not from hydroxynonenal toxicity: Relevance to the free radical hypothesis of Alzheimer's disease. Neurochem Res 23:1403–1410.
Swanson JE, Ben R, Burton GW, Parker RS. 1998. Urinary excretion of 2,7,8-trimethy 2-(beta-carboxyethyl)-6-hydroxychroman (gamma-CEHC) represents a major pathway of elimination of gamma-tocopherol in humans. FASEB J 12:A658.
Swanson JE, Ben RN, Burton GW, Parker RS. 1999. Urinary excretion of 2,7,8 trimethyl-2-(beta-carboxyethyl)-6-hydroxychroman is a major route of elimination of gamma-tocopherol in humans. J Lipid Res 40:665–671.
Szczeklik A, Gryglewski RJ, Domagala B, Dworski R, Basista M. 1985. Dietary su plementation with vitamin E in hyperlipoproteinemias: Effects on plasma lipid peroxides, antioxidant activity, prostacyclin generation and platelet aggregability. Thromb Haemostasis 54:425–430.
Takahashi O, Ichikawa H, Sasaki M. 1990. Hemorrhagic toxicity of d-alph tocopherol in the rat. Toxicology 63:157–165.
Tappel AL. 1962. Vitamin E as the biological lipid antioxidant. Vitam Horm 20:493–510.
Tasinato A, Boscoboinik D, Bartoli G, Maroni P, Azzi A. 1995. d-Alpha-tocopherol inhibition of vascular smooth muscle cell proliferation occurs at physiological concentrations, correlates with protein kinase C inhibition, and is independent of its antioxidant properties. Proc Natl Acad Sci USA 92:12190–12194.
Taylor A. 1993. Cataract: Relationship between nutrition and oxidation. J Am Coll Nutr 12:138–146.
Teikari JM, Rautalahti M, Haukka J, Jarvinen P, Hartman AM, Virtamo J, Albanes D, Heinonen O. 1998. Incidence of cataract operations in Finnish male smokers unaffected by alpha tocopherol or beta carotene supplements. J Epidemiol Community Health 52:468–472.
Thomas MR, Pearsons MH, Demkowicz M, Chan IM, Lewis CG. 1981. Vitamin A and vitamin E concentration of the milk from mothers of pre-term infants and milk of mothers of full term infants. Acta Vitaminol Enzymol 3:135–144.
Thorin E, Hamilton CA, Dominiczak MH, Reid JL. 1994. Chronic exposure of cultured bovine endothelial cells to oxidized LDL abolishes prostacyclin release. Arterioscler Thromb 14:453–459.
Traber MG. 1999. Vitamin E. In: Shils ME, Olson JA, Shike M, Ross AC, eds. Modern Nutrition in Health and Disease, 9th edition. Baltimore, MD: Williams & Wilkins. P. 347–362.
Traber MG, Kayden HJ. 1987. Tocopherol distribution and intracellular localization in human adipose tissue. Am J Clin Nutr 46:488–495.
Traber MG, Kayden HJ. 1989. Preferential incorporation of alpha-tocopherol vs gamma-tocopherol in human lipoproteins. Am J Clin Nutr 49:517–526.
Traber MG, Kayden HJ, Green JB, Green MH. 1986. Absorption of water-miscible forms of vitamin E in a patient with cholestasis and in thoracic duct-cannulated rats. Am J Clin Nutr 44:914–923.
Traber MG, Sokol RJ, Ringel SP, Neville HE, Thellman CA, Kayden HJ. 1987. Lack of tocopherol in peripheral nerves of vitamin E-deficient patients with peripheral neuropathy. N Engl J Med 317:262–265.
Traber MG, Burton GW, Ingold KU, Kayden HJ. 1990a. RRR- and SRR-alpha-toc pherols are secreted without discrimination in human chylomicrons, but RRR-alpha-tocopherol is preferentially secreted in very low density lipoproteins. J Lipid Res 31:675–685.
Traber MG, Rudel LL, Burton GW, Hughes L, Ingold KU, Kayden HJ. 1990b. Nascent VLDL from liver perfusions of cynomolgus monkeys are preferentia ly enriched in RRR- compared with SRR-alpha tocopherol: Studies using deuterated tocopherols. J Lipid Res 31:687–694.
Traber MG, Burton GW, Hughes L, Ingold KU, Hidaka H, Malloy M, Kane J, Hyams J, Kayden HJ. 1992. Discrimination between forms of vitamin E by humans with and without genetic abnormalities of lipoprotein metabolism. J Lipid Res 33:1171–1182.
Traber MG, Cohn W, Muller DP. 1993. Absorption, transport and delivery to tissues. In: Packer L, Fuchs J, eds. Vitamin E in Health and Disease. New York: Marcel Dekker. Pp. 35–51.
Traber MG, Rader D, Acuff R, Brewer HB, Kayden HJ. 1994a. Discrimination b tween RRR- and all racemic-alpha-tocopherols labeled with deuterium by patients with abetalipoproteinemia. Atherosclerosis 108:27–37.
Traber MG, Ramakrishnan R, Kayden HJ. 1994b. Human plasma vitamin E kinetics demonstrate rapid recycling of plasma RRR-alpha-tocopherol. Proc Natl Acad Sci USA 91:10005–10008.
Traber MG, Elsner A, Brigelius-Flohé R. 1998. Synthetic as compared with natural vitamin E is preferentially excreted as alpha-CEHC in human urine: Studies using deuterated alpha-tocopheryl acetates. FEBS Lett 437:145–148.
Trabert W, Stober T, Mielke U, Heck FS, Schimrigk K. 1989. Isolated vitamin E deficiency. Fortschr Neurol Psychiatr 57:495–501.
Tran K, Chan AC. 1990. R,R,R-alpha-tocopherol potentiates prostacyclin release in human endothelial cells. Evidence for structural specificity of the tocopherol molecule . Biochim Biophys Acta 1043:189–197.
Tran K, Proulx P, Chan AC. 1994. Vitamin E suppresses diacylglycerol (DAG) level in thrombin-stimulated endothelial cells through an increase of DAG kinase activity. Biochim Biophys Acta 1212:193–202.
Tran K, Wong JT, Lee E, Chan AC, Choy PC. 1996. Vitamin E potentiates arachid nate release and phospholipase A2 activity in rat heart myoblastic cells. Biochem J 319:385–391.
Tsai AC, Kelley JJ, Peng B, Cook N. 1978. Study on the effect of megavitamin E supplementation in man. Am J Clin Nutr 31:831–837.
Tsuchiya M, Thompson DF, Suzuki YJ, Cross CE, Packer L. 1992. Superoxide formed from cigarette smoke impairs polymorphonuclear leukocyte active oxygen generation activity. Arch Biochem Biophys 299:30–37.
Tutuncu NB, Bayraktar M, Varli K. 1998. Reversal of defective nerve conduction with vitamin E supplementation in type 2 diabetes: A preliminary study. Diabetes Care 21:1915–1918.
USP (The United States Pharmacopeia). 1979. The United States Pharmacopeia. National Formulary. Rockville, MD: United States Pharmacopeial Convention.
USP (The United States Pharmacopeia). 1980. The United States Pharmacopeia. National Formulary. Rockville, MD: United States Pharmacopeial Convention.
USP (The United States Pharmacopeia). 1999. The United States Pharmacopeia 24.National Formulary 19. Rockville, MD: United States Pharmacopeial Convention.
Upston JM, Terentis AC, Stocker R. 1999. Tocopherol-mediated peroxidation of lipoproteins: Implications for vitamin E as a potential antiatherogenic supplement. FASEB J 13:977–994.
van het Hof KH, Brouwer IA, West CE, Haddeman E, Steegers-Theunissen RPM, van Dusseldorp M, Weststrate JA, Eskes TKAB, Hautvast JGAJ. 1999. Bioavailability of lutein from vegetables is 5 times higher than that of β-carotene. Am J Clin Nutr 70:261–268.
van ‘t Veer P, Strain JJ, Fernandez-Crehuet J, Martin BC, Thamm M, Kardinaal AF, Kohlmeier L, Huttunen JK, Martin-Moreno JM, Kok FJ. 1996. Tissue antioxidants and postmenopausal breast cancer: The European Community Mult centre Study on Antioxidants, Myocardial Infarction, and Cancer of the Breast (EURAMIC). Cancer Epidemiol Biomarkers Prev 5:441–447.
Vatassery GT, Fahn S, Kuskowski MA. 1998. Alpha tocopherol in CSF of subjects taking high-dose vitamin E in the DATATOP study. Parkinson Study Group. Neurology 50:1900–1902.
Velthuis-te Wierik EJ, van den Berg H, Weststrate JA, van het Hof KH, de Graaf C. 1996. Consumption of reduced-fat products: Effects on parameters of antioxidative capacity. Eur J Clin Nutr 50:214–219.
Verhoeven DT, Assen N, Goldbohm RA, Dorant E, van ‘t Veer P, Sturmans F, Hermus RJ, van den Brandt PA. 1997. Vitamins C and E, retinol, beta-carotene and dietary fibre in relation to breast cancer risk: A prospective cohort study. Br J Cancer 75:149–155.
Vitale S, West S, Hallfrisch J, Alston C, Wang F, Moorman C, Muller D, Singh V, Taylor HR. 1993. Plasma antioxidants and risk of cortical and nuclear cataract. Epidemiology 4:195–203.
Wander RC, Du SH, Ketchum SO, Rowe KE. 1996. Effects of interaction of RRR-alpha-tocopheryl acetate and fish oil on low-density-lipoprotein oxidation in postmenopausal women with and without hormone-replacement therapy. Am J Clin Nutr 63:184–193.
Wechter WJ, Kantoci D, Murray ED, D'Amico DC, Jung ME, Wang WH. 1996. A new endogenous natriuretic factor: LLU-alpha. Proc Natl Acad Sci USA 93:6002–6007.
Weiser H, Vecchi M. 1981. Stereoisomers of alpha-tocopheryl acetate. Characterization of the samples by physico-chemical methods and determination of biological activities in the rat resorption-gestation test. Int J Vitam Nutr Res 51:100–113.
Weiser H, Vecchi M. 1982. Stereoisomers of alpha-tocopheryl acetate. II. Biopote cies of all eight stereoisomers, individually or in mixtures, as determined by rat resorption-gestation tests. Int J Vitam Nutr Res 52:351–370.
Weiser H, Vecchi M, Schlachter M. 1986. Stereoisomers of alpha-tocopheryl ac tate. IV. USP units and alpha-tocopherol equivalents of all-rac-, 2-ambo- and RRR-alpha-tocopherol evaluated by simultaneous determination of resorptiongestation, myopathy and liver storage capacity in rats. Int J Vitam Nutr Res 56:45–56.
Wheldon GH, Bhatt A, Keller P, Hummler H. 1983. D,1-alpha-tocopheryl acetate (vitamin E): A long term toxicity and carcinogenicity study in rats. Int J Vitam Nutr Res 53:287–296.
Winklhofer-Roob BM, Tuchschmid PE, Molinari L, Shmerling DH. 1996a. Response to a single oral dose of all-rac-alpha-tocopheryl acetate in patients with cystic fibrosis and in healthy individuals. Am J Clin Nutr 63:717–721.
Winklhofer-Roob BM, van't Hof MA, Shmerling DH. 1996b. Long-term oral vitamin E supplementation in cystic fibrosis patients: RRR-alpha-tocopherol co pared with all-rac-alpha-tocopheryl acetate preparations. Am J Clin Nutr 63:722–728.
Winklhofer-Roob BM, van't Hof MA, Shmerling DH. 1997. Reference values for plasma concentrations of vitamin E and A and carotenoids in a Swiss population from infancy to adulthood, adjusted for seasonal influences. Clin Chem 43:146–153.
Witting LA, Lee L. 1975. Dietary levels of vitamin E and polyunsaturated fatty acids and plasma vitamin E. Am J Clin Nutr 28:571–576.
Yang NY, Desai ID. 1977. Effect of high levels of dietary vitamin E on hematolog cal indices and biochemical parameters in rats. J Nutr 107:1410–1417.
Yong LC, Brown CC, Schatzkin A, Dresser CM, Slesinski MJ, Cox CS, Taylor PR. 1997. Intake of vitamins E, C, and A and risk of lung cancer. The NHANES I Epidemiologic Followup Study. Am J Epidemiol 146:231–243.
Yoshida H, Yusin M, Ren I, Kuhlenkamp J, Hirano T, Stolz A, Kaplowitz N. 1992. Identification, purification and immunochemical characterization of a tocopherol-binding protein in rat liver cytosol. J Lipid Res 33:343–350.
Yoshida H, Ishikawa T, Nakamura H. 1997. Vitamin E/lipid peroxide ratio and susceptibility of LDL to oxidative modification in non-insulin-dependent diabetes mellitus. Arterioscler Thromb Vasc Biol 17:1438–1446.


