
5
Mortality
Mortality rates vary tremendously among countries and even within countries. For example, life expectancy at birth1 in Japan reached 81 years in 1998, the highest ever observed for a nation-state. Life expectancy in Malawi, at 39 years, is less than half that in Japan and close to levels observed during the 18th and 19th centuries in Western Europe. Not only does life expectancy vary, but the age pattern of mortality is also sharply different. In such countries as Malawi, the risk of death is high in infancy and early childhood and in old age. In such countries as Japan, the risk of death is high only in old age. However, because the age pattern of mortality tends to vary in a predictable way with the level of life expectancy, the latter represents a good index of overall mortality experience. In what follows, we therefore focus mostly on life expectancy.
|
1 |
Life expectancy at birth (often called simply “life expectancy”) is a convenient and frequently used summary measure of mortality conditions at one point in time. For example, if the current life expectancy in 2000 is 50 years, this means that if mortality conditions in 2000 were to remain unchanged indefinitely into the future, babies born in 2000 would live an average of 50 years, although some would die at younger ages and others at much older ages. In other words, life expectancy summarizes mortality conditions in a given year. It is not a prediction of future mortality. Other summary measures are possible, such as the median age at death, the age at which exactly half of a hypothetical cohort of births exposed to particular mortality rates would die, or the modal age at death, the age at which the largest single number of deaths would occur. The median and modal ages at death tend to be higher than life expectancy. |
How did life expectancy get to be so high in Japan and other industrial countries, and how much higher can it go? What are the prospects for Malawi and other developing countries to replicate this experience? Could unforeseen developments substantially alter prospects for rising life expectancy and falling mortality? The answers to these questions are the key to properly projecting mortality levels worldwide.
We will consider, first, trends in life expectancy over several centuries in industrial countries and over several decades in developing countries. Interpretation of these trends provides clues about how mortality should be projected. Next, we explain how projections have actually been made and assess their accuracy. Then we consider what likely future mortality trends should be reflected in projections. In summarizing the discussion, we also note some possible research directions to help improve projections.
CURRENT LEVELS OF LIFE EXPECTANCY
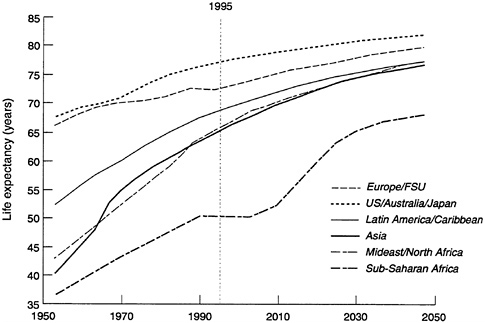
Figure 5-1 shows how life expectancy has varied over the last 50 years across six major world regions. (Projections to 2050 are also shown and are considered below.) The magnitude of current variation (in 1990-1995) across regions is striking. Life expectancy ranges from 74 years in industrial countries to 49 years in Sub-Saharan Africa. The other developing regions—Latin America and the Caribbean, Asia, and the Middle East and North Africa—each have life expectancies between 66 and 70.
Industrial countries are experiencing the highest life expectancies ever observed. If mortality rates at all ages remain at current levels, more than half of the babies born this year in these countries will live to celebrate their 80th birthdays. Among baby girls, two-thirds will become octogenarians and half will reach age 85. Partly because these survival chances are much higher than the survival experienced by cohorts born 80 years ago, the oldest-old population (those age 80 and older) will grow substantially, even with no further improvements in mortality.
In contrast to life expectancy in industrial countries, life expectancy in developing regions is not only lower but also more variable. Across Sub-Saharan African countries, the highest and the lowest life expectancies are almost 40 years apart. This is because mortality is especially high in a few least-developed countries but close to industrial-country levels on some small islands. Although trends since 1950 suggest some narrowing of contrasts across regions, Sub-Saharan Africa remains an outlier.
As life expectancy varies across countries, age patterns of mortality also vary, in predictable ways. This is easiest to show from the change over time in one country. Figure 5-2 shows the risk of death at different ages among Swedish females between 1900 (when life expectancy was
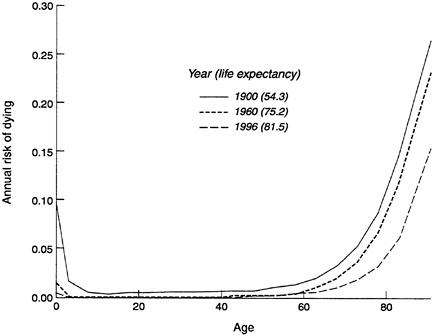
54.3 years) and 1996 (when life expectancy reached 81.5 years). Over this century, death was unlikely between the ages of 5 and 50, with the risk for an individual being less than 2 percent per year, although the mortality risk at each age was always slightly higher when life expectancy was low than after it had risen. Mortality risks were always sharply higher after age 60 relative to younger ages. Under age 5, on the other hand, mortality risks were high in 1900 but were much lower by 1996 (although still higher than from ages 5 to 50).
MORTALITY TRANSITION
Industrial countries attained their high levels of life expectancy through a remarkable two-centuries-long transition from high to low mortality (McKeown and Record, 1962; Flinn, 1974; McKeown, 1976, 1988; Dupaquier, 1979; Chesnais, 1992; Livi-Bacci, 1997, 2000). This transition is continuing, although it may be slowing. At the same time, it is spreading in developing countries, where the process started more recently but is proceeding at an even faster pace. We review the industrial-country experience in some detail, and then consider the transitions in progress in developing countries.
Transition in Industrial Countries
The transition to higher life expectancies in industrial countries was not entirely smooth and continuous. Regular progress was interrupted by occasional setbacks, periods of stagnation, and sometimes rapid improvement. The transition did not occur simultaneously in all societies or within a society in each social class or stratum. It spread irregularly from one society to another, leaving a trail of sharp contrasts between lower-mortality areas and other areas temporarily trapped within high-mortality regimes. No single path exists through which all countries inexorably pass on the way to lower mortality. Nevertheless, from the historical experience of diverse countries, we can identify common features of the process and distinguish a pretransitional situation and four subsequent stages of transition (Floud et al., 1990; Schofield and Reher, 1991; Horiuchi and Wilmoth, 1998; Livi-Bacci, 2000).
Pretransition
Life expectancy in prehistoric times was probably in the range of 20 to 30 years, as has been inferred from very slow population growth rates. By 1500 or 1600, when data on mortality first become available, mortality levels were still very high, and life expectancy rarely exceeded 35-40
years—roughly the minimum in developing countries today. Year-to-year mortality would fluctuate sharply, because of the impact of war, the vagaries of weather, recurrent crop failures, and periodic epidemics. These fluctuations, or short cycles, were superimposed on mortality fluctuations of longer duration, covering decades and even centuries. Why mortality would go up and down in these long cycles is not known. One hypothesis is that fluctuations in global weather patterns were responsible. Alternative explanations stress instead the role of fluctuations in the balance and accommodation between infective agents, microbes and vectors, and their human hosts. To the extent that changes in weather patterns affect the diversity and size of infective agents and vectors, these two explanations are complementary (Galloway, 1986).
First Stage
The first stage of transition, which occurred in Western Europe between 1700 and 1800, saw a reduction in the magnitude and frequency of fluctuations in mortality, but little average improvement in life expectancy. Crisis mortality began to decline, so that year-to-year mortality levels became more constant.
The mechanisms behind the reduction of crisis mortality are not entirely known, although it is clear that several factors were involved (Flinn, 1974; McNeill, 1976; Dupaquier, 1979; Wrigley and Schofield, 1981; Livi-Bacci, 1990; Chesnais, 1992). Improvements in this period in cultivation techniques and the storage and transportation of food, as well as an increased range of food crops introduced from the Americas and elsewhere, played a major role. These changes helped reduce the impact of fluctuations in agricultural output on levels of individual consumption, thus stabilizing nutritional status and, more generally, standards of living. Studies indicate that changes in nutritional levels improve immune function, which would reduce year-to-year fluctuations in mortality, although the precise importance of this mechanism is still unclear (Scrimshaw et al., 1968; Martorell and Ho, 1984; Fogel, 1986, 1989, 1990, 1991; Floud et al., 1990; Lunn, 1991; Martorell, 1996; Fogel and Costa, 1997). Improvements in standards of living and nutrition are not the complete explanation, as shown by the unexpectedly high mortality among highly privileged groups, such as the English aristocracy (Hollingsworth, 1977).
Reduction in severe epidemics must have played a role. Some historians and epidemiologists believe that improvements in living standards must have been reinforced by increased host resistance and changes in the genetic makeup of agents of infectious diseases. Accommodation between humans and agents of infectious disease occurs continuously. The process of adaptation may have accelerated and changed in character
during this period, as urban concentrations grew and more efficient communications and contacts developed.
While mortality fluctuations were reduced, they did not entirely disappear. In addition, the gains in average life expectancy during this first period were not large. The average life span continued to be constrained below 40-45 years (Fogel, 1986, 1989, 1990, 1991; Fogel and Costa, 1997).
Second Stage
The second stage of mortality transition saw underlying mortality levels finally moving downward. This stage began sometime in the early 19th century in England and in other Northern European countries (McKeown and Record, 1962; McKeown, 1976, 1988). At first reductions in mortality were modest, and reversals did take place. But as the 19th century progressed, the downward trend accelerated and reversals became rare. Life expectancy increased from levels of around 40 years to over 50 by the first decade of the 20th century.
Age patterns of mortality decline in this stage varied substantially among countries. In Sweden, for example, the period from 1800 to 1900 corresponds roughly to this stage. In this period, mortality declined most sharply under age 10 and over age 40. In England and Wales in a roughly comparable period, however, rates fell fastest between the ages of 1 and 30, with little improvement in infant mortality or mortality in middle age (Wrigley and Schofield, 1981; Keyfitz and Flieger, 1968).
Among the reasons for the mortality declines were better standards of living, improved health behaviors, and various public health measures.2 Standards of living continued to improve from the previous stage, contributing to better nutritional intake and increasing individual resistance to some infectious diseases, particularly such diseases of the respiratory system as influenza, pneumonia, bronchitis, and respiratory tuberculosis (McKeown and Record, 1962; McKeown, 1976, 1988; Fogel, 1986,
|
2 |
Improved medical knowledge and public health measures alone could not have been responsible for such large improvements. The germ theory of disease was not accepted until the last three decades of the 19th century (Evans, 1987), and its widespread application and the generalized establishment of associated advances in prevention (immunization) and cure (new drugs), as well as the most important innovations in surgical techniques (antiseptic procedures), occurred after 1900, not before (although vaccination or inoculation against smallpox probably had substantial effects on mortality under age 5 early in the 19th century). Furthermore, the most significant advances in drug-based therapies, embodied in the introduction of sulfa, penicillin, and other antibiotics, took place after 1935. |
1989, 1990, 1991; Komlos, 1989; Floud et al., 1990; Fogel and Costa, 1997). Several public health interventions and movements emerged in the second half of the 19th century. Although based on erroneous or only partially correct theories and paradigms, they did reduce exposure to infectious diseases, particularly water-borne and food-borne ones (Leavitt, 1982; Rosen, 1993). Reduced exposure also improved nutritional status, which is a function not only of dietary intake but also of physiological expenditures to fight disease (Cipolla, 1981; Evans, 1987; Szreter, 1988; Preston and Haines, 1991; Guha, 1993).3 Preventive measures, particularly the practice of inoculation or vaccination against smallpox, a very widespread disease, had a substantial impact on mortality (Razzell, 1965, 1993). These effects were only partly countered by rising levels of urbanization, which facilitated disease transmission (Woods and Woodward, 1984).
Third Stage
The third stage of the transition saw an acceleration of mortality decline, with life expectancy rising by about one-third of a year per year, propelled by a new set of factors. This stage began with the institutional acceptance of the germ theory of disease around 1900. Knowledge about infectious diseases led to measures to reduce exposure and transmission. Simple techniques such as hand washing and better personal hygiene reduced mortality further. In addition, the development of drug-based therapies in the 1930s led to unparalleled increases in the individual's capacity to resist the onslaught of infections.
During this period, infant mortality decreased sharply, and survival of younger adults improved substantially (Preston, 1976; Woods and Woodward, 1984; Preston and Haines, 1991; Vallin, 1991). Mortality reductions were particularly pronounced under the age of 50. Figure 5-3 illustrates this with percentage reductions in age-specific female mortality in Sweden in the period 1900-1960. The reductions were close to 90 percent under age 35, and still above 65 percent up to age 50. Such reductions were remarkably consistent from population to population. Mortality declines above age 60, however, were only modest.
Reductions in mortality proceeded in a fairly regular manner during this period, despite the last huge fluctuation, caused by the Spanish influ
|
3 |
For example, water purification techniques limited exposure to such intestinal infections as dysentery, typhoid, and cholera, reducing nutritional expenditure and improving nutritional status. Systems to dispose of waste and excreta and quarantines and other controls over geographic movement of populations had similar effects. |
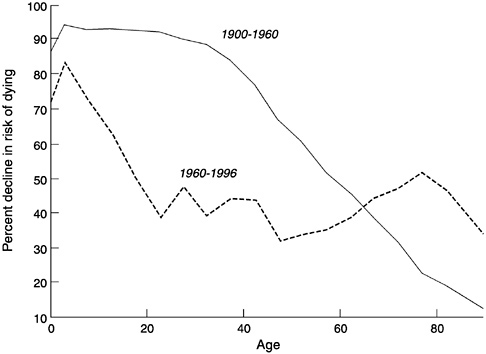
FIGURE 5-3 Percentage declines in mortality among females by age, for two transition stages, Sweden, 1900-1996.
SOURCE: Data from Keyfitz and Flieger (1968), updated from U.N. Demographic Yearbooks.
enza pandemic in 1918-1919. Two world wars and the depression of the 1930s caused only minor fluctuations by comparison (except among combatants and certain targeted subpopulations).
Fourth Stage
Mortality reductions are continuing in industrial countries, and a fourth stage of transition can be identified beginning around 1960. In percentage terms, mortality has continued to decline rapidly, especially at ages under 40. Figure 5-3 shows that the decline at younger ages in Sweden in 1960-1996, although not as extreme in percentage terms as earlier in the century, has still been substantial. However, mortality is now so low at younger ages in Sweden and similar countries that further gains at these ages can have only a minor impact on life expectancies. At current death rates in a typical industrial country, the chance of reaching age 65 is more than 90 percent for females and more than 80 percent for males. In this stage of transition, life expectancy gains depend mainly on reduced
mortality over age 65. As Figure 5-3 shows for Sweden, few gains were made in this age range during the third stage of transition, but percentage gains rose appreciably after 1960.
Large differences have opened up in this stage between the mortality risks of males and females at young adult ages, partly due to excess deaths among young males from violence and motor vehicle crashes. Young males are the one adult group, other than the elderly, among whom substantial reductions in mortality might still be possible.
Among the elderly in industrial countries, progress against chronic disease, especially cardiovascular diseases but also cerebrovascular diseases and some cancers, is contributing significantly to increased life expectancy (Horiuchi, 1997). Early detection and prevention of chronic diseases, improvements in surgical procedures, and refinements of medical therapies are all fostering longer survival and better health status among the elderly.4
Synthesis
For the long time span involved in the mortality transition, reliable vital-registration data on mortality are not available. However, estimates of life expectancy for England and Wales for 5-year periods from the mid-16th century to the late 19th century have been developed by a series of historical demographic methods (Wrigley and Schofield, 1981). These estimates are combined with registration-based estimates from 1841 onward and are shown in Figure 5-4. We also plot life expectancies for 5-year periods from vital-registration data for Sweden from the mid-18th century onward as an example of a quantitatively but not qualitatively different trajectory.
The graph illustrates various characteristics already noted of the mortality transition in industrial countries. This transition is shown to have taken, so far, almost three centuries. Pretransitional life expectancy is seen to fluctuate considerably, even when calculated for 5-year periods. The first stage reduced this variability but did not produce substantial improvements in level of life expectancy, which was somewhat below 40 years at the start of this stage and still close to 40 years at the end. Improvements came in the 19th century, with life expectancy rising close to 53 years by the end of the century. Improvements accelerated in the third stage, when life expectancy rose further to around 70 years. Finally, in the
|
4 |
Earlier research in the medical sciences and recent evidence and interpretation (Barker, 1998) suggest that some of these changes were triggered by improved conditions experienced by these cohorts in utero and during infancy and childhood. |
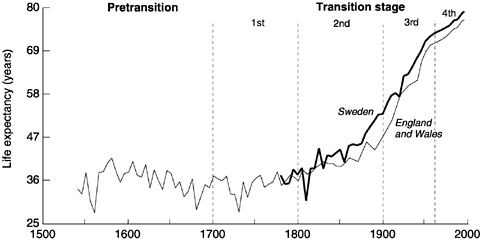
FIGURE 5-4 Historical trends in life expectancy, England and Wales and Sweden, 1540-1996.
SOURCE: Data from Wrigley and Schofield (1981) and Keyfitz and Flieger (1968), updated from U.N. Demographic Yearbooks.
last observed stage of transition, increases in life expectancy are shown to occur more slowly as very high levels are reached.
Life expectancy improved at a fairly steady pace within stages (with some reversals in the early stages) but was discontinuous from one stage to the next. Mortality changes in the first and second stages were largely due to slow political and institutional changes, gradual economic transformation, and limited behavioral and clinical developments. In contrast, the changes experienced in the third stage of the transition, beginning around 1900, were due largely to the rapid and unpredictable expansion of medical knowledge and associated techniques and the diffusion of this knowledge to the public, resulting in the adoption of health-promoting behaviors at the household level. The fourth stage, with reductions in old age cardiovascular mortality, reflects improvements in diagnosis and drug-based therapies, reinforced by behavioral changes, particularly the reduced prevalence of smoking.
Transition in Developing Countries
By and large, the mortality transition in developing countries has been driven by the same factors as in industrial countries but has proceeded much faster, with unprecedentedly rapid gains in life expectancy. The earliest transitions in developing countries began in earnest in the 1920s and 1930s. Because of substantial improvements in China, the great
est overall gains were made in the 1960s. The 1960s and 1970s saw large gains in other Asian countries and in Latin America, and the 1970s and early 1980s saw improved gains in Africa. For some developing countries, the stages of transition have been compressed within the last half-century, while other countries are still working their way through earlier transition stages.
The key factors in reducing mortality have included the diffusion of health care knowledge, the increased ability to control vectors of infectious diseases, the widespread introduction of immunization measures and drug-based therapies, and perhaps large reductions in fertility5 (Meegama, 1967; Arriaga and Davis, 1969; Preston, 1980; Mosley, 1984; Hill and Pebley, 1989; Frenk et al., 1991). The development of effective governments capable of mobilizing the population and resources needed have made it possible to capitalize on the potential for improvement offered by these factors.
Developing regions and countries do differ substantially in the degree to which they have progressed through the transition. For present purposes, countries can be divided into three groups based on the levels of life expectancy they reached by 1990-1995.
Early Transitions
The first group of countries includes all those with current life expectancy levels of 70 years or higher. These countries started transition early, before World War II. By the early 1950s, most already had life expectancies of 55 years or higher, equivalent to the start of the third stage of mortality transition in industrial countries. They may now be considered in the fourth stage of transition, although in this stage they have generally not progressed quite as far as the industrial countries.
This varied group of countries includes Israel, Singapore, and Sri Lanka, as well as much but not all of Latin America and the Caribbean. Argentina, Chile, Costa Rica, Cuba, and Uruguay achieved early improvements in living standards and developed strong nation-states with relatively efficient central administrations. They also took advantage of foreign investment to erect infrastructure, reducing disease exposure directly through eradication programs or indirectly through water purification
|
5 |
Although the exact direction of causality is not well established and the magnitude of the relation has been routinely questioned, it is possible that at least part of the most recent mortality decline in developing countries is associated with fertility decline. As fertility begins a rapid descent, the proportion of infants born at high risk diminishes, contributing to increases in life expectancy. |
systems and better transportation. By the time these countries were exposed to medical innovations after World War II, a substantial decline in mortality had already taken place.
Although these transitions have been more rapid than those in industrial countries passing through similar levels of life expectancy, the experience has not been entirely smooth, containing numerous instances of slower improvement and some outright reversals (Palloni, 1981).
Further improvements are progressively less likely to come from better standards of living or more public health interventions. Instead, they depend on the more uncertain progress against degenerative diseases and unpredictable changes in personal behavior. Progress will also be a function of the success of efforts to minimize the adverse effects of environmental contamination associated with rapid industrialization.
Delayed Transitions
The second group of countries are those with life expectancies between 55 and 70 years, which roughly correspond to the boundaries of the third transition stage for industrial countries. These countries are scattered in all developing regions and include Brazil, Colombia, and El Salvador; China, India, and Indonesia; Algeria, Egypt, and Turkey; and Ghana, Kenya, and Mauritius.
In this group, the bulk of the transition to date took place after World War II. In the early 1950s, their average life expectancy was only 43 years. Since then, progress has been rapid, with annual increases in life expectancy averaging between 0.5 and 0.6 years until the mid-1980s. This pace of improvement was not only faster than the gains in industrial countries but also faster than the gains in the early-transition developing countries, which had entered a slightly slower period of change (Figure 5-5).
The gains were strongly associated with diffusion of information about exposure and resistance to illnesses, as well as the spread of medical technology. Of particular importance were direct and sustained interventions in the form of immunization campaigns, oral rehydration, and improved care of newborns. These interventions had direct effects on infant and child mortality and also helped mobilize the population and facilitate transmission of useful health information (McQuestion, 1999).
Despite broad similarities in the lower mortality levels they have attained, these countries have progressed at very different paces. On one side are such countries as China and Saudi Arabia, which have made rapid progress and are near the upper limit for life expectancy in the third stage of transition. On the other side are such countries as South Africa and Burma, which have made much slower progress and are barely into the third stage.
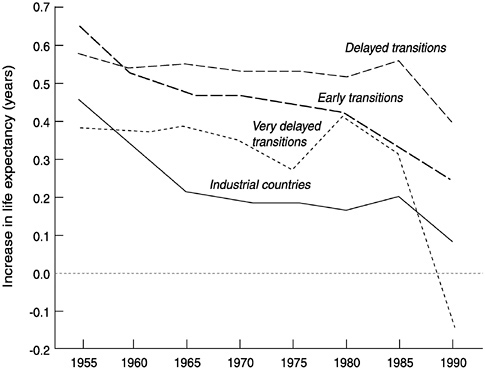
FIGURE 5-5 Mean annual gains in life expectancy for industrial countries and three groups of developing countries, 1955-1995.
SOURCE: Data from United Nations (1999).
Very Delayed Transitions
All countries in the third group have life expectancies below 55 years. Included are the majority of countries in Sub-Saharan Africa plus six others: Afghanistan, Cambodia, East Timor, Haiti, Laos, and Nepal. Starting with an average life expectancy of 35 in the early 1950s, these countries made slow progress. Until the mid-1980s, life expectancy rose on average less than 0.4 years annually. In the mid-1980s, life expectancy in nearly half of these countries is estimated to have plunged as a result of the HIV/AIDS epidemic, leaving them today at levels equivalent to those of the first and second stages of mortality transition.
In these countries, gains in survival have been hard to come by. This may be due to several factors: a lack of significant improvement in individual standards of living, weak central states with little power to effect social and political transformation, and a rather slow adoption of health interventions for those at highest risk. Many gains are obviously possible from better health conditions for infants and children. Gains may also
come from lower fertility levels, which could improve the chances of survival among very young children, just as may have happened earlier in other developing countries. Gains will also depend crucially on control of the HIV/AIDS epidemic, which is discussed further below.
MORTALITY PROJECTIONS
The preceding review of levels and trends in mortality in both industrial and developing countries illustrates some of the challenges facing forecasters. We discuss first some general implications of this review for mortality projections. Then we look at two particular approaches to making such projections and evaluate how well mortality has been projected in the past.
Implications of Past Trends
The trend in life expectancy in all regions has been generally upward. The sharp annual fluctuations that we believe characterized the Middle Ages have largely disappeared, at least in countries that have reached the third stage of transition. Forecasters can therefore assume (as they usually do) a gradual improvement in life expectancy at some rate that needs to be defined.
Rates obtained by simple extrapolation of past trends would have produced reasonable projections in some periods in the past, such as within transition stages, but not in others, particularly across transition stages. In periods when mortality decline was driven by gradually improving, cumulative factors, such as spreading socioeconomic development, simple though nonlinear extrapolation would have been a defensible strategy and would have yielded satisfactory results. But in periods when mortality decline was driven by less predictable events, such as medical discoveries or implementation of public health measures, simple extrapolation would have been more problematic. Either one would have to assume a continuous stream of breakthroughs, or one might miss the effect of breakthroughs if recent trends did not reflect them. From one type of period to the next, as the causal factors in mortality decline were changing, extrapolation would clearly have been risky. Therefore, long-run mortality projections, which would necessarily have crossed transition stage boundaries, would have been more likely to be in error. We should see such problems reflected in longer projections.
Another complication is the possibility that mortality decline in the future will cease to be regular, or at least will be interrupted by exogenous events. Such events may be connected with climatic fluctuations, business cycles, or episodic outbreaks of viral infections. Although the influence of
such events on mortality levels over long periods was most significant in the preindustrial period, they still do occur today and are likely to always occur.
For example, the influenza pandemic of 1918-1919 induced sizeable increases in mortality in a number of countries in industrial and developing regions, leading to an additional 20 million deaths worldwide, increases that could not have been predicted even a year ahead. Contemporary examples are the emergence of the HIV/AIDS epidemic, initially in Africa, and the socioeconomic and political crisis in Eastern Europe following the collapse of the Soviet Union. Unlike the mortality effects of, for example, a short but severe drought, the effects of these crises may be long lasting, so their extended impact can lead to relatively large projection errors.
Extrapolation of life expectancy trends must also confront a possible change in trend when mortality reaches very low levels. At the levels reached in industrial countries today, for instance, most improvements must occur at ages above 60. Forecasters nevertheless assume continued gains in life expectancy. We shall review first what they do and then discuss later what is theoretically and empirically most appropriate.
While projection of life expectancy by itself is already complex, population projections also require projection of mortality rates for each age group in the population. Fortunately, empirical observation of changing mortality patterns across many countries shows that mortality rates at various ages are closely related to each other and can be described by a relatively small number of alternative patterns (United Nations, 1955, 1982; Lederman and Breas, 1959; Bourgeois-Pichat, 1963; Coale and Demeny, 1983; Coale and Guo, 1989). Forecasts can therefore select an age pattern of mortality consistent with each projected level of life expectancy.6 The stable relationship between age patterns of mortality and life expectancy has so far enabled forecasters to focus mainly on projecting life expectancy. In describing and assessing projection procedures, therefore, we also focus mainly on this parameter.
|
6 |
This is obviously less reliable at very high levels of life expectancy, for which levels mortality data are still sparse. Mortality rates at older ages especially may be misestimated. Note also that even grossly misspecifying life expectancy has little effect on projected mortality between the ages of 5 and 50, because, at least in modern populations, mortality at these ages is quite low and does not vary greatly (see Figure 5-2). |
Current Procedures
U.N. Projections
Mortality projections can be carried out in several ways. The U.N. (1999) begins with schedules for gains in life expectancy. These schedules allow variation by sex, initial life expectancy level, and the assumed pace of improvement, which can be fast, middle, or slow. Either fast, middle, or slow improvements in life expectancy are selected for each country based on the rate of previous mortality declines, with the proviso that all countries revert to a middle pace by an arbitrarily chosen year, 2025. The middle pace assumes increases in male and female life expectancy of 2.5 years per 5-year period until a life expectancy of 60 years (for males) or 65 years (for females) is reached, with the gains tapering off gradually to 0.4 years per 5-year period once life expectancy reaches 77.5 for males and 82.5 for females.
Maximum life expectancy is not allowed to exceed 82.5 years for males and 87.5 years for females (Zlotnik, 1999). Some countries approach this ceiling so closely by 2050, the end date of the standard projections, that extrapolating the projected increases would breach the ceilings. For Japan and Norway, for instance, the ceilings for female life expectancy would be breached by 2058. The U.N. therefore assigns higher ceilings for its occasional long-range projections to 2150. In the last such projections available, these ceilings were 87.5 years for males and 92.5 years for females (United Nations, 1999). Ceilings have also been raised intermittently in the past. Before 1989, the standard ceilings up to 2050 were lower, 75 years for males and 82.5 years for females.
World Bank Projections
The World Bank does not use fixed schedules but determines the rate of change in life expectancy in a given 5-year period country by country, mainly from the rate of change in the preceding 5-year period. The preceding rate is fit into a logistic function that has a defined minimum for all countries of 20 years for either sex and a maximum of 83.3 years for males and 90 years for females. The gap between males and females corresponds to the difference between male and female life expectancies in industrial countries around 1985 (Bulatao and Bos, 1989; Bos et al., 1994). As with the U.N. projections, the maximum life expectancies were adjusted upward around 1990.
For the first 5-year period in the projection, the rate of change depends on the rate of change in the preceding 5-year period and on the female secondary school enrollment rate. For each of the next two 5-year
periods, the rate of change is a proportion of the rate of change in the immediately preceding 5-year period, and then the rate of change becomes uniform across countries. These rules produce typical increments to life expectancy that are smaller than those used by the U.N. up to life expectancies of 65-70 years, and then become larger. These rules also produce both a smoother increase and greater country variation.7
Projection Accuracy
Since projections have been made for some time, we can compare projections made in the past with actual experience. Although some of the procedures described above have been in use for only a few years, broadly similar procedures have been in use for longer. Here we examine results from projections beginning in the 1970s.
World Error
Figure 5-6 shows the current estimate of the trend in life expectancy for the world as a whole (United Nations, 1999), as well as projections made at various times since the 1970s by the U.N. and the World Bank (see Appendix B for details and sources). The figure shows that one group of forecasts projected life expectancies as too high by a few years, another group projected them too low by about as much. In each case, the error seems to have been in the initial life expectancy level. Part of the explanation appears to be disagreements regarding life expectancy in the largest countries. For instance, an important contributor to high initial estimates in the World Bank projections is higher estimates of life expectancy than those the U.N. is now reporting for China and Nigeria. Such disagreements are not surprising, given imperfect data for many countries and regions and continuing uncertainty about past as well as current levels of life expectancy.
All these forecasts nevertheless appear to have captured the trend in life expectancy quite well. To be sure, neither the too-high nor the too-low projections captured the slight acceleration in improvements in world life expectancy in the mid-1980s, nor the slight deceleration since. Alterations
|
7 |
The U.S. Census Bureau (n.d.) also uses logistic functions for projection, which they fit to past life expectancy data by country. The details of fitting these functions vary by country, but the functions are generally assumed to have a lower bound around 25 years and upper bounds of 79-81 years for males and 86-87 years for females. Only results within the range of increments used in the U.N. projections are utilized. Other agencies also make actuarial projections of mortality in specific countries; for a review, see Tuljapurkar and Boe (1999). |
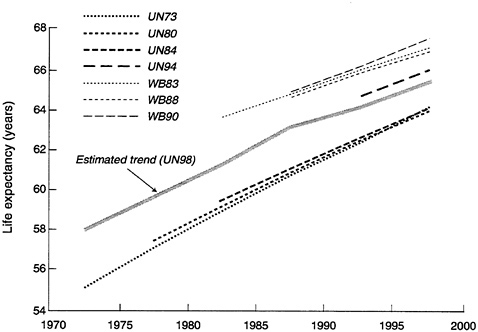
FIGURE 5-6 Currently estimated trend in world life expectancy and various projections of the U.N. and the World Bank.
NOTE: See Appendix B for sources. UN stands for the U.N. Population Division and WB for the World Bank. The digits after this designation indicate the year of the forecast, so that WB83 is the World Bank's 1983 forecast.
in trends such as these are difficult to predict, but, given the fairly advanced transition stages that the largest countries of the world have reached, the broad overall trend in life expectancy appears to have been fairly predictable, at least over shorter time spans. Errors in projections of mortality, therefore, have not been a major contributor to error in world population projections over the last two decades.
Country Error
Projections at the country level may be expected to have somewhat greater error. Figure 5-7 shows mean errors across countries grouped into six main regions. Because errors tend to become greater as projections lengthen, mean errors in life expectancy are plotted against projection length, with a projection length of zero representing the then-current estimate of life expectancy at the start of the projection period.
These errors in projected country life expectancies are indeed somewhat greater than world errors, despite that fact that positive errors for
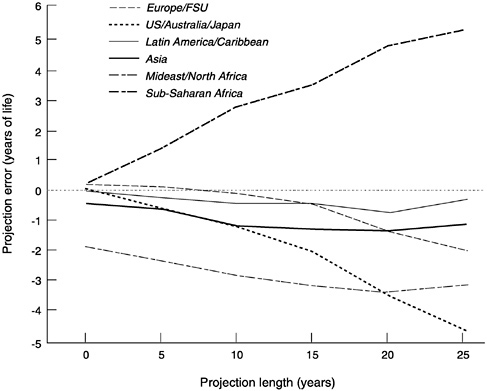
FIGURE 5-7 Mean error in projected life expectancy, across countries and forecasts, by projection length and region.
SOURCE: See Appendix B.
some countries are allowed to cancel negative errors in other countries. More important, the figure shows three important patterns: for industrial countries, for most developing regions, and for Sub-Saharan African countries in particular.
For industrial countries, increases in life expectancy have been underprojected. This is particularly true for countries outside Europe (the United States and Canada, Japan, and Australia and New Zealand) but also true to some extent for Europe. If the pace of improvements has exceeded projections, the ceiling for life expectancy may have been set too low. This ceiling has largely dictated the projected pace of improvements, and, as we have seen, both the U.N. and the World Bank have had to raise their ceilings in the past.
For countries in three developing regions—Latin America and the Caribbean, Asia, and the Middle East and North Africa—increases in life expectancy have also been underprojected. For the Middle East and North Africa, the error seems to have been largely in the initial estimates of
“current” life expectancy. If this initial error is discounted, the underprojection of life expectancy in these regions appears somewhat smaller than the error for industrial regions. Projecting life expectancy in developing regions as following the path of industrial countries appears to be appropriate, but with developing countries improving quite fast, forecasters may have slightly underestimated the pace of improvement.
This is not the case, however, for countries of Sub-Saharan Africa. Only for this region, in contrast to all the others, is life expectancy overprojected. Much of the error has to do with projections for the late 1980s and the 1990s. This is due, at least in part, to the failure to foresee the spread of HIV/AIDS in this region. It may also, of course, reflect the uncertain progress of health systems and the inability of political and economic systems to guarantee consistent improvements in living standards.
Implications of Error
Although this comparison shows that previous projections did not exactly track actual life expectancies in all countries since the 1970s, the magnitude of errors should not be exaggerated. With life expectancy misprojected in either direction over three decades by 5 or 6 years—roughly the amount of absolute error for the average developing country since the 1970s—the impact on projected population was small. The uncertainty in current projections, if it were estimated ex post from past errors, would presumably not be large, either.
Simulation indicates that, for a low-mortality developing country with a life expectancy close to 70 years, an error of 5 to 6 years in life expectancy would lead to error in projected population size, after three decades, of only 3 percent, rising to 8 percent after five decades.8 The impact of errors on population size would be larger, however, for a high-mortality country with substantial remaining infant and child mortality. In addition, other projection parameters would be affected more strongly. The population aged 65 and older, for instance, would be underprojected, after three decades, by 15 percent, and after five decades by 33 percent. The population aged 75 and older would be underprojected by even more, by 24 percent after three decades and 41 percent after five decades. Errors in projected mortality in low-mortality populations have shown up most strongly in the past in errors at these ages (see Chapter 2).
|
8 |
See Appendix D (at http://www.nap.edu) for the calculations. The assumed error in life expectancy is 5 percent. This is comparable to the observed mean absolute error in life expectancy in developing countries, in the forecasts considered above, of 4.6 years in 25-year projections—which, extrapolated to 30 years, would be between 5 and 6 years. |
Errors at older ages are not trivial and can have important consequences in particular contexts. For instance, such errors can affect planning for pension and old age security programs. To facilitate such planning, the U.S. Social Security Administration has regularly produced mortality projections since the 1930s. Their short- and medium-term projections of life expectancy, looking three decades forward, have missed the actual values by only 2-4 years (Lee and Tuljapurkar, 2000). But these errors are large enough to lead to errors of 10-15 percent in the projected size of the population aged 65 and older.
These Social Security Administration forecasts (made in various years, as roughly indicated by the starting points of the lines in Figure 5-8) have consistently underprojected long-run U.S. life expectancy. The earlier projections appear to be largely linear extrapolations from earlier periods during which life expectancy gains were small, therefore missing the effects of rapid improvement in some subsequent periods. The 1980 projection extrapolated from a period of more rapid improvement but was nonlinear, requiring that gains in life expectancy decline. This required decline is controversial (see Lee and Carter, 1992).
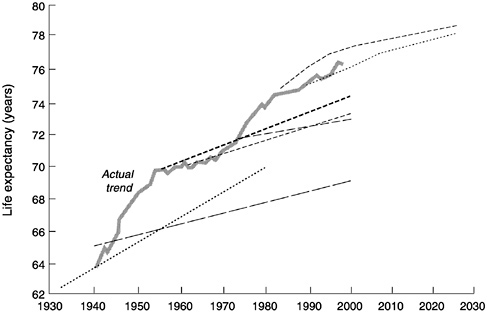
FIGURE 5-8 Observed U.S. life expectancies and various projections by the U.S. Social Security Administration, 1930-2030.
SOURCE: Lee and Tuljapurkar (2000). Projections were made around the point where each line starts.
FUTURE TRENDS IN LIFE EXPECTANCY
Simple extrapolations of past trends in life expectancy, like those for the United States, may therefore provide poor forecasts. Past extrapolations by the U.N. and the World Bank have generally not been too far off in the short term, but over the longer term their error has increased. Extrapolations have to be leavened with judgment, and we therefore consider three main sets of issues that must be resolved in predicting the future course of mortality in the human population:
-
First, is there an end to the fourth stage of transition, which industrial countries and a number of developing countries have now attained? Or should life expectancy be expected to rise indefinitely? Or can some other intermediate prospect be modeled? Good answers to these questions may help remedy the errors we have seen in projections of life expectancy in industrial countries.
-
Second, will developing countries continue to follow in the footsteps of industrial countries, and if so, will they continue to do so at a faster pace? Underestimating the pace of these latecomers' mortality transitions has been the source of errors in projections for most developing regions.
-
Third, how could unexpected events alter the course of future mortality? Failing to predict such an event—the HIV/AIDS epidemic—has been a major cause of error in projections for Sub-Saharan Africa. We consider the HIV/AIDS epidemic in particular below and also reflect on other possible unpredictable events.
Mortality Change at Very High Levels of Life Expectancy
Once life expectancy has reached very high levels, gains in survival could rapidly diminish, despite new discoveries in the biomedical sciences, if either of two types of limits exist. First, intractable biological limits to life expectancy may exist that even the most sophisticated new developments in medical technology will not breach (Carnes et al., 1996; Olshansky and Carnes, 1996). Second, practical limits may exist, particularly to the application of the relatively expensive technology required to limit the impact of chronic ailments (Olshansky et al., 1990). Societies faced with fiscal and budgetary constraints—perhaps imposed by population aging—may be unwilling or unable to supply the outlays to use medical technology fully to extend life. (This could deepen disparities in health, disability, and survival between those who can pay for such services themselves and those dependent on public funding.) With either type of limit, mortality rates at ages over 60, and particularly at ages over
70 or 80, will be constrained by lower bounds, and gains in life expectancy should decrease once one or more of these lower bounds are approached. The projections reviewed above do assume some limits to life expectancy, usually limits sufficiently above current levels so that gains can continue throughout the projection period. To evaluate arguments about such limits, we need to consider what can be learned from extrapolation of life expectancy trends, from examination of causes of death, and from modeling trends in age-specific mortality rates.
Because gains in life expectancy have come more slowly as higher levels are reached (see Figure 5-5), extrapolation of these gains may suggest ultimate limits to life expectancy (e.g., Fries, 1980; Coale and Guo, 1989). However, simple extrapolation is hazardous, as we have already noted; when based on recent trends, it is likely to miss instances of rapid improvement that punctuate the historical record. Thus several limits derived by extrapolation, if they have not already been exceeded, are barely above current levels in some countries. The Coale and Guo (1989) limit of 76.1-77.8 years for males, for instance, encompasses the 1990-1995 life expectancy, for Japanese males, of 76.4 years.
Extrapolation from a longer period, if it does not prove the absence of any limits, at least establishes the possibility of more rapid long-term gains in the future. Lee and Carter (1992), for instance, reviewed data for the United States since 1900 and produced a forecast of life expectancy of 84.3 years to be reached by the year 2050. This value is about 8 years above the current level and well above the forecasts of the Social Security Administration (see Figure 5-8).
If extrapolation does not establish the existence of limits, neither does examination of causes of death. Such examination might be useful because, if one could determine which causes are preventable, one might be able to estimate how high life expectancy can go. Calculations of this sort by Bourgeois-Pichat (1978) suggested long-term life expectancies for Norway that have already been exceeded, whereas later calculations by Manton (1986) suggested considerably higher limits for the United States.
These calculations obviously depend on which deaths are considered preventable or at least postponable. Deaths among the elderly might be increasingly postponed with advances in molecular biology and genetic engineering, reductions in risk factors, and improvements in medical technology, which would make continued improvements in survival possible for an indefinite period. Such factors could produce occasional rapid gains in life expectancy that need not be spread evenly across age groups or periods. Some postulate that the recent, very rapid reductions in age-specific mortality rates at older ages observed in Western Europe could even accelerate. Biological, medical, and gerontological sciences may be on the verge of qualitative breakthroughs, much as the physical sciences
were a century ago. Faster gains could occur as a result of innovations in the prevention and treatment of arteriosclerosis, cancer, diabetes, and dementia as well as through a vastly improved understanding of the aging process itself (Vaupel, 1997). Assuming such breakthroughs do occur and the economic and political decisions are made to share the benefits widely, the trend in life expectancy, far from flattening out, may be on the verge of shifting once more to a higher trajectory, as it has already done at various times in this century (see Figure 5-4).
Because many of the gains will be among the elderly, looking at age-specific mortality is helpful. If mortality rates at older ages (say at age 60 and older) decline linearly by a fixed percentage per year, then life expectancy will increase steadily by a percentage a fifth to a tenth as high9 (Vaupel, 1986; Vaupel and Romo, 2000). Over the 1980s and 1990s in Western Europe, mortality rates at older ages did decline about 1 percent annually, suggesting that a life expectancy of around 85 years is within reach by 2050.
None of these arguments, from extrapolation, from causes of death, or from age-specific mortality rates, establishes the absence of an ultimate limit to life expectancy in the long term. But collectively they suggest at least that, if a limit exists, it is probably much higher than 85 years (Carey et al., 1992; Curtsinger et al., 1992; Kannisto et al., 1994; Kannisto, 1994, 1996; Vaupel, 1997; Vaupel et al., 1998; Wilmoth, 1998).
In progressing toward this level, reversals are certainly possible for specific countries, as the recent experience of Eastern Europe indicates. With the political collapse of the Soviet Union and the dismemberment of the Communist bloc, life expectancy fell, in the late 1980s and early 1990s, about 2 years in Eastern Europe as a whole and closer to 3 years in Russia in particular. In both cases, recovery so far has been limited (United Nations, 1999). Whether the specific political events were a major cause or merely accelerated a systemic deterioration already under way (Bobadilla and Costello, 1997), this development reminds us that future reversals are not outside the bounds of possibility. More likely than complete reversals, however, are periodic decelerations in rates of improvement. And even more likely, as long as mortality at older ages continues to decline, are continued gains in life expectancy for an indefinite period.
|
9 |
This relationship can be maintained for a considerable period if mortality at older ages is decreasing slowly, say by less than 1 percent annually. The relationship is premised on the current rate of mortality increase with age in industrial countries. Were the mortality increase with age steeper, a decline in mortality at older ages would have less effect on life expectancy. |
The speed of these gains remains uncertain. The factors that could accelerate, slow, or stop progress toward higher life expectancy in countries with low levels of mortality are numerous and difficult to take into account. While no simple solution exists to projecting mortality at these low levels, however, two alternative approaches not in general use may be worth further development.
First, short-term and medium-term projections might try instead to extrapolate age-specific mortality rates rather than relying on age patterns linked to life expectancy. Age patterns of mortality have been reasonably predictable, following a limited number of alternative patterns, at lower levels of life expectancy. But what happens at higher levels of life expectancy is not as well known. As gains in survival shift to older ages, the age patterns in these gains may diverge among countries. Projecting age-specific mortality rates is not a panacea, however. It is not only more laborious but also requires attention to possible errors at different ages that may sometimes cancel each other out but may also compound each other.
Second, for longer projections, a time-series approach that uses a correspondingly long series of past observations may be more reliable than projections from shorter trends. This is the solution suggested by Lee and Carter (1992). They provide a model for variation in mortality rates in the United States by age and time, showing that an index k, representing the level of mortality, can be projected as linear based on data for 1900-1989. However, time-series approaches such as this have to be used carefully, because they have their own limitations and cannot simply be applied across the board in world projections. Some industrial countries (and most developing countries) do not have sufficient data for time-series models, which are generally not meant for projections as long as those made demographically. Where data are available, users of this general approach have to decide how many decades of past data to use—the last three decades, say, or the last eight decades? The pace of mortality improvements has shifted in the past, as with the recent acceleration in rates of improvement at older ages in industrial countries. Such shifts may be missed if the time series of historical data is too long. Use of short time series, however, can also introduce errors if the short period is not representative of longer-term trends. Any future shift, say a shift to accelerated rates of improvement due to biomedical advances, will in any case be missed. Furthermore, time-series models can produce implausible results and require the application of judgment and the use of external information. The models do have an advantage with regard to estimating the uncertainty of a projection, as discussed in Chapter 7.
Mortality Change Where Mortality Transition Is Recent
Future gains in life expectancy in developing countries will certainly slow, but the pace of improvement should depend on the stage of transition each country has reached. In early-transition countries that have relatively high levels of life expectancy, future gains will depend on the same factors as in industrial countries, that is, on progress against degenerative diseases. At their life expectancy levels, mortality trends have developed some resiliency, even in the face of transient setbacks. Thus, as in most industrial countries, gradual improvement in life expectancy can be expected. Also following the industrial country pattern, reversals are unlikely but cannot be entirely discounted. For instance, although high life expectancy levels had been attained in Argentina by the 1970s, mortality improvement stalled, apparently because of repeated economic turmoil.
Delayed-transition countries will most likely follow a course dominated by the continued export of health technologies from industrial countries and by further improvements in standards of living. Unlike in early-transition countries, mortality in delayed-transition countries is still sensitive to improvements in maternal education, which reflects levels of well-being in the household as well as personal behaviors and attitudes that are positively related to child and adult health. Similarly, most of these countries could still benefit from basic health interventions that expand care at childbirth, increase immunization coverage, and raise nutritional levels, particularly for micronutrients. Future mortality reductions in these countries should be gradual and not greatly affected by periodic crises, although, again, these cannot be excluded.
Very-delayed-transition countries are likely to follow the path of other developing countries, but the speed at which they do so may depend largely on their administrative efficiency and ability to develop infrastructure (sewers, water, roads, electricity) and establish durable health services, as well as on improvements in standards of living and health behaviors, and perhaps reductions in fertility levels. These countries lack the robust momentum to sustain constant improvements in the future. Mortality levels will therefore be more prone than in more advanced countries to annual fluctuations induced by climatic variability and social and political crises, and also prone to longer-term fluctuations resulting from emergent diseases.
From these expectations about future trends, we can draw several implications for projecting mortality in countries with recent mortality transitions.
First, such projections must be recognized as more uncertain than projections for industrial countries, given the possibility of wider and
more frequent mortality fluctuations. Even among countries at higher life expectancy levels, projections still rest on somewhat fragile assumptions. Public health is often dependent on the uncertain delivery of important services and imperiled by reversals in standards of living. The margin for error of mortality projections is therefore larger than in industrial societies. As a result, it is essential to review mortality projections often, quantify and report on their uncertainty (see Chapter 7), and update them to take into account information on standards of living, inequality, the social order, and the durability and fiscal soundness of government programs.
Second, mortality projections are likely to be more accurate if they follow a methodology specific to each of the groups of countries described above. Both the quality and the length of data series tend to be correlated with the stage of the transition that has been reached. Thus, in early-transition countries, forecasts can be based on extrapolation of trends observed over periods of several decades, rather than relying only on the recent past. Such long sequences hardly ever exist for delayed-transition countries, however, so forecasts have to be based on estimates for the recent past and assessments of socioeconomic and public health progress.
Third, projection accuracy would benefit from detailed study of the changes in risk profiles expected to produce future mortality declines. Table 5-1 summarizes some of the risk profiles for the three groups of developing countries. For example, changes in maternal education are likely to play a big role in future mortality declines in delayed-transition and very-delayed-transition countries. An improved understanding of trends in maternal education might therefore help improve projections. Similarly, the table suggests that future changes in behavior (smoking,
TABLE 5-1 Factors expected to affect life expectancy trends in developing countries
|
Group (current life expectancy) |
Expected trend type |
Factors |
|
Early transitions (70 years or higher) |
Gradual gains |
Chronic conditions: diet and behavior Older mortality: genetics |
|
Delayed transitions (55-69 years) |
Gradual gains |
Income and education Health interventions |
|
Very delayed transitions (under 55 years) |
Partly gradual, partly random gains |
Income and education Infrastructure development Health interventions Fertility decline |
drinking, and diet) could carry significant benefits in early-transition countries. Understanding the nature and likelihood of such changes in risk profiles could increase the robustness of mortality projections. Linking risk profiles to mortality rates has been tried with some success (Dowd et al., 1999), although the stability of such relationships is still unclear.
Drawing inferences from risk factors, in addition, has to be done with care and some skepticism, since we are probably no better (and may be worse) at forecasting such factors than at forecasting mortality itself. Formalizing the impact of such factors in elaborate simultaneous equation models (Sanderson, 1998), while worth some investigation, should therefore be attempted with caution. Simpler and more transparent models, or the exercise of informed judgment based on knowledge of risk factors, may work at least as well.
Unexpected Events
Social, Political, and Economic Crises
Unpredictable disruptions to upward trends in life expectancy may occur as a result of natural disasters, wars, and severe economic downturns. To the extent that such disruptions are transient, they are not of major concern to forecasters. Indeed, the historical record on which forecasts are based already includes disruptions that, while major for security forces or emergency preparedness agencies, have relatively minor demographic consequences. Examples include earthquakes, civil unrest in areas from Northern Ireland to Colombia, even the Great Depression. Furthermore, forecasters can expect periodic fluctuations in life expectancy to diminish as countries progress through the mortality transition. The development of effective systems to avoid catastrophic mortality, to provide the assistance needed to avert the most severe effects of local crises, and to establish a social safety net is a substantial part of the explanation. These developments partly explain the resiliency of mortality trends and provide a substantial argument for predicting that future gains in life expectancy should be fairly steady. However, some setbacks will have more enduring and long-lasting consequences, such as those experienced in Africa with the HIV/AIDS epidemic (addressed separately below) and the reversals in formerly socialist Europe. Such disruptions can permanently shift the life expectancy trend line downward.
At low life expectancy levels, disruptions have been and are likely to continue to be relatively more common because epidemics, disasters, food shortages, and political turmoil are more common. Forecasters need to take these problems into account, but can only do so (because of their inherent unpredictability) in some sort of average way. Life expectancy
TABLE 5-2 Number of cases of life expectancy decline in the period 1950-1995, by region and initial life expectancy level
|
Initial life expectancy |
||||
|
Region |
<55 |
55-69 |
70+ |
Notes |
|
Europe/former Soviet Union |
0 |
14 |
25 |
All cases are in Eastern Europe or the former Soviet Union. Mean annual change, for these periods only, was −0.14 years. |
|
U.S./Australia/Japan |
0 |
0 |
1 |
Australia 1965. |
|
Latin America/Caribbean |
0 |
2 |
1 |
El Salvador 1975, 1980; Puerto Rico 1990. |
|
Asia |
3 |
0 |
0 |
Cambodia 1970, 1975; East Timor 1975. |
|
Middle East/North Africa |
0 |
1 |
0 |
Iraq 1990. |
|
Sub-Saharan Africa |
22 |
3 |
0 |
Mean annual change was −0.72 years for these periods. |
|
Source: United Nations (1999). Each “case” is a decline in life expectancy in a single country or territoryfrom one 5-year period to the next, with the date dividing the twoperiods being given. For example, the 1965 Australian decline wasbetween the periods 1960-1965 and 1965-1970. |
||||
declines in the last 50 years have usually taken place before life expectancy reached 55 years, or before it had risen much beyond that (Table 5-2). The exceptions, the life expectancy declines associated with the collapse of the Communist bloc, have been substantially smaller than other such declines, in some comparisons not more than a fifth as large.
Some disruptions may leave a mark without actually reversing longrun increases in life expectancy. The great famine in China between 1957 and 1961 produced an estimated 30 million extra deaths that would not have been expected given post-World War II trends (Ashton et al., 1984). Yet life expectancy rebounded sufficiently so that, from the 1950s to the mid-1960s, it still increased an average of one year annually (and the pace then accelerated, temporarily, to two years annually). The severe debt crisis that engulfed many developing countries in the late 1970s and early 1980s produced only transient effects, mild departures from established trends toward higher life expectancies (Hill and Pebley, 1989; Palloni et al., 1996).
Disruptions can, however, be more severe. Of the wars and civil conflicts in the last 50 years, four, outside Sub-Saharan Africa, produced sufficient decline in life expectancy to lead to sharp change in population growth rates: the Cambodian genocide (where life expectancy declined
from 1965-1970 to 1975-1980), the occupation and annexation of East Timor (where the decline was in the 1970s), the long-running insurgency in El Salvador (in the 1970s and the early 1980s), and the continuing conflict involving Iraq (around 1990). While most deviations of life expectancy from its usual path have relatively minor effects on population size, these disruptions led to shifts in population growth rates at the limits of those typically observed.10
Life expectancy was similarly reduced substantially by conflicts in Rwanda, Liberia, Somalia, Uganda, and Burundi, and possibly in other countries of Sub-Saharan Africa too, although this is difficult to establish because of the simultaneous effects of the HIV/AIDS epidemic. This epidemic is responsible for the major current disruption to life expectancy improvements, providing a substantial challenge to forecasters and hinting at the possibility of other such threats in the future.
Emerging Infectious Diseases: The Case of HIV/AIDS
Future mortality declines may be slowed or halted by epidemics of new infectious diseases or resurgent older diseases (such as influenza, tuberculosis, and malaria), particularly in countries with poorer infrastructure and health conditions. The likelihood of such epidemics may increase as infectious organisms develop drug resistance and their hosts become pesticide-resistant, and it may also rise with increased travel and changing environmental conditions. The HIV/AIDS epidemic provides a possible foreshadowing of such mortality crises. For earlier forecasts issued before the mid-1980s, this epidemic represents an unexpected event. For current forecasts, it is a recognized phenomenon with dramatic effect, but one still difficult to project reliably.
The difficulties in projecting the mortality effect of HIV/AIDS stem from several characteristics of the epidemic. There are no visible markers of early HIV infection, and many who are infected have various reasons for concealing this fact or actually refusing to find out if they are infected. Not only individuals but also governments have avoided knowing or admitting the extent of infection. One of the major methods by which infection is spread, sexual behavior, is also everywhere considered a private matter rather than a reportable event. The degree and speed with
|
10 |
The criterion in identifying these cases was a change in population growth rates, in U.N. (1999) data for 5-year periods, at least two standard deviations greater than mean period-to-period changes across countries. Growth rate changes of this size are labeled “demographic quakes” in Appendix B. Another, less severe mortality crisis that could be noted is the decline around 1990 in life expectancy in Armenia, which was partly due to the collapse of the Soviet Union but may also have been exacerbated by war with Azerbaijan. |
which the epidemic will moderate depends largely, at least at present, on behavior change, which is more difficult to predict than other factors affecting mortality. Finally, the incubation period of the disease is so long that infected individuals do not show up as mortality statistics until many years later.
Some impact of HIV/AIDS on mortality is already evident, particularly in Sub-Saharan Africa. Recent Demographic and Health surveys in Kenya and Zambia measured significant increases in infant and child mortality in the 1990s, although no such increase was observed in Uganda. In some countries in this region, estimated life expectancy declined in the 1990s (United Nations, 1999). Although the two declines that were by far the largest (in Rwanda and Liberia) were not primarily due to the epidemic, the majority of the others probably were.
The epidemic may have caused various errors in previous forecasts of life expectancy for Sub-Saharan Africa, and it also introduces much uncertainty into current forecasts. Figure 5-9 illustrates this for two countries. Sharp discontinuities are now expected in future life expectancy,
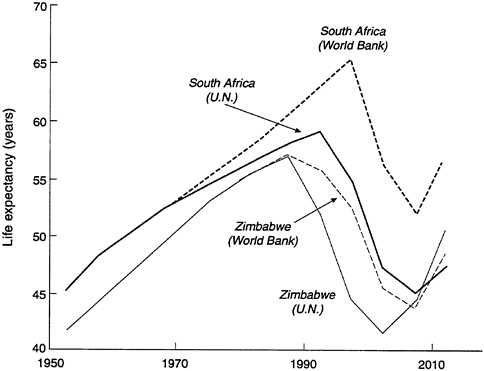
FIGURE 5-9 Impact of HIV/AIDS: Estimated and projected life expectancy in South Africa and Zimbabwe, according to the U.N. and the World Bank.
SOURCE: Data from United Nations (1999) and World Bank (2000).
with the steady increases of the previous decades replaced, for South Africa, by a fall of 13 years, in World Bank projections, and of 14 years, in U.N. projections, before an upward trend is reestablished. Both agencies forecast even larger reductions in Zimbabwe of either 14 or 16 years. These reductions would appear even larger if assessed against the life expectancy levels that could have been attained if AIDS deaths could have been entirely avoided. The differences between the two agencies reflect the inconclusiveness of existing data, even regarding current levels of life expectancy, but the agencies agree that reductions will wipe out the gains of several decades.
As these examples also illustrate, the bulk of the mortality impact of HIV/AIDS lies in the future. HIV/AIDS has spread to most countries of Sub-Saharan Africa, where prevalence levels now average 8 percent among adults and range as high as 30 percent. It mostly affects mortality among young children and young adults, two age segments with the most influence on levels of life expectancy. The epidemic could be responsible for the loss of a decade or more of life expectancy in the most affected subregions of Sub-Saharan Africa. However, this is itself a projection, subject to considerable uncertainty (Stoto, 1993). The dimensions of the epidemic are not known with much precision, and the ultimate effectiveness of any societal response can only be guessed at.
Equally uncertain is the extent to which the epidemic will establish itself in other regions of the world, in countries at later stages of mortality transition, from India and Thailand to Central America and Brazil. Recent prevalence estimates suggest that the epidemic might still become demographically significant in India and Southeast Asia but is unlikely to make rapid progress elsewhere (United Nations, 1998; see also National Research Council, 1996).
Projecting Mortality Crises
Whether the types of events that produce mortality crises can be predicted or not is beyond the scope of this report; this depends on research in other fields, such as biology and medicine, politics, climatology, environmental science, and even astronomy.
Even when such events are recognized, the degree of their mortality impact can be difficult to assess. For instance, the impact of the HIV/ AIDS epidemic depends on its special character. If the incubation period were shorter, infections would not spread as fast, because those infected would be more quickly identified. Similarly, the impact of war is variable The recovery from such events is also unpredictable. Life expectancy in China recovered quickly from devastating famine. Much more halting
recovery is predicted from the HIV/AIDS epidemic, but these predictions could be off substantially in either direction.
Conventional projections can be thought of as incorporating the effects of unforeseeable events of small to moderate impact, which essentially form part of the average performance that is the basis of forecasting. However, they do not take into account events of major impact and obviously cannot incorporate the possibility of qualitatively new mortality crises. The best that can be done is to update forecasts often, certainly soon after such events are recognized and their potential impact can be assessed.
CONCLUSIONS
Transitions
Mortality has been in a centuries-long transition from high to low levels. In industrial countries, the transition has progressed, since the 1700s, through four stages. First, as epidemics were reduced and food supply became more stable, fluctuations in mortality became smaller and less frequent. Second, as public health interventions and preventive measures took hold and standards of living continued to climb, levels of mortality began to decline, although somewhat irregularly. Third, with the acceptance of the germ theory of disease, better controls on infectious disease, and development of new drugs, large reductions in mortality took place among infants and among adults under age 50. Fourth, with continuing medical developments, child and young adult mortality have been brought to low levels, while gains in survival at older ages have begun to be made at a steady pace.
The parallel transitions in developing countries have been much more recent and more rapid. For much of Latin America and the Caribbean, life expectancy has risen above 70 years, roughly the lower boundary for the fourth transition stage for industrial countries. A larger group of developing countries started transitions only after World War II and now have life expectancies between 55 and 70 years, similar to the third stage for industrial countries. These transitions have benefited from the diffusion of health care knowledge and its effective application. Some countries remain that have not reached the third stage of transition, and that have therefore still not realized many of the possible gains from medical knowledge. In some of these cases, especially in Sub-Saharan Africa, mortality is actually rising as a result of the HIV/AIDS epidemic.
Projections
These transitional stages represent generalizations from demographic history, not an inexorable process through which countries must pass. Nevertheless, building on this historical record, as well as on the fact that mortality trends have become quite regular and gradual, forecasters have been able to project continuing improvements in life expectancy with reasonable, although far from perfect, accuracy.
Discounting the error resulting from misestimates of initial levels of life expectancy, projections of the trend in life expectancy for the world as a whole over the last quarter-century have been quite accurate. Projections for countries, in contrast, have generally been biased downward, because forecasters somewhat underestimated the speed of transitions in developing regions and assumed that improvements would slow in industrial regions more than they have. Such errors have had only small effects on projected population, although larger effects are visible for particular age groups, especially the elderly.
For one region, however, forecasters have been wrong in the opposite direction. They expected greater improvement in life expectancy in Sub-Saharan Africa than has actually taken place. They did not foresee the spread of HIV/AIDS or the uneven progress in developing health systems in the region.
Future Trends
Projections of future mortality trends can continue to build on the record of rising life expectancies. There is in fact no theoretical or empirical basis for believing that life expectancy will reach some absolute limit in the foreseeable future. It is true that, in industrial countries, mortality is now so low among children and adults other than the elderly that further gains at these ages (except potentially among young adult males) are likely to be slow and quite limited. However, gains in survival continue to be made among the elderly. Given the likelihood of future medical advances and the possibility of breakthroughs, these gains should continue and translate into steady, although relatively slow, gains in life expectancy, provided societies can preserve the conditions essential for such advances. Mortality projections would probably therefore be improved, and the downward bias in longer projections partly remedied, if no upper limit on life expectancy were imposed.
Future gains in life expectancy will undoubtedly be interrupted by unexpected events, similar to the worldwide influenza pandemic of 1918-1919 or the more recent civil conflicts in Rwanda and Liberia. Demogra
phers do not have the tools to predict such events and cannot therefore incorporate them in forecasts. This shortcoming is mitigated by three considerations. First, only a relatively small proportion of such events permanently alters the rising trend in life expectancy. Even the loss of 30 million people in China's famine of 1957-1961 does not seem to have permanently deflected the trajectory of rising life expectancy in China. Second, some such events are part of the historical record that forms the basis for projections, which can therefore be assumed to incorporate the effects of unexpected events of more moderate impact. Third, in the long view, the mortality impact of such events is being gradually mitigated by the development of national and international systems to cope with disasters. Nevertheless, some unexpected mortality crises are very likely to occur in unidentifiable countries, interrupting the upward march of life expectancy and shifting mortality trends to new trajectories.
Research Priorities
Like fertility projections, mortality projections would improve with more accurate demographic data. Levels of mortality and patterns of death by age are not known with much precision for most developing countries. Forecasters generally apply model age patterns of mortality, and while these probably fit reasonably well, their applicability at older ages and at higher levels of life expectancy is quite uncertain. For the majority of countries of the world, little is known with any certainty about deaths at adult ages and about the distribution of deaths by cause. Improvements in such data are neither simple nor quick, but without them, projections will continue to depend on uncertain mortality baselines and imperfect understanding of mortality patterns.
Experimentation is advisable with alternative procedures for projecting mortality. At high life expectancy levels, one possibility is to investigate projecting age-specific mortality rates. By applying time-series methods when possible and focusing on the older ages at which most deaths take place, this approach could be a feasible and possibly superior alternative to projecting life expectancy. It would depend on better understanding of the determinants of mortality at older ages, particularly at age 80 and older. Significant progress in this area would require that demographers become better informed about and associate themselves with biomedical research, particularly on the biology of aging (see, e.g., National Research Council, 1997).
A second possibility is projecting mortality from risk profiles related to causes of death in a population. This is not a straightforward matter, as past difficulties with projecting causes of death have demonstrated (e.g., Stoto and Durch, 1993). Reliable information on risk profiles and their
relationship to overall mortality at various ages is often lacking. Obtaining this information depends on further epidemiological and medical research. This approach also requires projecting risk profiles into the future, which may involve the development of structural equation models relating these profiles to broader socioeconomic conditions.
Research in these two areas would probably also be useful in improving mortality projections at low life expectancy levels. Considerably more critical for particular developing countries, however, would be research to increase understanding and predictability of the course and demographic consequences of the HIV/AIDS epidemic. Although much has been learned about the epidemic in the last decade or so, prevalence estimates for affected areas continue to be drawn from limited data, and the long-term prognoses for the size of the epidemic and its demographic impact still rest on unverified assumptions. Other health, environmental, and political crises also deserve more attention, since they can interrupt the otherwise ineluctable gains in life expectancies.
More basic is broader demographic research to distinguish patterns and trends at different stages of the mortality transition. We already know that the mortality experience of developing countries follows quite well the mortality experience of industrial countries. But there are important time lags and variations in the pace of improvement. The specific time path of mortality decline in one country may depend, for example, on its level of development, its literacy rate, and the capabilities of its government. Accurate projections require that we understand these dependencies better.
At a more speculative level, perhaps research on cohort effects in mortality might eventually help improve mortality projections. Mortality rates vary not only from period to period but also across cohorts. Period effects are generally larger in magnitude than cohort effects and are captured by levels of current life expectancy. But cohort effects, reflecting individual life histories, also exist. If one were able to identify specific events or sets of conditions to which cohorts have been exposed in the past, it is at least feasible to associate them with specific mortality risks in the future. Such assessments of cohort influences may add an additional measure of accuracy to projections.
A final area for research concerns the effects of public policy. Public expenditures on biomedical research, on the delivery of health services, and on campaigns to promote healthier lifestyles will be important in future gains in life expectancy. Will such expenditures be constrained, and will this slow mortality reductions, especially at older ages? Translating expenditures into mortality reductions is today a highly speculative exercise, and much more research would be needed before forecasters could take this into account.
REFERENCES
Arriaga, E.E., and K. Davis 1969 The pattern of mortality change in Latin America. Demography 6(3):223-242.
Ashton, B., K. Hill, A. Piazza, and R. Zeitz 1984 Famine in China, 1958-61. Population and Development Review 10(4):613-645.
Barker, D.J.P. 1998 Mothers, Babies, and Health in Later Life. 2nd ed. Edinburgh: Churchill Livingstone.
Bobadilla, J.L., and C.A. Costello 1997 Premature death in the new independent states: Overview. Pp. 1-33 in National Research Council, Premature Death in the New Independent States. Committee on Population, Commission on Behavioral and Social Sciences and Education. J.L. Bobadilla, C.A. Costello, and F. Mitchell, eds. Washington, D.C.: National Academy Press.
Bos, E., M.T. Vu, E. Massiah, and R.A. Bulatao 1994 World Population Projections: Estimates and Projections with Related Demographic Statistics. Baltimore: Johns Hopkins University Press.
Bourgeois-Pichat, J. 1963 Application of factor analysis to the study of mortality. Pp. 194-299 in Milbank Memorial Fund, Emerging Techniques in Population Research: Proceedings of a Round Table at the Thirty-ninth Annual Conference of the Milbank Memorial Fund, September 18-19, 1962. [ New York].
1978 Future outlook for mortality decline in the world. Population Bulletin of the United Nations 11:12-41.
Brass, W. 1971 On the scale of mortality. In W. Brass, ed., Biological Aspects of Demography. London: Taylor and Francis.
Bulatao, R.A., and E. Bos 1989 Projecting Mortality for All Countries. Policy, Planning, and Research Working Paper 337. Population and Human Resources Department, World Bank, Washington, D.C.
Carey, J.R., P. Liedo, D. Orozco, and J.W. Vaupel 1992 Slowing of mortality rates at older ages in large medfly cohorts. Science 258:457-461.
Carnes, B.A., S.J. Olshansky, and D. Grahn 1996 Continuing the search for a fundamental law of mortality. Population and Development Review 22:231-264.
Chesnais, J.-C. 1992 The Demographic Transition: Stages, Patterns, and Economic Implications: A Longitudinal Study of Sixty-Seven Countries Covering the Period 1720-1984. Translated by Elizabeth and Philip Kreager. Oxford, Eng.: Clarendon Press.
Cipolla, C.M. 1981 Fighting the Plague in Seventeenth-Century Italy. Madison: University of Wisconsin Press.
Coale, A.J., and G. Guo 1989 Revised regional model life tables at very low levels of mortality . Population Index 55:613-643.
Coale, A.J., and P. Demeny, with B. Vaughan 1983 Regional Model Life Tables and Stable Populations. 2nd ed. New York: Academic Press.
Curtsinger, J.W., H.H. Fukui, D.R. Townsend, and J.W. Vaupel 1992 Demography of genotypes: Failure of the limited-lifespan paradigm in Drosophila melanogaster. Science 258:461-464.
Dowd, J., K. Manton, E. Stallard, and M.A. Woodbury 1999 The Effect of Chronic Diseases: Factors in Four Countries Using Multiple Data Sources. Draft, World Health Organization, Geneva.
Dupaquier, J. 1979 L'analyse statistique des crises de mortalité. In H. Charbonneau and A. Larose, eds., The Great Mortalities: Methodological Studies of Demographic Crises in the Past. Liège, Belgium: Ordina Editions.
Evans, R.J. 1987 Death in Hamburg: Society and Politics in the Cholera Years, 1830-1910 . Oxford, Eng.: Clarendon Press.
Flinn, M.W. 1974 The stabilization of mortality in pre-industrial Western Europe. Journal of European Economic History 3(2):285-318.
Floud, R., K. Wachter, and A. Gregory 1990 Height, Health and History: Nutritional Status in the United Kingdom, 1750-1980. Cambridge Studies in Population, Economy and Society in Past Time, No. 9. New York: Cambridge University Press.
Fogel, R.W. 1986 Nutrition and the decline in mortality since 1700: Some preliminary findings. Pp. 439-555 in S.L. Engerman and R.E. Gallman, eds., Long-Term Factors in American Economic Growth. Chicago: University of Chicago Press.
1989 Second Thoughts on the European Escape from Hunger: Famines, Price Elasticities, Entitlements, Chronic Malnutrition, and Mortality Rates . Working Paper Series on Historical Factors in Long Run Growth, No. 1. National Bureau of Economic Research, Cambridge, Mass.
1990 The Conquest of High Mortality and Hunger in Europe and America: Timing and Mechanisms. Working Paper Series on Historical Factors in Long Run Growth, No. 16. National Bureau of Economic Research, Cambridge, Mass.
1991 New Sources and New Techniques for the Study of Secular Trends in Nutritional Status, Health, Mortality, and the Process of Aging. Working Paper Series on Historical Factors in Long Run Growth, No. 26. National Bureau of Economic Research, Cambridge, Mass.
Fogel, R.W., and D.L. Costa 1997 A theory of technophysio evolution, with some implications for forecasting population, health care costs, and pension costs. Demography 34(1):49-66.
Frenk, J.T., T. Frejka, J.L. Bobadilla, C. Stern, and J. Sepulveda 1991 Elements for a theory of the health transition. Health Transition Review 1(1):21-38.
Fries, J.F. 1980 Aging, natural death, and the compression of morbidity. New England Journal of Medicine 303:130-135.
Galloway, P.R. 1986 Long-term fluctuations in climate and population in the preindustrial era. Population and Development Review 12(1):1-24.
Guha, S. 1993 Comment and controversy: Sociobiology and human social behavior. Journal of Interdisciplinary History 23(4): 849-857.
Hill, K., and A.R. Pebley 1989 Child mortality in the developing world. Population and Development Review 15(4):657-687.
Hollingsworth, T.H. 1977 Mortality in the British peerage families since 1600. Population 32:323-325.
Horiuchi, S. 1997 Epidemiological Transitions in Developed Countries: Past, Present and Future. Paper presented at the United Nations Symposium on Health and Mortality, Brussels, November.
Horiuchi, S., and J.R. Wilmoth 1998 Deceleration in the age pattern of mortality at older ages. Demography 35(4):391-412.
Kannisto, V. 1994 Development of Oldest-Old Mortality, 1950-1990: Evidence from 28 Developed Countries. Monographs on Population Aging, No. 1. Odense, Denmark: Odense University Press.
1996 The Advancing Frontier of Survival: Life Tables for Old Age. Monographs on Population Aging, No. 3. Odense, Denmark: Odense University Press.
Kannisto, V., J. Lauritsen, A.R. Thatcher, and J.W. Vaupel 1994 Reductions in mortality at advanced ages. Population and Development Review 21:793-810.
Keyfitz, N., and W. Flieger 1968 World Population: An Analysis of Vital Data. Chicago: University of Chicago Press.
Komlos, J. 1989 Nutrition and Economic Development in the Eighteenth-Century Habsburg Monarchy: An Anthropometric History. Princeton: Princeton University Press.
Leavitt, J.W. 1982 The Healthiest City: Milwaukee and the Politics of Health Reform. Princeton, N.J.: Princeton University Press.
Lederman, S., and J. Breas 1959 Les dimensions de la mortalité. Population 14.
Lee, R.D., and L. Carter 1992 Modeling and forecasting U.S. mortality. Journal of the American Statistical Association 86:839-855.
Lee, R.D., and S. Tuljapurkar 2000 Population forecasting for fiscal planning: Issues and innovations . In A. Auerbach and R.D. Lee, eds., Demography and Fiscal Policy. Cambridge, Mass.: Cambridge University Press, forthcoming.
Livi-Bacci, M. 1990 Population and Nutrition: An Essay on European Demographic History . Translated by Tania Croft-Murray. Cambridge, Eng.: Cambridge University Press.
1997 A Concise History of World Population. Translated by Carl Ipsen, 2nd ed. Cambridge, Mass.: Blackwell.
2000 The Population of Europe: A History. Oxford, Eng.: Blackwell.
Lunn, P.G. 1991 Nutrition, immunity and infection. Pp. 131-145 in R. Schofield, D. Reher, and A. Bideau, eds., The Decline of Mortality in Europe. Oxford, Eng.: Clarendon Press.
Manton, K.G. 1986 Past and future life expectancy increases at later ages: Their implications for the linkage of chronic morbidity, disability, and mortality. Journal of Gerontology 41:672-681.
Martorell, R. 1996 The role of nutrition in economic development. Nutrition Reviews 54(4):S66-S71.
Martorell, R., and T.J. Ho 1984 Malnutrition, morbidity and mortality. Population and Development Review 10(Supplement):49-68.
McKeown, T. 1976 The Modern Rise of Population. London: Academic Press.
1988 The Origins of Human Disease. London: Basil Blackwell.
McKeown, T., and R.G. Record 1962 Reasons for the decline of mortality in England and Wales during the 19th century. Population Studies 16:94-122.
McNeill, W.H. 1976 Plagues and Peoples. Garden City, N.Y.: Anchor Press/Doubleday.
McQuestion, M.J. 1999 The Role of Public Health Campaigns in Reducing Mortality in Two Countries in Latin America. Ph.D. Dissertation, Center for Demography and Ecology, University of Wisconsin, Madison.
Meegama, S.A. 1967 Malaria eradication and its effects on mortality levels. Population Studies 21(3):207-237.
Mosley, W.H. 1984 Child survival: Research and policy. Population and Development Review 10(Supplement):3-23.
National Research Council 1996 Preventing and Mitigating AIDS in Sub-Saharan Africa: Research and Data Priorities for the Social and Behavioral Sciences. Panel on Data and Research Priorities for Arresting AIDS in Sub-Saharan Africa. B. Cohen and J. Trussell, eds. Committee on Population, Commission on Behavioral and Social Sciences and Education. Washington, D.C.: National Academy Press.
1997 Between Zeus and the Salmon: The Biodemography of Longevity. Committee on Population. K.W. Wachter and C.E. Finch, eds. Commission on Behavioral and Social Sciences and Education. Washington, D.C.: National Academy Press.
Olshansky, S.J., and B.A. Carnes 1996 Prospect for extended survival: A critical review of the biological evidence. Pp. 39-58 in G. Caselli and A.D. Lopez, eds., Health and Mortality Among Elderly Populations. Oxford, Eng.: Clarendon Press, and Liège, Belgium: International Union for the Scientific Study of Population.
Olshansky, S.J., B.A. Carnes, and 1990 In search of Methuselah: Estimating the upper limits to human longevity . Science 250(4981):634-640.
Palloni, A. 1981 Mortality in Latin America: Emerging patterns. Population and Development Review 7(4):623-649.
Palloni, A., K. Hill, and G. Pinto 1996 Economic swings and demographic changes in the history of Latin America . Population Studies 50(1):105-132.
Preston, S.H. 1976 Mortality Patterns in National Populations. New York: Academic Press.
1980 Causes and consequences of mortality declines in less developed countries during the twentieth century. In R. Easterlin, ed., Population and Economic Change in Developing Countries. Chicago: University of Chicago Press.
Preston, S.H., and M.R. Haines 1991 Fatal Years: Child Mortality in Late Nineteenth-century America. NBER Series on Long-Term Factors in Economic Development. Princeton, N.J.: Princeton University Press.
Razzell, P.E. 1965 Population change in eighteenth-century England: A reinterpretation . Economic History Review 18:743-771.
1993 The growth of population in eighteenth-century England: A critical reappraisal. Journal of Economic History 53(4):743-771.
Rosen, George 1993 A History of Public Health. Baltimore: John Hopkins University Press.
Sanderson, W.C. 1998 Knowledge can improve forecasts: A review of selected socioeconomic population projection models. Population and Development Review 24(Supplement):88-117.
Schofield, R., and D. Reher 1991 The decline of mortality in Europe. Pp. 1-17 in R. Schofield, D. Reher, and A. Bideau, eds., The Decline of Mortality in Europe. Oxford, Eng.: Clarendon Press.
Scrimshaw, N.S., C.E. Taylor, and J.E. Gordon 1968 Interactions of Nutrition and Infection. Geneva: World Health Organization.
Stoto, M.A. 1993 Models of the demographic effect of AIDS. Pp. 350-379 in National Research Council, Demographic Change in Sub-Saharan Africa. Panel on the Population Dynamics of Sub-Saharan Africa, Committee on Population, Commission on Behavioral and Social Sciences and Education . K.A. Foote, K.H. Hill, and L.G. Martin, eds. Washington, D.C.: National Academy Press.
Stoto, M.A., and J.S. Durch 1993 Forecasting survival, health, and disability: Report on a workshop . Population and Development Review 19(3):557-581.
Szreter, S. 1988 The importance of social intervention in Britain's mortality decline circa 1850-1914: A reinterpretation of the role of public health. Social History of Medicine 1(1):1-38.
Tuljapurkar, S., and C. Boe 1999 Mortality change and forecasting: How much and how little do we know . North American Actuarial Journal 2:13-47.
United Nations (U.N.) 1955 Age and Sex Patterns of Mortality. Population Studies No 25. New York: Department of International Economic and Social Affairs, United Nations .
1982 Model Life Tables for Developing Countries. Population Studies No 77. New York: Department of International Economic and Social Affairs, United Nations .
1998 The Demographic Impact of HIV/AIDS: Report of the Technical Meeting , New York, November 10. Population Division, United Nations.
1999 World Population Prospects: The 1998 Revision, Vol. 1, Comprehensive Tables. New York: United Nations.
U.S. Census Bureau n.d. Making Population Projections. U.S. Census Bureau, Washington, D.C.
Vallin, J. 1991 Mortality in Europe from 1720 to 1914: Long-term trends and changes in patterns by age and sex. In R. Schofield, D. Reher, and A. Bideau, eds., The Decline of Mortality in Europe. Oxford, Eng.: Clarendon Press.
Vaupel, J.W. 1986 How change in age-specific mortality affects life expectancy. Population Studies 40(1):147-157.
1997 Trajectories of mortality at advanced ages. Pp. 17-37 in National Research Council, Between Zeus and the Salmon: The Biodemography of Longevity. Committee on Population. K.W. Wachter and C.E. Finch, eds. Commission on Behavioral and Social Sciences and Education. Washington, D.C.: National Academy Press.
Vaupel, J.W., and C. Romo 2000 How mortality improvement increases population growth. In a chapter on “Population dynamics,” pp. 350-357 in E. Dockner, R. Hartl, M. Luptacik, G. Sorger, Optimization, Dynamics and Economic Analysis. Berlin: Springer-Verlag, forthcoming.
Vaupel, J.W., J.R. Carey, K. Christensen, T.E. Johnson, A.I. Yashin, N.V. Holm, I.A. Iachine, V. Kannisto, A.A. Khazaeli, P. Liedo, V.D. Longo, Y. Zeng, K.G. Manton, and J.W. Curtsinger 1998 Biodemographic trajectories of longevity. Science 280(5365):855-860.
Wilmoth, J.R. 1998 The future of human longevity: A demographer's perspective. Science 280:395-397.
Woods, R., and J. Woodward 1984 Mortality, poverty and the environment. In R. Woods and J. Woodward, eds., Urban Disease and Mortality in Nineteenth Century England. London: Batsford Academic and Educational.
World Bank 2000 World Development Indicators 2000. Washington, D.C.: World Bank, forthcoming.
Wrigley, E.A., and R.S. Schofield 1981 The Population History of England, 1541-1871: A Reconstruction. Cambridge, Mass.: Harvard University Press.
Zlotnik, H. 1999 World Population Prospects: The 1998 Revision. Paper submitted to the Joint ECE-Eurostat Work Session on Demographic Projections, Perugia, Italy, May 3-7.


