
1
Introduction
The role of population trends in human welfare has been the subject of long-standing debate. When the modern expansion of the human population began in the late 18th century, Thomas Malthus argued that unrestrained population growth would be limited by constraints on food production. Instead, world population has expanded much more rapidly than Malthus envisioned, growing from 1 to 6 billion over the past two centuries. Only very recently has population growth approached or actually reached zero in much of the industrial world and has rapid population growth begun to wind down in developing countries.
But is rapid population growth—and its potential adverse consequences—actually coming to an end? The answer, insofar as it can be given scientifically at this time, lies in projections or forecasts1 of world
|
1 |
The Multilingual Demographic Dictionary (International Union for the Scientific Study of Population, 1982) defines population projections as “calculations which show the future development of a population when certain assumptions are made about the future course of population change, usually with respect to fertility, mortality, and migration. They are in general purely formal calculations, developing the implications of the assumptions that are made.” The same dictionary defines a population forecast as “a projection in which the assumptions are considered to yield a realistic picture of the probable future development of a population.” Out of a sense that it would convey an unjustified confidence in the results, some demographers avoid using the term “forecast.” Nevertheless, in the contemporary demographic literature on projections (especially literature with a statistical or economic slant), the term “forecast” is often applied to a projection—or specifically to a medium variant when an agency makes multiple variants, but not to high and low variants (Ahlburg and Lutz, 1999). Many users similarly treat a medium variant as a forecast. To be precise, each variant should be considered a point forecast, since a forecast is a predictive distribution of possible future outcomes. Recognizing this, we still adopt the usual convention of referring to a medium projection, or a single projection if no variants are provided, simply as a forecast when the meaning is clear in context. |
population. This report considers these projections, asks what they really say and why they say it, and tries to determine whether their answers can be trusted and whether they can be improved.
Forecasts, whether they involve weather or politics or the stock market, are both essential and risky. Forecasts guide actions and decisions small and large, from carrying an umbrella to instituting huge social programs. Population forecasts can imply wide-ranging consequences for societies and the environment, and it is therefore crucial to understand the stories they tell, the challenges they pose, and the uncertainty at their core.
As they have been doing periodically for many years, international organizations have recently revised their projections of how many people will inhabit the globe in the 21st century. These agencies project population for individual countries, because such projections are useful for a variety of policy and planning purposes, and also because such a disaggregated approach is considered a good way to obtain regional and world totals.
The updating of global and regional population projections every few years used to be a routine event that was ignored by much of the demographic community, in part because the numbers did not change much from one assessment to the next. In recent years, however, population projections have become a matter of broader interest and have even generated some controversy. Newspaper accounts have kept the general public up to date not only on changes in actual population forecasts, but also on the ongoing debate among population experts about future demographic trends (e.g., Cone, 1999; Crossette, 1999; Delattre, 1999; Lynch, 2000).
One of the main reasons for the renewed public interest in population forecasts is that in the most recent projections, estimates of population size for the next century were revised downward by a significant amount. The United Nations (U.N.) and the World Bank still predict that world population will grow from 6 billion today to nearly 9 billion by the year 2050. However, this growth is smaller than had earlier been anticipated and incorporates the prospect of actual population decline in some parts of the world, particularly Europe and Japan.
In addition, the accuracy of some critical assumptions underlying current projections is being questioned. For example, a common assumption underlying past projections is that, in the long run, fertility or average family size will equal the so-called replacement level, at which each generation exactly replaces the previous one. But if the number of children per woman in fact drops permanently below the replacement level in most countries, then even the newly revised population projections are still too high.
Recognizing the importance of these and related demographic issues, the National Research Council responded to a request from a consortium of public and private sponsors by forming the Panel on Population Projections in 1998. The panel's mandate was to:
-
Examine in detail the demographic assumptions, both explicit and implicit, that underlie the world population projections being made today.
-
Assess the implications for these population projections of the newest research findings on fertility, mortality, and migration levels and trends.
-
Review existing population projections for their accuracy; describe, as far as possible, the uncertainty that surrounds these forecasts; and, when appropriate, recommend changes or variances in the assumptions and statistical methods used to make population projections.
-
Develop a research agenda that can help population scientists focus on questions about world population projections raised by this review.
The panel was not asked to construct a new forecast but to provide scientific guidance to assess and improve existing forecasts. The panel examined projections for countries and groups of countries. It did not examine subnational projections, such as projections for regions and urban areas, which were considered beyond its scope. The panel began its work in fall 1998, and this report summarizes its findings.
OVERVIEW OF WORLD PROJECTIONS
Figure 1-1 presents past trends in world population size since 1900 and future projections to 2050, as estimated by four different institutions: the U.N. (1999b), the World Bank (1999), the U.S. Census Bureau (1999), and the International Institute for Applied Systems Analysis (IIASA; Lutz,
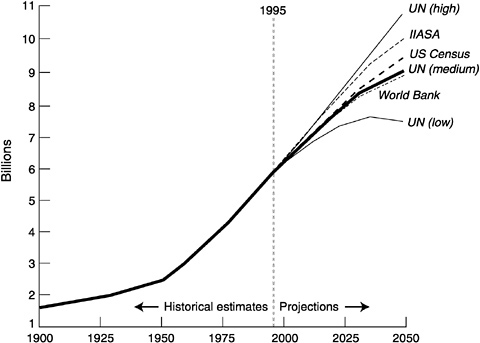
SOURCE: Data from United Nations (1999b), World Bank (1999), U.S. Census Bureau (1999), and Lutz (1996).
1996).2 (The U.N. medium projection is complemented, in the figure, by the U.N. high and low projections, which are discussed later.)
In 1900, the world's population stood at about 1.6 billion, and by 1950, it had increased to 2.5 billion. Starting at that midpoint in the century, population growth accelerated. As a result, in the next 50 years, world population more than doubled. By the end of 1999, it had reached 6 billion. The rapid increase in the number of people in the world can be
|
2 |
The first three agencies regularly update their long-range projections for the world, major regions, and countries. Biannually, the U.N. publishes country projections to the year 2050. At irregular intervals (most recently in United Nations, 1999a), it extends its projections for the world and for major regions up to the year 2150. The World Bank annually prepares a full set of country-specific projections to the mid-22nd century. The U.S. Census Bureau updates its international projections on a somewhat less regular schedule. A few years ago, IIASA prepared projections for the world and for major regions, but did not produce country-level results. An overview of earlier projections conducted by other analysts is provided by Frejka (1981). |
demonstrated by the remarkable shrinking of the time required to add each successive billion people to the total population. The first billion was reached around 1800, the second billion, 125 years later, the third, 35 years later, the fourth, 14 years later, the fifth, 13 years later, and the sixth in 1999, just 12 years later.
All the major international agencies involved expect world population growth to continue at least to 2050. Figure 1-1 shows that, in the most recent U.N. medium projection (United Nations, 1999b), the population of the world will reach 8.9 billion in 2050. The World Bank's (1999) projection for the year 2050 is virtually indistinguishable from that of the U.N. Projections made by the U.S. Census Bureau present broadly similar results (U.S. Census Bureau, 1999). Only IIASA expects a somewhat larger global population by the middle of the next century (Lutz, 1996).3
Projections beyond the year 2050 by the U.N. and the World Bank expect growth to continue, with world population size reaching about 10 billion in the 22nd century. Such very long-range projections have considerable uncertainty and are difficult to evaluate, given that the historical record we can draw on is far shorter. Therefore, this report focuses only on projections up to 2050.
The plot of world population growth in Figure 1-1 indicates that we are now near the steepest part of the curve. All four international agencies foresee a significant slowdown in population growth over the next 50 years. The projected trend in the number of people added to world population each year is presented in Figure 1-2. After rising sharply over the past several decades, annual population increments reached a peak in the late 1980s, when 86 million people were being added to the world's total every year. In the first two decades of the 21st century, the annual increment is expected to drop slightly, but it will still be above 70 million.
Figure 1-2 also shows the concurrent trend in the world's annual growth rate (that is, the percentage by which the population grows each year). Like the annual increments, the growth rate rises and falls between 1950 and 2050. However, it peaked—at just over 2 percent a year—in the late 1960s, which is two decades before the annual increments reached their highest level. Between the late 1960s and the late 1980s, the world's annual growth rate declined, while the annual increment rose. These trends are not inconsistent. A high but declining growth rate applied to a rapidly expanding population base can yield rising annual increments of the population.
|
3 |
One reason why the IIASA population projections are higher than those of the other agencies could be that they are no longer current. They were made a few years earlier and do not fully take into account some of the most recent trends in fertility and mortality. |
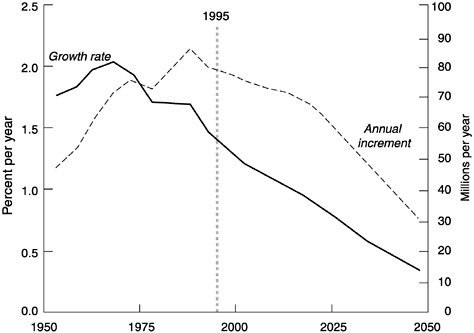
FIGURE 1-2 World population growth rates and annual increments, 1950-2050.
SOURCE: Data from United Nations (1999b).
Table 1-1 summarizes key results from the four agencies' projections of population growth at the regional level between 1995 and 2050. Nearly all future global growth is expected to occur in developing regions, that is, in Africa, Asia (excluding Japan), and Latin America. The U.N. projects that the population of the developing world will increase by 72 percent, rising from 4.5 to 7.8 billion people between 1995 and 2050. In contrast, in the industrial world (Europe and Russia, Northern America, Japan, and Australia and New Zealand), population size is forecast to remain close to its current level of 1.17 billion.4
All four agencies agree that the rate of expected future growth between 1995 and 2050 will vary widely among the different regions of the
|
4 |
This distinction between developing regions or countries and industrial regions or countries follows U.N. Population Division usage. We use the term “industrial” to refer, here and elsewhere in the report, to the countries variously described as industrialized, developed, or more developed. Over time, of course, more countries should become industrial or even postindustrial, but we do not attempt to project this change in status. Northern America includes Canada and the United States but not Mexico, Central America, or the Caribbean. |
TABLE 1-1 Population projections by four international agencies for the world and major regions (in billions)
|
1995 base |
Projection to 2050 |
Percent increase 1995-2050 |
|||||||
|
Source |
U.N. |
U.N. |
World Bank |
U.S. Census Bureau |
IIASA |
U.N. |
World Bank |
U.S. Census Bureau |
IIASA |
|
World |
5.67 |
8.91 |
8.91 |
9.30 |
9.87 |
57 |
57 |
64 |
74 |
|
Developing regions |
4.49 |
7.75 |
7.78 |
8.15 |
8.55 |
72 |
73 |
81 |
90 |
|
Industrial regions |
1.17 |
1.16 |
1.13 |
1.15 |
1.32 |
−1 |
−4 |
−2 |
13 |
|
Sub-Saharan Africa |
0.57 |
1.52 |
1.50 |
1.76 |
1.60 |
169 |
165 |
211 |
183 |
|
Middle East and North Africa |
0.30 |
0.62 |
0.60 |
0.71 |
0.96 |
108 |
100 |
139 |
220 |
|
South and Central Asia |
1.37 |
2.43 |
2.41 |
2.55 |
2.48 |
78 |
77 |
87 |
82 |
|
East Asia and Pacific |
1.93 |
2.51 |
2.59 |
2.44 |
2.76 |
30 |
34 |
26 |
43 |
|
Latin America and Caribbean |
0.48 |
0.81 |
0.81 |
0.81 |
0.91 |
68 |
69 |
70 |
89 |
|
Northern America |
0.30 |
0.39 |
0.35 |
0.43 |
0.41 |
32 |
18 |
46 |
37 |
|
Europe and Russia |
0.73 |
0.63 |
0.64 |
0.59 |
0.77 |
−14 |
−11 |
−19 |
5 |
|
Sources: United Nations (1999b); World Bank (1999); U.S. Census Bureau(1999); Lutz (1996). Unless indicated, cited projections are fromthe medium variants or the equivalent, if multiple variants exist. |
|||||||||
world. In developing regions, the U.N. anticipates overall growth in this time period to range from a high of 169 percent in Sub-Saharan Africa and 108 percent in the Middle East and North Africa to a low of 30 percent in East Asia. Trends in the two principal regions of the industrial world are also expected to diverge: the population of Northern America is expected to increase by 32 percent (from 0.30 to 0.39 billion people), while the population of Europe declines by 14 percent (from 0.73 to 0.63 billion). As is the case at the global level, the U.N. and the World Bank are in close agreement over most of these regional projections, while IIASA and the U.S. Census Bureau generally expect somewhat higher rates of population growth.
One consequence of this wide diversity in regional growth rates is that the distribution of the world's population will shift significantly over time. While the shares of East and South Asia (58 percent) and of Latin America (8 percent) will change relatively little, Europe 's share will decline by nearly half (from 13 to 7 percent) and that of Sub-Saharan Africa will rise (from 10 to 17 percent). Between 1995 and 2050, the industrial-region share of total world population is expected to decline from 21 to 13 percent.
As the weight of the world's population shifts increasingly to developing regions and away from industrial regions, the ranking of the world's largest countries will be transformed. Table 1-2 lists the world's 10 most populous countries in 1995 and as projected for the year 2050. In 1995, China (1.22 billion) and India (0.93 billion) had by far the largest populations, together accounting for nearly half the total developing-
TABLE 1-2 Population of the world's 10 largest countries, 1995 and 2050 (millions)
|
Country |
1995 |
Country |
2050 |
|
China |
1,221 |
India |
1,529 |
|
India |
934 |
China |
1,478 |
|
United States of America |
267 |
United States of America |
349 |
|
Indonesia |
197 |
Pakistan |
345 |
|
Brazil |
159 |
Indonesia |
312 |
|
Russian Federation |
148 |
Nigeria |
244 |
|
Pakistan |
136 |
Brazil |
244 |
|
Japan |
125 |
Bangladesh |
212 |
|
Bangladesh |
119 |
Ethiopia |
169 |
|
Nigeria |
99 |
Congo, Democratic Republic of the |
160 |
|
Source: United Nations (1999b). |
|||
country population. Besides China and India, the 1995 list includes four other Asian countries, one European country, one Northern American country, and one country each in Latin America and Africa. By 2050, if current projections hold, India's population of 1.53 billion will exceed China's, and Ethiopia and the Democratic Republic of the Congo will have risen into the top 10 countries, replacing Japan and the Russian Federation. The United States will probably be the only industrial country remaining on the list.
Population projections also provide information on prospective changes in the world's age distribution. As a result of declines in fertility and increases in life expectancy, both the average age of the population and the proportion of people who are over age 65 will rise in every major region of the world. In the developing world, the proportion of people aged 65 and older is expected to triple between 1995 and 2050 (from 4.7 to 15 percent), with the most rapid increases occurring in East Asia and Latin America. In the industrial world, the proportion of the population that is aged 65 and older is already at 13.6 percent and is expected to rise to 25.9 percent by 2050 (Table 1-3). These trends will modify the age composition and the concomitant skill mix in these countries' labor forces and alter the demands on health care services and retirement and pension systems.
TABLE 1-3 Percent of population aged 65 and over for the world and major regions
|
Region |
1950 |
1995 |
2050 |
|
World total |
5.2 |
6.6 |
16.4 |
|
Developing regions |
3.9 |
4.7 |
15.0 |
|
Industrial regions |
7.9 |
13.6 |
25.9 |
|
Sub-Saharan Africa |
2.1 |
1.9 |
4.1 |
|
Middle East and North Africa |
3.9 |
4.1 |
13.5 |
|
South and Central Asia |
3.7 |
4.3 |
14.2 |
|
East Asia and Pacific |
4.4 |
6.3 |
21.1 |
|
Latin America and Caribbean |
3.7 |
5.1 |
16.8 |
|
Northen America |
8.2 |
12.5 |
21.9 |
|
Europe and Russia |
8.2 |
13.9 |
27.6 |
|
Source: United Nations (1999b). |
|||
FORCES DRIVING POPULATION GROWTH
The growth of the world's population at any point in time is determined by the number of people born every year, counterbalanced by the number who die. Until the 19th century, birth rates and death rates were both high and relatively close together (on average over long periods), even though substantial fluctuations in these rates were common during most of human history. As a consequence, population growth was very slow and erratic. Then, as people began enjoying the benefits of economic and social development and improvements in sanitation, nutrition, and medicine, death rates began to decline rapidly and population growth rates began to climb. This transition in demographic processes began first in Europe and Japan at the end of the 18th century and subsequently spread across the globe. In fact, the acceleration of population growth in Africa, Asia, and Latin America in the middle of the 20th century is largely a consequence of rapid declines in mortality in those regions.
The future growth expected for the world and for most regions and countries will be partly due to continuing declines in mortality, but at least as important will be the extent to which fertility stays above the replacement level. For particular regions and countries, population growth will also be affected by the numbers of people entering and leaving each year, that is, by immigration and emigration. In addition, future population growth will depend on the age structure of the population, a demographic effect known as population momentum, which is described later in this chapter. We consider the effect of fertility first.
Fertility Above the Replacement Level
Fertility is at the replacement level when each generation of women exactly replaces the previous one (which requires that a newborn girl give birth to one daughter on average over her lifetime). Replacement fertility is a critical factor in population projections. When the mortality level is unchanging and there is no in- or out-migration, replacement fertility describes the level that, if maintained over time, produces zero population growth. In the long run, positive or negative deviations from replacement-level fertility lead, respectively, to persistent population growth or decline. Currently, replacement-level fertility in the developing world equals 2.4 births per woman, and in the industrial world equals 2.1 births. The level always slightly exceeds 2.0 (one child for each parent) in part because more boys are born than girls (the sex ratio at birth is typically 1.05 or 1.06 male births for every female birth). In addition, children who
die before reaching their own reproductive ages have to be replaced with additional births.
Despite recent rapid declines in many countries, fertility in most regions of the developing world remains well above replacement level. In the period 1995-2000, the average number of births ranges from a high of 5.1 in Africa to 3.4 in South Asia and to 2.7 in Latin America (United Nations, 1999b).5 These figures indicate that fertility remains one of the key forces contributing to further population growth in the developing regions. In contrast, the average number of births is now below the replacement level in Europe (1.4), Northern America (1.9), and East Asia (1.8).
Population projections typically assume that fertility will decline in countries where it is now above replacement. The assumption usually made is that average family size will eventually stabilize at the replacement level in Asia and Latin America before 2025 and in Africa before 2050. In countries where fertility is now below replacement, it is usually assumed that fertility will gradually rise back to the replacement level or slightly below it. These assumptions about future fertility trends are controversial and raise many questions, some of which are discussed in detail in Chapter 3 and Chapter 4: Can the fertility declines that are now under way in many developing countries be expected to continue at a rapid pace? What are the socioeconomic and other factors that determine the speed of decline? Is replacement fertility likely to prevail in most countries in the long run, or could fertility remain higher or lower than replacement level for long periods?
This last question is of particular importance because the long-run trajectory of population size is very sensitive to deviations of fertility from replacement level. If future fertility is maintained even slightly above or below replacement for a long period, future world, regional, or country populations could be quite different from those now projected. For example, if fertility levels off at just half a birth above replacement in all countries, as assumed in the high U.N. projection in Figure 1-1, then the population of the world would reach 10.6 billion in 2050, instead of the 8.9 billion anticipated in the medium forecast (United Nations, 1999b). In contrast, if fertility levels off at half a birth below replacement, as assumed in the low U.N. projection, then the world total would peak at 7.5 billion in 2035 and decline to 7.3 billion by 2050.
|
5 |
The corresponding replacement levels are, respectively, 2.6 for Africa, 2.4 for South Asia, and 2.2 for Latin America. |
Declining Mortality
As mortality rates decline,6 life expectancy increases. For the world as a whole, life expectancy at birth is now 65 years, about double the level that prevailed before the mortality transition began. Most of this remarkable gain was achieved during the 20th century, first in the more industrial regions, and then increasingly in parts of the developing world. Since the 1950s, the developing world has experienced exceptionally rapid improvements in life expectancy—from an average of about 41 years in the early 1950s to 63 years today. Latin America has reached mortality levels similar to those of the industrial world in the 1960s, and Asia is not far behind. Africa's mortality rates have remained the highest, resulting in a current life expectancy of 51 years. In the industrial world, mortality was already low in the 1950s, but life expectancy has continued to rise from 67 years in 1950-1955 to 75 years today.
For the next century, the projections made by the major agencies assume that life expectancy will continue to rise in all regions. However, rates of increase are expected to slow. Also, it is typically assumed that a maximum exists above which life expectancy will not rise. For example, in its long-range projections the U.N. sets this limit at 87.5 years for males and 92.5 years for females, and the World Bank at 83.3 and 90 years, respectively. These assumptions raise several questions that are discussed in Chapter 5: Is a higher limit possible for the average human life span? Does recent experience suggest that further reductions in mortality indeed become more difficult to achieve? Will new diseases or drug-resistant strains of microbes threaten achieved or expected gains in life expectancy?
Net Migration
Movements of people between countries can affect national rates of population growth. The key measure in this case is the balance between the numbers of the population who leave a country and the numbers who move into it. The term used to describe this measure is net migration, that is, the difference between the number of immigrants and the number of emigrants. This can be positive or negative. In the past, migration into
|
6 |
A decline in the death rate, at any given level of the birth rate, leads to a corresponding rise in the natural growth rate. This is also the case when fertility is at the replacement level. Although this level of fertility compensates for mortality that occurs between birth and childbearing ages, declines in mortality above childbearing age are not compensated for and continue to affect growth rates. |
some countries—the United States, for example—was substantial; currently, migration out of others—Mexico, for example—is high. At the global level, of course, migration has no direct effect on total population growth, but it can have small indirect effects by influencing fertility and mortality.
Most current population projections for individual countries or world regions assume continuing large differences in net migration levels among countries. For a number of countries, including the United States and Mexico, migration is likely to remain an important factor in future population trends. But at the regional level, future population movements are expected to play a minor role in determining growth rates, except perhaps for Northern America and Europe (Bongaarts and Bulatao, 1999).
Age Distribution Producing Population Momentum
Even if fertility were immediately brought to replacement level, mortality levels were to remain constant, and no migration were to occur, the population of many countries would still continue to grow, particularly in the developing world. The reason for this is that many developing countries have a young age structure. The large share of the population under age 30 is the result of high fertility and low mortality in recent decades, which led to rapid population growth, particularly of young people. But when a country has a large proportion of its population under age 30, further growth over the following decades is virtually ensured, as these large, young cohorts replace smaller, older cohorts. Even were fertility among this group to be at replacement level, the relative abundance of young people having children would result in a birth rate that is higher than the death rate, and this imbalance between the two rates would lead to continued population growth. This age-structure effect on future growth is called population momentum (Keyfitz, 1971).
In some countries of the industrial world, the age structure has become sufficiently old to result in negative population momentum. That is, population size would decline for some time even were fertility to rise immediately to replacement level, mortality to remain at its current level, and net migration to stay at zero.
The contribution of momentum to future population growth can be estimated by comparing a set of standard population projections with a set of hypothetical population projections for various regions of the world. The standard projections, essentially World Bank projections as of 1998, are based on the best judgment of analysts about how fertility, mortality, and migration rates in these regions will change. The hypothetical projections share the same base data but assume that fertility stays at replacement level, that mortality neither declines nor rises, and that migration is
absent. Any population growth suggested by these hypothetical projections reflects, therefore, only the effect of age structure, that is, of population momentum.
Given the standard assumptions, the world population will grow from 6.1 to 8.9 billion over the next half-century. Over half of this global population growth will be due to the momentum inherent in the current young age structure found in many parts of the developing world (Figure 1-3). After removing the future contributions to population growth attributable to fertility above replacement and declining mortality, the world 's population is still expected to reach 7.9 billion in 2050, a 30-percent increase between 2000 and 2050.
The projections shown in Figure 1-3 demonstrate that world regions will vary widely in the proportion of their future population growth due to momentum alone. The effect of population momentum will be greatest
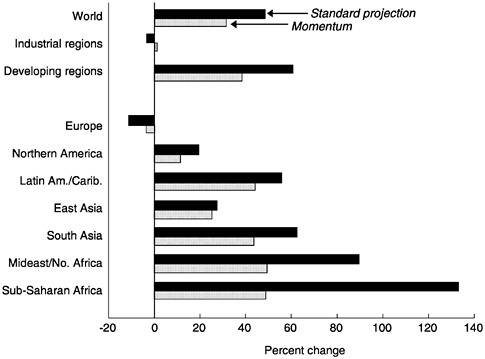
FIGURE 1-3 Percentage change in population between 2000 and 2050 in standard projections and change due to population momentum alone, by region.
NOTE: For the momentum projections, fertility is at replacement, mortality is constant, and net international migration is zero (data from Bongaarts and Bulatao, 1999).
in the developing world, especially in Sub-Saharan Africa and the Middle East and North Africa, and smallest in the industrial regions, reflecting differences in these regions' age structures today. Momentum will be responsible for more than half of projected future population growth in all developing regions except Sub-Saharan Africa. In that region, overall population growth is projected to be much higher than elsewhere (an increase of 133 percent by 2050), but much of it will be due not to age structure (population momentum) but to continuing high levels of fertility and to declining mortality.7
HOW POPULATION PROJECTIONS ARE MADE
There are various ways of projecting population size. The methodologies used range from the simple extrapolation of past trends to complex multiple-equation models involving dozens of demographic, socioeconomic, and environmental variables. In practice, most current projections, including those of the U.N., the World Bank, the U.S. Census Bureau, and IIASA, rely on what is called the cohort-component method. Its application involves three steps:
-
Collection of baseline data. Estimates are made of existing national populations by sex and age (usually in 5-year intervals) for the year in which the projection begins. This information usually comes from censuses. Levels of the components of growth (fertility, mortality, and migration) by age are then estimated for the most recent (5-year) period preceding the initial year. Estimates of fertility and mortality are usually obtained from vital-registration data or from appropriate survey data. Migration rates may be estimated fairly crudely, since few countries, especially in developing regions, maintain reliable statistics on population movement.
-
Projection of component rates. Estimates of future levels of fertility, mortality, and migration by age are required for the duration of the projection. To simplify this task, future estimates are usually made of summary indicators, and standard age patterns are then imposed to obtain rates by age. For example, the total fertility rate is often used as a sum
7
Between regional projections in Figure 1-3, the differences not explained by momentum are attributable to the three demographic components noted earlier: fertility above the replacement level, continuing declines in mortality, and migration. A detailed analysis of the contributions of these components to projected future population growth is presented in Bongaarts and Bulatao (1999). In general, the contributions of the fertility and mortality components to future growth are positively associated with their current levels, and each is more important than migration.
-
mary measure of fertility, and life expectancy at birth is often used to indicate the level of mortality. Together with the current age structure, assumptions about future levels of fertility, mortality, and migration are the most important determinants of trends in projected population size.
-
Calculation of population projections. Once the initial population size, its age structure, and estimates of future component trends are all available, the calculation of the population size at future points in time is computationally straightforward (Shryock and Siegel, 1975). The initial age distribution is moved forward in time and, simultaneously, upward in age, taking account of deaths and migration at all ages and adding births to the youngest age group. In principle, these calculations can be done by hand, but computer software is available to simplify this task (see Appendix A8). The main products from these calculations are estimates of the population by sex and age, usually at 5-year intervals, for the duration of the projection. These estimates are summed or otherwise summarized to provide such measures as total population size and growth rates.
The cohort-component method of projecting population is now very widely used. It is relatively simple to apply and provides useful information on the evolution of the population distribution by age and sex, as well as on future component trends. However, this method is no more than a numerical device to calculate population size and age composition on the basis of certain assumed trends in fertility, mortality, and migration. As a consequence, it does not address several key issues.
The method requires that its users make assumptions about future trends in vital rates and migration but does not provide any guidance on how these assumptions should be chosen. Recent projections made by international agencies use a variety of procedures, some of them without a firm theoretical basis. The general assumption is that future component trends will follow trajectories similar to those observed in the past. Future trajectories may be statistically modeled on past trends, as in various time-series approaches (e.g., McDonald, 1981; Lee and Tuljapurkar, 1994), but these trajectories are more often derived informally from an understanding of past trends. A detailed discussion of past and expected future trends in fertility, mortality, and migration is provided in later chapters.
A few analysts project component rates on the basis of models specifying how these depend on interrelated socioeconomic variables (e.g., Filmer and Silberberg, 1977; Wheeler, 1984). One difficulty in using this approach is that the basic social and economic variables must themselves be forecast for many decades ahead, a prospect perhaps more daunting
|
8 |
The appendices are not printed in this volume but are available on line. |
than the prospect of forecasting the demographic variables directly. In addition, much controversy remains about the ability of socioeconomic theory to account for past component trends. These types of disagreements have limited progress in projection methodology in recent decades.
A key related issue is that the cohort-component method steers the analyst in the direction of considering and forecasting levels of fertility, mortality, and migration individually, leaving the trajectory of the population only a by-product of the separately projected trajectories of rates. This approach has come to seem so natural to demographers that alternatives are rarely considered. However, crucial feedback from population size to fertility, mortality, and migration is likely to exist in the very long run. For example, if a projection were made over several centuries and the birth rate stayed even slightly higher than the death rate for the duration, the population would explode to implausibly high levels. Environmental constraints would then lead to changes in both birth and death rates to bring population size to some level of equilibrium. Feedback processes of this sort are widely incorporated into models used in projecting animal populations. Conversely, if the birth rate were to remain lower than the death rate, a population would die out in the long run, a prospect likely to lead to attempts to reverse negative growth. Effects of this type, involving the impact of population size on component rates, are often ignored, in part because they are presumably relatively weak in the short run.
Long-range population forecasts are sometimes criticized because they neglect the effect of this kind of possible environmental feedback. Populations in the past did equilibrate in the long run, at least weakly, with their resource base. However, the recent record suggests that the checks Malthus conceived for populations dependent mainly on land resources are now generally weak or absent, at least within the contemporary range of population densities and environmental circumstances (Lee, 1987, 1991). Despite rapid population growth, prices of food and of most natural resources—such as fossil fuels and metals—have declined steadily. And mortality is still declining in both the industrial and the developing worlds (with the notable exceptions of countries with large HIV/AIDS epidemics and parts of Eastern Europe). When decline was interrupted by famines in the post-World War II period (for example, in China in 1957-1961), these interruptions were generally attributed more to mistaken policy decisions than to demographic pressure (Dreze and Sen, 1990).
The rationale for ignoring environmental feedback is generally not discussed in the documentation accompanying current population projections. The reasons presumably include the general unpredictability of most environmental factors, the belief that these factors will have only a minor effect over the duration of the projection, and the difficulty of
quantifying any possible effect. In addition, it could be argued that some factors (food shortages, for example) are implicitly taken into account in current projections. In reality, most projection exercises follow a two-step process. First, a population projection is made that assumes no environmental feedback and that is based on historical patterns in component rates, with the assumption of business as usual in the future. Second, the results of this projection are examined to consider whether they seem implausible in light of what is known or surmised about environmental factors (e.g., Lutz, 1996:389-392). Assumptions may then be reconsidered when necessary.
Apparently, the major agencies making projections do not foresee strong pressures from future population growth that would significantly alter assumed trends in vital rates and migration, and the projections therefore do not explicitly incorporate environmental or other such factors. This is generally reasonable for short-range projections, up to a few decades, for example. However, for longer-range projections, in particular those continuing to the year 2100 and beyond, this assumption may be incorrect for certain countries and regions. In those cases, future patterns and levels of population growth may turn out systematically different from those forecast.
ALL PROJECTIONS SUFFER FROM UNCERTAINTY
Limitations of various types give rise to an inevitable degree of uncertainty in population projections. Uncertainty arises in part because the present demographic situation is not known perfectly. However, the main cause of uncertainty is that future trends in fertility, mortality, and migration are subject to unpredictable influences. We cannot know in advance about future economic developments, changes in society, culture, epidemiology, and the environment, or progress made in science and technology. Just in the past 20 years the world has been surprised by the collapse of the Soviet Union and the related rise in mortality, by the occurrence and spread of HIV/AIDS, and by the rapid progress being made in genetic engineering, which has opened possibilities for extending the life span.
Going back to the beginning of the 20th century, we can imagine the difficulties a forecaster would have faced in trying to foresee the technical and scientific achievements of the past century: the development of antibiotics, radiology, laser surgery, the computer, the Green Revolution, contraceptive technology, air transport, and so on. Political and social change would also have been difficult to foresee: the rise and fall of communism, the baby boom of the 1950s, the decline of marriage and rise of extramarital fertility, women's increased participation in the labor force, and so on.
We cannot fault forecasters for not being able to anticipate such changes; they can only project population based on what they know or can estimate at the time of the forecast. Despite these difficulties, global projections made by the major agencies in the last few decades have been quite accurate, as is shown in the next chapter.
Uncertainty also arises from the fact that humans have the ability to influence the future through deliberate policy action. For example, if societies invest more heavily in family planning and reproductive health programs, or in social programs designed to improve the status of women, or if they spend more on family allowances or on parental leave policies, or create strong financial incentives to encourage or discourage childbearing, any one of these or similar actions could influence future fertility and, therefore, the course of population growth. Similarly, policy decisions about public health measures, health care, biomedical research, and euthanasia could influence the future course of mortality. Policies on immigration and emigration can also have a substantial and immediate impact at the country and regional level. Considerable controversy exists about the impact of specific policy interventions on fertility, mortality, and migration, but few would deny that policy has had some effect in the past, and that even stronger policies could be formulated if desired.
The possibility of policy feedback is in fact a major reason for interest in population projections, since the projections themselves can inform and influence policy decisions. For example, when in the 1970s China's leaders came to understand the implications of their population size and age structure for the country's future size, they decided to implement a policy of “later, longer, and fewer” for childbearing of all couples, later succeeded by a draconian one-child policy. These policies undoubtedly slowed the rate of China's population growth over the next 30 years, but their impact was not anticipated in the earlier population projections that triggered the policy decision in the first place. Governments in many other developing countries have implemented voluntary family planning programs in response to concerns about the potential adverse consequences of rapid population growth.
The potential for errors caused by these uncertainties is certainly recognized by the agencies making population projections, but the role of uncertainty is often given insufficient attention or is inadequately addressed. The most common way of addressing the issue is for forecasters to calculate variants of their standard, or medium, projections. These variants are created by systematically altering the assumptions about future trends in fertility, mortality, or migration. For example, in the low variant of the U.N., fertility is assumed to level off at half a birth below the level assumed in the medium projection. In the high variant, it is assumed to
level off at half a birth above that level. As noted, the resulting projections suggest that world population in 2050 will fall between 7.3 and 10.7 billion. Unfortunately, the U.N. associates no specific probabilities with these high and low variants, so the results cannot be easily interpreted. This crucial issue is taken up in detail in Chapter 7.
GUIDE TO THE REPORT
Following this introduction, Chapter 2 provides an assessment of the accuracy of global, regional, and country projections made in recent decades by the U.N. and the World Bank. The next two chapters deal with fertility, the most important component of future demographic change. Chapter 3 focuses on fertility in populations that are currently in transition and Chapter 4 on fertility in posttransitional societies. Chapter 5 goes on to discuss mortality, and Chapter 6 discusses international migration. Chapter 3, Chapter 4, Chapter 5 to Chapter 6 have the same general structure: they begin with an examination of past trends and available explanations for them and then review current projection procedures and their plausibility in view of the available scientific evidence. Chapter 7, which concludes the main text, discusses methods for assessing future uncertainty in projections and provides some estimates of prediction intervals for projected population. Brief biographies of panel members and staff follow.
A set of technical appendices supplements the text. Appendix A lists and briefly describes several computer software packages for projecting population, indicating how they can be obtained. Appendix B provides a detailed assessment of the accuracy of the U.N. and World Bank projections considered in Chapter 2. The next three appendices provide statistical support for particular points made in the main text. Appendix C provides additional statistical detail on the prediction of the pace of fertility decline in countries in transition. Appendix D illustrates the effects on other demographic parameters of error in projecting life expectancy. Appendix E contrasts three approaches to projecting net international migration. Finally, Appendix F develops a statistical model for estimating the uncertainty of projected country, regional, and world populations.
The appendices are not printed in this volume but are available on line; go to http://www.nap.edu and search for Beyond Six Billion.
REFERENCES
Ahlburg, D., and W. Lutz 1999 Introduction: The need to rethink approaches to population forecasts . Population and Development Review 24(Supplement):1-14.
Bongaarts, J., and R.A. Bulatao 1999 Completing the demographic transition. Population and Development Review 25(3):515-529.
Cone, M. 1999 Growth slows as world population hits 6 billion. Los Angeles Times, October 12.
Crossette, B. 1999 Rethinking population at a global milestone. New York Times (Week in Review), September 19.
Delattre, L. 1999 Combien serons-nous? Neuf milliards d'hommes en 2050. Le Monde, November 26.
Dreze, J., and A. Sen, eds. 1990 The Political Economy of Hunger. Oxford, Eng.: Clarendon Press.
Filmer, R., and R. Silberberg 1977 Fertility, Family Formation, and Female Labour Force Participation in Australia 1922-1974. IMPACT paper BP-08. Industries Assistance Commission, Melbourne.
Frejka, T. 1981 World population projections: A concise history. Pp. 505-528 in International Population Conference, Manila, Vol. 3. Liège, Belgium: International Union for the Scientific Study of Population.
International Union for the Scientific Study of Population (IUSSP) 1982 Multilingual Demographic Dictionary. English ed. Liège, Belgium: Ordina Editions.
Keyfitz, N. 1971 On the momentum of population growth. Demography 8(1):71-80.
Lee, R. 1987 Population dynamics of humans and other animals. Demography 24(4):443-465.
1991 Long-run global population forecasts: A critical appraisal. Pp. 44-78 in K. Davis and M.S. Bernstam, eds., Resources, Environment, and Population: Present Knowledge, Future Options. New York: Oxford University Press and Population Council.
Lee, R., and S. Tuljapurkar 1994 Stochastic population projections for the United States: Beyond high, medium, and low. Journal of the American Statistical Association 89(428):1175-1189.
Lutz, W., ed. 1996 The Future Population of the World: What Can We Assume Today? Revised 1996 ed. London: Earthscan Publications.
Lynch, C. 2000 Population-loss trends cited: Economic growth of Japan, Europe at risk, U.N. report says. Washington Post, March 22.
McDonald, J. 1981 Modeling demographic relationships: An analysis of forecast functions for Australian births. Journal of the American Statistical Association 76(376):782-792.
Shryock, H.S., J.S. Siegel, and associates 1975 The Methods and Materials of Demography. Washington, D.C.: Bureau of the Census, U.S. Department of Commerce.
United Nations (U.N.) 1999a Long-Range World Population Projections: Based on the 1998 Revision . New York: United Nations.
1999b World Population Prospects: The 1998 Revision, Vol. 1, Comprehensive Tables. New York: United Nations.
U.S. Census Bureau 1999 World Population Profile: 1998. Washington, D.C.: U.S. Department of Commerce.
Wheeler, D. 1984 Human Resource Policies, Economic Growth, and Demographic Change in Developing Countries. Oxford, Eng.: Clarendon Press.
World Bank 1999 World Development Indicators 1999. Washington, D.C.: World Bank.


