
7
The Uncertainty of Population Forecasts
Errors are to be expected in any long-term forecast of human behavior. We do not know how low fertility will fall, particularly in populations that have not yet entered the later stages of the transition. We do not know whether new diseases, or drug-resistant strains of old diseases, will raise mortality in the future. We do not know whether migration toward industrial countries will accelerate or abate. Users of population projections should be aware of their substantial uncertainty and should not use them without taking this into account.
This chapter discusses conceptual issues surrounding forecast uncertainty, considers methods for assessing it, and presents new research to attach probability distributions to U.N. forecasts. The overarching goal is to recommend ways to improve on current, limited methods for dealing with uncertainty.
If population forecasts are to be used to inform policy decisions regarding public pension systems, health care costs, environmental policy, or economic development strategies, then their uncertainty should be assessed and accurately portrayed. In some areas, greater uncertainty might lead to postponement of action; in other areas, it might indicate that stronger precautionary steps should be taken right away; and in still other areas, it might suggest the design of policies that can be adapted as the future unfolds. A school planner, faced with uncertain projections of enrollment growth, might decide to rent additional space for schools rather than building or buying space. Some policy analysts might choose an appropriate policy path using a formal or informal “loss function” that allows comparison of the gains and losses resulting from different fore-
casting errors. Some bad outcomes of a given size may detract from social welfare much more than favorable outcomes of the same size would enhance it. In this case, policy in the face of substantial uncertainty should be tilted toward avoiding the bad outcome, rather than being guided by the middle forecast. It is important that users of forecasts take seriously the uncertainty surrounding them and consider what this uncertainty implies for their particular application.
Users should explore the implications of the entire forecast range. The actuaries of the U.S. Social Security Administration provide an example of good practice in this regard, carrying out a full set of financial projections for each variant population projection. Environmental projections similarly could take uncertainty into account. For example, depending on whether they believe global population growth is likely to continue or end, experts on world food supply and demand vary widely in the type and severity of problems they anticipate in the coming half century (Fedoroff and Cohen, 1999). It would be appropriate for them to consider the likelihood of a range of possible demographic futures.
With an appropriate forecast that included probability distributions for population, such studies could incorporate demographic uncertainty in more informative ways. The analyst might initially estimate the environmental impact of members of different populations, such as populations of industrial and developing countries. These estimates might be based on measures of food consumption, carbon dioxide emissions, or energy use. Assuming these estimates remain constant or change in a particular pattern, the analyst could then combine them with the predictive distributions of the population size of each aggregate. The result would be a forecast of the probability distribution of the environmental impact of, for example, global carbon dioxide emissions. This forecast would reflect the fact that projections of developing-country populations are far more uncertain than projections of industrial-country populations, although the per capita environmental impact of developing-country populations is less. Thus the forecast of global impact could have a narrower range of uncertainty from demographic factors than would global population itself.
Some demographers argue that population forecasts should not be made over longer horizons than 30 years or so, due to the rapid increase in uncertainty of forecasts beyond this point. However, if the forecast carries an appropriate indication of the range of uncertainty, then the user can decide at what time horizon the informational content of the forecast becomes too small to be useful.
At a minimum, it is important to realize how the uncertainty of forecasts over different horizons varies. In short- and medium-term forecasts, lasting up to 25 years or approximately the length of a generation, there is
very little compounding of uncertainty. While one does not know what future fertility will be, the women who will be of childbearing age over the following 25 years will have mostly been born before the start of the forecast. For longer-term forecasts, however, uncertainty is greater, because we know neither how many reproductive-age women there will be, nor how many children each will have. It may be that different methods of forecasting and of assessing uncertainty are appropriate for each of these different horizons.
The uncertainty of forecasts may also differ by stage in the demographic transition. In transitional or pretransitional populations, there is uncertainty about when the fertility transition will begin, how quickly it will proceed, and at what level it will pause or stop. In posttransitional populations, there is uncertainty about how high or low the average level of fertility will be, how large or small fertility fluctuations may be, and whether fertility may again begin to trend downward, or even, conceivably, upward. These are different kinds of questions than those for transitional populations, because there is a good deal of coherence and consistency to the pattern of fertility decline once the transition has begun.
THE SCENARIO APPROACH AND ITS PROBLEMS
To assess and communicate the uncertainty associated with their projections, forecasters often construct alternative scenarios. The scenario approach is common in national forecasts, although somewhat less so in the international forecasts we have considered. Neither the World Bank nor the U.S. Census Bureau, in its international forecasts, provides alternative scenarios, and the U.N. projections provide alternative scenarios only for fertility.
Scenario-based projections used to be viewed as hypothetical calculations to demonstrate the implications of alternative trends in vital rates. Some scenarios remain purely hypothetical, such as scenarios in which fertility is held constant. However, the central scenario has been gradually transformed from a hypothetical calculation to a forecast. Alternative scenarios, called variants by the U.N., are used increasingly to imply reasonable ranges that might bracket possible future values. Because this is the dominant, traditional method for illustrating the uncertainty of demographic projections (and indeed of long-term projections of all sorts), we review it in some detail.
Constructing Scenarios
In using the scenario approach to bracket future values, the analyst usually begins by formulating high, medium, and low trajectories for the demographic components: fertility, mortality, and migration. The vary-
ing trajectories are intended to cover the range of plausible future values for each rate, in some ill-defined sense. The range is ill defined because no probability is explicitly assigned to it. In addition, it is unclear whether the range is intended to contain annual values or a long-run average value of the rate, and whether it applies to the rate considered singly or refers to a joint distribution of all the relevant rates.
The analyst next decides how to combine the trajectories of the rates into scenarios. For example, the U.S. Census Bureau, in its national projections for the United States, bundles a high-fertility trajectory with low mortality and high immigration to form their Highest series, and low fertility with high mortality and low immigration to form their Lowest series. The Office of the Actuary of the U.S. Social Security Administration, by contrast, bundles together high fertility, high mortality, and high immigration to form their Low Cost scenario, and low trajectories for each component to form their High Cost scenario.
The Census Bureau scenarios provide a broad range for future population size and growth rates, but a narrow range for the old age dependency ratio. The Social Security Administration scenarios provide a broad range for the old age dependency ratio, but a narrow range for population size and growth rates. This points up a serious problem: it is impossible in this way to construct scenarios that simultaneously reflect the uncertainty in all the variables of interest. Because this problem is important, we expand on it.
Why Inconsistencies Are Inevitable
Population forecasters have frequently complained that users pay attention only to their medium projections, ignoring high and low variants. Users' lack of sophistication has been mentioned as a reason. However, we argue that no consistent probabilistic interpretation can be given to the high-low scenarios in population forecasts.
Any projection scenario involves many demographic rates: fertility, mortality, and net migration, for each age, and for both males and females. These rates must be specified for multiple periods, and often for multiple countries. The scenario approach generally assumes that extreme values of the rates will occur at the same time at all ages, for both sexes, for all time periods—and when multiple countries are run, for all countries—in order to produce high and low variants. (For migration, the situation is actually more complex because it is logically impossible for all areas to have simultaneously high net migration or low net migration unless all the migration rates are zero.) In effect, the scenario approach assumes that vital rates at all ages, in all countries, and for all future times are determined simultaneously and completely by a single common factor
and are perfectly correlated, negatively or positively. Even residual error is assumed away: the single common factor is allowed to describe the future perfectly. A model with such perfect correlations is empirically known to be false, and its application leads to results that are hard to interpret realistically.
The resulting forecasts are also inherently inconsistent from a probabilistic point of view. If the high-low range is designed to contain short-run fluctuations in rates and demographic events, then it will be too broad to indicate the uncertainty of long-run population size, since many of the short-run fluctuations would cancel out in the long run.
Fluctuations in rates do take place, such as the baby boom and bust experienced by most industrial countries following World War II. Even if such fluctuations stay within the bounds defined by the high and low scenarios, other demographic parameters (such as the proportion of the population of a given age or particular dependency ratios) may be affected much more and could exceed the levels defined in these scenarios. High and low scenarios, therefore, do not represent consistent extremes across all demographic parameters.
An Example from Global and Regional Projections
To illustrate these problems, population totals in high- and low-variant projections from nine projection rounds published by the U.N. since 1960 were compared with the actual numbers (United Nations, 1999) for the years 1965-1995. Figure 7-1 shows how often the projected high-low intervals included the actual number or were too high or too low to include it.
For world population overall, the projected high-low interval included the actual number in 70 percent of the cases. However, this was true only half the time for projections of 5 or 10 years, as opposed to almost all the time for projections of 15 years or longer. In projections for each of seven regions, the high-low interval included the actual number less often: under 20 percent of the time in 5-year projections, rising to 40 percent of the time in projections of 20 years or more. Intervals for Asia, Oceania, and Europe more often contained the actual number than intervals for the other regions.
This example illustrates how a high-low interval adequate to contain long-run population size is too narrow to enclose short-term fluctuations. The contrast between world and regional intervals indicates another problem. World intervals more often contained the actual value because world errors are smaller, as some errors cancel when regional populations are aggregated. (Migration errors, in fact, should entirely cancel out, provided the projections properly equated the total net immigrants and emi-
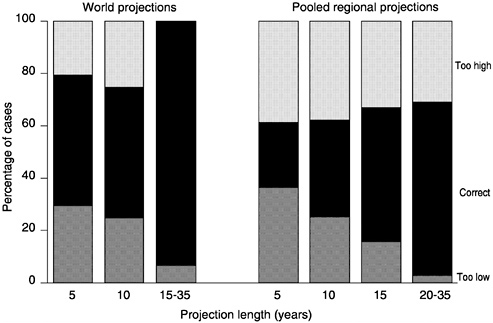
FIGURE 7-1 Percentage of times the projected U.N. high-low interval encloses the actual subsequent population, or is too high or too low, by projection length: World and seven pooled regions, 1965-1995.
SOURCE: Updated calculations based on U.N. projections assessed against United Nations (1999), following Keilman (1998).
grants across countries.) This shows that equivalent high-low variants for regions and for the world do not define bounds that have equal probability coverage. The probability coverage of equivalent high-low variants for countries would presumably be still different.
An Example from Projections of Age Distributions
For another example of the inevitable inconsistencies, consider the 1992 U.S. Census Bureau projections for the United States. The numbers below give the high-low range for demographic variables projected to 2050, expressed as a percentage of the middle forecast.1 The range for the
|
1 |
The U.S. Census Bureau (Day, 1996) has actually produced multiple variants combining different levels of fertility, mortality, and migration. What we focus on here are figures from the variants they designate their Highest, Middle, and Lowest series. Choosing among their variants, one could probably obtain reasonable ranges for any variable, but the assumptions would often be different from case to case. |
projected old age dependency ratio was only 3 percent up or down, while its numerator and denominator had projected ranges of 26-27 percent. This cannot be correct unless it is assumed that the errors in forecasting the working-age population and the elderly are very highly correlated, an assumption that is not stated and apparently not investigated.
|
Selected demographic variables |
High-low range |
|
Working-age population (20-64) |
±26% |
|
Elderly (65+) |
±27% |
|
Old age dependency ratio (20-64/65+) |
±3% |
THINKING ABOUT FORECAST ERRORS
One view about forecast errors is that they arise largely from limited understanding of the forces governing demographic processes and can be substantially reduced as the knowledge base grows. Another view is that errors arise mainly from an element of intrinsic randomness in human behavior, and therefore cannot be reduced below a certain level. Whichever view we take, we are stuck with the errors for now and must find an appropriate way to take them into account.
Forecast Errors We Can Anticipate and Quantify
When we forecast demographic rates, we can most readily take into account uncertainty that arises under “business as usual” conditions. Under these conditions, variations, trends, and uncertainties in the past serve as a useful guide to variations, trends, and uncertainties in the future. However, business as usual need not prevail. It would be surprising if significant unanticipated factors did not arise within the compass of a 50- or 100-year projection.
Some analysts argue that environment or natural resources will constrain future population growth in ways not apparent from a study of the past: global warming, changes in the ozone layer, shortages of fresh water, and stagnation in food production are candidates for this role. In a similar vein, the HIV/AIDS epidemic could become much worse than anticipated, new drug-resistant strains or newly emerging diseases could be far more lethal than generally expected, or new gene therapies or other advances could produce dramatic gains in life expectancy. The historical record does contain examples of major unanticipated influences on demographic behavior, including the high mortality and low fertility of the Great Leap Forward in China, the development of antibiotics, and the increases in mortality in Eastern Europe and the former Soviet Union. The
record also includes such unanticipated fertility developments as the post-World War II baby booms and busts in the industrial world and the policy-induced fertility fluctuations in Sweden and Romania.
But it is always possible that the future will see developments different in kind from the past. Beyond such uncertainties looms the possibility of catastrophic events, such as global nuclear war or collision with a large comet. Such events are sometimes explicitly assumed away by forecasters, and indeed, if they occurred, the planning that projections are intended to inform would be of little relevance.
Demographers typically ignore catastrophic possibilities and focus on forecasts under the “business as usual” assumption, drawing heavily on the historical record as a guide to the future. This record may of course be incomplete, if surprises have occurred in the recent past and have not yet had their full demographic effects. We do not know how far the HIV/ AIDS epidemic will go in Sub-Saharan Africa, or the extent it will reach in Asia. Using history as a guide is not helpful in such circumstances. In addition, reversals of historical trends do occur, and extrapolation can sometimes lead us astray. Different scholars may also read the historical record in different ways. Although we must use the past as a guide, there is no one best way to do so. In an area as complex as predicting future demographic variables, there will always be a variety of ways to interpret the past.
Characterizing Errors Through Predictive Distributions
We may think of future demographic outcomes as random variables having a probability distribution, which we call a “predictive distribution. ” The middle forecast (point forecast) is the mean or the median of this distribution, and, given the distribution, the boundaries of a 95-percent probability interval (or any other desired probability interval) can in theory be readily obtained. Predictive distributions are of course conditional on whatever information we have at the time of the forecast and how we interpret that information. Thus the predictive distribution for the number of global births in the year 2073 will be different for forecasts made at different times by the same forecaster and for forecasts made at the same time by different forecasters, although the true probability distribution for births in 2073 does not vary and is not known to us.
A predictive distribution gives the forecaster's view about the likelihood of alternative outcomes. If a forecast range, however derived, is claimed to have 75 percent probability coverage, then it should include the actual future values about 75 percent of the time and fail to include them about 25 percent of the time.
The Crucial Role of Correlations in Formulating Predictive Distributions
Consider the problem of constructing a 95-percent probability interval for a national population projection of fertility: How wide should it be? We know that for past U.N. and World Bank forecasts, the absolute error in forecasting national fertility grows from 0.34 children per woman initially (in the base period) to 0.57 children after 10 years, to 0.80 children after 25 years; the forecast error for life expectancy at birth grows similarly from 1.8 to 3.0 to 4.3 years (see Appendix Table B-5).
Suppose by some means we find the correct fertility range to contain the future level of fertility, in the year 2007, 95 percent of the time, and similarly we find the correct range for every other year in the future. Do these ranges define a proper predictive distribution? Not necessarily. The right range to contain values for single years will be substantially wider than the range necessary to give 95-percent probability coverage for the long-term average level of fertility, which is what matters for long-term population growth. Unless errors in forecasting fertility are perfectly correlated over time, the two ranges will differ. Many year-to-year fluctuations in fertility will cancel each other out as they enter into the long-run average. For the United States, for instance, the range necessary to contain the long-term average is only about 60 percent as wide as that necessary to contain annual values (Lee, 1993). A fixed-range forecast that gets the range right for long-term population growth will not be able to get the range right for annual fluctuations, or, for that matter, for age distribution measures, such as the proportion of children in the population under age 5.
We must also consider that fertility is only one of three components that affect the growth and structure of the population. Mortality also matters, as well as migration (except in world projections, which have no migration error), and each must have its own probability interval. If we were to construct a high scenario by choosing mortality at its lower 95-percent bound (that is, with only a 2.5 percent chance of mortality actually being lower), and migration and fertility both at their upper 95-percent bounds, then the true chance of all three unlikely outcomes occurring at the same time would be too low. Of course, if these components are not independent, the probability will be different, so it is important to study their intercorrelations. Typically, a much narrower range will have to be chosen for each variable in order to get the desired probability coverage for their joint effect.
This type of consideration applies strongly when we make forecasts for groups of countries, and it is essential to study the correlations of forecast errors across the countries in the group. An example will show
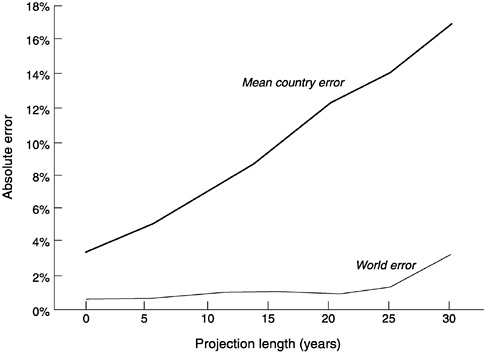
FIGURE 7-2 Absolute proportional error in world and country projections, by projection length.
SOURCE: See Appendix B.
why. It appears that proportional forecast errors at the global level are smaller than at the regional or the national level. Figure 7-2 plots the proportional absolute error in projected population by forecast duration for U.N. and World Bank projections, averaged across all countries, and also for the world as a whole. While mean country error and world error both grow approximately linearly with forecast duration, mean country error is about eight times as large. A likely explanation is that the many errors in country projections are not perfectly correlated, so that when the forecast for one country is too high, that for another country will be too low, and these errors cancel each other in an aggregated forecast.
Error correlations across regions and over time must therefore be considered for fertility, for mortality, and for migration, and the correlations among these components must also be considered. In addition, we must consider the correlations across age and sex for forecast errors in fertility, mortality, and migration. These correlations may be high, since such errors often arise for similar reasons. For example, the pace of mortality decline may be underestimated for all adult ages and both sexes.
Estimation of Error Correlations Ex Post
Error correlations therefore matter a great deal in assigning uncertainty to forecasts.2 These correlations can be estimated when statistical forecasting models are fit to past data. Indeed, the estimation of these correlations and their incorporation in the calculation of predictive distributions is one of the appealing features of the statistical approach to projections. Such analyses typically find that forecast errors for fertility are highly correlated over time, as are those for mortality, and they are correlated across age to a considerable extent, but with diminishing correlations at more distant ages (Alho, 1998; Lee, 1993). An alternative approach, pursued in some detail below, is to extend the analysis of ex post errors in past forecasts (see Chapter 2) to an estimation of correlations. This is possible for regional correlations and for correlations across demographic rates but is less feasible for correlations over time due to the shortness of the available forecast record.
Correlations of Errors Across Regional Populations
Positively correlated errors between regions would indicate that too high a projected population in one region goes together with too high a projected population in another. Negative correlations would indicate the opposite, that too high a projection for one region goes with too low a projection for another. Actual correlations were estimated from U.N. forecasts dating back to 1970 (see Keilman, 1998), with error defined as the difference between projected population and the currently estimated population. These error correlations of each of seven world regions with every other region are plotted in Figure 7-3.
The estimated correlations between regions vary widely, but their median is only 0.08. Across earlier forecasts of 1950-1965, cross-regional error correlations were more positive, with a median of 0.29. Possibly because of better data, correlations have moved closer, on average, to zero. This suggests that some but not all errors could cancel each other, should regions be combined.
Correlations of Errors in Vital Rates
Errors in vital rates may be correlated for various reasons. First, in developing countries, factors related to economic and social develop-
|
2 |
A growing literature provides estimates of the correlations in forecast errors of vital rates across time, age, and sex (e.g., Alho, 1998). We do not attempt to review this literature here. |
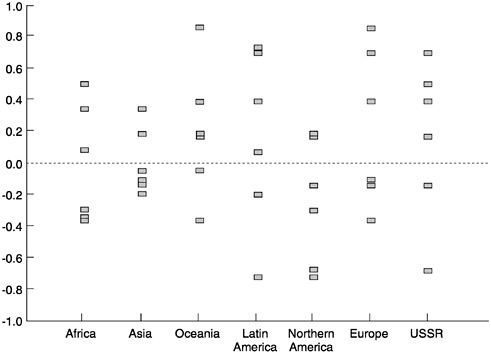
FIGURE 7-3 Correlations between regional errors in projected population over the period 1970-1995.
NOTE: The error in projected population in each of seven regions, calculated from U.N. forecasts, is correlated with the error in each other region, resulting in six correlations per region (see Keilman, 1998).
ment (education, income, health, contraceptive services) may affect both fertility and mortality (Lee, 1999). Both may fall more strongly than expected, producing a positive correlation between them. Second, wars, famines, or HIV/AIDS may have a negative effect on both fertility and survival, resulting in a negative correlation between fertility and mortality errors (Alho, 1997). Third, when demographic data are of poor quality or inadequately analyzed, errors may be produced in extrapolating both birth and death rates, leading absolute errors in both to be positively correlated.
In U.N. forecasts from 1970 to 1995, the correlation between errors in projected crude birth rates and crude death rates for the world as a whole is −0.08, or close to zero. However, similar correlations for seven major regions are quite variable. On one hand, a substantial negative correlation between birth-rate and death-rate errors appears for Europe (−0.63), and negative correlations also appear for the former Soviet Union and Latin America. On the other hand, a substantial positive correlation appears for
Northern America (0.75), and a positive correlation also appears for Oceania. For Africa and Asia, correlations are not significantly different from zero. Similar variability appears in correlations for 10 large countries, with about half being moderately positive and the other half moderately negative.3
Correlated vital-rate error could therefore affect projections for different regions and countries, but not necessarily in the same way in each case. The importance of taking correlations into account, as well as considering interregional error correlations, appears clear. Why the correlations exist is less clear and needs further investigation. At any rate, these estimates provide some information necessary to begin to construct consistent probability distributions for U.N. forecasts.
THREE APPROACHES TO CONSTRUCTING PREDICTIVE DISTRIBUTIONS
Statistical approaches to projection are either causal or extrapolative (that is, based on time-series analysis). There are only a few causal statistical models of national or international population growth (e.g., Wheeler, 1984). None, to our knowledge, produces prediction intervals in addition to central forecasts, although it should be possible to do so. We focus initially therefore on time-series analysis.
Time-Series Analysis
There is a long history of research using time-series methods to project fertility and mortality trends and estimate prediction intervals. Using well-established statistical methods, one first identifies a possible model, estimates its parameters from historical data, and conducts diagnostic checks to determine how well it fits (Box and Jenkins, 1976). Alternative models can be compared through goodness of fit, for example. Once an acceptable model has been found, it can be used to calculate forecasts.
The estimation of parameters and the computation of prediction intervals are all done within a unified framework with well-known statistical properties. An example is the forecast of U.S. mortality by Lee and Carter (1992), who combine multivariate statistical methods with time-
|
3 |
The correlations between absolute error in birth and death rates are more consistent in being positive, with medians of 0.43 across regions and 0.38 across 10 large countries. This might suggest the importance of data quality as an explanation for correlated error. However, since the largest regional correlation is for Europe and the smallest for Africa, this explanation is problematic. |
series analysis. Even though statistical modeling fundamentally requires judgment, the statistical method constrains the forecaster in many ways, in contrast to a purely judgmental approach.
In the overall design of the estimation strategy, outside information can be used informally or formally via Bayesian or other techniques. For example, Alho and Spencer (1985) and Lee (1993) used the judgment of the U.S. Census Bureau as input in the time-series modeling of U.S. total fertility, and Lee and Tuljapurkar (2000) used the judgment of the U.S. Social Security Administration in formulating a number of their time-series models. In a similar manner, other sources of outside information, such as trends in HIV/AIDS prevalence or changes in the mean age at childbearing, can be incorporated.
Time-series methods may be used in various ways: to attach probability intervals to judgmental forecasts (Alho and Spencer, 1985) or to directly model and forecast population size or the population growth rate (Pflaumer, 1992; Cohen, 1986). More commonly, however, time-series models have been fit for fertility and mortality, which are then input into cohort-component projections.
While the time-series models could then directly produce forecasts with probability intervals of the vital rates, the proper procedure to produce the predictive distribution would be to take the additional step of stochastic simulation (Monte Carlo methods). Random numbers can be used to produce appropriate random disturbances that lead to random trajectories for each of the rates. Each set of random trajectories can be used to generate, via cohort-component projection, a single detailed population forecast (called a realization or sample path). With thousands of realizations, all randomly derived, one can obtain a predictive distribution for each parameter of interest (Lee and Tuljapurkar, 1994; Alho, 1998). These distributions will reflect all the various correlations in the historical data across age, sex, and time. The distributions will all be probabilistically consistent, so that the kinds of problems noted above for the scenario approach will not occur.
The time-series approach has the advantages of using a well-established statistical method; involving explicit mathematical models that are open to testing by others; allowing alternative models to compete under well-defined criteria for success; and producing predictive distributions, based on empirical analysis of the past, with an internally consistent probability structure. The time-series forecasts of error distributions can incorporate errors that persist strongly over time. For example, the Lee-Carter mortality forecasts incorporate uncertainty about the estimated trend term for mortality decline. More generally, this happens in forecasts for any nonstationary series, to an extent indicated by the empirical analysis.
The time-series approach also has disadvantages. First, the historical
data required are available for few, if any, developing countries, although it may be possible to generalize what is learned from countries with adequate data to those countries for which data are lacking (see, e.g., Alho, 1997). Second, the results depend on the judgments of the analyst. Third, some people find the essentially extrapolative nature of the procedure unacceptable.
Expert-Based Probabilistic Projections
The high and low scenarios in the projections of experts at official agencies do not have explicit probabilities associated with them. Experts could in principle attach, to their judgmental forecasts, judgmental probability distributions for the forecasts, deciding, for instance, on a high-low range to enclose 95 percent of likely outcomes. Additional assumptions would also be needed about distributional form (such as uniform or normal) and about the correlations of forecast errors over age, sex, and time and among fertility, mortality, and migration. Given the expert judgments and such assumptions, one could use stochastic simulation to calculate prediction intervals for parameters of interest (Törnqvist, 1949; Keyfitz, 1981; Pflaumer, 1988).
The International Institute for Applied Systems Analysis (IIASA) has used this approach most recently and most extensively (Lutz et al., 1996, 1998). From discussion among experts they designated, they chose high and low values for future fertility, mortality, and migration (for 13 world regions), with the high-low interval in each case meant to include “roughly 90 percent of all possible future cases” (Lutz, 1996:362).4 Alternative trajectories for these components were then generated, using piece-wise linear paths that were shifted multiplicatively by randomly drawn multipliers. By construction, all the random trajectories for a given component were parallel, so none of the trajectories represent fluctuations. As with the traditional scenario method, this approach involves an implicit assumption of perfect positive correlation of errors across time.
In contrast to time-series analysis, the use of experts is obviously much less demanding of data. But it may be too demanding of experts. It is not certain that enough experts could be identified to define intervals
|
4 |
Their point forecast is simply the mean of the high and the low. They publish reviews of component trends by their experts, but apparently do not have, or at least do not document, any systematic, objective process for extracting high and low numbers from these reviews or the interaction among their experts. The experts are actually involved only up to 2030-2035. For later years, the forecasters make their own judgments about trends (Lutz, 1996:373-374). They apply to their procedures the name Expert- and Argument-Based Probabilistic Projections (EAPP). |
for every country in the world annually or biennially (as other forecasters do), rather than just occasionally for 13 regions. Relying on expert judgments about probability is in any case problematic, since experts are often overconfident and uncertainty may be underestimated. Indeed, in light of the many different possible interpretations of the probability coverage of high-low ranges, it is not clear what question experts are answering or should be answering, and how the issues of correlations across input variables should be addressed. In addition, it is very difficult for experts to give the distributional form with any precision. Experiments from the elicitation of relative preferences show that the elicited views of experts can be highly uncertain (see Alho et al., 1996).
Ex Post Analysis
Another approach to producing predictive distributions is to base them on the accuracy of past forecasts. The distribution of past errors can be used as the basis for assigning probability distributions to the errors of current forecasts (Keyfitz, 1981; Stoto, 1983). In principle, one could analyze past errors for any demographic parameter of interest and calculate prediction intervals for it.
Ex post analysis rests on the basic assumption that the errors made by forecasters today will be similar to those made by forecasters in the past, particularly forecasters from the same agency. Explicit allowance can be made for improved data quality, which has led to better accuracy up to the 1970s and possible small improvements since then. This implies smaller errors for current and future forecasts than for old ones. For posttransitional countries, in which data quality has not been a major factor, there has been little evidence of smaller errors for successive forecast rounds.
Unlike the two previous methods for estimating uncertainty, the ex post method does not produce forecasts but rather attaches probability intervals to separately generated forecasts. Errors have to be analyzed for the specific type of forecasts for which prediction intervals are desired. The intervals derived from this analysis cannot be applied to substantially different forecasts from other sources. The world projections from different agencies that have been considered here, however, are typically in fairly close agreement. It may be acceptable, therefore to apply intervals derived from U.N. forecasts, for instance, to forecasts from other agencies, but this remains to be verified.
Despite the statistical and practical appeal of this approach, it does have drawbacks. There is no guarantee that probability distributions derived from ex post analysis of the forecasting records of two different agencies will be consistent. If demographic phenomena will be more or
less predictable in the future than they were in the past, the prediction intervals will be too wide or too narrow. The statistical record that can be analyzed is also relatively short. The U.N. began making world projections in the 1950s (and other agencies started their forecasts much later), allowing calculations over projection horizons up to 45 years or so. Older forecasts, however, provide little detail. Moreover, since forecast errors of time series are usually highly autocorrelated, not too many independent pieces of information are typically available.
One way to try to overcome this problem is to replace actual forecasts by naïve or baseline forecasts (Alho, 1990; Keyfitz, 1981). For example, we can study how accurate past fertility projections would have been if they had assumed that the base value persisted. Similarly, we can check how the assumption of a constant rate of decline of mortality would have fared. The advantage of such an approach is that the assessment of error is not dependent on when and how often past forecasts were made. Such error estimates would be expected to be larger than the errors of actual forecasts, in some cases only slightly so but in others substantially. A naïve forecast that keeps population growth rates constant would have had about a third more error than U.N. and World Bank country projections, but about nine times more error than these agencies' world projections (see Appendix B).
Illustrative Forecasts for Fertility
To illustrate some of these points, we have constructed a simple statistical time-series model based on an analysis of errors in projected industrial-region total fertility in U.N. forecasts. We have used this model to generate stochastic sample paths for total fertility from 1995-2000 to 2045-2050.5 These sample trajectories are centered around the U.N. medium fertility projection for industrial countries. We could think of them as representing alternative fertility paths for a typical industrial country (other than the United States, which has atypically high fertility).
Each of the four simulated, random paths illustrated in Figure 7-4 is consistent with the model, but they portray quite diverse demographic futures. In one, fertility starts out above the medium projection but then drops below it, and eventually falls below 1 birth per woman, before recovering to close to the medium projection at 1.8 births per woman. In
|
5 |
The model has a first-order correlation of 0.626 and innovation variance of 0.063. The innovation variance is for new errors entering the forecast, as distinguished from the persisting effects, because of autocorrelation, of older errors. This exercise is primarily statistical; we do not attempt to construct a substantive vision of the social and economic situation that might lead to the trajectories illustrated. |
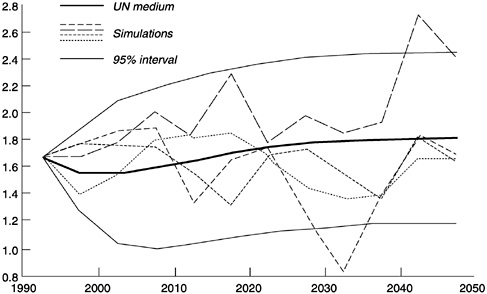
FIGURE 7-4 Four stochastic sample paths for industrial-region total fertility and 95-percent prediction interval from multiple simulations, compared with U.N. medium projection.
SOURCE: Calculated from estimated error in U.N. and World Bank forecasts, as analyzed in Appendix B.
another, fertility starts below the medium projection, then rises above it to 2.3, falls again, and then rises to 2.6 in 2040-2045. In addition to the four sample paths for this typical industrial nation, we have plotted the upper and lower 95-percent probability bounds for fertility, estimated from numerous such paths. These bounds enclose most but not all of the projected points in the four sample paths.
We might say, as noted in Chapter 4, that the future level of fertility is indeterminate. We simply do not and cannot know what it will be at a particular point in the future. Nevertheless, each of these four randomly generated potential trajectories is consistent with the U.N. medium forecast for industrial populations and the kinds of deviations from medium forecasts that have occurred in the past.
This illustration is for fertility, but parallel implications could be drawn for mortality or international migration. In the case of migration, for instance, even if the medium projection were for zero migration in each country, every stochastic sample path for regions or countries would still show migratory flows. Setting the median projection at zero (which Appendix E suggests is better than keeping it constant everywhere) would not mean that the forecaster expected no migration. The forecaster might
indeed expect that international migratory flows would rise, absolutely and relatively. However, choosing a zero projection would imply that the forecaster saw no basis for predicting which countries would be net receivers and which net senders.
This rough example illustrates some results when prediction intervals for population growth components are derived. We now apply ex post procedures in a more rigorous fashion to estimating the uncertainty in population-growth forecasts, but with no attempt to model the separate growth components.
NEW ESTIMATES OF UNCERTAINTY BASED ON EX POST ANALYSIS
Seeking prediction intervals for population growth, we develop a statistical model to fit the error in past U.N. forecasts and produce intervals through stochastic simulation. The model, and therefore the estimated prediction intervals, reflect past errors. This is basic to the ex post approach and as we have argued also implies a basic limitation, since neither future forecasts nor future demographic trends can be expected to exactly duplicate the past.6
The model focuses on population growth rates. This direct approach is not entirely satisfactory because errors due to unexpected variations in fertility, mortality, and net migration are all combined and not distinguished. A more satisfactory approach would be to focus on these components, as in the previous example, and analyze the uncertainty in projected age-specific vital rates to show how uncertainty propagates through cohort-component calculations. Such analyses have been previously done for a handful of countries but are too involved to consider here.
As an ex post approach, the model we develop takes into account the correlation of errors between countries and over time. It allows the scale of error to depend on past projection error for any given country. It also allows forecast uncertainty to increase, as it appears to in past forecasts, with lead time or projection length.
|
6 |
The preceding arguments about the problems of the scenario approach and the possibilities of alternatives are quite similar to those made by a technical panel on U.S. Social Security Administration projections (Social Security Advisory Board, 1999). At this point, however, we diverge from the panel's recommendation for systematic application of time-series models. Developing such models worldwide, rather than just for the United States or some industrial countries, is not at present a practical option. |
Model and Data
The model is developed mathematically in Appendix F (at http://www.nap.edu). Equations are presented that represent the error in projected growth rates as a function of both gradual deviations from the true growth rate and unpredictable annual perturbations in it. The model is elaborated to allow for particular levels of cross-correlation of errors.
The data on which the model is based are country projection errors in four U.N. forecasts we have evaluated, dated 1973, 1980, 1984, and 1994. We concentrate on the U.N. data rather than including the World Bank data also evaluated (see Appendix B) essentially to simplify the analysis.
Limitations
These data are not ideal. We have only four U.N. forecasts, which can be evaluated against a relatively short demographic history. Each country has a maximum of four data points for the error at each lead time, and no lead time is longer than 30 years. In addition, the informativeness of the data is weakened by the fact that errors are correlated. Errors of forecasts with different lead times from the same base year tend to be similar, and errors of forecasts for the same calendar year from different base years also tend to be similar.
Partly counteracting these limitations, the data have the advantage that country cases can be viewed to some extent as replications of each other. We can capitalize on this replication by making the statistical model depend on the geographic or socioeconomic regions to which countries belong.
Regional Definition and Correlations
Regions were defined using geographic proximity as a criterion, taking into account, in borderline cases, a country's average past forecast error. This process resulted in 10 world regions: Western and Middle Africa; North, Eastern, and Southern Africa; the Middle East; South Asia and China; East Asia, excluding China; the Pacific Islands; Latin America and the Caribbean; Northern America and Australia; Western Europe; and Eastern Europe and the former Soviet Union (see Appendix Table F-1).
Forecast errors in the past record tend to be larger for some countries than for others, and for some regions than for others. Because these errors may not be representative of the volatility of each country's demography, we permit the error variance for a country to depend partly (by 85 per
cent) on these estimated errors and partly (by 15 percent) on forecasting errors for other countries in the same region.7
Correlations of errors across countries within regions might be expected if demographic developments were similar, or if forecaster's errors of judgment were similar. However, estimated correlations are generally quite low, averaging 0.15. An exceptional case is that of Eastern Europe and the former Soviet Union, with an average intraregional correlation of 0.50, possibly reflecting parallel national statistical procedures before the Communist bloc fell apart. We will assume that, within a region, forecast errors between countries have identical autocorrelation structures and that the average correlation is 0.375. 8 We will also allow, in some estimates for world population, for correlations in errors across regions. Based on our analysis of past forecast errors, we assume that interregional forecast errors have a correlation of 0.10. Finally, in the case of world projections only, we also allow for errors in baseline data.
Prediction Intervals
Stochastic simulations (10,000 in all) were run using the model in order to estimate 95-percent prediction intervals around the 1998 U.N. forecast (United Nations, 1999). We focus on the ratio of the upper and lower 95-percent probability bounds to the point forecast (which we take to be the U.N. medium variant) and provide similar ratios to the medium variant using the U.N. high and low variants.
Country Populations
These ratios for 10-year projections are shown in Figure 7-5 for 13 large, geographically dispersed countries. Except for Australia, each country is among the 20 largest countries today, so that collectively they account for 60 percent of world population.
The estimated upper-bound and lower-bound ratios for China of 1.038 and 0.964 indicate that, with a probability of 95 percent, population in 10 years will be no more than 3.8 percent above and no less than 3.6 percent below the point forecast. The sum of these percentages—7.4 percent in this case—provides a convenient summary of the width of the 95-percent prediction interval. Across the 13 countries, the median width of the in
|
7 |
The results of assuming alternative balances between these two factors are reported in Appendix F. Projection intervals do not appear to be particularly sensitive to this factor. |
|
8 |
Appendix F considers alternative values for the intraregional correlation and demonstrates that regional prediction intervals, at least, are not highly sensitive to them. |
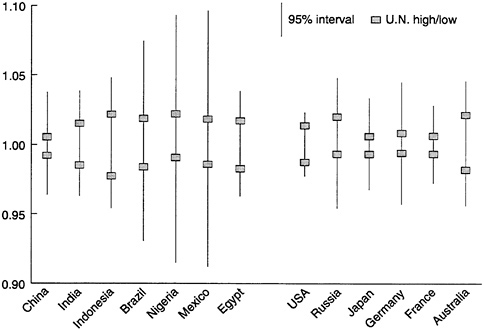
FIGURE 7-5 Estimated 95-percent prediction interval (with median projection set equal to 1) for population projected 10 years, and comparable U.N. high-low interval: 13 large countries.
SOURCE: Based on composite estimates in Appendix Table F-3 and United Nations (1999).
terval is 8.8 percent. The interval varies greatly, but as the figure shows, its width is always greater than that defined by U.N. high-low intervals, whose median width is only 3.0 percent.
Prediction intervals for 50-year projections are shown in Figure 7-6. Although this looks superficially somewhat similar to the previous figure, the scale is quite different. The countries with relatively wider and narrower intervals are the same, but the intervals are 5 to 10 times wider and somewhat asymmetric. Across countries, the upper-bound ratios range from 1.20 up to 2.29 (i.e., more than double the point forecast), and the lower-bound ratios from 0.83 down to 0.44 (less than half the point forecast). The median width of these intervals is 73 percent. By contrast, the U.N. high-low intervals have a median width of only 31 percent. We can conclude, therefore, that, given a 50-year horizon, the U.N. high-low intervals for individual countries have far less than 95-percent probability coverage.
Figure 7-5 and Figure 7-6 also demonstrate an important contrast between
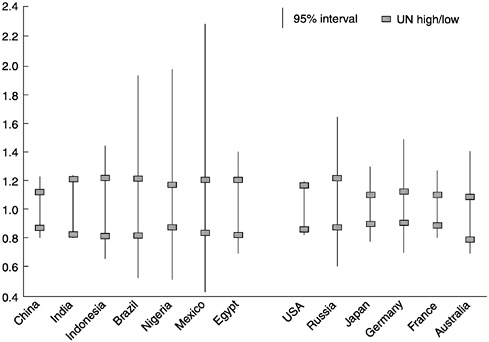
FIGURE 7-6 Estimated 95-percent prediction interval (with median projection set equal to 1) for population projected 50 years, and comparable U.N. high-low interval: 13 large countries.
SOURCE: Based on composite estimates in Appendix Table F-3 and United Nations (1999).
countries. Developing and industrial countries are each ordered from larger to smaller as one moves from left to right. Among developing countries, with the exception of Egypt, prediction intervals increase as population size decreases. This is a consequence of the greater error in projections of smaller than larger countries (see Chapter 2) and may imply that still wider intervals are appropriate for the many smaller developing countries not represented. A similar relationship does not exist among the industrial countries shown.
Regional Populations
Upper-bound and lower-bound ratios for 50-year projections of the 10 regions we distinguish appear in Figure 7-7. The 95-percent prediction intervals for regions are narrower than those for the individual countries just considered. Their median width is 45 percent, or two-thirds of the median for countries. This narrowing reflects the tendency for some coun-
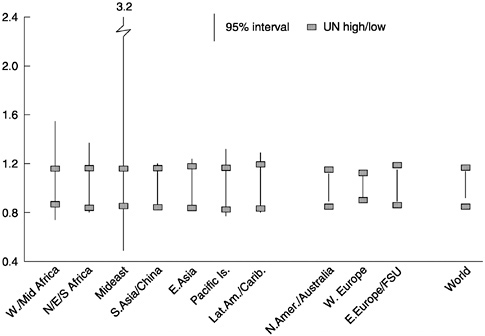
FIGURE 7-7 Estimated 95-percent prediction interval (with median projection set equal to 1) for population projected 50 years, and comparable U.N. high-low interval: 10 regions and the world.
SOURCE: Based on Appendix Table F-5 and United Nations (1999).
try errors to cancel each other in regional aggregations. However, the prediction intervals remain wider, on average, than U.N. high-low intervals, whose median width is 32 percent.
The extreme results for the Middle East—where the upper bound of the prediction interval is more than three times the point forecast and the lower bound half of it—reflect the region's turbulent recent demographic history: proportionally large and sudden flows of migrants as well as fertility declines that were unaccountably delayed and then proceeded precipitately with few advance indications.
Even leaving out the Middle East, the prediction intervals for developing regions are wider than those for industrial regions. The narrowest for developing regions is 37 percent, whereas the widest for industrial regions is 26 percent. The U.N. high-low intervals are quite similar for developing and industrial regions, being uniformly narrower than the 95-percent prediction intervals for developing regions and uniformly wider for industrial regions.
World Population
Figure 7-7 also shows the upper-bound and lower-bound ratios for world population. Our estimated ratios of 1.14 and 0.92 indicate that, with 95-percent probability, world population in 50 years will be no higher than 14 percent above and no lower than 8 percent below the point forecast. The U.N. high-low ratios, at 1.17 and 0.85, suggest a wider interval.
The width of our estimated interval, at 22 percent, is half the median width of our estimated regional intervals and less than a third the median width for country intervals. By contrast, the width of the U.N. interval, at 32 percent, is essentially identical to the median widths of the U.N. intervals for region and countries. Our estimated intervals become narrower at each level of aggregation because they take into account the common cancellation of errors. The constancy of the U.N. intervals illustrates one serious problem with the scenario method: the probability coverage for different projected units and aggregates is not consistent.
We have examined prediction intervals for 10- and 50-year projections from 1995. To illustrate results up to 2050, adjustments were made to move the results 5 years forward (see Appendix F). In addition, we allowed for the possibility of base error in the population estimate (0.33 percent, corresponding to that estimated from previous U.N. and World Bank world forecasts) and for interregional correlation (0.10). With all these adjustments, the 95-percent prediction interval becomes slightly wider, although the change is mainly at the upper bound rather than at the lower bound. Figure 7-8 plots estimated upper and lower bounds as well as the U.N. high, medium, and low world projections. The 95-percent prediction interval is clearly asymmetric, with the lower bound being closer to the medium U.N. projection than the upper bound. Given the medium projection of 8.9 billion by 2050, the interval runs from 10.9 to 7.9 billion, or 2.0 billion above to 1.0 billion below the point forecast. The probability that the U.N. medium projection is substantially too low, say by a billion or more, is small but still appears to be greater than the probability that it is substantially too high by a billion or more.9
The U.N. high-low interval, by contrast, is symmetric and runs from 10.7 billion to 7.3 billion in 2050. The U.N. high projection from 1995 to 2050 falls just inside our 95-percent prediction interval (with the adjust
|
9 |
Relying ultimately on expert judgments, IIASA estimates the 95-percent interval at 8.1 to 11.9 billion, 30 percent wider than our estimates and higher, being symmetric around their median estimate of 10.0 billion (Lutz et al., 1996:418, 422). The authors explain the higher estimates as due to these projections being produced some years before the others. The precise explanation for the wider interval is not known. It may be due to the projection only of regions and not countries or to the use of parallel trajectories in simulating the components of growth. |
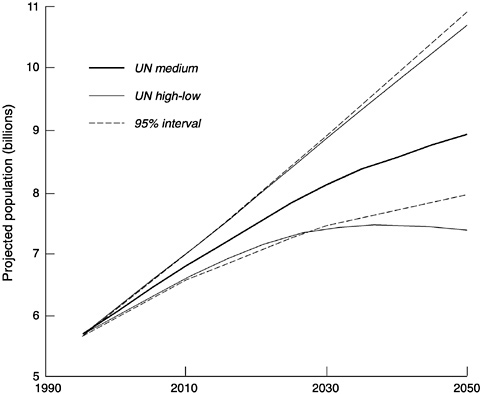
FIGURE 7-8 Projected world population: U.N. projections and estimated 95-percent prediction interval.
SOURCE: Based on the final adjusted estimates in Appendix Table F-7 and United Nations (1999).
ments to the latter), but the U.N. low projection falls below this interval beginning around 2030. The U.N. low projection indicates population decline after 2040, while the lower bound of our estimated 95-percent prediction interval continues to rise substantially at least up to 2050. This rising lower bound does not rule out the possibility that future population will decline in any time slice in this period, since population could increase rapidly and then decline while still staying within bounds. While we cannot examine every particular time slice, we can look at the period from 2030 to 2050. Under our model assumption that current U.N. projections have a similar error structure to projections of recent decades, we find that, of 10,000 stochastically simulated sample paths, only 9, or onetenth of 1 percent, showed decline between these points. One might infer that the projected population decline from 2040 to 2050 shown by the U.N. low scenario also has quite a low probability.
CONCLUSIONS
The traditional scenario method for calculating and communicating uncertainty, which is still common practice for official national and some international projections, has many serious problems. No probability is attached to high-low intervals. In fact, probabilities would be difficult to assign because they would vary for different projected variables, such as population size and the old age dependency ratio. As indicators of uncertainty, high-low scenarios are internally inconsistent. Furthermore, the bundling of assumptions about population growth components (high fertility with low mortality, for instance) is arbitrary and affects the uncertainty attached to outcomes, which are therefore also arbitrary. Finally, scenarios for regions and for the world do not take account of the correlations among the forecast errors for national populations, which determine whether country errors cancel or reinforce each other when countries are combined into an aggregate.
Several alternative approaches are available for calculating and communicating the uncertainty of forecasts in a probabilistic manner: judgmental approaches, time-series methods, and ex post analysis. Each has strengths and weaknesses, as discussed above.
Using the ex post approach and an appropriate statistical model developed after analysis of errors in international forecasts, we estimated prediction intervals for the current U.N. forecast. These intervals are constructed on the assumption that errors in current projections resemble those in past projections made after 1970. Our results suggest that the uncertainty in country projections is quite variable and is dramatically greater than suggested by U.N. high-low scenarios, with a typical 95-percent range more than twice as wide as the U.N. high-low intervals.
Regional 95-percent intervals are similarly variable but generally much narrower than country intervals. For developing regions, however, they are still consistently wider than U.N. high-low intervals. Across regions, the median 95-percent interval in 50-year projections was 40 percent wider than the U.N.'s high-low interval. However, prediction intervals are proportionally narrower for industrial regions and for the world as a whole. In these cases, our estimated prediction intervals are narrower than the intervals defined by the U.N. high-low scenarios. The world prediction interval also suggests a greater possibility of a downside than an upside error, making sustained population decline appear quite unlikely during the next 50 years.
From our consideration of uncertainty and approaches to representing it, recommendations can be drawn for forecasters, for users of forecasts, and for population researchers with an interest in improving projections. These are presented in shorthand as a set of injunctions.
Recommendations for Practitioners
-
Gradually replace the use of variant scenarios with other methods for representing uncertainty. Recognize the shortcomings of scenarios and explain these in forecasts in which they are still used. Think hard about what the variants are supposed to convey. Communicate this to users.
-
Analyze past forecast performance and publish information drawn from the ex post analysis. Formulate and document forecasting methods so that the reasons for errors can be identified afterward.
-
Apply such methods as those described in this report for formally constructing probability intervals around forecasts and publish these after appropriate review.
Recommendations for Users
-
Take uncertainty seriously; attend to high and low scenarios, if given, and to other indicators of likely forecast error. Think of the forecast not as the middle line, but as a whole distribution.
-
Consider how forecast uncertainty affects whatever use is to be made of the forecasts. What are the implications of uncertainty? Take action now? Defer action? Develop adaptive policies? Prepare buffer stocks?
-
In light of uncertainty, consider over what horizon the forecast conveys information that is useful for your purposes; just because the forecast covers 100 years does not mean that you should necessarily use that long a projection.
Recommendations for Researchers
-
Extend and deepen the modeling of uncertainty, in order to use ex post analysis to derive probability intervals for forecasts.
-
Develop ex post models to estimate prediction intervals for component rates.
-
Compare random scenario and time-series methods. Do they lead to seriously different probability distributions?
-
Develop prediction intervals from structural equation models. Why are such intervals seldom estimated? Are they more usefully produced from simplified statistical models?
-
Systematize approaches to eliciting expert judgments of uncertainty. Verify whether such judgments are sufficiently veridical.
-
Study the correlation structure of errors, which has a very important impact on estimates of probability distributions, and incorporate the results in estimates of uncertainty.
-
Assess the utility of borrowing essential parameters, coefficients, variances, etc., from one country to use with other countries. Can the data deficiencies of the developing countries be overcome in this way?
-
Evaluate the possibilities of combining forecasts done by different agencies or by different methods. Does this reduce error?
-
Analyze user options in taking advantage of information on probabilities.
REFERENCES
Alho, J.M. 1990 Stochastic methods in population forecasting. International Journal of Forecasting 6:521-530.
1997 Scenarios, uncertainty and conditional forecasts of the world population . Journal of the Royal Statistical Society, Series A 160(1):71-85.
1998 A Stochastic Forecast of the Population of Finland. Reviews 1998/4. Helsinki: Statistics Finland.
Alho, J.M., and B.D. Spencer 1985 Uncertain population forecasting. Journal of the American Statistical Association 80(390):306-314.
Alho, J.M., J. Kangas, and O. Kolehmainen 1996 Uncertainty in the expert predictions of the ecological consequences of forest plans. Applied Statistics 46:1-14.
Box, G.E.P., and G.M. Jenkins 1976 Time Series Analysis. 2nd ed. San Francisco: Holden-Day.
Cohen, J. 1986 Population forecasts and confidence intervals for Sweden: A comparison of model-based and empirical approaches. Demography 23(1):105-126.
Day, J.C. 1996 Population Projections of the United States by Age, Sex, Race, and Hispanic Origin: 1995 to 2050. Current Population Reports, P25-1130. Washington, D.C.: U.S. Census Bureau.
Fedoroff, N.V., and J.E. Cohen 1999 Plants and population: Is there time? Proceedings of the National Academy of Sciences U.S.A. 96(11):5903-5907.
Keilman, N. 1998 How accurate are the United Nations world population projections? Population and Development Review 24(Supplement):15-41.
Keyfitz, N. 1981 The limits of population forecasting. Population and Development Review 7(4):579-593.
Lee, R.D. 1993 Modeling and forecasting the time series of US fertility: Age patterns, range, and ultimate level. International Journal of Forecasting 9:187-202.
1999 Probabilistic approaches to population forecasting. Population and Development Review 24(Supplement):156-190.
Lee, R.D., and L. Carter 1992 Modeling and forecasting the time series of U.S. mortality. Journal of the American Statistical Association 87(419):659-671.
Lee, R., and S. Tuljapurkar 1994 Stochastic population projections for the United States: Beyond high, medium and low. Journal of the American Statistical Association 89 (428):1175-1189.
2000 Population forecasting for fiscal planning: Issues and innovations . In A. Auerbach and R. Lee, eds., Demography and Fiscal Policy. Cambridge University Press, forthcoming.
Lutz, W., ed. 1996 The Future Population of the World: What Can We Assume Today? Revised 1996 ed. London: Earthscan Publications Ltd.
Lutz, W., W.C. Sanderson, and S. Scherbov 1996 Probabilistic population projections based on expert opinion. Pp. 397-428 in W. Lutz, ed., The Future Population of the World: What Can We Assume Today? Revised 1996 ed. London: Earthscan Publications Ltd.
1998 Expert-based probabilistic population projections. Population and Development Review 24(Supplement):139-155.
Pflaumer, P. 1988 Confidence intervals for population projections based on Monte Carlo methods. International Journal of Forecasting 4:135-142.
1992 Forecasting U.S. population totals with the Box-Jenkins approach. International Journal of Forecasting 8(3):329-338.
Social Security Advisory Board 1999 The 1999 Technical Panel on Assumptions and Methods: Report to the Social Security Advisory Board. Retrieved March 2000 from the World Wide Web at http://www.ssab.gov/Rpt99.pdf.
Stoto, M. 1983 The accuracy of population projections. Journal of the American Statistical Association 78(381):13-20.
Törnqvist, L. 1949 Points of view that have determined the primary forecast assumptions . Pp. 68-74 in A. Hyppölä, J. Tunkelo, and L. Törnqvist. Calculations Concerning the Population of Finland, Its Renewal and Future Development. Statistical Reviews 38. Helsinki: Statistics Finland. (In Finnish.)
United Nations (U.N.) 1999 World Population Prospects: The 1998 Revision, Vol. 1, Comprehensive Tables. New York: United Nations.
Wheeler, D. 1984 Human Resource Policies, Economic Growth, and Demographic Change in Developing Countries. Oxford, Eng.: Clarendon Press.


