
APPENDIX
B
Accuracy of Population Projections from the 1970s to the 1990s
The accuracy of multicountry population projections from the 1970s to the 1990s is assessed against current estimates. This assessment is meant to provide insight into the factors that affect accuracy and indirectly some understanding of the uncertainty of current and future projections.
Assessments are made of projections for individual countries rather than aggregates, although we also consider the accuracy of projections for the world as a whole. The projections are assessed against the most convenient source, U.N. data from the 1998 revision of its estimates and projections. Both population and the components of growth (fertility, mortality, and migration) are examined, but not the age-sex structure. Attempts are made both to account for inaccuracy and to predict it.
DATA AND MEASURES
Data
The projections to be covered are from the U.N. Population Division and the World Bank, plus one additional set from the U.S. Census Bureau. Each set of projections is referred to as a forecast, to distinguish the entire set from the individual projections that comprise it. The reference years for these forecasts and the sources are as follows:
|
Agency |
Forecast dates |
Sources |
|
U.N. Population Division |
1973, 1980, 1984, 1994 |
United Nations (1977, 1982, 1987, 1994) |
|
World Bank |
1972, 1983, 1988, 1990 |
Zachariah and Cuca (1972); Vu and Zachariah (1983); Vu et al. (1988); Bos et al. (1991) |
|
U.S. Census Bureau |
1987 |
McDevitt (1999) |
The forecasts covered start, somewhat arbitrarily, in the 1970s. Various earlier U.N. projections have been evaluated elsewhere (e.g., Keyfitz, 1981; Stoto, 1983). Similar evaluations have not been done for the World Bank, for which the 1972 forecast was the earliest that covered the world or a good part of it. For the U.S. Census Bureau, earlier projections were not of the cohort-component type, and the 1987 forecast was the only such available (see McDevitt, 1999; Jamison et al., 1987).
Some forecasts involve a limited number of countries. The 1972 World Bank forecast includes only member countries, about 70 percent of the world's population at the time. The 1987 U.S. Census Bureau forecast covers only developing countries. The other forecasts all cover between 170 and 250 countries, but comparisons never involve more than the 219 in the 1998 U.N. estimates, none of which has a population smaller than 75,000.
Because countries have rearranged themselves over time, the units in the different forecasts do not always coincide. Data for different countries were aggregated when necessary to permit comparisons, especially in the cases of Czechoslovakia, Ethiopia-Eritrea, Germany, the Soviet Union, Yemen, and Yugoslavia. Although we consistently refer to “countries,” some cases in the analysis, such as these, may not actually be countries; some others also lack full sovereignty and are territories, economies, or overseas departments, such as Puerto Rico and Martinique.
Projected population and projected components in these forecasts are examined for every 5 years from the base date of each projection to 2000. The base date is taken to be the year divisible by five preceding the date of the forecast. Not all the data are available from this date to 2000 in each case; the earlier forecasts in particular are less fully reported. The 1972 World Bank forecast does not provide life expectancy or infant mortality, and in addition reports results for decades rather than 5-year periods. The 1973 and 1980 U.N. forecasts do not provide infant mortality and give the gross reproduction rate, which is multiplied by 2.05 to obtain total fertil
ity. The 1987 Census Bureau data do not provide results for 1995, although they do give them for 1990 and 2000, and have fertility projected to only one point and no projected mortality.
The criterion against which the projections are compared is the 1998 U.N. population forecast, issued toward the end of November 1998 and published in June 1999 (United Nations, 1999). It would be preferable to compare agency projections instead with the same agency's own current estimates, which can differ in particulars from those of the U.N. This is not easy to do, however. The World Bank historical estimates are sometimes for individual years and sometimes for multiyear periods and therefore not always directly comparable to projections, and the U.S. Census Bureau does not update its historical estimates annually. The 1998 U.N. estimates have their own drawbacks. Given limited data on some countries, some historical estimates may themselves involve backward projections.
To try to ensure that solid criteria are used, the analysis was intended to focus mainly on countries with good recent population data, principally a census in the 1990s or, for a few European countries, reliable vital registration. Although there are many exceptions and inconsistencies, countries with a recent census tend to be more developed than those without one and presumably have at least demonstrated the national capacity to conduct such a statistical exercise. As will be seen, however, this criterion proved problematic and was not applied throughout.
Measures
Two aspects of projection accuracy are of interest: whether the projected parameter is too high or too low relative to the 1998 U.N. forecast and how close it comes to the current estimate. The first aspect, measured as the signed difference between the projected figure and the current estimate divided by the current estimate, is referred to as proportional error. For country i projected to year t the proportional error (pe) will therefore be
peit = (![]() it − Pit)/Pit
it − Pit)/Pit
where P stands for actual population and ![]() for projected population. The second aspect—how close the projected parameter comes to the true value—will be measured as the absolute value of proportional error, or |peit|.
for projected population. The second aspect—how close the projected parameter comes to the true value—will be measured as the absolute value of proportional error, or |peit|.
In the literature, these two measures may be averaged, e.g., across projections of different lengths or lead times. They may then be referred to as mean percentage error (MPE, or mean algebraic percentage error,
MALPE) and mean absolute percentage error (MAPE), usually being expressed as percentages (e.g., Keilman, 1998; Tayman and Swanson, 1996). Somewhat confusingly, however, MPE and MAPE have sometimes been applied even when means are not taken. Since in addition we often use proportions rather than percentages, we avoid the abbreviations here.
For growth components, similar measures of error and absolute error are calculated. In this case, however, raw differences rather than proportions are taken for total fertility, life expectancy, and infant mortality, given that component rates are already expressed in relation to population.
Migration assumptions are similarly assessed but require some explanation. Net migration is examined, since neither immigration nor emigration is projected separately. Historical estimates of net migration are often obtained as residuals, by comparing estimated population growth with births and deaths (Zlotnik, 1999). One might assume therefore that historical net migration estimates are less reliable than fertility, mortality, or growth estimates. This is not the complete story, however, because forecasters can be assumed to examine carefully cases in which net migration is believed to be substantial. These few cases —in which absolute net migration rates may be 10 or 15 times the average —carry much more weight, in statistical analysis, than the many cases in which net migration is close to zero.
In addition, the equation that relates growth to components (Population growth = Births − Deaths + Net migrants) is an exact equation, with no residual error. Any measurement error for migration must be exactly balanced by measurement error for growth, births, or deaths. The migration estimates, therefore, should have no greater (and no less) error than the other variables combined. We assume that the other measurement errors are not perfectly correlated, so they will cancel each other at least occasionally. This may still leave the migration estimates with greater proportional measurement error, because net migration rates are generally small. However, we are not examining proportional error in projected growth components but raw error.
In analyzing the error in these projections, various country classifications and related variables are used:
-
Whether or not a country has had a national population census in the 1990s. National censuses in this period have covered 80 percent of the world's population. The existence of such a census is used, in some analysis, essentially as a proxy for presumed population data quality.
-
Population size at the start of a projection. Countries are divided into those of at least one million people and smaller countries, on the assumption that forecasts have often paid less attention to small countries.
-
Initial total fertility rate, dichotomized at 4.5 children. A high fertility level may mean more scope for error in specifying rates. Initial life expectancy and initial net migration are also used in some analyses.
-
Developing country and industrial country (or developed country) status, as defined by the U.N.
-
World region, with countries divided into six regions: Europe and the former Soviet Union; other industrial countries around the Pacific Rim; Latin America and the Caribbean; Asia and Oceania; the Middle East and North Africa; and Sub-Saharan Africa. The Soviet Union is treated as a unit because forecasts did not distinguish its subunits until its breakup. The Pacific Rim industrial countries include the United States and Canada (and the rest of Northern America, which is sometimes defined to include Bermuda, Greenland, and St. Pierre and Miquelon), Japan, and Australia and New Zealand and are generally referred to, for shorthand, as the United States, Australia, and Japan. Asia and Oceania excludes Japan and the Middle East but still contains the majority of the world's population. In regard to number of countries, however, it is similar to other regions, and variation in the relevant parameters within the region is no greater than elsewhere.
-
The presence of significant discontinuities in recent population history. These discontinuities, referred to as “demographic quakes, ” are measured by changes in a country's annual population growth rate of at least 2.5 percentage points between one 5-year period and the next. Further explanation of this concept is provided below.
The analysis relies initially on means, across countries and across forecasts. Some multivariate analysis is then reported to explain inaccuracy.
ACCURACY OF PROJECTED POPULATION
Table B-1 shows proportional error and absolute proportional error derived by comparing projected population and population as currently reported by the U.N. Each row of the table presents means for a single forecast assessed against the 1998 U.N. estimates. These forecasts all project population for a succession of 5-year periods, usually starting with the year divisible by five immediately preceding the date of the projection, designated as year 0 in the table. The comparison for year 0, therefore, is a check on the accuracy of what we consider the base population estimate used in the projection. Since the earliest forecasts examined have base years of 1970, the longest projection that can be checked is for 30 years, up to the year 2000.
Error
Past projections are, on average across countries and forecasts, biased upward relative to current estimates. The bias increases the longer is the projection period, from 1 percent for a 5-year projection to 6 percent for a 30-year projection. This pattern of increasing bias with longer projection horizons holds across all forecasts.
Longer projections appear to have greater error. Projection length itself is the main reason, but two other factors may be considered because they may contribute slightly. The longer projections are primarily those made earlier, in the 1970s, whereas shorter projections also include more recent ones. One might hypothesize that earlier projections were less accurate. But the table does not support this. For 10-year projections, for instance, the two earliest forecasts were among the least biased.
Another possible factor is suggested in Table B-2. Proportional error appears to increase as one tries to predict later and later target years. Bias is higher for projections to 2000 than for projections to earlier years. Perhaps 1995 and 2000 in particular have simply been more difficult to project accurately. However, much of this pattern is explained by projection length, because projections to 1995 and 2000 include more long-duration projections than do projections to earlier years.
Absolute Error
Looking at absolute proportional error (also given in Table B-1 and Table B-2) makes the projections look somewhat less satisfactory. The base-year estimate of population is off, on average across countries and forecasts, by 3 percent in either direction, a projection of 10 years is off on average by 6 percent, a projection of 20 years is off by 11 percent, and a projection of 30 years is off by 15 percent. This pattern is consistent across all forecasts. No substantial improvement from earlier to later forecasts is evident, although the last two forecasts in the 1990s may have been somewhat better. Since only the short-term results of these last two forecasts can be evaluated, and since the criterion data were produced relatively soon after the forecasts and could share similar errors with them, this apparent improvement cannot be confirmed at this date. (It is reexamined below as part of the multivariate analysis.)
Although the absolute errors in these projections may appear large, the projections are a considerable improvement over holding population or population growth rates constant. In comparison with simulated projections that simply keep population constant, these projections have only a third as much absolute proportional error over a projection horizon of 20 years. In comparison with simulated projections that keep previous
TABLE B-1 Error in projected population: Means across countries, by forecast and projection length
|
Projection length (years) |
||||||||
|
Forecast |
0 |
5 |
10 |
15 |
20 |
25 |
30 |
(n) |
|
Proportional error |
||||||||
|
Mean |
0.003 |
0.008 |
0.015 |
0.024 |
0.034 |
0.035 |
0.058 |
1,375 |
|
1972 World Bank |
−0.007 |
— |
0.011 |
— |
0.039 |
— |
0.079 |
113 |
|
1973 U.N. |
−0.006 |
−0.004 |
0.006 |
0.012 |
0.023 |
0.036 |
0.043 |
163 |
|
1980 U.N. |
0.007 |
0.012 |
0.011 |
0.016 |
0.028 |
0.033 |
— |
163 |
|
1983 World Bank |
0.003 |
0.005 |
0.015 |
0.037 |
0.048 |
— |
— |
145 |
|
1984 U.N. |
0.015 |
0.013 |
0.017 |
0.029 |
0.036 |
— |
— |
164 |
|
1987 U.S. Census |
0.004 |
0.009 |
— |
0.037 |
— |
— |
— |
124 |
|
1988 World Bank |
0.005 |
0.008 |
0.019 |
0.023 |
— |
— |
— |
160 |
|
1990 World Bank |
0.001 |
0.004 |
0.014 |
0.018 |
— |
— |
— |
162 |
|
1994 U.N. |
0.004 |
0.015 |
0.022 |
— |
— |
— |
— |
181 |
|
Means for countries with: |
||||||||
|
Census in 1990s |
0.008 |
0.012 |
0.017 |
0.029 |
0.038 |
0.043 |
0.071 |
880 |
|
No 1990s census |
−0.004 |
0.000 |
0.011 |
0.017 |
0.026 |
0.021 |
0.032 |
490 |
|
Absolute proportional error |
||||||||
|
Mean |
0.033 |
0.048 |
0.069 |
0.094 |
0.122 |
0.142 |
0.172 |
1,375 |
|
1972 World Bank |
0.043 |
— |
0.088 |
— |
0.134 |
— |
0.179 |
113 |
|
1973 U.N. |
0.041 |
0.062 |
0.093 |
0.113 |
0.134 |
0.154 |
0.167 |
163 |
|
1980 U.N. |
0.032 |
0.050 |
0.065 |
0.087 |
0.116 |
0.129 |
— |
163 |
|
1983 World Bank |
0.034 |
0.051 |
0.075 |
0.103 |
0.123 |
— |
— |
145 |
|
1984 U.N. |
0.036 |
0.046 |
0.067 |
0.092 |
0.107 |
— |
— |
164 |
|
1987 U.S. Census |
0.047 |
0.065 |
— |
0.112 |
— |
— |
— |
124 |
|
1988 World Bank |
0.032 |
0.047 |
0.070 |
0.083 |
— |
— |
— |
160 |
|
1990 World Bank |
0.027 |
0.040 |
0.062 |
0.072 |
— |
— |
— |
162 |
|
1994 U.N. |
0.015 |
0.033 |
0.041 |
— |
— |
— |
— |
181 |
|
Means for countries with: |
||||||||
|
Census in 1990s |
0.030 |
0.043 |
0.061 |
0.086 |
0.109 |
0.123 |
0.152 |
880 |
|
No 1990s census |
0.039 |
0.058 |
0.084 |
0.108 |
0.147 |
0.178 |
0.213 |
490 |
|
Means for simulated projections with: |
||||||||
|
Constant population |
0.000 |
0.092 |
0.174 |
0.244 |
0.306 |
0.362 |
0.410 |
5,564 |
|
Constant 5-year growth rate |
0.000 |
0.026 |
0.057 |
0.094 |
0.145 |
0.189 |
0.226 |
4,494 |
|
Constant 10-year growth rate |
0.000 |
0.028 |
0.059 |
0.097 |
0.144 |
0.177 |
— |
3,210 |
|
— No data. Note: Year 0 is the base year for the forecast, taken to be the year divisible by five preceding the date of the forecast. Number of cases is given for this year and declines for longer projections. The mean rows pool all countries from all forecasts. The simulations attempt to project population, either keeping it constant or using the preceding population growth rate, by country to the years 1975-2000. The simulations use 1998 estimates of population or growth rate as of the base year, therefore assuming no base error, and should properly be compared with adjusted error measures in Table B-3. |
||||||||
TABLE B-2 Error in projected population by target year: Means across countries and forecasts
|
Target year |
Proportional error |
Absolute proportional error |
(n) |
|
1975 |
−0.004 |
0.062 |
163 |
|
1980 |
0.009 |
0.076 |
439 |
|
1985 |
0.010 |
0.069 |
635 |
|
1990 |
0.016 |
0.080 |
1,194 |
|
1995 |
0.025 |
0.089 |
1,138 |
|
2000 |
0.036 |
0.109 |
1,375 |
growth rates constant, these projections have only two-thirds as much absolute error. (The “proportionate reduction in error” [Tayman and Swanson, 1996] in the latter case is therefore around 35 percent. These comparisons require adjustments for base population error, which are discussed below. See Appendix E for some explanation of similar simulated projections.)
Countries with a recent census, and therefore presumably better data, can be contrasted with countries with no recent census (Figure B-1). Projections actually appear less biased without a recent census, as if fewer “inconvenient” real data mean fewer revisions in subsequent forecasts. However, projections for these countries also have greater variability around subsequent estimates, producing larger absolute errors. This contrast indicates that a focus on countries with good criterion data may lead to overestimating the accuracy of projections. The analyses to follow, therefore, do not distinguish between countries with and without a recent census.
Comparisons across agencies cannot safely be made from these results. Only U.N. data are available as criteria. Using these data as criteria for a different agency's projections, rather than the other agency 's own current estimates, could produce apparent error that is actually disagreement between agencies about historical demographic trends. For instance, the mean base absolute proportional error in the 1983 World Bank forecast, in Table B-1, is 0.034. If the base estimates had been compared not with 1998 U.N. estimates but with essentially contemporaneous estimates used in the 1984 U.N. forecast, the mean absolute proportional error would still have been of comparable size, at 0.026. Much of the apparent error in this case, therefore, could conceivably be due to disagreements between agencies. Estimates of demographic trends made more recently, in 1998 or 1999, conceivably differ less across agencies, but one obviously needs to be cautious in making cross-agency comparisons.
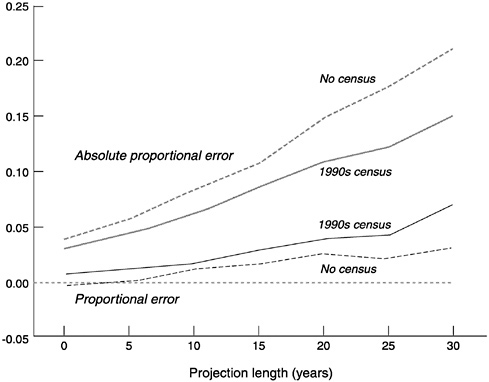
FIGURE B-1 Proportional error and absolute proportional error by existence of a recent census and projection length.
Some Sources of Error
The variability in country projections is demonstrated even more clearly in Figure B-2, which gives percentiles of the distribution across countries. Positive bias in the base population is confirmed as more serious than negative bias. In 10-year projections, 8 out of 10 countries are within ± 10 percent of the currently estimated population total. But in 30-year projections, 1 out of 10 is more than 30 percent too high, and another 1 out of 10 is more than 20 percent too low. Specifically among countries without a 1990s census (not distinguished in the figure), the range of error is wider, so that, to encompass 95 percent of the distribution in a 30-year projection, one would have to go from 100 percent above to 70 percent below the criterion estimate.
The countries with large errors are sometimes small countries to which little demographic attention has been paid but sometimes also large and important countries with insufficient data. Large errors have occurred for various small countries with poor base population estimates, such as
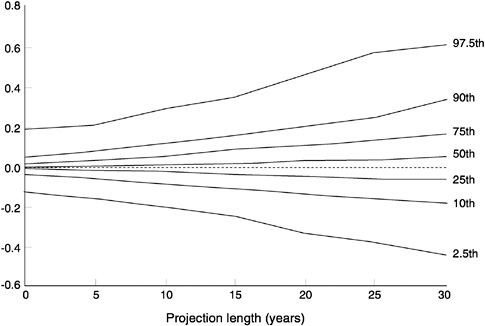
FIGURE B-2 Proportional error by projection length: Percentiles for all countries.
the Western Sahara, the Netherlands Antilles, and Djibouti. But large base errors have also occurred for such large and important countries as Nigeria and Saudi Arabia. Most forecasts include between five and eight countries in which the base population estimate is off by at least 20 percent (plus or minus), except for the two most recent forecasts, which may have improved slightly.
Another important explanation for projection error is unexpected events that have substantial demographic consequences. Without a precise account of the demographic futures envisioned at the time a projection was made, one cannot determine which events were indeed unexpected. As a rough guide, however, one can look at sharp turning points in actual population growth, such as those illustrated for five countries in Figure B-3. Bosnia-Herzegovina, Lebanon, and Liberia experienced civil wars (with some external participation), Kuwait was invaded, and Albania went through social upheaval and a temporary collapse of civil order. Their population trends reflect these upheavals.
Demographic upheavals of this sort, or demographic quakes, might be identified from sharp increases or decreases in the annual population growth rate, of at least 2.5 percentage points from one 5-year period to the next. (This quantity is equal to twice the standard deviation for such period-to-period growth-rate changes.) Such quakes affected two dozen
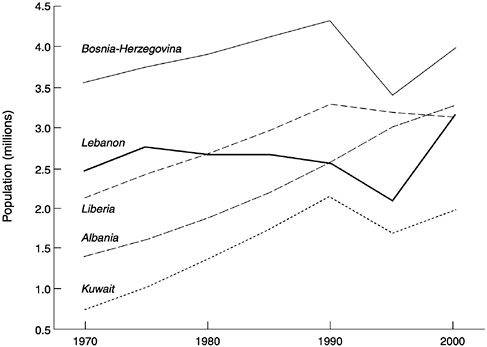
FIGURE B-3 Population trends in five countries experiencing demographic quakes, 1970-2000.
countries between 1970 and 2000, according to the 1998 U.N. estimates. Initial sharp falls in growth rate are more common, by more than two to one, than initial sharp increases. However, sharp falls tend to be followed by sharp increases, and vice versa, so that the impact of a demographic quake on the long-term growth trend is indeterminate.
Countries with smaller tremors—changes in growth rate of at least 1.25 but less than 2.5 percentage points between 1970 and 2000—are about equal in number to those hit by demographic quakes but are more nearly balanced between initial negative and initial positive tremors.
Past projections for countries hit by such quakes, at any point in the 30-year period under investigation, are not on average any more biased than projections for countries that did not experience quakes (Figure B-4) and may actually be slightly less biased in the long term. However, the absolute proportional error in projections for these countries is substantially larger than for other countries—two to three times as high. Since quake-hit countries are relatively few, eliminating them affects overall average absolute proportional error only slightly though consistently, reducing it by 1-2 percentage points across projection lengths.
Regional variation produces smaller but also important variation in
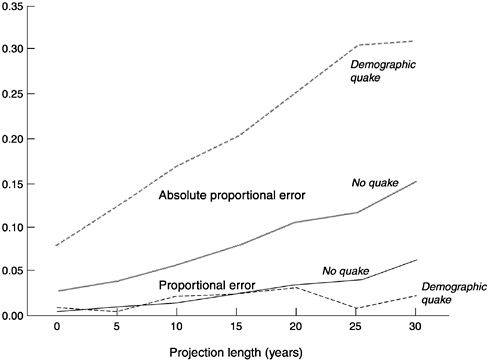
FIGURE B-4 Proportional error and absolute proportional error by the occurrence of demographic quakes and projection length.
projection error. Population appears to have been overprojected for four of six regions, especially for Latin America and the Caribbean (Figure B-5). The exceptions are Sub-Saharan Africa, underprojected in the forecasts from the 1970s, and the Middle East and North Africa, underprojected in all the projections except the 1972 World Bank forecast. In contrast, absolute proportional error (Figure B-6) appears to have been greater for the Middle East and North Africa than for the other regions. For the industrial regions of Europe and for the United States, Australia, and Japan, absolute proportional error is smaller than for the developing regions.
Adjustments and Other Measures
Adjusting error measures for unexpected events is difficult because the directional impact is indeterminate. However, adjusting error measures for base error (which averages 3 percent) is possible. Table B-3 shows how results would change if the forecasts had begun with correct base-year estimates. The adjustment involves only a change in the base
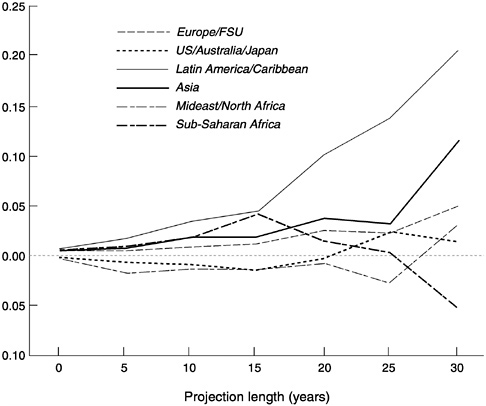
FIGURE B-5 Proportional error by region.
year population total, not in the age structure. The adjusted measure may be expressed as
where 0 is the base year.
The adjustment reduces proportional error and absolute proportional error, but much more for shorter projections than for longer ones. For 5-year projections, the reduction in mean absolute error is 50 percent or more, and this is fairly consistent across forecasts. For 10-year projections, the reduction is only 30 percent, and for 25-year projections, the reduction is down to 10 percent. For individual countries, of course, correcting the base-year estimate can make the projections actually look worse, which happens about a third of the time.
Another way to adjust for base-year error is to compare projected with actual population growth rates. Stoto (1983) suggested the indicator ∆r:
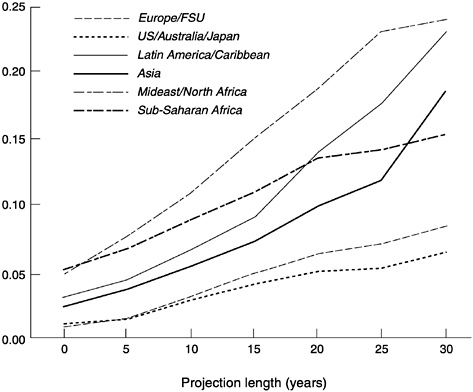
FIGURE B-6 Absolute proportional error by region.
where r is the annual growth rate over the entire period from base year 0 to year t. Levels of this indicator (also in Table B-3) roughly correspond to the adjusted proportional errors but involve a different metric.
These coefficients contrast in two important ways with those Stoto estimated for the United States and for various aggregated countries. First, where Stoto found a mix of positive and negative growth rate errors, these ∆r coefficients are uniformly positive. This confirms that growth has been overprojected in most of these forecasts, even when base population error is taken into account. Second, Stoto found for earlier U.N. projections—as Keyfitz (1981) did before him—that growth rate error was fairly constant over time. Part of the reason for this is that the growth rates evaluated are cumulative, with growth rates for longer periods incorporating the rates for shorter periods within them. However, the current data still show a consistent increase in error, even within each forecast, with projection length.
TABLE B-3 Alternative proportional-error measures adjusted for erroneous base estimates: Means across countries and forecasts, by projection length
|
Projection length (years) |
|||||||
|
Measure |
5 |
10 |
15 |
20 |
25 |
30 |
(n) |
|
Proportional error adjusted for erroneous base population |
0.003 |
0.011 |
0.019 |
0.030 |
0.032 |
0.061 |
1,375 |
|
Absolute adjusted proportional error |
0.024 |
0.050 |
0.075 |
0.104 |
0.126 |
0.156 |
1,375 |
|
Percentage error in growth rate (∆r) |
0.045 |
0.074 |
0.083 |
0.089 |
0.054 |
0.120 |
1,375 |
All the forecasts examined involve standard cohort-component demographic projections. One alternative is simultaneous equation models, such as the one Wheeler (1984) used to produce projections for eight large developing countries, covering a third of world population. Sanderson (1998) argues that this work is more accurate than the 1978 U.N. forecast. Because Wheeler's forecast involved so few countries, one should consider whether any comparisons are statistically significant. Even with only eight cases, the bias in Wheeler's forecast is significantly smaller (i.e., more negative) than the bias in the 1978 U.N. forecast, using t-tests and a nonparametric test (Wilcoxon's matched pairs signed ranks test). However, similar statistical tests show that mean absolute proportional error does not differ between the forecasts over any projection horizon. With only eight cases, a general statement cannot be made about the comparative accuracy of this alternative methodology.
ACCURACY OF PROJECTED COMPONENT RATES
Component rates can be examined in the same manner as population, comparing projected rates from a specific forecast for periods up to 1995-2000 with rates reported by the U.N. in 1998. In these comparisons, however, raw deviations rather than proportional deviations are calculated, since component rates are already expressed in proportion to population.
Fertility
Table B-4 shows the consistency between projected component rates and current estimates. In most cases, projected total fertility is slightly higher than the current estimate: by 0.1 children in 5-year projections, 0.2 children in 10-year projections, and 0.3 children in 20-year projections. The absolute error in projected total fertility also rises with the length of the projection. In a 5-year projection, total fertility is off in either direction by 0.4 children, but after 20 years, total fertility is off by about 0.8 children. The equivalent absolute error in the crude birth rate across all projection lengths, calculated from reported crude birth rates, is 3.4 per thousand. This amount is the average distortion in the population growth rate, in one direction or the other, produced by fertility error.
Base error, where total fertility and the other component rates are concerned, is understood as error in the first projection period, the period within which the projection is usually constructed. Across countries, the base estimate of total fertility is only slightly biased upward. However, this bias appears to be increasing for later forecasts. In contrast, absolute error for the base estimate is relatively large even in the base period, at over 0.3 children, but appears to be decreasing rather than increasing with more recent forecasts.
Regional comparisons indicate that projection quality has varied. For
TABLE B-4 Error in projected component rates: Means across countries and forecasts, by projection length
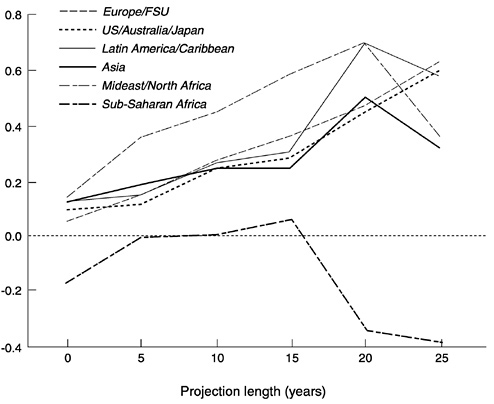
FIGURE B-7 Error in projected total fertility, by region and projection length.
five out of six regions, and particularly for the Middle East and North Africa, projected total fertility has been too high (Figure B-7). For Sub-Saharan Africa, projected fertility has been about right, in projections up to 15 years, or too low, in longer projections. Absolute error has been higher for developing than for industrial regions, and has been particularly high for the Middle East and North Africa. Regional variation in absolute error is analyzed in more detail below.
Mortality
For life expectancy, short-term projections—for 5 years, but longer in some forecasts—appear to be biased downward, whereas longer-term projections are biased upward. The upward bias may be increasing in recent forecasts. Absolute error in projected life expectancy, in contrast, shows a clear increase with projection length, growing from 2.3 years of life expectancy in 5-year projections to 4.0 years of life expectancy in 20-year projections. The rate of increase in absolute error with projection
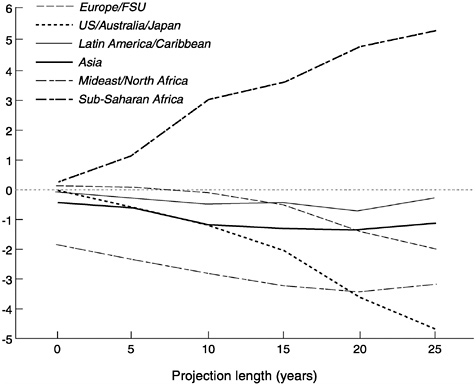
FIGURE B-8 Error in projected life expectancy, by region and projection length.
length is about equal to the rate of increase for absolute error in total fertility. Absolute error in life expectancy appears to show some decline in the most recent forecasts. On average across projection lengths, the equivalent absolute error in the crude death rate is 1.9 per thousand, meaning that mortality error has on average half the effect on population growth of fertility error.
Base life expectancy estimates are only slightly biased downward (except for the 1994 U.N. forecast), but absolute error is relatively large, at 1.8 years on average. Absolute base error appears clearly smaller in more recent forecasts, down to 1.3 years for the 1994 U.N. forecast.
For five out of six regions, projected life expectancy tends to be too low. For Sub-Saharan Africa, it has been too high (Figure B-8). Sub-Saharan Africa is also the region with the greatest absolute error in projected life expectancy, followed by the Middle East and North Africa. Projections for industrial regions tend to be somewhat more precise, particularly in the short term.
Projected infant mortality is reported for fewer forecasts but was also examined. Since life expectancy is underprojected in short projections
and overprojected in longer ones, one would expect the reverse for infant mortality. The trend is indeed in this direction, with upward bias in 5-year projections of 2.5 per thousand, reduced in 15-year projections to 1.3 per thousand. Absolute error in infant mortality is substantially larger than any upward or downward bias. However, in longer projections, it rises only slightly, implying that the error in mortality rates at older ages must rise more substantially.
Migration
Unlike either total fertility or life expectancy, projected net migration rates can be either positive or negative. Therefore, we can look at whether the direction of net migration was properly projected. What we see is not reassuring. In 38 percent of the possible comparisons, the projected net migration rate had the opposite sign from the current estimate of this rate. Even when it had the same sign, it was not necessarily close to the current estimate, two-thirds of the time being at least double the current estimate or not more than half of it. However, net migration rates are often small relative to crude birth and death rates and are generally close to zero, so while the errors in the rates may be proportionally large, the resulting error in growth rates is usually small.
Migration error differs from fertility and mortality error in that it does not increase with projection length. Table B-5 shows instead how it varies by target year: somewhat irregularly, the bias being sometimes positive and sometimes negative. Absolute error in the net migration rate ranges from 3.7 to 5.1 per thousand, except for the last period, with no obvious trend. Across all projection lengths, the average is 3.9 per thousand, which is slightly greater error than there is in the crude birth rate and double the error in the crude death rate. Base error in migration resembles projection error in migration, varying by period in roughly the same pattern. Absolute base error does appear slightly lower for the last few periods.
TABLE B-5 Error in net migration rate (per 1,000): Means across countries and forecasts, by target period
|
Target period |
||||||
|
Indicator |
1975-1980 |
1980-1985 |
1985-1990 |
1990-1995 |
1995-2000 |
(n) |
|
Error |
0.99 |
−0.13 |
0.58 |
0.66 |
−0.74 |
1,075 |
|
Absolute error |
4.28 |
3.79 |
3.74 |
5.10 |
2.97 |
1,075 |
With the majority of migration errors being small in comparison with population growth rates, the average size of error overall, as well as the irregularity in error across periods, is connected with demographic quakes. Such events can produce net migration rates a hundred times or more typical rates. The substantial effect this has is indicated by the fact that mean absolute error is five times as large in countries that have experienced such quakes (at 13.5 per thousand) than in other countries (2.6 per thousand). By region, variation in error is also affected by quakes. Figure B-9 shows error by region and period projected, demonstrating considerable irregularity probably tied to specific events in particular countries. Abstracting from the irregularity, the figure suggests that net migration into industrial countries has been slightly underprojected overall. The error for developing countries is much more difficult to characterize, but some overall underprojection of net emigration is possible.
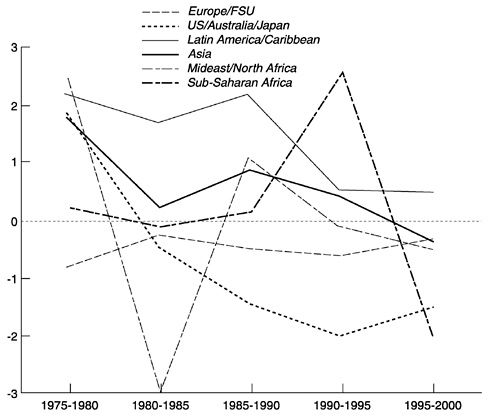
FIGURE B-9 Error in projected net migration rate, by region and target period.
Projected component rates, therefore, show biases in different and sometimes but not always offsetting directions. Fertility and mortality are both overprojected, with the error in fertility (if one compares crude rate errors) being larger on average. The error in migration is difficult to characterize, possibly because much of the error is tied to demographic quakes. Absolute error in projected component rates increases with projection length for total fertility and life expectancy, but not that strongly for infant mortality, and not at all where migration is concerned. Base error appears to be important for all the component rates. By region, the Middle East and North Africa and Sub-Saharan Africa appear to stand out from the rest and to contrast sharply. For the Middle East and North Africa, fertility and mortality are both overprojected; for Sub-Saharan Africa, both are underprojected.
PREDICTING AND ACCOUNTING FOR ERROR
If one could determine for what types of countries or in what circumstances one should expect greater error in a population projection, one might be able to give greater credence to some projections, and to treat other projections with more caution. Predicting error in this manner is the first task in this section. The second task is to account for error. This involves determining why error occurs, i.e., what specific failings in a projection are responsible for greater error. These failings must involve mistaken base estimates or errors in projected component trends, which, aside from computational errors, must between them account for practically all the error in a projection.
Prediction of Error
In predicting error, absolute proportional error is used as the dependent variable, transformed for convenience by taking its cube root. This normalizes the distribution to the extent possible, largely eliminates kurtosis, and has the useful result of reducing the influence of extreme values. The estimated equation will be, in effect,
|pe|1/3 = a + bX
where X is a vector of predictors, and the equation is estimated across projections of all lengths for all countries in all forecasts.
Table B-6 reports three parallel analyses of covariance. These three analyses differ in only one respect. They include alternative pairs of three related variables: projection length, the target year projected, and the specific forecast. These three factors cannot all be analyzed simultaneously because they are redundant, but they can be analyzed pairwise. The other variables in the analysis have all already been noted. Absolute proportional error in the base population is, like the dependent variable, a cube root, and is introduced as a covariate, together with a squared term. The remaining variables are introduced as main effects into the analysis: whether a country has a 1990s census, whether it has experienced a demographic quake, initial population dichotomized at 1 million, initial total fertility dichotomized at 4.5 children, and region (which effectively incorporates the industrial-developing country distinction). Interactions are not analyzed because the number of empty cells makes this infeasible.
TABLE B-6 Analyses of covariance for absolute proportional error in projected population
The important finding from comparing the three analyses is the much greater importance of projection length in predicting absolute error than either year projected or forecast. Forecast still has a significant, though much smaller effect, whereas year projected is significant only when paired with forecast.
The effect of base error, as a covariate, is strong and roughly comparable to that of projection length. The squared term is also significant. Of the remaining main effects, a demographic quake, initial population, and region are significant; having a recent census and initial total fertility are not.
These effects are interpretable from Table B-7, which shows unadjusted deviations from the grand mean by levels of each main effect, as well as deviations adjusted for covariates and the other main effects. (These are all converted from roots to absolute percentage errors to make them directly interpretable. Because of the conversion process and missing data, the unadjusted deviations may not correspond exactly to statistics in earlier tables.) The strongest adjusted effect, excluding the covariates, is that of projection length. Across categories of projection length, absolute error increases consistently. The possible adjusted effect of forecast is apparent mainly for the latest forecasts, which may be slightly better than the earlier (although as noted above, they can be evaluated only for short-term results).
The adjusted effects of demographic quakes and initial population size are as expected and do not vary given the other variables controlled: quakes increase absolute error substantially, small population size increases it somewhat less. By region, this multivariate exercise confirms the patterns shown earlier: absolute error is lower in industrial countries and substantially higher for the Middle East and North Africa.
Projection error can therefore be expected to be greater when base estimates are poorer; for projections of greater length; possibly in earlier rather than in the latest forecasts; when demographic quakes upset the population growth trend; for smaller populations; for developing coun
TABLE B-7 Deviations from the grand mean for absolute percentage error in projected population
|
Adjusted deviations |
|||||
|
Grand mean = 5.49 |
Unadjusted deviations |
(1) |
(2) |
(3) |
(n) |
|
Projection length |
|||||
|
5 years |
−2.74 |
−2.81 |
−2.58 |
— |
1,256 |
|
10 years |
−1.09 |
−1.01 |
−0.81 |
— |
1,246 |
|
15 years |
1.06 |
1.09 |
0.90 |
— |
1,076 |
|
20 years |
3.29 |
3.30 |
2.86 |
— |
745 |
|
25 years |
4.52 |
4.56 |
4.23 |
— |
324 |
|
30 years |
6.77 |
6.58 |
5.26 |
— |
275 |
|
Year projected |
|||||
|
1975 |
−2.05 |
0.65 |
— |
−3.91 |
162 |
|
1980 |
−1.08 |
0.56 |
— |
−2.93 |
437 |
|
1985 |
−1.38 |
0.16 |
— |
−2.11 |
632 |
|
1990 |
−0.51 |
0.12 |
— |
−0.66 |
1,189 |
|
1995 |
0.05 |
−0.02 |
— |
1.40 |
1,133 |
|
2000 |
1.97 |
−0.40 |
— |
2.90 |
1,369 |
|
Forecast |
|||||
|
1972 World Bank |
3.96 |
— |
0.88 |
4.13 |
339 |
|
1973 U.N. |
1.98 |
— |
0.14 |
3.21 |
972 |
|
1980 U.N. |
0.33 |
— |
−0.13 |
1.10 |
810 |
|
1983 World Bank |
0.37 |
— |
0.69 |
0.34 |
580 |
|
1984 U.N. |
−0.50 |
— |
−0.26 |
−0.58 |
652 |
|
1987 U.S. Census |
0.74 |
— |
0.68 |
−1.29 |
246 |
|
1988 World Bank |
−0.90 |
— |
0.14 |
−1.73 |
480 |
|
1990 World Bank |
−1.85 |
— |
−0.66 |
−2.33 |
483 |
|
1994 U.N. |
−3.46 |
— |
−1.09 |
−3.67 |
360 |
|
Recent census |
|||||
|
Census in 1990s |
−0.48 |
0.07 |
0.07 |
0.07 |
3,174 |
|
No 1990s census |
0.94 |
−0.13 |
−0.12 |
−0.12 |
1,748 |
|
Demographic quake |
|||||
|
No quake |
−0.78 |
−0.46 |
−0.46 |
−0.46 |
4,329 |
|
Quake |
8.35 |
4.20 |
4.20 |
4.20 |
593 |
|
Initial population |
|||||
|
Population <1m |
3.03 |
1.35 |
1.41 |
1.41 |
1,047 |
|
Population 1m+ |
−0.67 |
−0.33 |
−0.34 |
−0.34 |
3,875 |
|
Initial fertility |
|||||
|
Total fertility <4.5 |
−1.68 |
−0.14 |
−0.16 |
−0.16 |
2,223 |
|
Total fertility 4.5+ |
1.71 |
0.12 |
0.14 |
0.14 |
2,699 |
|
Region |
|||||
|
Europe/FSU |
−2.83 |
−1.09 |
−1.08 |
−1.08 |
818 |
|
U.S./Australia/Japan |
−2.83 |
−1.46 |
−1.45 |
−1.45 |
152 |
|
Latin America/Carib. |
0.37 |
0.67 |
0.69 |
0.69 |
945 |
|
Asia/Oceania |
−0.91 |
−0.47 |
−0.46 |
−0.46 |
911 |
|
Mideast/N. Africa |
3.77 |
1.93 |
1.89 |
1.89 |
671 |
|
Sub-Saharan Africa |
1.41 |
−0.09 |
−0.10 |
−0.10 |
1,425 |
tries; and particularly, in the last few decades, for the Middle East and North Africa.
— Excluded from this regression.
Note: Adjusted deviations are given from the three analyses of covariance in the preceding table. The dependent variable was the cube root of absolute proportional error, but the grand mean and deviations are converted to absolute percentage error for convenience.
Absolute proportional error in base population estimates was analyzed separately to see if similar factors accounted for it. Some factors were not included in this analysis of variance, such as projection length, which would always be zero. Adjusted deviations for all the variables in the analysis are shown in Table B-8; all effects are significant at 0.001, except for initial population, whose significance level is 0.01. The results are not identical to those for proportional error in projected population. Which base year is estimated is somewhat more important as a determinant of error than which year is projected, in the preceding analysis. Later years are not necessarily more accurately estimated, however. Estimates for 1990 appear to be the best, but estimates for 1985 are among the worst. Initial population size still has an effect on accuracy, but a smaller one compared to its effect on projected population. Initial fertility level has a
larger effect. By region, the pattern is similar to that for projected population, except that population estimates are not quite as bad for the Middle East and North Africa and clearly worse for Sub-Saharan Africa.
What appears to characterize error in base population estimates, in contrast to error in projected population, is a greater influence of the specific period estimated, the mid-1980s apparently having been a difficult period during which to make current population estimates. In addition, population estimates appear to be particularly difficult for high-fertility Sub-Saharan countries.
These analyses indicate where errors are more likely, not why they occur. Given the way cohort-component projections are made, projection errors must be due to misspecification in the base estimates or to misspecification of subsequent component rates. Further investigation of these “structural” factors is warranted following these analyses, which essentially involve reduced forms. Component-rate errors have already
TABLE B-8 Deviations from the grand mean for absolute percentage error in base population
|
Adjusted deviations |
||||
|
Grand mean = 1.21 |
Unadjusted deviations |
(1) |
(2) |
(n) |
|
Base year |
||||
|
1970 |
0.71 |
0.51 |
— |
276 |
|
1975 |
−0.21 |
−0.23 |
— |
163 |
|
1980 |
−0.04 |
−0.02 |
— |
308 |
|
1985 |
0.31 |
0.26 |
— |
446 |
|
1990 |
−0.92 |
−0.77 |
— |
181 |
|
Forecast |
||||
|
1972 World Bank |
1.20 |
— |
0.94 |
113 |
|
1973 U.N. |
0.41 |
— |
0.25 |
163 |
|
1980 U.N. |
−0.21 |
— |
−0.23 |
163 |
|
1983 World Bank |
0.23 |
— |
0.28 |
145 |
|
1984 U.N. |
−0.25 |
— |
−0.25 |
163 |
|
1987 U.S. Census |
1.47 |
— |
0.91 |
124 |
|
1988 World Bank |
0.21 |
— |
0.30 |
160 |
|
1990 World Bank |
−0.23 |
— |
−0.16 |
162 |
|
1994 U.N. |
−0.92 |
— |
−0.77 |
181 |
|
Initial population |
||||
|
Population <1m |
0.47 |
0.38 |
0.42 |
280 |
|
Population 1m+ |
−0.10 |
−0.09 |
−0.09 |
1,094 |
|
Initial fertility |
||||
|
Total fertility <4.5 |
−0.74 |
−0.45 |
−0.46 |
644 |
|
Total fertility 4.5+ |
1.09 |
0.53 |
0.53 |
730 |
|
Region |
||||
|
Europe/FSU |
−1.10 |
−0.90 |
−0.88 |
225 |
|
U.S./Australia/Japan |
−0.80 |
−0.44 |
−0.41 |
41 |
|
Latin America/Carib. |
0.31 |
0.47 |
0.46 |
265 |
|
Asia/Oceania |
−0.31 |
−0.31 |
−0.30 |
250 |
|
Mideast/N. Africa |
0.59 |
0.31 |
0.29 |
192 |
|
Sub–Saharan Africa |
1.31 |
0.69 |
0.66 |
401 |
|
— Excluded from this regression. Note: The dependent variable was the cube root of absolute proportional error, but the grand mean and deviations are converted to absolute percentage error for convenience. |
||||
been estimated and shown to be substantial, and the question now is how they affect error in projected population.
Accounting for Error
To account for error, regressions were run for proportional bias in projected population (not for absolute error), using proportional bias in initial population and bias in total fertility, life expectancy, and net migra-
tion rate as predictors. (One could also use absolute error in crude component rates to partition growth-rate error, but this gives basically similar results that we do not describe.) In these regressions, the signed square root of the bias in population was used, to normalize the distribution to the extent possible. One could include as predictors as many measures of bias in each component rate as there are periods in the projection. However, these measures tend to be highly correlated, so only their mean was used.
Table B-9 shows the regression results, which are given for projections of different lengths, from 5 to 30 years. The bias in projected population is not perfectly predicted, given the use of average errors and the fact that the age structure of the population and the age structure of component rates are not in the equations. Bias in shorter projections is slightly better predicted than bias in longer projections.
Using these regressions, the variance in projection error can be partitioned into that explained uniquely by each factor, as well as that jointly explained. This requires running several regressions leaving out factors one at a time, to determine the marginal contribution that each factor
TABLE B-9 Regressions to account for proportional error in projected population, by projection length

FIGURE B-10 Percent of variance in proportional error in projected population explained by proportional error in base population and error in component rates, by projection length, using alternative migration estimates.
makes. One could similarly determine the joint effect of each pair, triplet, and higher-order combination of variables, but these joint effects are small and do not require much attention.
Figure B-10 illustrates the results. Base population bias is of considerable importance, uniquely accounting in 5-year projections for 55 percent of the variance in projected-population error, and even in long projections of 25 and 30 years, for 12 percent of the variance. Base population error is important not only as the initial value in a projection but also because such errors are generally linked with misestimates of previous and current component rates, which influence the choice of projected rates. In addition, the effect of misprojected component rates depends on the population to which they are applied, and errors can be magnified if this population is misestimated.
The relative contributions to error in projected population of error in fertility, mortality, and migration vary. Fertility error grows in importance with projection length, uniquely accounting for 4 percent of the variance in 5-year projections but for 27 percent of the variance in 30-year projections. Mortality error makes a growing but small contribution,
uniquely accounting at most for 6 percent of the variance. Migration error is more important than fertility and mortality error combined in short projections but hardly increases in importance, so that in long projections its contribution is comparable to that of fertility. In projections of 10 to 30 years, it accounts for between 25 and 32 percent of the variance in error in projected population.
Given that historical migration estimates may not have been closely examined, a separate set of worldwide net migration estimates was used as an alternative criterion against which to measure accuracy, and the results entered into similar regressions as those just described. This alternative set, which covers only two periods, 1980-1985 and 1985-1990, was prepared by Arnold (1989) for the World Bank. The main advantage of these estimates, for current purposes, is that they are not simply residuals given population growth and natural increase. Using this alternative criterion for migration error reduces the effect of migration error somewhat, and also reduces the overall variance explained (see Figure B-10). However, the effect of migration error remains larger, for 5-year and 10-year projections, than the effect of fertility error.
In separate regressions by region, the relative importance of factors varies, but the essential relationships among them generally remain the same. Base population error shows the same initial importance in every region and the same decline in importance with longer projections. It may be initially slightly less important in industrial than in developing regions. Fertility error increases in importance as projections lengthen in every region and may be particularly important in projections for Latin America and the Caribbean and Asia. Migration error is clearly more important than fertility error in the industrial regions and in the Middle East and North Africa, but perhaps slightly less important in the other regions. And mortality error is less important than the other factors in every region, although it may contribute proportionally more to projection error in Asia and Sub-Saharan Africa.
PREDICTING ERROR IN COMPONENT RATES
To complete the picture, we now look at component-rate errors, using analyses of covariance with similar factors to those included earlier in the analysis of population error. Table B-10 summarizes these analyses of error in projected component rates, giving only the F-statistics. Table B-11 summarizes parallel analyses of error in base component rates.
Base error is by far the most important factor producing error in projected total fertility and life expectancy, accounting in both cases for a sixth of the total variance, or half of all the explained variance. It is also a significant factor in projected net migration rates, but in this case, the
TABLE B-10 Summary of analysis of covariance for absolute error in projected component rates: F-statistics
|
Source of variation |
df |
Total fertility |
Life expectancy |
Net migration rate |
|
Covariates |
||||
|
Base error and Base error2 |
2 |
734.83** |
794.72** |
83.09** |
|
Main effects |
||||
|
Projection length |
4 |
39.72** |
16.34** |
0.12 |
|
Year projected |
4 |
6.53** |
5.15** |
11.46** |
|
Recent census |
1 |
15.77** |
6.60* |
0.55 |
|
Demographic quake |
1 |
0.06 |
40.21** |
624.18** |
|
Initial population |
1 |
0.86 |
20.10** |
0.00 |
|
Initial component estimatea |
3 |
29.37** |
14.22** |
7.31** |
|
Region |
5 |
25.56** |
22.34** |
6.16** |
|
* Significant at 0.01. ** Significant at 0.001. aInitial component rates are categorized as follows. Total fertility: 6.5 and higher, 4.5-6.4, 2.5-4.4, or under 2.5. Life expectancy: under 50, 50-59, 60-69, or 70 and higher. Net migration rate: −2 or lower, −1.9 to −0.1, 0 to 1.9, and 2 or higher. |
||||
experience of a demographic quake is substantially more important (accounting for about half the explained variance in migration rates). Demographic quakes are also a source of error for projected life expectancy, but not for total fertility. Because total fertility and life expectancy can generally be projected as fairly smooth progressions, the initial values chosen are critical, and initial error is a major explanation, although not the entire explanation, for incorrect projections. Net migration, however, often does not increase or decrease along a continuous path and is subject to substantial discontinuities.
The effects of projection length appear to reinforce this point. Projection length is responsible for substantial error in total fertility, some error also in life expectancy, but none in net migration. If error in migration comes largely from erratic and unpredictable shifts, this pattern is what one would expect.
The initial (true) levels of total fertility, life expectancy, and net migration contribute importantly to subsequent error (Table B-12). Higher fertility means more births and lower life expectancy means more deaths, in each case leaving greater room for subsequent change and consequently greater scope for projection error. For net migration, similarly, greater error appears where levels are higher, particularly for receiving countries with net rates of 2 per thousand and above.
The effects on component-rate error of several other factors are problematic and not directly interpretable. For instance, total fertility appears
TABLE B-11 Summary of analysis of variance for absolute error in base component rates: F-statistics
|
Source of variation |
df |
Total fertility |
Life expectancy |
Net migration rate |
|
Year projected |
4 |
8.63** |
2.39 |
2.39 |
|
Initial population |
1 |
4.09 |
9.03* |
13.76** |
|
Initial component estimatea |
3 |
9.73** |
12.64** |
21.48** |
|
Region |
5 |
3.31* |
2.50 |
7.22** |
|
*Significant at 0.01. **Significant at 0.001. aInitial component rates are categorized as follows. Total fertility: 6.5 and higher, 4.5-6.4, 2.5-4.4, or under 2.5. Life expectancy: under 50, 50-59, 60-69, or 70 and higher. Net migration rate: −2 or lower, −1.9 to −0.1, 0 to 1.9, and 2 or higher. |
||||
to be better projected, once the other factors in the analysis are controlled, among countries with no recent census, and life expectancy appears to be better projected for populations of fewer than 1 million. Similarly, the effects of forecast and target period may suggest improvements over time in some cases, but not consistently. All these effects are shown in Table B-12 but are not further interpreted.
Given the importance of base error in component rates, we might ask what determines such error. Table B-11 summarizes the analyses of variance, and Table B-12 gives adjusted deviations. Base error appears to be higher if total fertility is initially higher, if life expectancy is initially lower, and if the net migration rate is initially more positive—just as is the case with error in projected component rates. (The effect for migration appears to be much stronger in this case, however.) Life expectancy and net migration also appear to have been more poorly estimated for small countries of under 1 million. Base total fertility, in contrast, has been better estimated in later forecasts and for later periods, as fertility survey data have become increasingly available.
Regional contrasts may now be considered. Figure B-11 shows deviation across regions from mean absolute error in total fertility, for both projected fertility and base fertility. Adjusted deviations are generally smaller than unadjusted deviations, indicating that the multivariate analysis does account for some of the regional variation. For industrial regions, adjusted deviations are substantially closer to zero than unadjusted deviations, suggesting that the greater accuracy of projected fertility for these regions is largely explained with reference to better base fertility estimates and lower initial fertility. The weakness of fertility projections for the Middle East and North Africa, however, is only partly accounted
TABLE B-12 Adjusted deviationsa from mean absolute error in component rates
|
Projected component rates |
Base component rates |
||||||
|
Source of variation |
Total fertility |
Life expectancy |
Net migration |
Total fertility |
Life expectancy |
Net migration |
|
|
(Mean absolute error) |
(0.57) |
(3.01) |
(3.87) |
(0.34) |
(1.77) |
(2.24) |
|
|
Projection length |
|||||||
|
5 years |
−0.12 |
−0.49 |
−0.01 |
— |
— |
— |
|
|
10 years |
−0.01 |
0.01 |
−0.08 |
— |
— |
— |
|
|
15 years |
0.07 |
0.28 |
0.14 |
— |
— |
— |
|
|
20 years |
0.18 |
0.76 |
−0.08 |
— |
— |
— |
|
|
25 years |
0.22 |
1.01 |
0.19 |
— |
— |
— |
|
|
Year projected/base year |
|||||||
|
1975 |
0.08 |
−0.24 |
0.59 |
0.09 |
0.00 |
−1.04 |
|
|
1980 |
0.07 |
−0.40 |
−0.17 |
−0.03 |
0.11 |
0.60 |
|
|
1985 |
−0.01 |
−0.33 |
−0.12 |
0.03 |
0.25 |
−0.10 |
|
|
1990 |
0.02 |
0.16 |
1.19 |
−0.03 |
−0.09 |
0.01 |
|
|
1995 |
−0.05 |
0.19 |
−0.96 |
−0.10 |
−0.33 |
1.12 |
|
|
Forecastb |
|||||||
|
1972 World Bank |
0.20 |
— |
— |
0.14 |
— |
−1.11 |
|
|
1973 U.N. |
0.03 |
−0.41 |
0.23 |
0.06 |
0.00 |
−0.98 |
|
|
1980 U.N. |
−0.04 |
0.00 |
−0.12 |
−0.03 |
0.11 |
0.60 |
|
|
1983 World Bank |
0.02 |
0.05 |
1.30 |
0.08 |
0.55 |
−0.47 |
|
|
1984 U.N. |
−0.05 |
−0.02 |
−0.33 |
−0.02 |
−0.04 |
0.25 |
|
|
1988 World Bank |
−0.04 |
0.60 |
−0.16 |
0.01 |
0.13 |
−0.23 |
|
|
1990 World Bank |
−0.03 |
0.37 |
−0.53 |
−0.07 |
−0.31 |
0.23 |
|
|
1994 U.N. |
−0.06 |
−0.18 |
−1.61 |
−0.10 |
−0.33 |
1.12 |
|
|
Recent census |
||||||
|
Census in 1990s |
0.02 |
0.09 |
0.07 |
— |
— |
— |
|
No 1990s census |
−0.05 |
−0.19 |
−0.14 |
— |
— |
— |
|
Demographic quake |
||||||
|
No quake |
0.00 |
−0.12 |
−1.19 |
— |
— |
— |
|
Quake |
−0.01 |
0.98 |
9.95 |
— |
— |
— |
|
Initial population |
||||||
|
Population <1m |
−0.02 |
−0.51 |
0.00 |
0.05 |
0.44 |
1.89 |
|
Population 1m+ |
0.00 |
0.11 |
0.00 |
−0.01 |
−0.09 |
−0.39 |
|
Initial component ratesc |
||||||
|
Traditional |
0.07 |
0.00 |
0.22 |
0.05 |
0.59 |
1.04 |
|
Posttraditional |
0.12 |
0.70 |
−1.02 |
0.10 |
0.72 |
−1.24 |
|
Premodern |
−0.08 |
−0.24 |
0.18 |
−0.05 |
−0.01 |
−1.15 |
|
Modern |
−0.14 |
−0.26 |
0.73 |
−0.11 |
−0.82 |
1.70 |
|
Region |
||||||
|
Europe/FSU |
0.06 |
−0.27 |
−0.17 |
−0.13 |
−0.39 |
−0.30 |
|
U.S./Australia/Japan |
−0.03 |
0.08 |
−0.79 |
−0.10 |
−0.54 |
−0.48 |
|
Latin America/Carib. |
−0.06 |
−0.56 |
−0.07 |
−0.01 |
−0.09 |
0.04 |
|
Asia/Oceania |
−0.01 |
−0.69 |
−1.22 |
0.03 |
0.03 |
−0.46 |
|
Mideast/N. Africa |
0.20 |
−0.14 |
1.14 |
0.01 |
0.49 |
3.07 |
|
Sub–Saharan Africa |
−0.08 |
0.96 |
0.45 |
0.08 |
0.15 |
−0.94 |
|
—Not applicable or no data. aDeviations are adjusted for the effects of the other sources of variation (and, in the case of projected rates, for the effects of base error), through analyses of variance or covariance summarized in the two preceding tables. bThe results for Forecast come from a separate analysis of variance or covariance in which Year projected or Base year is left out. cInitial component rates are categorized from “traditional” to “modern” as follows. Total fertility: 6.5 and higher, 4.5-6.4, 2.5-4.4, or under 2.5. Life expectancy: under 50, 50-59, 60-69, or 70 and higher. Net migration rate: −2 or lower, −1.9 to −0.1, 0 to 1.9, and 2 or higher. |
||||||
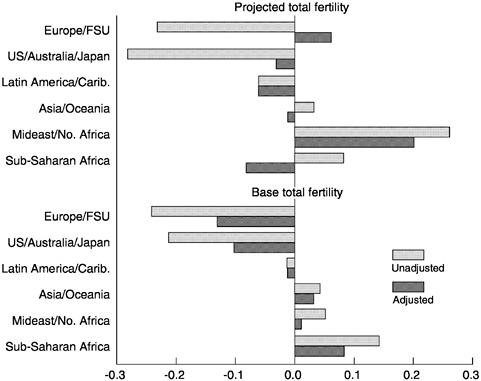
FIGURE B-11 Deviations from mean absolute error in projected and base total fertility, by region (unadjusted and adjusted for other effects).
for, so that regional contrasts are still significant. Where base fertility error is concerned, the regional contrasts are moderate but remain as they were: fertility is better estimated for industrial regions, more poorly estimated particularly for Sub-Saharan Africa.
A substantial portion of the regional contrasts in error in life expectancy, similarly, is explained in the multivariate analysis (Figure B-12). The greater accuracy of industrial-region projections no longer appears once base estimates and initial life expectancy, among other variables, are controlled. Somewhat greater accuracy still appears for projected life expectancy in Asia and Latin America and the Caribbean relative to Sub-Saharan Africa. Where base life expectancy estimates are concerned, the contrasts are muted and no longer significant.
Where errors in migration are concerned, some regional contrasts are explained but others are not (Figure B-13). The relatively large error in projected net migration rates for the Middle East and North Africa is substantially reduced, presumably when demographic quakes are taken
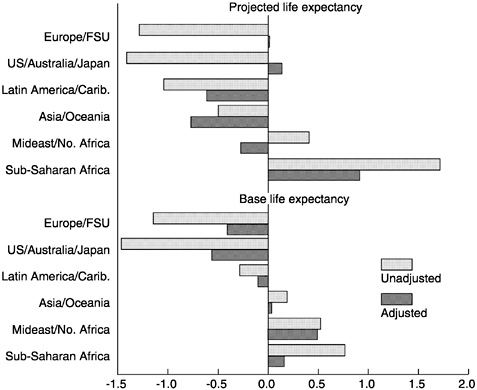
FIGURE B-12 Deviations from mean absolute error in projected and base life expectancy, by region (unadjusted and adjusted for other effects).
into account. Similarly, some of the error for Sub-Saharan Africa is explained, and the advantages of Europe and Latin America and the Caribbean are substantially reduced. However, the error in base migration estimates, especially for the Middle East and North Africa, remains largely unexplained, given that demographic quakes were not included in analyzing base error.
ERROR IN WORLD PROJECTIONS
The discussion to this point has focused on country projections, but world projections deserve separate scrutiny. Table B-13 shows world proportional error, including only forecasts that separately report total world population. The reported total may differ from a total calculated across countries because it may include some countries not reported on and because some countries reported on cannot be matched with criterion data.
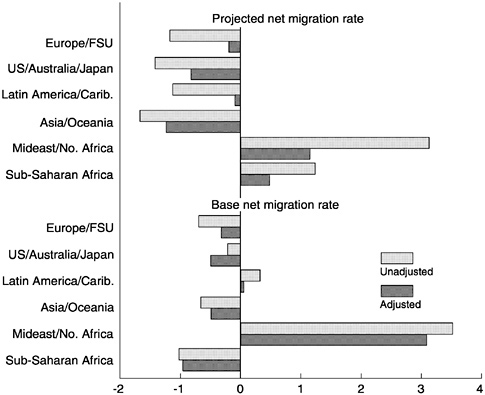
FIGURE B-13 Deviations from mean absolute error in projected and base net migration rate, by region (unadjusted and adjusted for other effects).
World projections are less biased than the average country projection. This is so because proportional error is smaller than average for large countries (countries of 10 million people or more), which hold more than 90 percent of the world's population, although they are fewer than half of all countries. World projections are generally biased upward, but unlike the average country projection sometimes show some downward bias, particularly in short-term world projections from earlier forecasts (see Keilman, 1998).
Absolute proportional error in world projections, in contrast, is not an average of country errors but depends partly on whether these errors are offset, going in opposite directions. Migration errors should offset each other; the large effects in some country projections should cancel out when countries are combined, provided that net migrants total zero across countries, as they should. Fertility errors (and mortality errors) may offset each other too, if for instance they are randomly distributed between positive and negative errors. Because of such offsets, absolute propor
TABLE B-13 Proportional error in projected world population, by projection length and forecast
|
Projection length (years) |
|||||||
|
Forecast |
0 |
5 |
10 |
15 |
20 |
25 |
30 |
|
Mean |
−0.003 |
−0.002 |
0.003 |
0.008 |
0.009 |
0.014 |
0.033 |
|
1973 U.N. |
−0.023 |
−0.026 |
−0.015 |
−0.004 |
0.003 |
0.017 |
0.033 |
|
1980 U.N. |
−0.002 |
−0.002 |
−0.002 |
−0.005 |
0.002 |
0.011 |
— |
|
1983 World Bank |
−0.004 |
−0.001 |
0.001 |
0.009 |
0.022 |
— |
— |
|
1984 U.N. |
0.002 |
0.000 |
−0.004 |
0.002 |
0.011 |
— |
— |
|
1988 World Bank |
0.001 |
0.003 |
0.014 |
0.025 |
— |
— |
— |
|
1990 World Bank |
0.001 |
0.003 |
0.012 |
0.023 |
— |
— |
— |
|
1994 U.N. |
0.003 |
0.009 |
0.017 — |
— |
— |
— |
— |
|
No data. Note: The 1972 World Bank and 1987 U.S. Census Bureau forecasts are left out because the data available do not include reported world totals, which are used in this tabulation. Year 0 is the base year for the forecast, taken to be the year divisible by five preceding the date of the forecast. For example, year 0 for the 1973 U.N. forecast is 1970. |
|||||||
tional error for world projections is small: on average across forecasts, 0.6 percent in 5-year projections, 1.1 percent in 15-year projections, and 1.4 percent in 25-year projections. These estimates are mostly between 5 and 20 percent of equivalent mean country absolute errors (Table B-14).
World projections therefore appear relatively precise. If one instead ran projections by keeping growth rates constant in each country, the absolute proportional error for the world as a whole would be almost nine times as large in 20-year projections. Relative to this simple alternative, the proportionate reduction in error achieved by these forecasts is therefore 90 percent. However, the most recent forecasts introduce a note of caution. Projections to 1995 and 2000 appear less precise than projections to earlier years. This requires some further attention to disentangle the effect of target year from the length effect and to explain the deterioration.
The effects of target year and projection length are different for country projections and world projections. Figure B-14 shows this by comparing mean country proportional error and world proportional error, using only those forecasts that include most countries (leaving out, i.e., the early 1970s forecasts and the 1987 U.S. Census Bureau forecast). Mean country proportional error rises with projection length, as has already been shown, and although it may also rise as target years shift from 1990 to 1995 to 2000, the latter trend is not entirely consistent.
World proportional error in this figure is calculated by summing pro-
TABLE B-14 Absolute proportional error in projected world population, by forecast, projection length, and target year
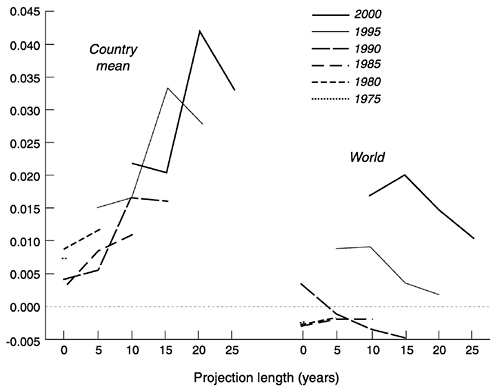
FIGURE B-14 Mean country proportional error and world proportional error, by projection length and target year.
jected country populations and comparing this with current estimates of the total for the same group of countries (unlike the two previous tables, which used the reported world totals). In contrast to mean country proportional error, world proportional error shows no increase by projection length, and possibly a small decrease. It does however increase fairly clearly from 1990 to 1995 to 2000 at every projection length, indicating that world population in the 1990s became increasingly difficult to project.
Explaining Increased Error
The increase in world absolute error in the 1990s is not explained by an increase in average country error. Figure B-14 shows no consistent increase in average country error by target year, and weighting these means by population size does not alter the conclusion. Instead, world absolute error has increased because country errors offset each other to a more limited extent. To show this, we calculate the proportion of unoffset error (u) as
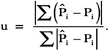
Entirely random errors would be as often negative as positive, and, in a large sample, u would be close to zero. However, consistently positive (or consistently negative) errors across countries would make u equal to one.
Figure B-15 shows, first, that unoffset error is fairly high for base estimates and short projections and declines with longer projections. Errors in initial parameters appear nonrandom, but errors in longer projections by contrast tend not to reflect any consistent bias. More critically for present purposes, the figure also shows that unoffset error increases from 1990 to 1995 to 2000, although for earlier target years no trend can be confirmed. Unoffset error therefore appears to be the likely explanation for the increase in world projection error as target years move from 1990 to 2000.
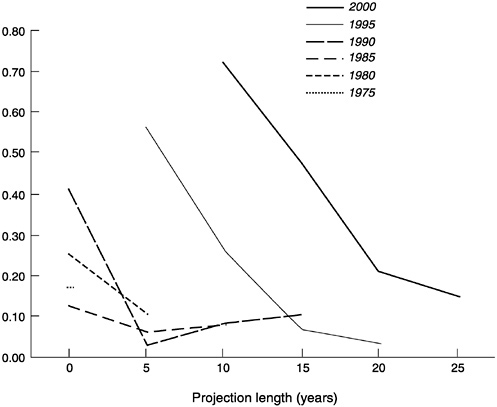
FIGURE B-15 Proportion of country error unoffset in world projections across six exercises, by projection length and target year.
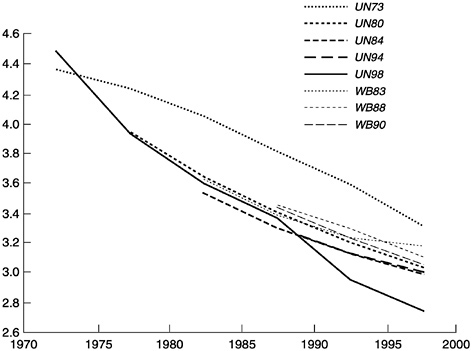
FIGURE B-16 World total fertility rate in various forecasts, by target period.
NOTE: UN stands for the U.N. Population Division and WB for the World Bank, with the following digits indicating forecast date.
Fertility and Mortality
One possible reason why errors in country projections might increasingly be going in a single direction is that too-high fertility might have been projected, both among high-fertility and low-fertility countries. Figure B-16 examines this possibility. Projected trends in total fertility are compared with the estimated trend from the 1998 U.N. forecast. The forecast from the 1970s (the 1973 U.N. forecast) was off almost from its inception. Forecasters in the 1970s appear to have missed the sharp acceleration of fertility decline in that period, almost entirely attributable to China. Using population-weighted total fertility rates, one can estimate that almost 60 percent of fertility decline between 1965-1970 and 1970-1975 took place in China. This is equivalent to over 80 percent of fertility decline in the developing regions in this period. This is even more remarkable because so many other large developing countries actually contributed to an increase in world fertility, either because their fertility rose (e.g., Bangladesh, the Democratic Republic of the Congo) or because fertility decline was small and offset by population increase (e.g., India, Nigeria).
Most of the projected trends in post-1970s forecasts in Figure B-16 are fairly close together. They all differ, however, from the currently estimated trend, which shows a fairly sharp dip around 1990. Whereas fertility decline in the world as a whole appeared to be leveling off in the late 1980s, by the early 1990s it accelerated again, and all these forecasts missed the turning point.
Why did fertility decline accelerate? Perhaps more countries unexpectedly started fertility transition, or fertility declined more rapidly in midtransition developing countries, or fertility declined unexpectedly in industrial countries. To evaluate such possible explanations, total-fertility change in each country was estimated between 1985-1990 and 1990-1995, weighted by population size. Three-fourths of the total weighted change was in the negative direction. The bulk of the total negative change was accounted for by just four countries: China (36 percent of total negative change), Bangladesh (12 percent), India (9 percent), and Russia (7 percent).
Fertility error might not be the complete explanation for increasing error in projections to the 1990s, however, and mortality error is also worth investigating. Mortality appears to have reached a similar turning point around 1990, with progress in life expectancy moderating somewhat around that date (Figure B-17). However, the effect on projection accuracy is ambiguous, since some forecasts projected higher life expectancy and some projected lower life expectancy. This turning point in mortality, therefore, made some forecasts look slightly better and others look slightly worse, unlike the turning point in fertility around 1990, which made them all look bad.
SUMMARY AND DISCUSSION
To summarize the results for world projections first, we note that the error in projected world population is small, less than 1 percent (on average across various forecasts) in projections as long as 20 years. The error seems to be larger, however, for projections to the years 1995 and 2000. Projections to these years have been consistently too high.
The explanation lies in fertility trends since 1990. World fertility declined sharply, around that date, at a faster rate than in the previous decade. Four countries—China, Bangladesh, India, and Russia —accounted for the largest part of this fertility decline. While the decline might represent the start of a new era of faster fertility decline, it could as well reflect highly particular circumstances affecting these specific countries.
To interpret projection error, therefore, it is useful to look at the errors for specific countries. Country population projections have been assessed
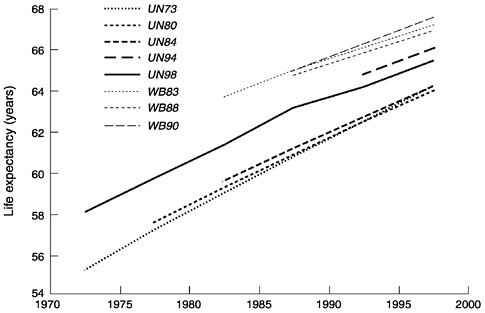
FIGURE B-17 World life expectancy in various forecasts, by target period.
NOTE: UN stands for the U.N. Population Division and WB for the World Bank, with the following digits indicating forecast date.
from nine forecasts dated from 1972 to 1994, each forecast covering most of the world population. The scale of projection errors and the reasons for them are summarized here.
Projection Error and Its Explanation
Proportional error in either direction in projected country populations ranges from 5 percent, in 5-year projections, to 17 percent, in 30-year projections. When countries are aggregated, errors tend to cancel each other out, so that, although projections have been biased upward, the average bias is more modest at 1 to 6 percent over projections of 5 to 30 years.
This slight upward bias appears across forecasts, which were all assessed against the current 1998 U.N. historical estimates. Some bias in these historical estimates is of course also possible but cannot be assessed and is unlikely to be the complete explanation.
Projection error has three broad types of explanations. First, the base demographic estimates from which the projection starts may be wrong, producing subsequent errors. The base population may be misestimated, as may be the base levels of fertility, mortality, and net migration. Errors
in each of these factors have been shown to be related to error in projected population. What causes such errors? Two possibilities appear to have some empirical support. On one hand, countries that have received less careful attention—in these world projections, smaller populations of less than 1 million people—are more likely to be assigned erroneous base estimates of population, net migration, and mortality (though not necessarily fertility). On the other hand, where there is more scope for error, error is more likely. Countries with more births, more deaths, and more net migrants have on average larger errors in base estimates.
The second major explanation for projection error is misspecified trends in component rates, which produce increasing error as projections lengthen. Long projections have substantially more error than short projections. When projections reach 30 years in length, 1 out of 4 will be off by at least 20 percent and 1 out of 10 by at least 40 percent. A misspecified component rate can cause increasing error in projected population as a projection lengthens, and in addition projected levels of fertility and mortality become increasingly poorly specified.
The third major explanation for projection error is unexpected events that substantially alter demographic prospects. Extreme events of this type, labeled demographic quakes, have been identified from changes in population growth rates, between successive 5-year periods, of at least 2.5 percentage points. Since the 1970s, the majority of such events have been associated with substantial and sudden flows of migrants. Some events have also been associated with mortality crises. Demographic quakes double or triple the error in projected population.
The relative importance of these three major explanations is difficult to directly assess, but one can compare instead the importance of error in base population, fertility, mortality, and migration. Error in base population is the predominant explanation for error in shorter projections but declines in importance as one looks at longer projections. Fertility error and migration error (including here base error in these component rates) are roughly comparable in importance, but fertility error increases with longer projections, whereas migration error does not. Mortality error also contributes but is of lesser importance, probably because the pace of progress in extending life expectancy has been more predictable than the pace of fertility change or the levels of migration in the last few decades.
Projection errors vary by region, for all the reasons just considered. Projections for countries of the Middle East and North Africa have on average the most error. The reasons are straightforward: base population estimates have been worse for these countries generally than for countries in other regions, and fertility, mortality, and migration—the last one especially—have each been projected more poorly for this region than for others. These factors almost entirely explain the poorer projections.
Projections for Sub-Saharan countries are distinctive in a different way. Several aspects of these projections have fairly high levels of error, but the errors tend to offset. Base population error, to begin with, is substantial, but appears to go in both directions, so that country populations are neither systematically over- or underestimated. Mortality has been systematically underprojected for this region and accounts for proportionally more error in projected population than in other regions. This may be due to slower than expected economic progress, lagging development of health care systems, or the HIV/AIDS epidemic, or to all three factors combined, but this analysis was not designed to test such explanations. Note that fertility has been slightly underprojected (unlike the average country in every other region), offsetting the mortality error. Sub-Saharan countries have had a larger number of deaths and births than the typical projection has shown, experiencing greater population turnover but not much faster or slower growth than projected.
The populations of industrial countries appear to be more accurately projected than the populations of developing countries. Better data may be a factor in this, as may lower levels of fertility and mortality, from which only smaller deviations are possible. However, gains in life expectancy have been underestimated, as have net migrants.
Unresolved Issues
This analysis has not been limited to countries with good criterion data. In principle such a limitation might have been the conservative choice, given the possibility that errors for countries with poorer criterion data might escape detection. However, initial tabulations for countries with and without a census in the 1990s—a possible operationalization of good criterion data—showed contradictory results. Projections for countries without such a census had relatively less bias but greater absolute error. Attempting to impose the more stringent standard that good criterion data ordinarily imply would therefore have led to underestimates, not overestimates, of projection error. Whether projection results for countries with poorer data really are more variable and less precise, as they appear to be, awaits further clarification once their demographic histories can be more reliably ascertained.
Differences in the accuracy of projections from different agencies have also not been clarified. The criterion data available were only from the U.N. These data may differ substantially from the historical estimates underlying projections from other sources, just as contemporaneous population estimates have differed in the past. Obtaining historical data from other sources may clarify the situation. Even better, of course, would
be an independently reviewed set of historical estimates, but producing such a set for the whole world is a considerable enterprise.
Looking at forecasts over time, regardless of their source, suggests that, with other factors controlled, 1990s forecasts have been slightly better than earlier ones. This needs some verification. The 1998 criterion data could have been contaminated, in a sense, by expectations based on the fairly recent 1990s forecasts—but whether this is true or not, and how serious an issue it is, cannot be determined. Some data also suggest that population projections to the mid-1980s were worse than for other periods. Whether this is true, and what factors could have been responsible, cannot be conclusively determined.
Improving Projections
One important conclusion deals less with how projections can be improved than with how they can be better utilized. Clearly, users should be more aware of the limits to the accuracy of long-term projections. Perhaps, as occasionally suggested, projections should not be made at all for periods longer than a few decades, given the increasing error in longer projections. Others argue, however, that longer projections are useful to make concrete the implications of various demographic assumptions. This issue cannot be resolved here. What does seem worth arguing for, however, is greater effort at providing users with an appreciation of potential error, especially in longer projections.
Aggregated projections, interestingly enough, appear to be considerably more precise. Whereas country projections are off in either direction by 12 percent on average after 20 years, world projections are off by only 1 percent after that period. One implication is that the careful country-by-country work performed by the agencies whose projections have been considered helps in producing more accurate aggregate estimates, even if the country projections themselves have substantial error. Producing aggregate projections directly, as is done in some other cases, is a less desirable exercise if these regional projections are no more accurate than typical country projections. There could conceivably even be some advantage in producing, where feasible, subnational projections, especially for large and heterogeneous countries.
A fairly direct way to improve projections is to improve base demographic estimates. Base estimates are responsible for much projection error, especially in the short term, when projection results are most useful for planning. Base estimates for population, age structure, and component rates can be improved, in general, through better data from censuses, surveys, and vital registration and through improved methods of estimating demographic parameters. Of the world population, 20 percent have
not been covered by a census in the 1990s. So while small countries are particularly subject to error in base population and base net migration rates, better data could affect projections for an important portion of world population.
More accurate projections of component trends could also improve projections, particularly longer ones. Accuracy may improve naturally, as high levels of fertility and mortality become less common, reducing the scope for error. Since long projections are more problematic, sufficient attention should be paid to long-term levels of fertility and mortality to ensure that they are determined from the best available research.
Overall, past forecasts appear to have underprojected demographic progress, assuming too slow a decline in both fertility and mortality —except in Sub-Saharan Africa, where demographic progress has been overprojected. This was still true for fertility in the most recent forecasts that could be examined, but was no longer true for mortality. Whether this weakness in procedures still obtains today cannot be determined, but procedures should be reviewed to ensure it does not.
For migration, improvements are difficult to prescribe. Over the period studied, projections would have been more accurate with slightly more net immigration into industrial countries. One cannot be certain, however, whether this pattern will continue, subject as it is to political decisions and controls.
Migration is heavily implicated in the majority of demographic quakes, and what to do about these is a vexing problem. Successful prediction of such quakes seems unlikely at present. What one might hope for is that such quakes become less common, as countries become more stable and emergency support systems more effective. When such quakes do occur, obviously, one needs to discount past projections and to prepare new ones as soon as feasible. Rapid updating may be the best that can be recommended and would also contribute in relation to the problem of base error. Providing new projections as soon as better base data become available is one way to limit any damage that may be done by inaccurate projections.
REFERENCES
Arnold, F. 1989 Revised Estimates and Projections of International Migration, 1980-2000 . Policy, Planning, and Research Working Paper 275. World Bank, Washington, D.C.
Bos, E., P.W. Stephens, M.T. Vu, and R.A. Bulatao 1991 Africa Region Population Projections; Asia Region Population Projections; Latin America and the Caribbean Region Population Projections; Europe, Middle East, and North Africa Region Population Projections, 1990-91 Edition. Policy, Research, and External Affairs Working Papers 568-601. World Bank, Washington, D.C.
Jamison, E., P.D. Johnson, and R.A. Engels 1987 World Population Profile: 1987. Washington, D.C.: U.S. Census Bureau.
Keilman, N. 1998 How accurate are the United Nations world population projections? Population and Development Review 24(Supplement):15-41.
Keyfitz, N. 1981 The limits of population forecasting. Population and Development Review 7(4):579-593.
McDevitt, T. 1999 Knowledge-Based Population Projections: New Statistical Evidence and a Word on Making Projections under Real World Conditions. Poster presented at the Population Association of America meetings, New York, March.
Sanderson, W.C. 1998 Knowledge can improve forecasts: A review of selected socioeconomic population projection models. Population and Development Review 24(Supplement):88-117.
Stoto, M.A. 1983 The accuracy of population projections. Journal of the American Statistical Association 78(381):13-20.
Tayman, J., and D.A. Swanson 1996 On the utility of population forecasts. Demography 33(4):523-528.
United Nations (U.N.) 1977 World Population Prospects as Assessed in 1973. New York: United Nations.
1982 Demographic Indicators by Country: Estimates and Projections as Assessed in 1980. New York: United Nations.
1987 Global Estimates and Projections of Population by Sex and Age: The1984 Assessment. New York: United Nations.
1994 The Sex and Age Distribution of the World Populations: The 1994 Revision . New York: United Nations.
1999 World Population Prospects: The 1998 Revision, Vol. 1, Comprehensive Tables. New York: United Nations.
Vu, M.T., and K.C. Zachariah 1983 Short-Term Population Projection, 1980-2020 and Long-Term Projection, 2000 to Stationary Stage by Age and Sex for All Countries of the World. Policy and Research Unit, Population, Health and Nutrition Department [World Bank, Washington, D.C.].
Vu, M.T., E. Bos, and R.A. Bulatao 1988 Africa Region Population Projections; Asia Region Population Projections; Latin America and the Caribbean Region Population Projections; Europe, Middle East, and North Africa Region Population Projections, 1988-89 Edition. Policy, Planning, and Research Working Papers 114-117. World Bank, Washington, D.C.
Wheeler, D. 1984 Human Resource Policies, Economic Growth, and Demographic Change in Developing Countries. Oxford, Eng.: Clarendon Press.
Zachariah, K.C., and R. Cuca [ 1972] Population Projections for Bank Member Countries 1970-2000. Development Economics Department, International Bank for Reconstruction and Development [ Washington, D.C.].
Zlotnik, H. 1999 World Population Prospects: The 1998 Revision. Paper prepared for the Joint ECE-Eurostat Work Session on Demographic Projections, Perugia, Italy, May 3-7.


